 Jarno Honkanen1
 Arja Vuorela1
 Daniel Muthas2Laura Orivuori1
 Kristiina Luopajärvi3
 Mysore Vishakante Gowda Tejesvi4
 Anton Lavrinienko4,5
 Anna Maria Pirttilä4Christopher L. Fogarty1Taina Härkönen3,6
 Jorma Ilonen7
 Terhi Ruohtula1
 Mikael Knip3,6
 Janne J. Koskimäki4†
 Outi Vaarala1*†
- 1Clinicum, Faculty of Medicine, University of Helsinki, Helsinki, Finland
- 2Translational & Experimental Medicine, Early Respiratory, Inflammation and Autoimmunity, BioPharmaceuticals R&D, AstraZeneca, Gothenburg, Sweden
- 3Children's Hospital, University of Helsinki and Helsinki University Hospital, Helsinki, Finland
- 4Ecology and Genetics Research Unit, University of Oulu, Oulu, Finland
- 5Department of Biological and Environmental Science, University of Jyväskylä, Jyväskylä, Finland
- 6Research Program for Clinical and Molecular Metabolism, Faculty of Medicine, University of Helsinki, Helsinki, Finland
- 7Immunogenetics Laboratory, University of Turku, Turku, Finland
Although gut bacterial dysbiosis is recognized as a regulator of beta-cell autoimmunity, no data is available on fungal dysbiosis in the children at the risk of type 1 diabetes (T1D). We hypothesized that the co-occurrence of fungal and bacterial dysbiosis contributes to the intestinal inflammation and autoimmune destruction of insulin-producing beta-cells in T1D. Fecal and blood samples were collected from 26 children tested positive for at least one diabetes-associated autoantibody (IAA, GADA, IA-2A or ICA) and matched autoantibody-negative children with HLA-conferred susceptibility to T1D (matched for HLA-DQB1 haplotype, age, gender and early childhood nutrition). Bacterial 16S and fungal ITS2 sequencing, and analyses of the markers of intestinal inflammation, namely fecal human beta-defensin-2 (HBD2), calprotectin and secretory total IgA, were performed. Anti-Saccharomyces cerevisiae antibodies (ASCA) and circulating cytokines, IFNG, IL-17 and IL-22, were studied. After these analyses, the children were followed for development of clinical T1D (median 8 years and 8 months). Nine autoantibody positive children were diagnosed with T1D, whereas none of the autoantibody negative children developed T1D during the follow-up. Fungal dysbiosis, characterized by high abundance of fecal Saccharomyces and Candida, was found in the progressors, i.e., children with beta-cell autoimmunity who during the follow-up progressed to clinical T1D. These children showed also bacterial dysbiosis, i.e., increased Bacteroidales and Clostridiales ratio, which was, however, found also in the non-progressors, and is thus a common nominator in the children with beta-cell autoimmunity. Furthermore, the progressors showed markers of intestinal inflammation detected as increased levels of fecal HBD2 and ASCA IgG to fungal antigens. We conclude that the fungal and bacterial dysbiosis, and intestinal inflammation are associated with the development of T1D in children with beta-cell autoimmunity.
Introduction
Type 1 diabetes (T1D) is an immune-mediated disease in which autoimmune mechanisms are considered to be responsible for the destruction of insulin-producing pancreatic beta cells. While the triggers of the disease process remain open, the development of local inflammation in the pancreatic islets and formation of autoantibodies against beta-cell antigens are early events in the development of T1D (1–4). Autoantibodies emerge against various beta-cell antigens, such as insulin, glutamate decarboxylase, islet antigen 2, and zinc transporter 8, several years before the clinical disease manifestation, and the risk of T1D correlates with the number of beta-cell autoantibodies. Other immunological aberrancies in T1D include up-regulation of IFNG and IL-17 pathways (5–9). We have previously shown that children with beta-cell autoimmunity have a decreased abundance of butyrate-producing bacteria and an increased abundance of bacteria belonging to the phylum Bacteroidetes in their gut microbiota (10, 11). Similar alterations in the bacterial community in children with beta-cell autoimmunity have been confirmed in several later studies (12–14). Intestinal inflammation has been associated with T1D as demonstrated by up-regulated expression of HLA class II molecule and cytokines IFNG, TNFA and IL-4 mRNA in jejunal biopsies (15).
The role of gut microbiota as a regulator of autoimmune diabetes is well-established in animal models of T1D, in which modulation of the microbiota affects the disease development (16). To date, the studies of the microbiome in relation to T1D have focused on the bacterial community of the gut microbiota, however, human microbiome is a complex ecosystem composed of bacteria, fungi, archaea, and viruses. Several fungal species have been identified in the human gastrointestinal tract (17, 18), representing 0.1–1.0% of the intestinal microbiota (commonly referred to as mycobiota). The fungal cells are outnumbered by the bacterial ones, but as eukaryotic organisms, fungi have substantially more diverse biochemical pathways than bacteria (19). Thus, when the bioactive capacity of the intestinal microbiota is considered, the role of mycobiota is of major importance with a remarkable potential to modulate host cellular functions. That said, the current knowledge of the involvement of mycobiota in the perturbations of the microbial communities and host health is limited. The role of mycobiota as a regulator of intestinal inflammation and inflammatory diseases has been emphasized by recent studies in inflammatory bowel disease, allergy, and asthma (20–22).
Moreover, the changes in the bacterial microbiota may be linked to the alterations of the mycobiota, which are likely disrupting the interkingdom interactions within the microbiome, as seen in Crohn's disease (21, 22). Indeed, intestinal mycobiota can modulate the composition of the bacterial compartment either by direct interactions with bacteria, or via the immune system of the host (18, 23).
In the current study, we analyzed the composition of the fungal and bacterial gut microbiota, as well as markers of intestinal inflammation, in a cohort of islet autoantibody positive and negative children carrying HLA-conferred genetic susceptibility to T1D. We then followed the cohort for the development of T1D for median of 8 years and 8 months. Combining the fungal and bacterial data, the children with genetic risk of T1D were grouped into three major clusters defined by the relative abundance of Saccharomyces, Clostridiales, and Bacteroidales (Firmicutes and Bacteroidetes phyla, respectively). An increased ratio of Bacteroidales to Clostridiales was found in autoantibody positive children while the children who during the follow-up also progressed to clinical T1D, showed high abundance of Saccharomyces and Candida, as well as signs of intestinal inflammation, i.e., increased levels of fecal HBD2 and circulating ASCA IgG. Our results indicate that dysbiosis of fungal and bacterial gut microbiota as well as intestinal inflammation are associated with the development of T1D.
Materials and Methods
Study Subjects
Experimental design of the current study is presented in Figure 1. Here we collected fecal and blood samples from 52 children with HLA-conferred susceptibility to T1D (Table 1) and followed them for the development of T1D for a median of 8 years and 8 months (range 8 years and 2 months−9 years and 1 month). The children studied for fecal microbiome were recruited from the participants of the nutritional intervention studies (24–26). We identified 26 children tested positive for at least one T1D-associated autoantibody (IAA, GADA, IA-2A, or ICA) (cases), and selected autoantibody-negative healthy control children matched for age, sex, HLA-DQB1 genotype and early life nutrition. At the start of the follow-up, fecal samples were collected (between February 2009 and February 2010) using stool collection vials and immediately stored in home freezers (−20°C). The frozen samples were delivered to the study center, and the samples were stored at −80°C until processing. At the time of fecal sample collection, the study subjects did not have gastroenteritis and had not received antibiotic treatment during the past 3 months. Nine children developed T1D during the follow-up. The control children remained non-diabetic and negative for all four autoantibodies analyzed. The study was approved by the ethics committees of the participating hospitals and the families and/or the children taking part in the study gave their written informed consent.
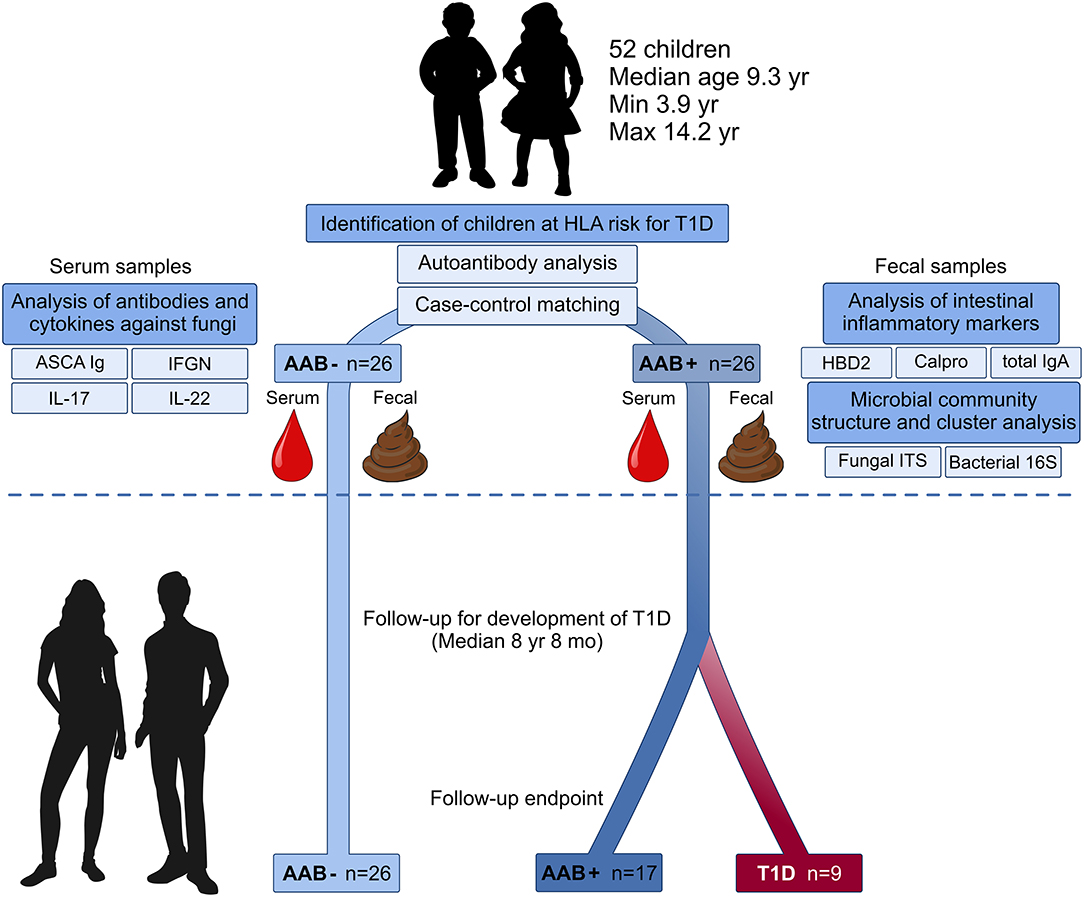
Figure 1. Study design: Microbiome composition, intestinal inflammation and the development of clinical type 1 diabetes (T1D) during the follow-up. Fecal and blood samples were collected from 26 children tested positive for at least one diabetes-associated autoantibody (IAA, GADA, IA-2A, or ICA) and matched autoantibody-negative children with HLA-conferred susceptibility to T1D. Case-control pairs were matched for HLA-DQB1 haplotype, age, gender, and early childhood nutrition. Bacterial 16S and fungal ITS2 sequencing and analyses of the markers of intestinal inflammation, namely HBD2, calprotectin, and secretory total IgA, were performed using fecal samples. Blood samples were analyzed for the levels of ASCA IgA/IgG and circulating cytokines IFNG, IL-17, and IL-22. After the analyses, the children were followed for development of clinical T1D (median 8 years and 8 months). During the follow-up nine autoantibody-positive children were diagnosed with T1D, whereas none of the autoantibody-negative children developed T1D.
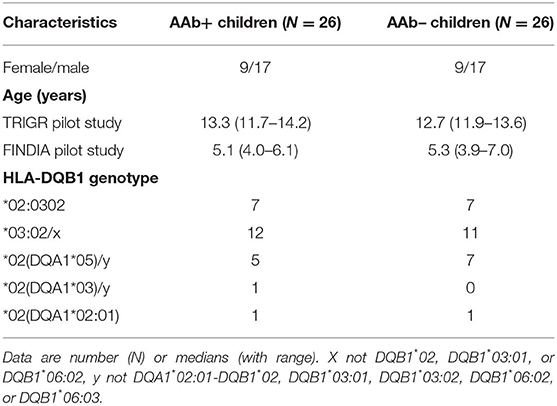
Table 1. Characteristics of the study subjects. AAb+ are children positive for at least one diabetes-associated autoantibody and AAb- children are negative for beta-cell autoantibodies. The study subjects were participants in the TRIGR and FINDIA pilot studies.
Autoantibody Assays
Biochemically defined autoantibodies IAA, IA-2A, and GADA were analyzed with specific radio-binding method and ICAs with standard immunofluorescence method as previously described in (24–26). The cut-off levels used were 2.80 relative units (RU) for IAA, 5.36 RU for GADA and 0.78 RU for IA-2A determined as the level above 99 percentiles in more than 350 non-diabetic Finnish children. Islet cell antibodies were measured using an indirect immunofluorescence method using a cut-off value of 2.5 Juvenile Diabetes Foundation units.
HLA Genotyping
Screening of HLA-risk alleles was performed as previously described (24–26). The initial HLA-DQB1 typing for risk-associated (DQB1*02, DQB1*03:02) and protective (DQB1*03:01, DQB1*06:02, and DQB1*06:03) alleles was complemented with DQA1 typing for DQA1*02:01 and DQA1*05 alleles in those with DQB1*02 without protective alleles or the major risk allele DQB1*03:02.
DNA Extraction
DNA was extracted from fecal samples by using QIAamp Fast DNA Stool Mini Kit (Qiagen, Germany). In short, fecal samples (180–220 mg) were thawed in 1 ml of InhibitEX Buffer, vortexed for 1 min and incubated at 95°C for 10 min to enhance the lysis of hard-to-lyse taxa. After centrifugation, 200 μl of the supernatant was transferred to a new tube with proteinase K and Buffer AL and vortexed thoroughly. The lysate was incubated at 70°C for 10 min followed by addition of 0.3 vol. of absolute ethanol. Then, samples were vortexed, pipetted to the QIAamp spin column and centrifuged at 20,000 × g for 1 min. The column was washed with AW1 and AW2 Buffers, and the pure DNA was eluted in 200 μl of Buffer ATE and stored at −20°C. The quantity and quality of DNA was determined by using NanoDrop ND-1000 spectrophotometer (Thermo Fisher Scientific, Wilmington, DE, USA).
Amplification of Bacterial 16s rRNA and Fungal ITS2 Region
The bacterial hypervariable regions V4-V5 of 16S rRNA gene were amplified using primers F519 (5′-CAGCMGCCGCGGTAATWC-3′) and R926 (5′-CCGTCAATTCCTTTRAGTTT-3′). The F519 primer contained an Ion Torrent pyrosequencing adapter sequence A (Thermo Fisher Scientific, USA), 9-bp unique barcode sequence and one nucleotide linker. The R926 primer contained an Ion Torrent adapter trP1 sequence. For fungal analysis, the ITS2 region was amplified using fITS7 (5′-GTGARTCATCGAATCTTTG-3′) and ITS4 (5′-TCCTCCGCTTATTGATATGC-3′) primers including the Ion Torrent pyrosequencing adaptor with a 10-bp barcode sequence to the ITS4 primer (27). PCR reactions were performed in three replicates, each containing 1x Phusion GC buffer, 0.4 μM of forward and reverse primers, 200 μM dNTPs, 0.5 U of Phusion High-Fidelity DNA Polymerase (Thermo Fisher Scientific) and 50 ng of genomic community DNA as the template and molecular grade water in a total reaction volume of 50 μl. For the bacteria, PCR cycling conditions were as follows: initial denaturation at 98°C for 3 min, 35 amplification cycles of 98°C for 10 s, 64°C for 10 s, and 72°C for 20 s, followed by a final extension step of 72°C for 7 min. For the fungi, the annealing temperature was adjusted to 56°C, while other PCR cycling conditions were kept unchanged. After the amplification, PCR products from the pooled triplicate reactions were purified with Agencourt AMPure XP beads (Agencourt Bioscience, MA, USA) and quantified with Agilent 2,100 Bioanalyzer (Agilent Technologies, CA, USA). The amplicons from each sample were then combined in equimolar concentrations to generate sequencing libraries. Sequencing was performed at Biocenter Oulu Sequencing Center with Ion Torrent PGM System on 316v2 chip using 400 bp chemistry (Thermo Fisher Scientific, USA).
Bioinformatics Analysis
The bacterial and fungal sequencing data were processed using QIIME v.1.9.1 (28). The read data were quality controlled using the usearch quality filter pipeline, thus potential chimeric sequences were identified and removed with uchime (29). After filtering out low-quality and chimeric reads, the bacterial dataset consisted of 1.202 million reads across the 52 samples, with a mean of 23,120 reads per sample. The respective final fungal dataset comprised of 130,000 high-quality, chimera-free reads from the 52 samples, with a mean of 2,501 reads per sample. The sequences were clustered into the operational taxonomic units (OTUs) by a similarity threshold of 97% with usearch (30). Low-abundance OTUs (represented with <5 reads) were removed across the datasets. The taxonomy was assigned using the Greengenes 16S rRNA gene reference database (31) for bacteria (v.13_8) and UNITE ITS database for fungi (2019 release, v.8) (32). Prior to downstream analysis, the bacterial and fungal OTU tables were rarefied to 5,800 and 327 reads/sample, respectively, to avoid biases caused by variation in sequencing depth among samples (33). All the raw sequencing data were deposited in the NCBI-SRA database with an accession number SUB3267498.
We estimated beta diversity using the unweighted and weighted UniFrac distances (as well as non-phylogenetic Bray Curtis dissimilarity) between samples. Both UniFrac metrics incorporate phylogenetic distances between taxa, yet while the unweighted UniFrac compare microbial communities based on the presence/absence information, the weighted UniFrac also consider the differences in taxon abundance (34). Differences in the fungal and bacterial gut microbiota structure among children were visualized by Principal Coordinate analysis (PCoA) using EMPeror (35).
Measurements of Fecal HBD2, Total IgA, and Calprotectin
Thawed fecal samples were mixed with extraction buffer and vortexed thoroughly. Then, the supernatant was collected and stored at −20°C until the analysis of total IgA, HBD2, and calprotectin levels. Total IgA concentrations were analyzed as previously described (36). HBD2 analyses, were performed with a commercial ELISA Kit according to the manufacturer's instructions (Immunodiagnostik AG, Bensheim, Germany). Fecal calprotectin levels were determined using Calprolab calprotectin ELISA test according to the manufacturer's instructions (Calpro AS, Lysaker, Norway).
ELISA Analysis of Serum ASCA IgA/IgG Levels
Serum ASCA IgA and IgG concentrations were analyzed with a commercial ELISA kit according to the manufacturer's instructions (Demeditec, Germany), with the exception that 1:10 dilution of the serum samples were used. The samples below the lower limit of detection (LOD) were given an arbitrary value of 50% of the LOD being 0.5 U/ml for both ASCA IgA and IgG.
Serum Cytokine Analysis
The serum concentrations of IFNG, IL-17A and IL-22 were analyzed using the Milliplex MAP Kit (HTH17MAG-14K) according to the manufacturer's recommendations (Merck-Millipore Corp., Billerica, MA, USA). Quantification of the markers was performed with a Bio-plex 200 Luminex-instrument and Bio-Plex Manager software (Bio-Rad, Sweden). The samples below Minimum detectable concentration (MinDC) DC were given an arbitrary value of 50% of MinDC.
Statistical Analyses
The Graph Pad Prism 6.04 (Graph Pad Inc., La Jolla, California, USA), SPSS 22 (SPSS, Chicago, Illinois, USA) and JMP 13.0.0 statistical softwares were used for the statistical analyses, unless otherwise noted. Non-parametric Mann–Whitney U-test was used for comparisons between two groups. Groupwise comparisons were performed with the Kruskal–Wallis test. The correlations between the variables were analyzed with the non-parametric Spearman correlation test. Fisher's' exact test was used to analyze the distribution of autoantibody-positive children and disease progressors in different clusters. All statistical analyses were performed two-tailed. P < 0.05 was considered statistically significant. Despite of the matching of the autoantibody positive and negative children for age, T1D risk genotype and sex, the pairs were considered independent in the statistical analyses.
For the hierarchical clustering analysis, the relative abundance data was imported into JMP 13.0.0 (SAS Institute Inc. Cary, North Carolina, USA). All abundance values were treated as numerical values and Ward's hierarchical clustering was performed using standardized data with default settings. Statistical significance of samples grouping for beta diversity analysis was determined using the permutational multivariate analysis of variance (PERMANOVA) and the analysis of similarities (ANOSIM) (999 permutations) implemented by the adonis and anosim functions in the vegan R package (37).
Results
Study Design and Clinical T1D During the Follow-Up
In this study, we analyzed the gut microbiome of autoantibody positive and negative children with HLA conferred risk of T1D (Figure 1). We combined sequencing of the (1) bacterial 16S ribosomal RNA (rRNA) gene (2) and fungal internal transcribed spacer 2 (ITS2) region and coupled this with the (3) analysis of the markers of intestinal inflammation, namely fecal HBD2, secretory total IgA, and calprotectin. Blood samples were screened for the levels of ASCA IgA/IgG and circulating cytokines IFNG IL-17 and IL-22. Finally, the children in a cohort were followed for the development of clinical T1D (median of 8 years and 8 months). During the follow-up time, nine autoantibody positive children were diagnosed with T1D, and none of the autoantibody negative children developed T1D or autoantibodies.
Fungal and Bacterial Dysbiosis in Children With Beta-Cell Autoimmunity
The gut mycobiota was composed of two fungal phyla, Ascomycota and Basidiomycota, but was dominated by Ascomycota (average 93%) at the phylum level and by Saccharomyces at the genus level (average 43%) (Figures 2A,B). All 52 study subjects were positive for Ascomycota, and 29 of them (56%) positive for Basidiomycota (11 of 26 autoantibody positive and 18 of 26 negative individuals, 42 and 69%, respectively). Children with autoantibodies had marginally increased abundance of Ascomycota and decreased levels of Basidiomycota (Figure 2A). The most frequently observed genera were Saccharomyces (found in all 52 individuals), Candida (found in 9 of 26 autoantibody positive and 13 of 26 autoantibody negative individuals, 35 and 50%) and Debaryomyces (found in 9 of 26 autoantibody positive and 4 of 26 autoantibody negative individuals, 35 and 15%). Children with autoantibodies had increased abundance of Debaryomyces and decreased abundance of Malassezia (Figures 2B–D). The number of children positive for Debaryomyces or Malassezia was, however, low, and 25.0 and 23.1% of the studied children were positive for Debaryomyces (13/52) and Malassezia (12/52), respectively. The autoantibody-positive children who developed clinical T1D during the follow-up had significantly decreased abundance of genus Verticillium compared to children with or without autoantibodies (Figure 2E). Verticillium positivity was found in 16 of 26 (62%) autoantibody positive and 17 of 26 (65%) autoantibody negative children. We did not observe differences in the number of OTUs between children with or without autoantibodies (Figure 2F). Children who developed T1D had decreased fungal diversity (Shannon) compared to children with multiple autoantibodies (Figure 2G). Principal coordinate analysis based on weighted and unweighted UniFrac distances did not show clear differences between autoantibody-negative and autoantibody-negative children (Supplementary Figures 1C,D). The fungal community composition is consistent with the gut mycobiome communities previously reported for humans (18, 38, 39). List of the most abundant fungal species shared among the autoantibody-negative and positive children is presented in Supplementary Table 1.
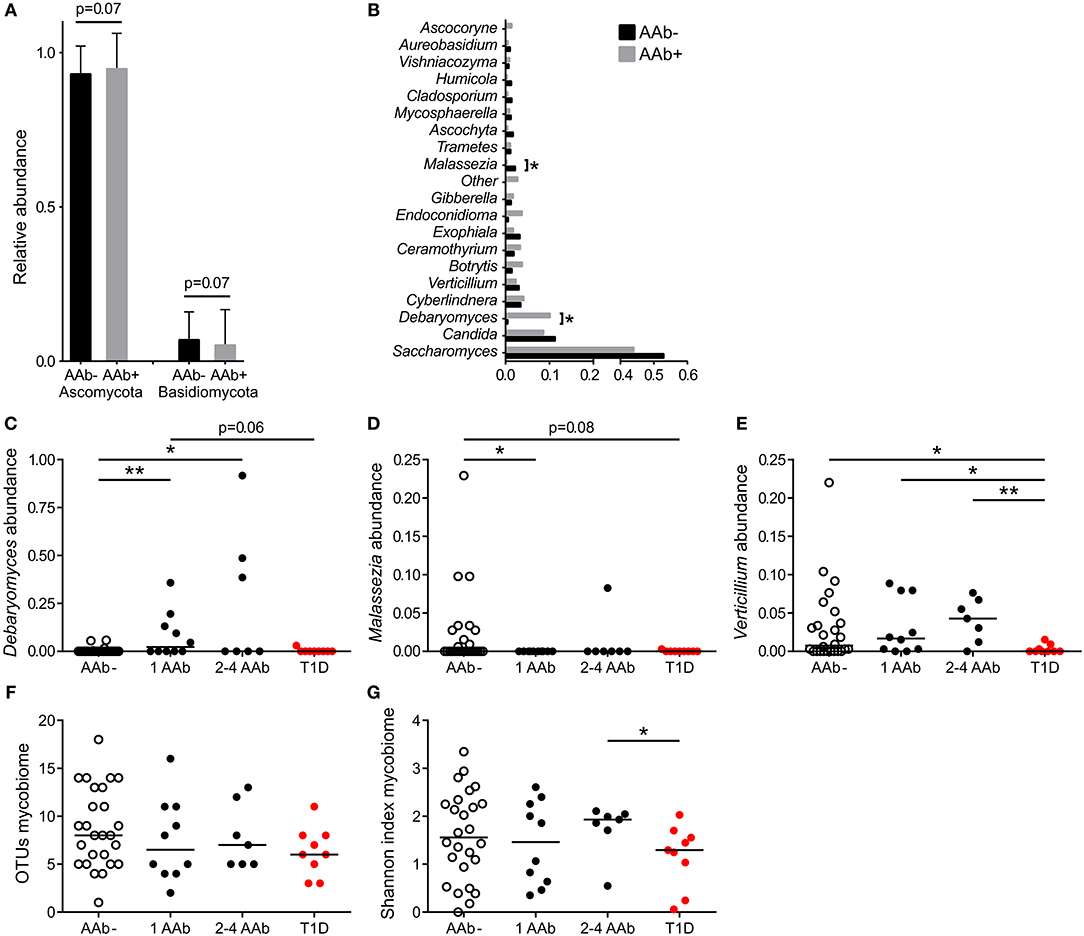
Figure 2. Fungal community characteristics in children with or without T1D-associated autoantibodies. (A) Relative abundance of fungal phyla Ascomycota (left columns) and Basidiomycota (right columns). Children without autoantibodies: black columns and children with autoantibodies: gray columns. (B) Relative abundance of 20 most abundant fungal genera in children with (gray bars) and without autoantibodies (black bars). (C–E) The relative abundances of Debaryomyces (C), Malessezia (D), and Verticillium (E) in healthy children without autoantibodies, in children with a different number of autoantibodies and in children who have progressed from autoantibody-positive state to clinical T1D. (F,G) Number of OTUs and Shannon diversity index in healthy children without autoantibodies, in children with a different number of autoantibodies and in children who have progressed from autoantibody-positive state to clinical T1D. Healthy children without autoantibodies are marked with open circles, children with 1–4 autoantibodies with black circles and children who have progressed to clinical disease with red circle. p-values were calculated with the Mann–Whitney U-test. *p < 0.05, **p < 0.01.
Next, we addressed the whole microbiota and performed a combinational analysis of fungal and bacterial communities. Our hierarchical clustering analysis based on the combined fungal and bacterial data revealed the presence of three major clusters as defined by different combinations of fungi, belonging to the phylum Ascomycota, and the bacterial phyla Bacteroidetes and Firmicutes (Figures 3A–C). The fungal and bacterial community structures differed among children assigned to distinct clusters (p < 0.001, PERMANOVA) (see the Supplementary Table 2). Cluster 1 (n = 17, 33%) was characterized by high abundance of Clostridiales and low abundance of Bacteroidales in combination with high abundance of Saccharomyces (Figures 3B,C and Supplementary Figure 2A). Conversely, Clusters 4 (n = 22, 42%) and 5 (n = 8, 15%) were characterized by high abundance of Bacteroidales and low abundance of Clostridiales, and Cluster 4 also showed high abundance of Candida compared to Cluster 1 (Figures 3B,C and Supplementary Figure 2B). Although, abundance of Ascomycota was high in Clusters 1 and 4, the abundance of Saccharomyces and Candida differed significantly between the clusters (Figure 3B, Supplementary Figures 2A,B and Supplementary Tables 2, 3). Relative abundances of Debaryomyces, Malassezia and Verticillium in Clusters 1, 4 and 5 are shown in Supplementary Figures 2C–E. The relative abundances of Saccharomyces and Candida in children with or without autoantibodies are shown in Supplementary Figures 2F,G. Analysis of similarities of fungal and bacterial communities between different clusters, revealed that Clusters 4 and 5 differed from Cluster 1 for both fungal and bacterial communities (Supplementary Table 3). Host gender had no statistically significant (p > 0.05, PERMANOVA) explanatory effect on the fungal and bacterial communities (Supplementary Table 2). Children age and HLA-risk class made a statistically significant contribution to the total variation in the bacterial community (p = 0.02, R2 = 0.08, p < 0.001, R2 = 0.14, for the host age and HLA-risk class, respectively), albeit with a relatively low coefficient of determination, and non-significant (p > 0.05) contribution of both factors to the mycobiome community structure (Supplementary Table 2).
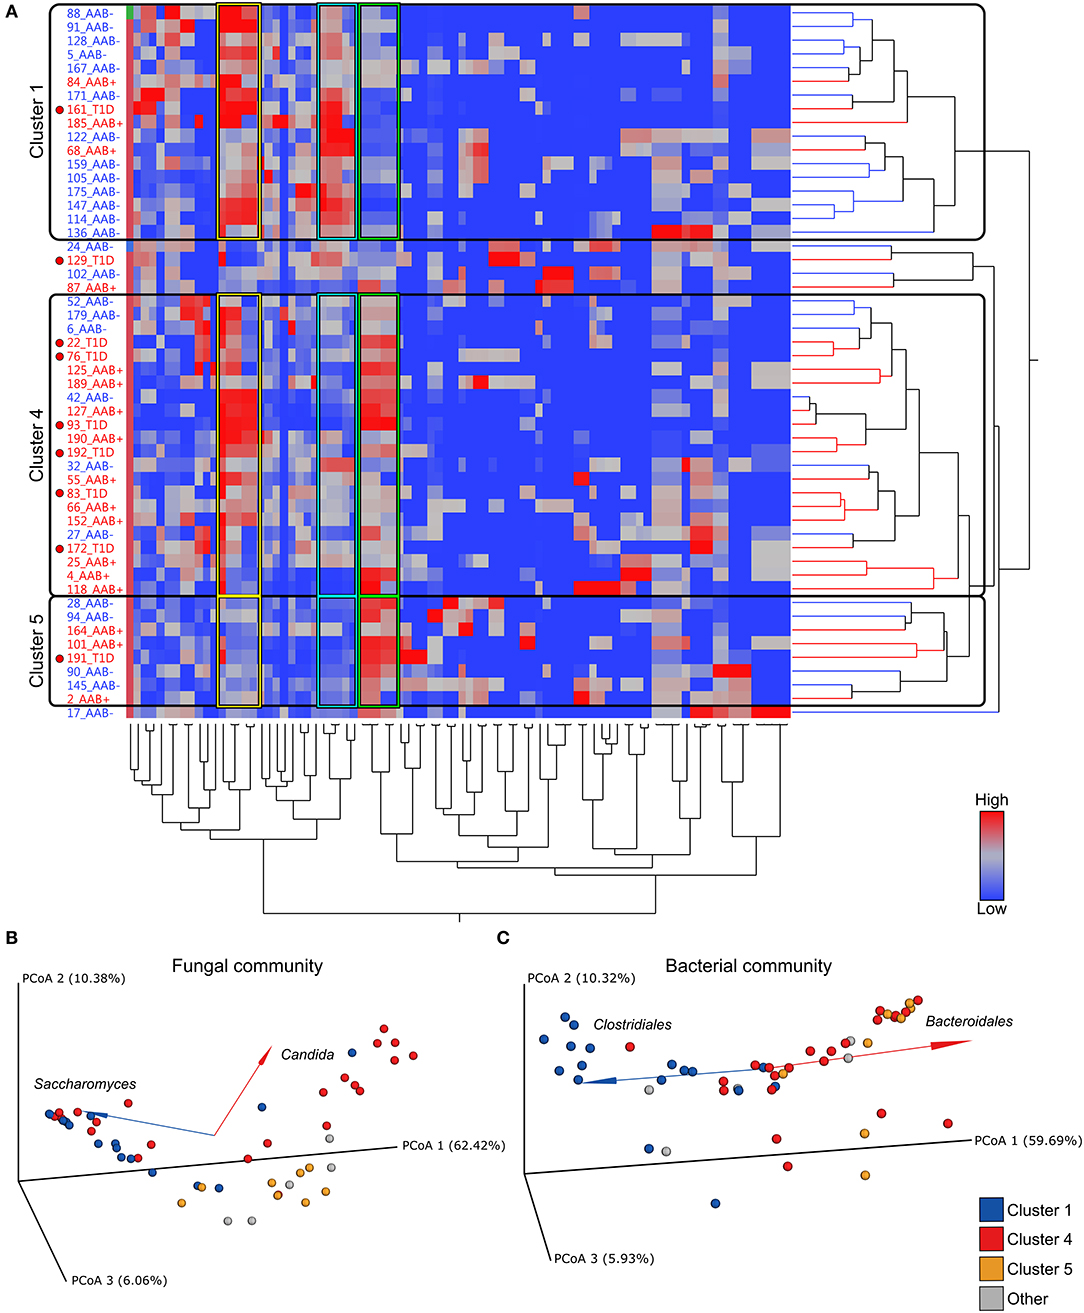
Figure 3. Hierarchical clustering over bacterial and fungal taxa and PCoA plots of fungal and bacterial communities. (A) Heatmap showing the clustering of the relative abundances. The clustering resulted in three major clusters (Clusters 1, 4, and 5) defined by differential abundance of fungi belonging to the phylum Ascomycota and the bacterial phyla Firmicutes and Bacteroidetes. Clusters 1, 4, and 5 are encircled with black borders. In the heatmap children with autoantibodies are denoted with AAb+ (red font) and autoantibody-negative children with AAb (blue font). Children who have progressed from autoantibody-positive state to clinical disease are denoted with T1D and a red circle in the heatmap. Color intensity of the heatmap increases with the taxa relative abundance from low (blue) to high (red). (B,C) Principal coordinate analysis (PCoA) biplots (incorporate taxonomy information) on weighted UniFrac distances between the fungal (B) and bacterial (C) gut microbial communities profiles of children at risk of the type 1 diabetes development. Each point represent a single sample and is colored according to the major taxa clusters (Clusters 1, 4, 5, and other), as defined by the hierarchical clustering analysis. Order and genus-level taxonomy displayed by biplot arrows illustrates that the abundance of (B) the Saccharomyces and Candida contribute to the separation of Cluster 1 and Cluster 4, and (C) Clostridiales and Bacteroidales contribute to the distinct clustering patterns of Cluster 1 in comparison to Clusters 4 and 5. p-values were calculated with the Mann–Whitney U-test. *p < 0.05, **p < 0.01. Grouping significance was determined using the PERMANOVA (999 permutations) with the adonis function in the vegan R package (p < 0.001).
Next, we analyzed the distribution of autoantibody positive and negative children in these three major microbiome clusters. The children with beta-cell autoimmunity were enriched in Clusters 4 and 5 (Cluster 1 vs. Cluster 4, p = 0.004, Cluster 1 vs. Cluster 5, p = ns and Cluster 4 vs. Cluster 5, p = ns, Fisher's exact test), while the children negative for beta-cell autoimmunity, and thus considered healthy children, were enriched in Cluster 1 (shown in Figure 3A and in Table 2). By the end of the follow-up, 6 out of 22 children in Cluster 4 (27%) had developed T1D, one of eight children in Cluster 5 (13%), and just one of 17 children in Cluster 1 (6%) were diagnosed for T1D (Cluster 4 vs. 5, p = 0.64 and Cluster 4 vs. 1, p = 0.11, respectively). One child who was not assigned in any of the three major clusters developed T1D.
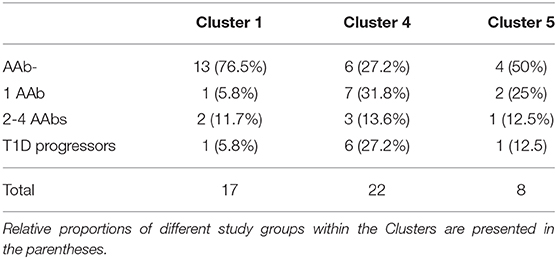
Table 2. Distribution of autoantibody-negative children, children with one or multiple autoantibodies and disease progressors in the different Clusters.
Intestinal Inflammation in Children With Fungal and Bacterial Dysbiosis
To address the relation between the composition of the intestinal microbiota and host inflammatory response, we analyzed fecal concentrations of HBD2, which is an antimicrobial peptide secreted by the epithelial cells in response to microbial stimulus and IL-17/IL-22 pathway activation (40). Interestingly, the children in Cluster 4 had higher fecal HBD2 levels compared to children in Clusters 1 and 5 (Figure 4A), and consequently autoantibody positive children had higher levels of fecal HBD2 than autoantibody-negative children (Figure 4B). However, the autoantibody-positive children in Cluster 4 had higher levels of fecal HBD2 than those in Cluster 5 (Supplementary Figure 3). Notably, the children with only one autoantibody showed higher levels of fecal HBD2 compared to autoantibody-negative children (Figure 4C). Fecal calprotectin levels did not differ between the autoantibody-negative or positive children or between the species clusters (Supplementary Figures 4D–F).
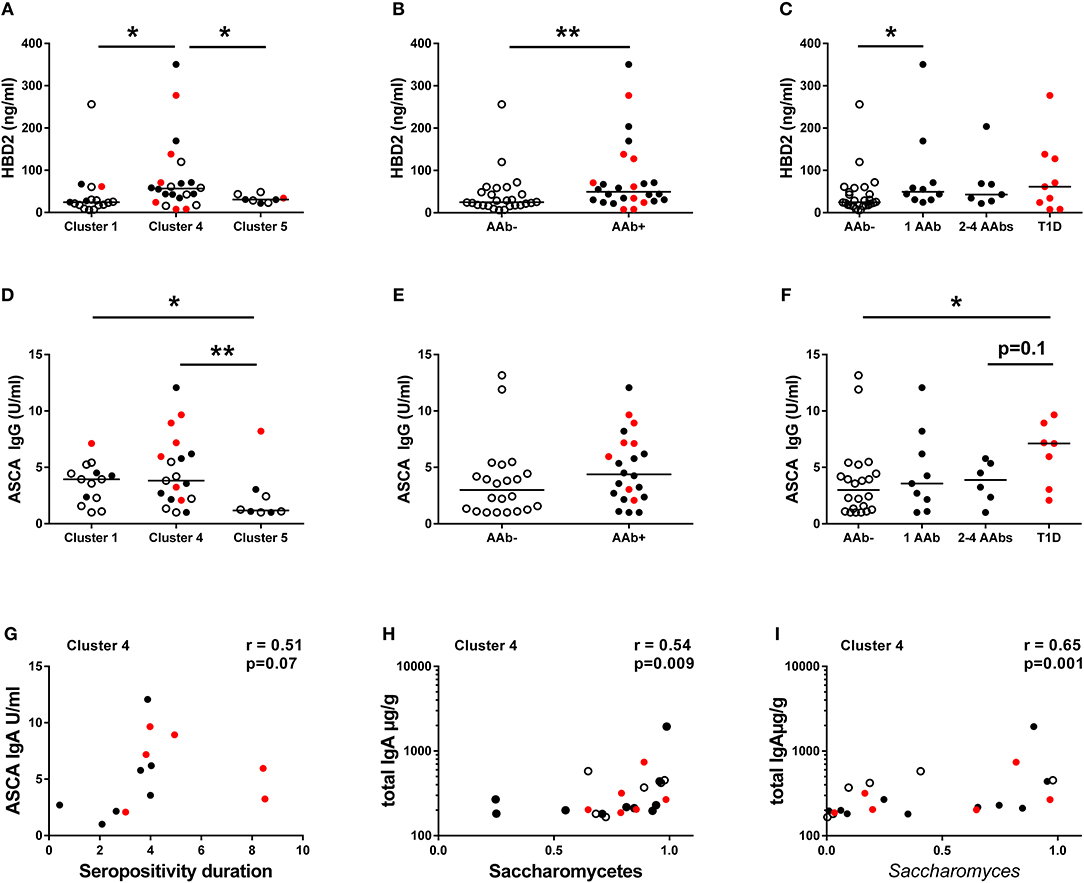
Figure 4. Inflammatory markers in different clusters and in children with or without beta-cell autoimmunity. (A) Fecal concentrations of HBD2 in the Clusters 1, 4, and 5. HBD2 levels were higher in the species Cluster 4 compared to Clusters 1 and 5. (B) Children with autoantibodies had elevated levels of fecal HBD2 compared to autoantibody-negative children. (C) Children with only one autoantibody had elevated levels of fecal HBD2 compared to autoantibody-negative children. (D) Serum ASCA IgG concentrations were significantly higher in the Clusters 1 and 4 compared to the Cluster 5. (E) Serum ASCA IgG concentrations in AAb- and in AAb+ children. (F) The autoantibody-positive children who have progressed to clinical disease had elevated serum ASCA IgG antibodies compared to autoantibody-negative children. (G) The relationship between serum ASCA IgA levels and seropositivity duration in the species Cluster 4. (H) The relationship between fecal total IgA and relative abundance of Saccharomycetes in the Cluster 4. (I) The relationship between fecal total IgA and relative abundance of Saccharomyces in the Cluster 4. Healthy children without autoantibodies are marked with open circles, children with 1–4 autoantibodies with black circles and children who have progressed to clinical disease with red circle. Horizontal lines represent median values. p-values were calculated with the Mann–Whitney U-test. Correlations were calculated with the Spearman rank correlation test.*p < 0.05, **p < 0.01.
Since the high abundance of order Saccharomycetales (the most abundant genera in the data set belonging to the Saccharomycetales were: Saccharomyces, Candida, and Debaryomyces) was a key feature of the children in Cluster 1 and 4, we measured the levels of serum ASCA shown earlier to be associated with fungal dysbiosis in Crohn's disease (41, 42). ASCA IgG levels were significantly higher in children belonging to Clusters 1 and 4 compared to the children in Cluster 5 (Figure 4D), suggesting that the ASCA IgG production is indeed induced by high abundance of Saccharomycetes, which was observed in children in the Clusters 1 and 4. ASCA IgG levels did not, however, correlate with the abundance of Saccharomycetes or Saccharomyces in either the children in Cluster 1 or 4 (p = 0.33 and p = 0.73). Indeed, the highest ASCA IgG levels were observed in the children who progressed to clinical T1D, irrespective of the assigned Cluster (Figures 4E,F). Moreover, ASCA IgG levels showed a tendency of positive correlation with the duration of autoantibody positivity in the Cluster 4 children (Figure 4G). ASCA IgA levels did not differ significantly between the clusters, but it should be noted that the majority of individuals studied had ASCA IgA levels below the lower limit of detection (Supplementary Figures 4G–I). We also observed a positive correlation between fecal total IgA levels and Saccharomycetes (and also Saccharomyces) abundance in Cluster 4, suggesting a local intestinal immunostimulatory effect of Saccharomyces in the children in Cluster 4 (Figures 4H,I).
Bacteroidetes vs. Firmicutes Ratio as a Regulator of Systemic Low-Grade Inflammation
Given that Th1 and Th17 immunity have been earlier associated with fungal dysbiosis (43) and T1D (6, 9, 44), we measured concentrations of the circulating cytokines IFNG, IL-17A, and IL-22, in the serum samples of the study participants. In Cluster 1, enriched with the autoantibody negative children and representing thus healthy children, both IFNG and IL-17A concentrations correlated positively with the abundance of Bacteroidetes (Figures 5A,D) and inversely with the abundance of Firmicutes (Figures 5B,E). In agreement with this, we found that the children in Cluster 5, characterized by increased Bacteroidetes to Firmicutes ratio, showed increased levels of circulating IFNG and IL-17A (Figures 5C,F). In Cluster 4, enriched with the autoantibody positive children with intestinal inflammation, no correlations were observed between circulating cytokines and microbiota composition. No correlation was found between the relative abundance of Saccharomyces and circulating cytokines (Figures 5G,H) in Cluster 1. Serum IFNG and IL-17A concentrations in children with or without beta-cell autoimmunity are shown in Supplementary Figure 5.
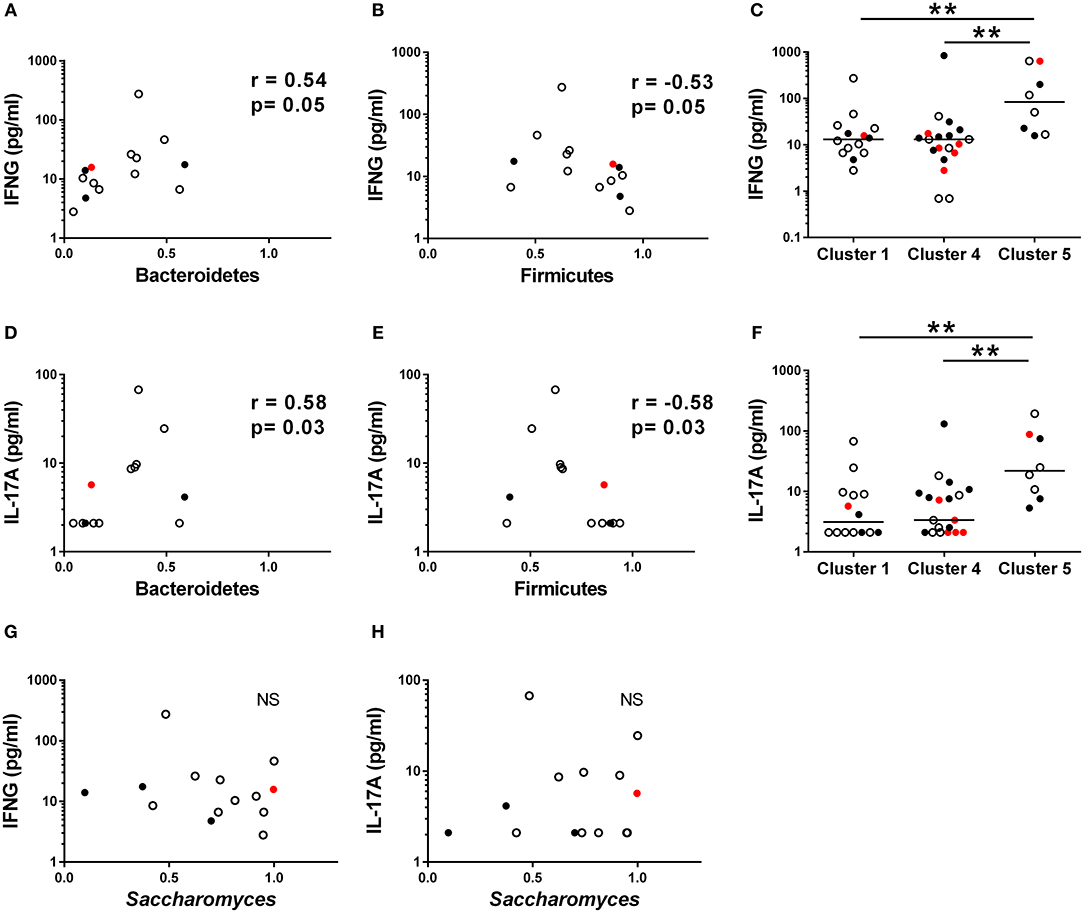
Figure 5. Serum cytokine concentration in different clusters. (A,B) The relationships between serum IFNG and relative abundance of fecal Bacteroidetes and Firmicutes in the Cluster 1. (D,E) The relationships between serum IL-17A and relative abundance of fecal Bacteroidetes and Firmicutes in the Cluster 1. (C,F) IFNG and IL-17A levels were significantly higher in the Cluster 5 compared to the Clusters 1 and 4. (G,H) The relationships between serum IFNG and relative abundance of fecal Bacteroidetes and Firmicutes in the Cluster 1. Horizontal lines represent median values. p-values were calculated with the Mann–Whitney U-test. Correlations were calculated with the Spearman rank correlation test.*p < 0.05, **p < 0.01.
Discussion
In a prospective study including 52 children at risk of T1D, we show that intestinal dysbiosis is associated with the later development of T1D, and is characterized by altered fungal and bacterial communities and intestinal inflammation. Signs of intestinal inflammation and increased permeability have been earlier associated with clinical T1D (15, 26, 45–47). Bosi et al. (48) have shown increased intestinal permeability also in pre-diabetes (48). To our knowledge, however, these kinds of associations between the composition of the intestinal microbiome, intestinal inflammatory markers, and their potential contribution to the disease progression have not been reported earlier in children at risk of T1D.
The combined hierarchical clustering analysis of fungal and bacterial taxa provided the separation of the autoantibody positive children into two groups which differed in the progression to T1D during the follow-up. Long-term follow-up studies are rare, but show that nearly all children positive for multiple autoantibodies and genetic risk of T1D develop the clinical disease in 15–20 years (49). Thus, the children who developed T1D in our cohort can be considered as rapid progressors (Cluster 4) in comparison to the autoantibody positive children who remained healthy (Cluster 5). The levels of fecal HBD2 indicating epithelial intestinal inflammation were the highest in the children with rapid disease progression (i.e., Cluster 4) suggesting that intestinal inflammation is a marker of disease progression. The altered bacterial community, which was seen in Clusters 4 and 5, is likely associated with the development of beta-cell autoimmunity as such. We did not find significant differences in fecal calprotectin levels between the clusters, or children with or without beta-cell autoimmunity, suggesting that neutrophil activation is not mediating intestinal inflammation. The levels of fecal calprotectin in our study cohort were comparable to the levels reported earlier in healthy children (50).
Our mycobiome data suggest that fungal dysbiosis could play a role in the disruption of intestinal homeostasis and development of subclinical low-grade intestinal inflammation, which associate with the disease progression.
Altered abundances of fungi assigned to Malassezia and Debaryomyces taxa were found in children with beta-cell autoimmunity, and a decreased abundance of fungi assigning to Verticillium genus was observed in children who later progressed to clinical T1D. Fecal Debaryomyces and Malassezia have been occasionally reported in human studies, but currently there is no consensus whether these fungal taxa are permanent residents of human intestinal microbiota (17). Verticillium has been reported very rarely in humans (51, 52). In line with a recent comprehensive review on human gut mycobiota (18), Saccharomyces, and Candida genera were the most frequently observed fungal taxa with the highest relative abundances among the children in our cohort.
Importantly, the high relative abundance of Candida was characteristic to the fungal dysbiosis that separated the autoantibody positive children with rapid disease progression from the rest of the autoantibody positive children who did not develop T1D, and from the autoantibody negative children. Thus, the increased colonization with Candida could be an important factor contributing to the intestinal inflammation and further progression to T1D.
Candida is a member of the healthy intestinal microbiome, and the degree of Candida colonization is regulated by host related factors, such as epithelial integrity and IL-17/IL-22 immunity, and by the composition of the commensal bacterial community (43, 53–56). Commensal bacteria interfere with fungal colonization and compete for surface and nutrients, and bacteria-produced short chain fatty acids (SCFAs) can inhibit Candida virulence by preventing yeast-hyphal transition (57). Bacteria can also modulate epithelial barrier function and integrity by their SCFA metabolites, such as butyrate, and by regulation of the production of mucus, IL-22, and anti-microbial peptides (54, 55, 58). Thus, the low relative abundance of Clostridiales and butyrate-producing bacteria found in the autoantibody positive children could contribute to the increasing colonization by Candida. Low abundance of butyrate-producing bacteria has been reported also in autoantibody positive children in earlier studies (10, 59). However, despite of the low abundance of Clostridiales in both Clusters 4 and 5, increase in Candida was only seen in Cluster 4 including the rapid progressors. In humans, efficient control and eradication of Candida requires the activation of IL17A and IFNG-producing Th17 cells (60, 61). It is thus possible that the observed high levels of circulating IL-17 and IFNG in Cluster 5 could provide resistance to fungal colonization. Indeed, the abundance of Saccharomyces was significantly decreased in Cluster 5 with the highest levels of circulating IL-17 and IFNG. The increase in IL-17 and IFNG in Cluster 5 can actually be a consequence of the bacterial dysbiosis characterized by low abundance of Firmicutes and high abundance of Bacteroidetes, similarly as seen in the autoantibody negative children in Cluster 1, who showed a positive correlation with circulating IL-17 and IFNG and a high Bacteroidetes to Firmicutes ratio. Instead, in Cluster 4, the children did not respond to bacterial dysbiosis with IL-17 and IFNG upregulation, which could provide a niche for Candida colonization, and finally to the local mucosal inflammation in the intestine. When we analyzed the relationship between relative abundances of Saccharomyces or Candida and circulating cytokines, we did not observe significant correlations in children in Cluster 1 underlining the importance of Bacteroidetes and Firmicutes in regulation of IFNG and IL-17 responses in a healthy state.
The human intestinal microbiota is a dynamic system of bacteria, fungi, protists and viruses that co-exist and thus, may converge in response to various external or internal stimuli. Interkingdom associations between bacteria and fungi within gut microbiome have been previously reported in Crohn's disease, where different fungal genera were positively correlated with several bacterial taxa (21, 22). The potency of the mycobiota to regulate the bacterial compartment is suggested by animal studies showing that restoration of the bacterial compartment after antibiotic depletion of bacteria was strongly influenced by colonization with C. albicans (62). In a mouse model of liver injury, administration of Saccharomyces boulardii changed the composition of intestinal bacterial compartment by increasing the relative abundance of Bacteroidetes and decreasing the relative abundance of the bacteria belonging to the Firmicutes (63). Interestingly, Enterobacteriaceae, such as Escherichia coli has been shown to cooperate with yeast to favor their colonization and inflammatory properties in the intestine in an animal model of ulcerative colitis (64). The implication of these data is that intestinal fungal and bacterial communities can regulate each other, but the understanding of the ecological network and its cross-talk with the host remain largely unknown.
We recognize that our study has limitations, such as the relatively low number of studied individuals and the lack of longitudinally collected fecal and blood samples during the follow-up. Although we observed the alterations in the bacterial and fungal communities and in the markers of intestinal inflammation in the samples collected already years before the signs of clinical T1D, longitudinal sampling and mechanistic studies would have strengthened the study, which is currently descriptive in nature. Temporal relationship of bacterial and fungal dysbiosis linked to the development of intestinal inflammation, beta-cell autoimmunity and T1D needs further prospective and mechanistic studies, and as always, the results should be to be replicated in independent cohorts before the findings can be generalized.
There is an urgent need for new biomarkers that could be used for the identification of the individuals with increased risk of beta-cell autoimmunity and for the prediction of the progression from autoantibody positivity to T1D. It is tempting to speculate that an increased Candida abundance and associated intestinal inflammation, measured by increased levels of ASCA and HBD2 levels, could provide new tools for the more accurate prediction of T1D.
Longitudinal studies are needed to provide information on the sequential order of the changes in gut microbiota, intestinal inflammation and peripheral immunity leading to beta-cell autoimmunity and clinical T1D. Despite the limitations in the current study, our findings show that intestinal mycobiota is diverse and can be analyzed in pediatric fecal samples. Our results emphasize the importance of the fungal dysbiosis, in addition to bacterial dysbiosis, in shaping intestinal homeostasis and inflammation preceding T1D.
Data Availability Statement
All microbiome data was uploaded to NCBI BioProject database with accession number PRJNA420169 & PRJNA420171. The other datasets are available on request to the first author (JH).
Ethics Statement
The studies involving human participants were reviewed and approved by the Ethics Committee of the Hospital District of Helsinki and Uusimaa. Written informed consent to participate in this study was provided by the participants' legal guardian/next of kin.
Author Contributions
JH, JK, and OV conceived the original idea. JH and OV wrote the manuscript. JK, AL, and MT were responsible for DNA analyses and bioinformatics of the microbiological studies. DM was responsible for clustering analyses. AV performed serum ASCA Ig and cytokine analyses. JH, LO, JK, AL, MT, AV, CF, and DM analyzed the data. TR and KL coordinated the study subject recruitment and sample collection. MK contributed to the study subject recruitment and edited the manuscript. JK, AL, and AP contributed to the writing and critically reviewed the manuscript. MK and TH were responsible for the autoantibody analyses. JI was responsible for HLA typing. LO performed the HBD2, total IgA, and calprotectin analyses. OV was responsible for the study design.
Funding
This work was supported by the Finnish Cultural Foundation (JH), the Finnish Diabetes Research Foundation (JH and OV), the Academy of Finland (OV), the Päivikki and Sakari Sohlberg Foundation (OV), and European Foundation for the Study of Diabetes (OV).
Conflict of Interest
DM was employed by the company AstraZeneca, but AstraZeneca did not have a role in the study.
The remaining authors declare that the research was conducted in the absence of any commercial or financial relationships that could be construed as a potential conflict of interest.
Acknowledgments
Marko Suokas from Biocenter Oulu sequencing center (University of Oulu, Oulu, Finland) is acknowledged for providing sequencing services.
Supplementary Material
The Supplementary Material for this article can be found online at: https://www.frontiersin.org/articles/10.3389/fimmu.2020.00468/full#supplementary-material
Supplementary Figure 1. Diversity of the fungal communities. (A) Rarefaction curves showing the alpha diversity in the fungal community across all the samples, and (B) in children with 1-4 β-cell autoantibodies (red curve) and autoantibody negative samples (blue curve). Each curve is showing an average number of OTUs found in the given number of sampled sequences after rarefaction at the depth of 327 sequences per sample. Principal coordinate analysis (PCoA) plots based on the weighted (C) and unweighted (D) UniFrac distances between the fecal fungal communities in children with (red dots) or without (blue dots) autoantibodies.
Supplementary Figure 2. Relative abundances of fungal genera Saccharomyces, Candida, Debaryomyces, Malassezia and Verticillium in different Clusters and in children with or without T1D-associated autoantibodies. Relative abundances of Saccharomyces (A) and Candida (B) in major Clusters 1, 4, and 5. (C–E) relative abundances of Debaryomyces, Malassezia and Verticillium in fecal samples from children in major Clusters. (F,G) Healthy children without autoantibodies are marked with open circles, children with 1–4 autoantibodies with black circles and children who have progressed to clinical disease with red circle. P-values were calculated with the Mann–Whitney U-test. *p < 0.05, **p < 0.01.
Supplementary Figure 3. Intestinal inflammation in children with autoantibodies in Clusters 4 and 5. AAb+ children in the Cluster 5 had significantly lower fecal HBD2 levels compared to AAb+ children in the Cluster 4. Horizontal lines represent median values. Children with 1–4 autoantibodies are marked with black circles and children who have progressed to clinical disease with red circle. Dotted line represents the highest observed value in the Cluster 5. 81% of the individuals in the cluster 4 had HBD2 level higher than the highest value in the Cluster 5. p-values were calculated with the Mann–Whitney U-test. *p < 0.05.
Supplementary Figure 4. Inflammatory markers in different clusters and in children with or without beta-cell autoimmunity. (A) Fecal concentration of total IgA in the major species Clusters 1, 4, and 5. (B) Fecal total IgA concentrations in AAb+ children and AAb- children. (C) Fecal concentration of total IgA in AAb-children, in children with a different number of autoantibodies and in children who have progressed to clinical T1D. (D) Fecal concentration of calprotectin in the major species Clusters 1, 4, and 5. (E) Fecal calprotectin concentrations in AAb+ children and AAb- children. (F) Fecal concentration of calprotectin in AAb-children, in children with a different number of autoantibodies and in children who have progressed to clinical T1D. (G) Serum ASCA IgA antibody levels in the different species Clusters. (H) Serum ASCA IgA levels in AAb- and AAb+ children. (I) Serum ASCA IgA concentrations in AAb- children and in children with only one or multiple autoantibodies and in those children who have progressed to clinical disease. (J) Serum IL-22 levels in different species clusters. (K) IL-22 levels in AAb- and AAb+ children. (L) IL-22 levels in AAb- children and in children with different numbers of autoantibodies.
Supplementary Figure 5. (A,B) Serum IFNG and IL-17A concentration in children with or without beta-cell autoimmunity.
Supplementary Table 1. The top 25 most abundant fungal species (based on the observed sequences) shared among the autoantibody-negative children and children with autoantibodies.
Supplementary Table 2. Summary of the permutational multivariate analysis of variance (PERMANOVA). PERMANOVA statistical tests were performed on the weighted UniFrac distances and Bray Curtis dissimilarity between the (1) fungal and (2) bacterial gut microbial communities profiles of children at risk of the type 1 diabetes development. Statistical tests were run using the adonis function in R package vegan (with 999 permutations). The significant (<0.05) values shown in bold.
Supplementary Table 3. Summary of the analysis of similarities (ANOSIM). ANOSIM statistical tests were performed on the weighted UniFrac distances and Bray Curtis dissimilarity between the (1) fungal and (2) bacterial gut microbial communities profiles of children at risk of the type 1 diabetes development. Statistical tests were run using the anosim function in R package vegan (with 999 permutations). The Benjamini-Hochberg False Discovery Rate (FDR) correction for multiple testing was used to calculate q-values. The significant (<0.05) values shown in bold.
References
1. Bendelac A, Carnaud C, Boitard C, Bach JF. Syngeneic transfer of autoimmune diabetes from diabetic NOD mice to healthy neonates. requirement for both L3T4+ and Lyt-2+ T cells. J Exp Med. (1987) 166:823–32. doi: 10.1084/jem.166.4.823
2. Bottazzo GF, Florin-Christensen A, Doniach D. Islet-cell antibodies in diabetes mellitus with autoimmune polyendocrine deficiencies. Lancet. (1974) 2:1279–83. doi: 10.1016/S0140-6736(74)90140-8
3. MacCuish AC, Irvine WJ, Barnes EW, Duncan LJ. Antibodies to pancreatic islet cells in insulin-dependent diabetics with coexistent autoimmune disease. Lancet. (1974) 2:1529–31. doi: 10.1016/S0140-6736(74)90281-5
4. Morgan NG, Leete P, Foulis AK, Richardson SJ. Islet inflammation in human type 1 diabetes mellitus. IUBMB Life. (2014) 66:723–34. doi: 10.1002/iub.1330
5. Ferreira RC, Guo H, Coulson RM, Smyth DJ, Pekalski ML, Burren OS, et al. A type I interferon transcriptional signature precedes autoimmunity in children genetically at risk for type 1 diabetes. Diabetes. (2014) 63:2538–50. doi: 10.2337/db13-1777
6. Honkanen J, Nieminen JK, Gao R, Luopajarvi K, Salo HM, Ilonen J, et al. IL-17 immunity in human type 1 diabetes. J Immunol. (2010) 185:1959–67. doi: 10.4049/jimmunol.1000788
7. Kallionpaa H, Elo LL, Laajala E, Mykkanen J, Ricano-Ponce I, Vaarma M, et al. Innate immune activity is detected prior to seroconversion in children with HLA-conferred type 1 diabetes susceptibility. Diabetes. (2014) 63:2402–14. doi: 10.2337/db13-1775
8. Marwaha AK, Crome SQ, Panagiotopoulos C, Berg KB, Qin H, Ouyang Q, et al. Cutting edge: increased IL-17-secreting T cells in children with new-onset type 1 diabetes. J Immunol. (2010) 185:3814–8. doi: 10.4049/jimmunol.1001860
9. Reinert-Hartwall L, Honkanen J, Salo HM, Nieminen JK, Luopajarvi K, Harkonen T, et al. Th1/Th17 plasticity is a marker of advanced beta cell autoimmunity and impaired glucose tolerance in humans. J Immunol. (2015) 194:68–75. doi: 10.4049/jimmunol.1401653
10. de Goffau MC, Luopajarvi K, Knip M, Ilonen J, Ruohtula T, Harkonen T, et al. Fecal microbiota composition differs between children with beta-cell autoimmunity and those without. Diabetes. (2013) 62:1238–44. doi: 10.2337/db12-0526
11. Giongo A, Gano KA, Crabb DB, Mukherjee N, Novelo LL, Casella G, et al. Toward defining the autoimmune microbiome for type 1 diabetes. ISME J. (2011) 5:82–91. doi: 10.1038/ismej.2010.92
12. Kostic AD, Gevers D, Siljander H, Vatanen T, Hyotylainen T, Hamalainen AM, et al. The dynamics of the human infant gut microbiome in development and in progression toward type 1 diabetes. Cell Host Microbe. (2015) 17:260–73. doi: 10.1016/j.chom.2015.01.001
13. Vatanen T, Franzosa EA, Schwager R, Tripathi S, Arthur TD, Vehik K, et al. The human gut microbiome in early-onset type 1 diabetes from the TEDDY study. Nature. (2018) 562:589–94. doi: 10.1038/s41586-018-0620-2
14. Vatanen T, Kostic AD, d'Hennezel E, Siljander H, Franzosa EA, Yassour M, et al. Variation in microbiome LPS immunogenicity contributes to autoimmunity in humans. Cell. (2016) 165:842–53. doi: 10.1016/j.cell.2016.04.007
15. Westerholm-Ormio M, Vaarala O, Pihkala P, Ilonen J, Savilahti E. Immunologic activity in the small intestinal mucosa of pediatric patients with type 1 diabetes. Diabetes. (2003) 52:2287–95. doi: 10.2337/diabetes.52.9.2287
16. Wen L, Ley RE, Volchkov PY, Stranges PB, Avanesyan L, Stonebraker AC, et al. Innate immunity and intestinal microbiota in the development of type 1 diabetes. Nature. (2008) 455:1109–13. doi: 10.1038/nature07336
17. Hallen-Adams HE, Suhr MJ. Fungi in the healthy human gastrointestinal tract. Virulence. (2017) 8:352–8. doi: 10.1080/21505594.2016.1247140
18. Richard ML, Sokol H. The gut mycobiota: insights into analysis, environmental interactions and role in gastrointestinal diseases. Nat Rev Gastroenterol Hepatol. (2019) 16:331–45. doi: 10.1038/s41575-019-0121-2
19. Ferreira R, Limeta A, Nielsen J. Tackling cancer with yeast-based technologies. Trends Biotechnol. (2018). doi: 10.1016/j.tibtech.2018.11.013
20. Fujimura KE, Sitarik AR, Havstad S, Lin DL, Levan S, Fadrosh D, et al. Neonatal gut microbiota associates with childhood multisensitized atopy and T cell differentiation. Nat Med. (2016) 22:1187–91. doi: 10.1038/nm.4176
21. Hoarau G, Mukherjee PK, Gower-Rousseau C, Hager C, Chandra J, Retuerto MA, et al. Bacteriome and mycobiome interactions underscore microbial dysbiosis in familial Crohn's disease. MBio. (2016) 7:e01250–16. doi: 10.1128/mBio.01250-16
22. Sokol H, Leducq V, Aschard H, Pham HP, Jegou S, Landman C, et al. Fungal microbiota dysbiosis in IBD. Gut. (2017) 66:1039–48. doi: 10.1136/gutjnl-2015-310746
23. Iliev ID, Leonardi I. Fungal dysbiosis: immunity and interactions at mucosal barriers. Nat Rev Immunol. (2017) 17:635–46. doi: 10.1038/nri.2017.55
24. Knip M, Virtanen SM, Akerblom HK. Infant feeding and the risk of type 1 diabetes. Am J Clin Nutr. (2010) 91:1506S−13S. doi: 10.3945/ajcn.2010.28701C
25. Sjoroos M, Iitia A, Ilonen J, Reijonen H, Lovgren T. Triple-label hybridization assay for type-1 diabetes-related HLA alleles. Biotechniques. (1995) 18:870–7.
26. Vaarala O, Ilonen J, Ruohtula T, Pesola J, Virtanen SM, Harkonen T, et al. Removal of bovine insulin from cow's milk formula and early initiation of beta-cell autoimmunity in the FINDIA pilot study. Arch Pediatr Adolesc Med. (2012) 166:608–14. doi: 10.1001/archpediatrics.2011.1559
27. Ihrmark K, Bodeker IT, Cruz-Martinez K, Friberg H, Kubartova A, Schenck J, et al. New primers to amplify the fungal ITS2 region—evaluation by 454-sequencing of artificial and natural communities. FEMS Microbiol Ecol. (2012) 82:666–77. doi: 10.1111/j.1574-6941.2012.01437.x
28. Caporaso JG, Kuczynski J, Stombaugh J, Bittinger K, Bushman FD, Costello EK, et al. QIIME allows analysis of high-throughput community sequencing data. Nat Methods. (2010) 7:335–6. doi: 10.1038/nmeth.f.303
29. Edgar RC, Haas BJ, Clemente JC, Quince C, Knight R. UCHIME improves sensitivity and speed of chimera detection. Bioinformatics. (2011) 27:2194–200. doi: 10.1093/bioinformatics/btr381
30. Edgar RC. Search and clustering orders of magnitude faster than BLAST. Bioinformatics. (2010) 26:2460–1. doi: 10.1093/bioinformatics/btq461
31. McDonald D, Price MN, Goodrich J, Nawrocki EP, deSantis TZ, Probst A, et al. An improved greengenes taxonomy with explicit ranks for ecological and evolutionary analyses of bacteria and archaea. ISME J. (2012) 6:610–8. doi: 10.1038/ismej.2011.139
32. Nilsson RH, Larsson KH, Taylor AFS, Bengtsson-Palme J, Jeppesen TS, Schigel D, et al. The UNITE database for molecular identification of fungi: handling dark taxa and parallel taxonomic classifications. Nucleic Acids Res. (2019) 47:D259–64. doi: 10.1093/nar/gky1022
33. Weiss S, Xu ZZ, Peddada S, Amir A, Bittinger K, Gonzalez A, et al. Normalization and microbial differential abundance strategies depend upon data characteristics. Microbiome. (2017) 5:27. doi: 10.1186/s40168-017-0237-y
34. Lozupone CA, Hamady M, Kelley ST, Knight R. Quantitative and qualitative beta diversity measures lead to different insights into factors that structure microbial communities. Appl Environ Microbiol. (2007) 73:1576–85. doi: 10.1128/AEM.01996-06
35. Vazquez-Baeza Y, Pirrung M, Gonzalez A, Knight R. EMPeror: a tool for visualizing high-throughput microbial community data. Gigascience. (2013) 2:16. doi: 10.1186/2047-217X-2-16
36. Lehtonen OP, Grahn EM, Stahlberg TH, Laitinen LA. Amount and avidity of salivary and serum antibodies against Streptococcus mutans in two groups of human subjects with different dental caries susceptibility. Infect Immun. (1984) 43:308–13. doi: 10.1128/IAI.43.1.308-313.1984
37. Oksanen J, Blanchet FG, Kindt R, Legendre P, Minchin PR, O'Hara B, et al. Vegan: Community Ecology Package (2016). Available online at: https://cran.r-project.org/web/packages/vegan/index.html
38. Hoffmann C, Dollive S, Grunberg S, Chen J, Li H, Wu GD, et al. Archaea and fungi of the human gut microbiome: correlations with diet and bacterial residents. PLoS ONE. (2013) 8:e66019. doi: 10.1371/journal.pone.0066019
39. Motooka D, Fujimoto K, Tanaka R, Yaguchi T, Gotoh K, Maeda Y, et al. Fungal ITS1 deep-sequencing strategies to reconstruct the composition of a 26-species community and evaluation of the gut mycobiota of healthy japanese individuals. Front Microbiol. (2017) 8:238. doi: 10.3389/fmicb.2017.00238
40. Liang SC, Tan XY, Luxenberg DP, Karim R, Dunussi-Joannopoulos K, Collins M, et al. Interleukin (IL)-22 and IL-17 are coexpressed by Th17 cells and cooperatively enhance expression of antimicrobial peptides. J Exp Med. (2006) 203:2271–9. doi: 10.1084/jem.20061308
41. Israeli E, Grotto I, Gilburd B, Balicer RD, Goldin E, Wiik A, et al. Anti-Saccharomyces cerevisiae and antineutrophil cytoplasmic antibodies as predictors of inflammatory bowel disease. Gut. (2005) 54:1232–6. doi: 10.1136/gut.2004.060228
42. Pascal V, Pozuelo M, Borruel N, Casellas F, Campos D, Santiago A, et al. A microbial signature for Crohn's disease. Gut. (2017) 66:813–22. doi: 10.1136/gutjnl-2016-313235
44. Kallmann BA, Huther M, Tubes M, Feldkamp J, Bertrams J, Gries FA, et al. Systemic bias of cytokine production toward cell-mediated immune regulation in IDDM and toward humoral immunity in Graves' disease. Diabetes. (1997) 46:237–43. doi: 10.2337/diabetes.46.2.237
45. Kuitunen M, Saukkonen T, Ilonen J, Akerblom HK, Savilahti E. Intestinal permeability to mannitol and lactulose in children with type 1 diabetes with the HLA-DQB1*02 allele. Autoimmunity. (2002) 35:365–8. doi: 10.1080/0891693021000008526
46. Tiittanen M, Westerholm-Ormio M, Verkasalo M, Savilahti E, Vaarala O. Infiltration of forkhead box P3-expressing cells in small intestinal mucosa in coeliac disease but not in type 1 diabetes. Clin Exp Immunol. (2008) 152:498–507. doi: 10.1111/j.1365-2249.2008.03662.x
47. Vaarala O, Atkinson MA, Neu J. The perfect storm for type 1 diabetes: the complex interplay between intestinal microbiota, gut permeability, and mucosal immunity. Diabetes. (2008) 57:2555–62. doi: 10.2337/db08-0331
48. Bosi E, Molteni L, Radaelli MG, Folini L, Fermo I, Bazzigaluppi E, et al. Increased intestinal permeability precedes clinical onset of type 1 diabetes. Diabetologia. (2006) 49:2824–7. doi: 10.1007/s00125-006-0465-3
49. Ziegler AG, Rewers M, Simell O, Simell T, Lempainen J, Steck A, et al. Seroconversion to multiple islet autoantibodies and risk of progression to diabetes in children. JAMA. (2013) 309:2473–9. doi: 10.1001/jama.2013.6285
50. Kolho KL, Sipponen T, Valtonen E, Savilahti E. Fecal calprotectin, MMP-9, and human beta-defensin-2 levels in pediatric inflammatory bowel disease. Int J Colorectal Dis. (2014) 29:43–50. doi: 10.1007/s00384-013-1775-9
51. Hamad I, Sokhna C, Raoult D, Bittar F. Molecular detection of eukaryotes in a single human stool sample from senegal. PLoS ONE. (2012) 7:e40888. doi: 10.1371/journal.pone.0040888
52. Scanlan PD, Marchesi JR. Micro-eukaryotic diversity of the human distal gut microbiota: qualitative assessment using culture-dependent and -independent analysis of faeces. ISME J. (2008) 2:1183–93. doi: 10.1038/ismej.2008.76
53. de Luca A, Zelante T, D'Angelo C, Zagarella S, Fallarino F, Spreca A, et al. IL-22 defines a novel immune pathway of antifungal resistance. Mucosal Immunol. (2010) 3:361–73. doi: 10.1038/mi.2010.22
54. Kinnebrew MA, Buffie CG, Diehl GE, Zenewicz LA, Leiner I, Hohl TM, et al. Interleukin 23 production by intestinal CD103(+)CD11b(+) dendritic cells in response to bacterial flagellin enhances mucosal innate immune defense. Immunity. (2012) 36:276–87. doi: 10.1016/j.immuni.2011.12.011
55. Schauber J, Svanholm C, Termen S, Iffland K, Menzel T, Scheppach W, et al. Expression of the cathelicidin LL-37 is modulated by short chain fatty acids in colonocytes: relevance of signalling pathways. Gut. (2003) 52:735–41. doi: 10.1136/gut.52.5.735
56. Fan D, Coughlin LA, Neubauer MM, Kim J, Kim MS, Zhan X, et al. Activation of HIF-1α and LL-37 by commensal bacteria inhibits Candida albicans colonization. Nat Med. (2015) 21:808–14. doi: 10.1038/nm.3871
57. Hooper LV, Macpherson AJ. Immune adaptations that maintain homeostasis with the intestinal microbiota. Nat Rev Immunol. (2010) 10:159–69. doi: 10.1038/nri2710
58. Otte JM, Zdebik AE, Brand S, Chromik AM, Strauss S, Schmitz F, et al. Effects of the cathelicidin LL-37 on intestinal epithelial barrier integrity. Regul Pept. (2009) 156:104–17. doi: 10.1016/j.regpep.2009.03.009
59. Vaarala O. Human intestinal microbiota and type 1 diabetes. Curr Diab Rep. (2013) 13:601–7. doi: 10.1007/s11892-013-0409-5
60. Bacher P, Hohnstein T, Beerbaum E, Rocker M, Blango MG, Kaufmann S, et al. Human anti-fungal Th17 immunity and pathology rely on cross-reactivity against Candida albicans. Cell. (2019) 176:1340–55.e15. doi: 10.1016/j.cell.2019.01.041
61. Zielinski CE, Mele F, Aschenbrenner D, Jarrossay D, Ronchi F, Gattorno M, et al. Pathogen-induced human TH17 cells produce IFN-γ or IL-10 and are regulated by IL-1β. Nature. (2012) 484:514–8. doi: 10.1038/nature10957
62. Erb Downward JR, Falkowski NR, Mason KL, Muraglia R, Huffnagle GB. Modulation of post-antibiotic bacterial community reassembly and host response by Candida albicans. Sci Rep. (2013) 3:2191. doi: 10.1038/srep02191
63. Yu L, Zhao XK, Cheng ML, Yang GZ, Wang B, Liu HJ, et al. Saccharomyces boulardii administration changes gut microbiota and attenuates D-Galactosamine-induced liver injury. Sci Rep. (2017) 7:1359. doi: 10.1038/s41598-017-01271-9
Keywords: mycobiome, dysbiosis, gut, inflammation, Candida, Saccharomyces, type 1 diabetes
Citation: Honkanen J, Vuorela A, Muthas D, Orivuori L, Luopajärvi K, Tejesvi MVG, Lavrinienko A, Pirttilä AM, Fogarty CL, Härkönen T, Ilonen J, Ruohtula T, Knip M, Koskimäki JJ and Vaarala O (2020) Fungal Dysbiosis and Intestinal Inflammation in Children With Beta-Cell Autoimmunity. Front. Immunol. 11:468. doi: 10.3389/fimmu.2020.00468
Received: 10 October 2019; Accepted: 28 February 2020;
Published: 19 March 2020.
Edited by:
Julien Diana, Institut National de la Santé et de la Recherche Médicale (INSERM), FranceReviewed by:
Carina Torn, Lund University, SwedenKendra Vehik, University of South Florida, United States
Janet Marie Wenzlau, University of Colorado Anschutz Medical Campus, United States
Copyright © 2020 Honkanen, Vuorela, Muthas, Orivuori, Luopajärvi, Tejesvi, Lavrinienko, Pirttilä, Fogarty, Härkönen, Ilonen, Ruohtula, Knip, Koskimäki and Vaarala. This is an open-access article distributed under the terms of the Creative Commons Attribution License (CC BY). The use, distribution or reproduction in other forums is permitted, provided the original author(s) and the copyright owner(s) are credited and that the original publication in this journal is cited, in accordance with accepted academic practice. No use, distribution or reproduction is permitted which does not comply with these terms.
*Correspondence: Outi Vaarala, outi.vaarala@helsinki.fi
†These authors share senior authorship