 Lelia Lavalett
 Hector Ortega3,4
 Luis F. Barrera
- 1Grupo de Inmunología Celular e Inmunogenética, Facultad de Medicina, Instituto de Investigaciones Médicas, Universidad de Antioquia, Medellín, Colombia
- 2Facultad de Ciencias, Universidad Nacional de Colombia Sede Medellín, Medellín, Colombia
- 3Clínica Cardiovascular Santa María, Medellín, Colombia
- 4Facultad de Medicina, Universidad de Antioquia, Medellín, Colombia
Mycobacterium tuberculosis (Mtb) infects alveolar macrophages (AMs), causing pulmonary tuberculosis (PTB), the most common form of the disease. Less frequently, Mtb is disseminated to many other organs and tissues, resulting in different extrapulmonary forms of TB. Nevertheless, very few studies have addressed the global mRNA response of human AMs, particularly from humans with the active form of the disease. Strikingly, almost no studies have addressed the response of human extrapulmonary macrophages to Mtb infection. In this pilot study, using microarray technology, we examined the transcriptomic ex vivo response of AMs from PTB patients (AMTBs) and AMs from control subjects (AMCTs) infected with two clinical isolates of Mtb. Furthermore, we also studied the infection response of human splenic macrophages (SMs) to Mtb isolates, as a model for extrapulmonary infection, and compared the transcriptomic response between AMs and SMs. Our results showed a striking difference in global mRNA profiles in response to infection between AMs and SMs, implicating a tissue-specific macrophage response to Mtb.
Introduction
Different cell populations of the mononuclear phagocytic system (MPS), including macrophages and monocytes, are preferred targets of Mycobacterium tuberculosis (Mtb), the agent causing human tuberculosis (TB). TB is considered one of the deadliest infectious diseases in human history (1). For the year 2017, cases of TB reached 10.4 million worldwide, from which 6.7 million were considered new cases, and 16% were extrapulmonary TB cases, amounting to 1.6 million deaths of HIV-negative and -positive people, overall. Of interest is the observation that 1.7 billion people are suspected to be latently infected with Mtb and are at higher risk of developing the active form of the disease (2).
Mycobacterium tuberculosis infection is transmitted by an aerosol route from patients with active TB to their contacts, mainly household contacts. The bacillus is then transported to the lung alveoli, where alveolar macrophages (AMs) are considered the main targets of the initial infection (3). However, in some circumstances, Mtb can be disseminated to other organs and tissues, causing different extrapulmonary TB forms of the disease (4).
Based on the mouse model of Mtb aerosol infection, a complex series of events occurs in infected macrophages (5). AMs recognize different pathogen-associated molecular patterns (PAMPs) present or secreted by Mtb using pattern recognition receptors (PRRs), leading to an initial innate immune response to control the infection (6–8).
Infected AMs cross the interstitial space of the lung, disseminating the infection to interstitial macrophages and other migratory myeloid populations, including monocytes (9, 10). The recruitment of additional cell types gives rise to granuloma formation, a structure associated with protection against dissemination (11). In a minority of infected individuals, the granuloma is unable to contain the infection; Mtb heavily replicates and may disseminate to other organs and tissues, leading to extrapulmonary infections and extrapulmonary TB (12). Interestingly, DNA from Mtb has been recovered from the spleen and kidney of healthy deceased individuals from causes other than TB (13), suggesting that Mtb dissemination may take place in people with latent TB infection.
Although the results of previous studies have provided a framework for understanding the consequences of macrophage–Mtb interaction, relatively little data are available regarding human AMs collected from healthy individuals (14, 15), while no data have been obtained from AMs from TB patients. So far, most of our knowledge from the interaction of Mtb with MPS cells has been garnered by the use of monocyte-derived macrophages (MDMs) from healthy individuals (14, 16–18).
Gene expression profiles from TB patients and uninfected healthy controls have been reported by several groups in the past to provide new knowledge on the immune response that takes place during active TB (19). In comparison, tissue samples from extrapulmonary TB have been poorly studied (20, 21). Genome-wide expression profiling studies are essential to provide critical clues to understand the complexities of the immune response to mycobacterial infections, to identify important genes and pathways in infected cells, and to generate new biomarkers of disease prognosis and diagnosis (22).
In this report, we present evidence of a genome-wide microarray expression profiling of AMs from healthy individuals and TB patients, as well as splenic macrophages (SMs) from deceased individuals from causes other than TB and those infected in vitro with two Mtb clinical isolates (UT127 and UT205), whose genomes were recently sequenced to show differential determinants of virulence (23, 24). Our results showed that AMTBs display an attenuated transcriptomic response to Mtb infection, compared to AMCTs without active TB. AMTBs regulate genes associated with interferon (IFN)-signaling pathways, and several critical pathways in active TB were also induced, such as the inflammasome (AIM2), FC pathway receptor (FCGR1A), and myeloid inflammatory pathway (TREM1). These genes and signaling pathways could be novel and of interest to understand certain critical aspects of the pathophysiology of TB. Surprisingly, the analysis of the mRNA profiles of the SMs infected with UT127 or UT205 exhibited a lower transcriptomic response compared to AMs, suggesting a clear-cut difference in the transcriptomic response between AMs and SMs in terms of their capacity to respond to Mtb.
Materials and Methods
Subjects
AMs from bacteriologically confirmed pulmonary TB patients (n = 4), two females (mean age: 26; range: 22–30), two males (mean age: 36; range: 25–47), and healthy controls (n = 4), one female (50 years old), and three males (mean age: 44; range: 19–46) were obtained from bronchoalveolar lavages (BALs) as previously described (25, 26). Non-smoking individuals as well as those testing negative for HIV, cancer, and diabetes at the time of sampling voluntarily participated in this study. BAL from TB patients was obtained within the first 2 weeks of anti-TB treatment. Human spleen slices from deceased donors of the Transplantation Program of the Hospital Universitario Pablo Tobón Uribe, and the IPS Universitaria León XIII Sede Medellín (Medellín, Colombia), specifically two females (mean age: 24.5; range: 23–26) and three males (mean age: 33; range: 28–35), were used to obtain the SMs. Trauma, including different cerebrovascular causes, was the cause of donor death. None of the donors tested positive for HIV.
Mycobacteria
Mtb clinical isolates UT205 and UT127 were obtained from the Centro Colombiano para la Investigación en Tuberculosis (CCITB) from a cohort study of TB patients and their household contacts (27). The UT127 and UT205 strains were initially selected based on epidemiological evidence. While there was an incident case in the house of a TB patient infected with UT205, there were no such cases in the household of the TB patient with UT127. In addition, infection of human macrophages with UT127 mostly triggered apoptotic-like cell death, while UT205 mostly triggered necrotic-type cell death (25, 26). Mtb was cultured as previously described (28). Briefly, mycobacteria were grown in Middlebrook 7H9 broth (Difco, Detroit, USA, #295939) +emented with 10% oleic acid, albumin, dextrose, and catalase (OADC, Becton Dickinson, Franklin Lakes, USA, #211886) and 0.05% Tween 80 (Sigma, St. Louis, MO, USA, #59924) for 2–3 weeks to reach the exponential growth phase, and the clumps were disrupted by sonication (CV33 Sonics Vibra Cell, Newtown, USA). The bacterial suspension was diluted in freezing medium and frozen at −70°C until use. To determine the number of colony-forming units (CFU), 20 μl of each serial dilution was plated onto Petri dishes (Corning, NY, USA) containing Middlebrook 7H10 agar (Becton Dickinson, Franklin Lakes, NJ, USA, #254520) supplemented with glycerol and 10% OADC (Becton Dickinson, Franklin Lakes, NJ, USA, #211886) pH 7.2 and grown at 37°C for 3 weeks. Upon thawing, mycobacterial viability (usually more than 90%) was tested using fluorescein diacetate (FDA)-stained bacteria by flow cytometry (29). Both isolates belonged to the Latino American and Mediterranean family (LAM9) of Mtb (24, 30).
Isolation of Macrophages
AMs were prepared as previously described (25, 26). In summary, fiber optic bronchoscopy was performed to obtain AMs from non-compromised lung areas of pulmonary tuberculosis (PTB). Single-cell suspensions were obtained after BAL and passed through a 40-μm cell strainer (Thermo Fisher, NH, #352340), centrifuged for 5 min at 4°C, after which 650 × g was harvested and resuspended in RPMI-1640 (Sigma, St. Louis, MO, USA, #R8758), supplemented with 10% AB+-inactivated human serum (Sigma, St. Louis, MO, USA, H5667) and antibiotics (complete medium). Viability (≥95%) was estimated by trypan blue exclusion and expressed as a percentage of the total cells recovered. Three hundred thousand dark granular cells, morphologically corresponding to macrophages, were seeded on 24-well plates and cultured for 4 days in complete medium at 37°C, 5% CO2, and 95% relative humidity. At this point, non-adherent cells were eliminated by extensive washings with pre-warmed (37°C) DPBS (Invitrogen, Grand Island, USA) supplemented with 0.5% AB+ inactivated human serum, and then cultured for an additional 24 h in complete medium without antibiotics before being infected.
SMs were obtained as previously described (31). Briefly, splenic mononuclear cell suspensions were obtained after mechanical disruption of spleen slices, lysis of red blood cells, and separation by density centrifugation on Ficoll Hypaque (Lymphoprep, Alere Technologies AS, Oslo, Norway, # 1114545), 400 × g, 30 min, 20°C. 400 × 106 viable (higher than 90%) splenic mononuclear cells were cultured in 100 × 17 mm Dish, Nunclon™ Delta dishes (Thermo Fisher Scientific, Waltham, MA, USA, # 150350) in complete medium for 4 days. Adherent cells were detached by treatment with 0.05% trypsin–EDTA (Sigma, St. Louis, MO, USA, T3924), washed, counted, and then seeded at 3 × 10⁵ macrophages per well on 24-well tissue culture plates in complete medium. SMs were cultured in complete medium without antibiotics for 24 h before infection.
Infection of Macrophages With Mtb
Macrophages were infected for 6 h with Mtb at a multiplicity of infection (MOI) of 10:1. The percentage of infected macrophages in the experimental conditions used in this study was defined in preliminary experiments using Kinyoun staining. At least 400 cells in randomly selected fields were counted. In all cases, the proportion of infected macrophages was >85% (data not shown). The cells were extensively washed with pre-warmed (37°C) DPBS supplemented with 0.5% AB+-inactivated human serum to eliminate non-ingested bacteria. Adherent cells were then lysed in RLT buffer (Qiagen, Carlsbad, USA) with 1% β-mercaptoethanol and stored at −80°C until use for RNA extraction. To account for changes in RNA expression profiles in each group of macrophages, three experimental settings were evaluated: (1) in vitro non-infected cells (NI) used as a control; (2) cells infected in vitro with Mtb UT127; and (3) cells infected in vitro with Mtb UT205.
Isolation of RNA
Experimental variation in the number of cells seeded, adhered, or infected was controlled by extracting total RNA from three to five replica wells for each sample. A total of 39 RNA samples were obtained according to the experimental settings described earlier. However, some RNA samples were excluded from the analysis because they did not meet the quality requirements (see Results section). Total RNA was extracted as previously described (25, 26). Briefly, samples were treated with RLT buffer and kept at −80°C until further processing. RNA from all samples was prepared simultaneously to reduce sample-to-sample variability. RNA was extracted using the RNeasy Plus Mini Kit (Qiagen, Carlsbad, USA, #74134), which includes gDNA eliminator columns, following the manufacturer's protocol. RNA quality was assessed using a Nanodrop 2000 Spectrometer (Thermo Scientific, Waltham, USA) by measuring the ratio of absorbance at 260 and 280 nm, and the integrity of the RNA (RIN) was evaluated employing the Agilent 2100 Bioanalyzer (Agilent Technologies, Waldbronn, Germany). Only samples with a RIN >7 (average median RIN = 9.2; IQ = 0.8; range = 7.5–9.9) were selected for microarray analysis.
Microarray Analyses
RNA expression analysis was performed using the Illumina Human BeadChip (Illumina, San Diego, USA), which provides coverage of 47,231 probes targeting more than 31,000 annotated genes, from which 22,283 are unique. Sample processing was performed at Macrogen (Seoul, Korea) as previously described (25, 26). In summary, total RNA was amplified and purified using the Ambion Illumina RNA amplification kit (Ambion, Austin, USA) to yield biotinylated cRNA according to the manufacturer's instructions. RNA (550 ng) was reverse-transcribed to cDNA using a T7 oligo (dT) primer. Second-strand cDNA was synthesized, transcribed in vitro, and labeled with biotin-NTP. According to the manufacturer's protocol, purified labeled cRNA (750 ng) was hybridized to each Human HT-12 v.4.0 bead array for 16–18 h at 58°C. The Amersham Fluorolink Streptavidin-Cy3 System (GE Healthcare Bio-Sciences, Little Chalfont, UK) was utilized to detect array signals following the bead array manual. A bead array confocal scanner was used to scan the arrays according to the manufacturer's instructions. Hybridization quality and overall chip performance were monitored by visual inspection of both internal quality control checks and the raw scanned data. Raw data were extracted with the Illumina GenomeStudio v2011.1 (Gene Expression Module v1.9.0). Probe signal values were transformed using the logarithm method. All data were submitted to the NCBI Gene Expression Omnibus (GEO) database, accession number GSE139825.
Data Analysis
Data were analyzed as previously described (25, 26). Lumi Bioconductor package (32) was used to preprocess the raw data. This package includes a quality control initial check, a variance-stabilizing transformation (VST) step (33), in which the algorithm takes advantage of the technical replicates available on every Illumina microarray, and a normalization (quantile) step. Before the analysis of differentially expressed genes (DEGs), a filter was applied to minimize false positives and remove the unexpressed and unannotated genes. Absent/present call detection was performed using a p value of 0.01 as a threshold. Genes or probes with an expression level below the threshold value were removed across all groups.
Statistical analysis was performed with ~15,000 probes for each group that reached a significant value for detection. The Limma package of the Bioconductor environment (34) was used to identify DEGs in infected macrophages and they were compared to their respective uninfected controls. Stringent criteria, including Log2 of fold-change (Log2FC) ≥1.5 or ≤ 1.5, and false discovery rate (FDR < 0.05) were applied to filter the DEGs.
Functional Enrichment and Canonical Pathway Analyses
Functional enrichment analysis was conducted to interpret the gene set of interest using Gene Ontology (GO) and the Kyoto Encyclopedia of Genes and Genomes (KEGG) pathways (35). The STRING database (36) was used to perform a functional association analysis using FDR <0.01. Ingenuity Pathway Analysis (IPA) (37) was used to classify DEGs according to their functional relationships, and show canonical pathways and networks involving these genes with potentially critical host mediators of TB disease. IPA includes canonical pathways described in the Ingenuity Pathways Knowledge Base using a built-in scientific literature-based database. The nodes within networks represent genes and lines indicate biological relationships (direct or indirect) with other genes rooted in published literature within the IPA software. The network score is based on the hypergeometric distribution and calculated using the right-tailed Fisher's exact test. Network-wise, IPA computes a score for each network related to the fit of the input set of DEGs. The Z score is obtained from the likelihood that the focus genes in a network are together by chance, with a Z score of 2 being equivalent to a p value of 0.01 (37).
Technical Validation of Differential Expression Using Quantitative Real-Time PCR
Validation and confirmation of the microarray results were performed using quantitative real-time PCR (qRT-PCR). The IL1B, TNFA, TNFAIP6, and IL8 genes were upregulated in AMCTs, AMTBs, and SMs in response to infection with both clinical isolates UT127 and UT205 in the microarray analysis and are important genes in the response of human macrophages to infection with Mtb (38). In this particular case, samples from three individuals from each group of macrophages (AMTBs, AMCTs, and SMs) were evaluated, including RNAs in duplicate of the three experimental settings for each group (NI, samples infected with Mtb UT127, and samples infected with Mtb UT205), which were previously analyzed in microarray experiments. Total RNA (100 ng) was reverse transcribed using SuperScript® III Platinum® Two-Step qRT-PCR Kit (Invitrogen, Carlsbad, USA), according to the manufacturer's instructions. Quantification of PCR products was performed using the Rotor-Gene Q (Qiagen, Carlsbad, USA). Platinum® SYBR® Green qPCR SuperMix was used to produce fluorescent-labeled PCR products according to the manufacturer's instructions. Primer sets used in this study were previously published and validated (17, 39–41). The β-Actin (ACTB) gene was used as a normalizer gene. REST (Relative Expression Software Tool V2.0.21) (42) was applied to calculate the relative gene expression by using the amplification efficiencies from the genes of interest and normalizer ACTB gene. The relative expression values obtained by qRT-PCR were transformed to log2FC and compared with the log2FC expression values determined by the microarray method for the genes selected. Graphs were plotted with GraphPad Prism (v. 6.0).
Supplementary Figure 1 depicts a schematic overview of the experimental design used in this study.
Results
A genome-wide microarray system to assess differences in the responses of human macrophages (AMs and SMs) to infection with Mtb clinical isolates UT127 and UT205 that were used in this study. Genomic and transcriptomic differences between these isolates have been previously described (24). The aim of this study was to identify the host macrophage early gene expression in response to Mtb infection, and how Mtb affects the transcriptional response of macrophages from healthy individuals and TB patients. Furthermore, we hypothesized that the profiles of gene expression induced by Mtb differ among the different populations of human tissue macrophages analyzed.
Global Transcriptome Profiles
Hierarchical clustering (hclust) was performed to estimate the sample relations based on 20,310 normalized and filtered genes. These genes were selected based on a large coefficient of variance (mean/standard variance > 0.1) as a first descriptive step to compare transcriptomic profiles among the different groups and visualize the relative contributions of stimulus type (Supplementary Figure 2). The samples were grouped according to cell type (AMs and SMs), but not according to their origin (CT or TB). Likewise, it was observed that the samples were grouped according to the type of stimulus (infected with Mtb or not infected). However, we found that two RNA samples (represented as numbers 77 and 54, Supplementary Figure 2), which belonged to the AMCT and AMTB groups infected with Mtb, were grouped as uninfected samples. These samples were considered as outliers and were removed from the analysis in the subsequent steps. In contrast, although SMs constitute a separate group from AMs, they are not discriminated between NI samples and samples infected with Mtb. This grouping was not discriminated between the infection with the clinical isolates UT127 and UT205, suggesting a lower response to Mtb infection compared to AMs. A sample of RNA from SMs infected with UT127 (represented as numbers 15, Supplementary Figure 2) was removed from the analysis through preprocessing and quality. The final analyses were performed with 35 RNA samples.
Based on this clustering, a statistical analysis was carried out to identify DEGs in each group. DEGs were selected considering the non-infected samples in each group. In response to infection with Mtb UT127, AMCT exhibited 97 DEGs; AMTB, 105 DEGs; and SMs, 18 DEGs. In response to infection with UT205, AMCTs exhibited 91 DEGs and AMTBs exhibited 60 DEGs, while SMs did not show DEGs (Figure 1A). A full list of DEGs for each group is provided in Supplementary Table 1.
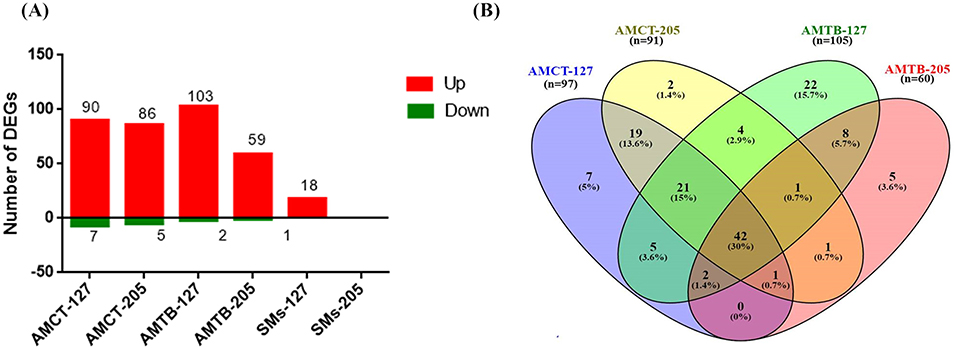
Figure 1. Number and comparison of differentially expressed genes (DEGs) in human tissue macrophages infected with M. tuberculosis. (A) The amount of upregulated (red) and downregulated (green) DEGs (1.5 log2-fold, p ≤ 0.05) in alveolar macrophages (AMs) from control (AMCT, n = 4), TB patients (AMTB, n = 4), and splenic macrophages (SMs, n = 5) infected with M. tuberculosis clinical strains UT127 or UT205. (B) Venn diagram comparing DEGs in AMCTs and AMTBs infected with M. tuberculosis strains UT127 and UT205.
Transcriptomic Response of AMCTs and AMTBs to Infection With Mtb UT127 and UT205
To identify changes in transcriptional profiles and differential gene expression levels between Mtb-infected human AMs, we compared the transcriptomes of AMCTs and AMTBs infected with clinical isolates UT127 and UT205 (Figure 1B). Supplementary Table 2 shows the list of unique and shared genes in each comparison.
The comparison of the transcriptional profiles showed that most of the DEGs were shared among all the groups, while few genes were associated with specific response to the infection with the Mtb clinical isolates (Figure 1B). In all comparisons, the common genes were expressed in the same direction. In terms of the magnitude of expression, Log2FC values were higher in response to infection with UT127 in both AMCTs and AMTBs, whereas in response to infection with UT205, the Log2FC values were lower (Supplementary Table 2).
Initially, we searched for the common DEGs of macrophages infected with Mtb, independent of the type of macrophage or Mtb isolate, defining a core macrophage transcriptome. The pairwise analysis revealed 67 genes (47.7%) that were shared among three or four groups and represented a global macrophage transcriptional response to Mtb infection. Of these, 42 genes (30%) were common in all groups and upregulated, except the PDK4 gene, which was downregulated. Twenty-one genes (15%) were common among AMCT-127, AMCT-205, and AMTB-127, of which 20 genes were upregulated, and one gene (GPR34) was downregulated. Two upregulated genes (1.4%) (RSAD2 and SLAMF1) were common among AMCT-127, AMTB-127, and AMTB-205, and the MARCKS gene (0.7%) was common among AMCT-127, AMCT-205, AMTB-205, and CXCL11 (0.7%), which was common between AMCT-205, AMTB-127, and AMTB-205, respectively (Figure 1B, Supplementary Table 2).
As expected, many upregulated genes present in the common transcriptome of macrophages that respond strongly to Mtb infection are involved in the activation and recruitment of antimicrobial mechanisms relevant to TB pathophysiology. Genes encoding cytokines, such as IL1B, IL6, TNF, and CCL5, and chemokines such as CCL20, CCL4L1, CCL3, CCL3L1, CCL4L1, CCL4L2, and CCL8, are associated with recruitment of monocytes and macrophages during granuloma formation (43, 44). In addition, CXCL10 and CXCL8 were upregulated; both being useful markers for monitoring treatment in adults with active TB (45, 46) and strong chemoattractants of T cells, monocytes, and neutrophils (47, 48). Several IFN-inducible GTPases (GBPs), including GBP1, GBP4, and GBP5, IFN-stimulated genes (ISGs), such as ISG20, RSAD2, and IRF1 (interferon-regulatory factors 1), and pro-apoptotic genes (PTGS2) were also induced. Only two genes (PDK4 and GPR34) with a deficiency in mice were associated with an altered immune response in TB (49, 50) and downregulated. To obtain more information on the functional organization of the genes, they were subjected to functional enrichment and network interaction analysis (Figure 2). Functional categories (GO) and pathways (KEGG) associated with Mtb infection in AMCTs and AMTBs, responding to a robust inflammatory response to lipopolysaccharide, the TNF signaling pathway, cytokines and chemokines, activation of toll-like receptors (TLRs) and the NF-kappa B signaling pathway, and TB, are relevant (Figure 2A). The interaction network (Figure 2B) showed nodes of genes significantly associated with the functional categories described in Figure 2A. Interestingly, the level of significance of the functional categories enriched in AMTBs infected with Mtb UT205 was lower than that in the rest of the groups.
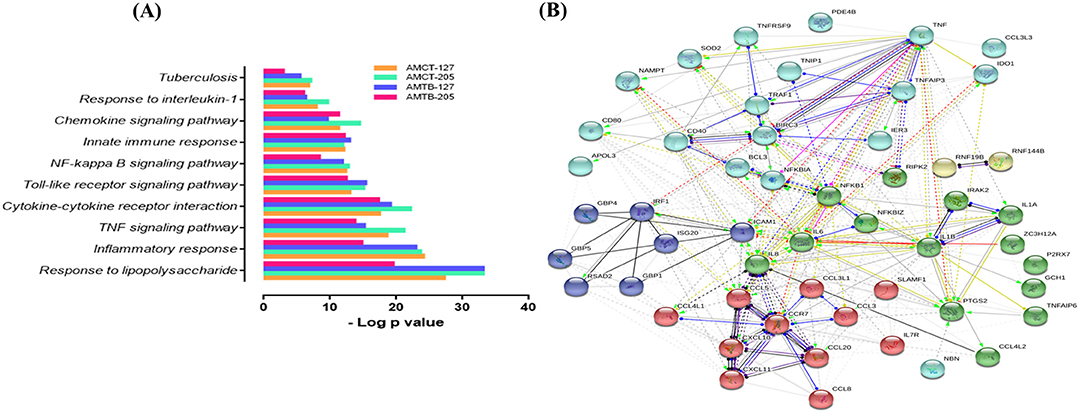
Figure 2. Global response of macrophages to infection with M. tuberculosis. (A) Functional categories (GO and KEGG pathways) were significantly enriched (FDR ≤ 0.01) among DEGs expressed in alveolar macrophages (AMs) from control subjects (AMCTs) and TB patients (AMCTs) infected with M. tuberculosis UT127 (AMCT-127, AMTB-127) or UT205 (AMCT-205, AMTB-205). (B) Functional protein:protein association network (by GO and KEGG) of 67 correlated genes that were shared among AMCTs and AMTBs infected with M. tuberculosis and representing a global macrophage transcriptional response to M. tuberculosis infection.
Cell-Type-Specific Response to M. tuberculosis Infection
Next, we compared the response of AMCTs and AMTBs to infection with the clinical isolates of Mtb to better differentiate the effect of Mtb infection in AMTBs. In general, the transcriptome of AMCTs in response to infection with both strains, UT127 and UT205, was similar; however, a lower response (few genes expressed exclusively) was induced with clinical isolate UT205. Thus, 19 genes (13.6%) were commonly expressed in AMCTs infected with UT127 and UT205 (Figure 1B, Supplementary Table 2), of which 16 genes were upregulated and encoded chemokines, such as CXCL1 and CXCL5, Src family tyrosine kinase (HCK), tryptophan metabolism enzymes such as kynureninase (KYNU), and IFN-inducible GTPases such as GBP2 and interferon gamma receptors such as IFNGR2 (Figure 3A). Only three genes, CABLES1, TBC1D2, and TNFRSF2, without a known function during Mtb infection were downregulated (Figure 3A).
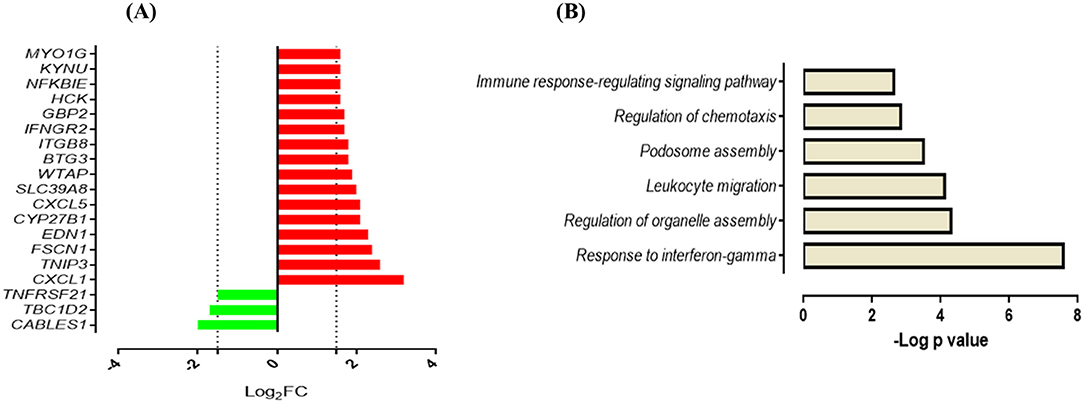
Figure 3. Response of AMCTs to infection with M. tuberculosis (A). List of common upregulated (red) and downregulated (green) DEGs (n = 19) expressed in AMCTs infected with UT127 and UT205. (B). Functional categories of biological processes by GO and KEGG pathways were significantly enriched.
Functional analysis of the upregulated genes showed enrichment in biological processes associated with the gamma interferon (IFN-γ) response (CYP27B1, GBP2, IFNGR2), regulation of organelle assembly (EDN1, HCK, TBC1D2, FSCN1), migration of leukocytes (EDN1, CXCL1, HCK, CXCL5, MYO1G), podosome assembly (HCK, FSCN1), regulation of chemotaxis (CXCL1 and CXCL5), and immune response-regulating signaling pathway (TNFRSF21, MYO1G, TNIP3) (Figure 3B). In contrast, seven genes (5%) were differentially expressed in response to infection with clinical isolate, UT127 (Figure 1B, Supplementary Table 2), of which five genes were upregulated, including FAM129A, GJB2, and ZSWIM4, and signaling receptors, such as ADORA2A, and prostaglandin E receptor 4 (PTGER4), were significantly enriched in a single functional category, such as negative regulation of inflammatory response (p = 5.75 × 10⁻⁴). Only the HES2 gene (hes family bHLH transcription factor 2), associated with the metabolism of retinoic acid (51, 52), and DHRS3 (dehydrogenase/reductase) were downregulated.
Conversely, infection of AMCTs with UT205 resulted in the upregulation of only two genes (1.4%). The G0S2 gene function inhibits the lipolytic enzyme adipose triglyceride lipase (ATGL) and is involved in cellular proliferation and differentiation (53). The IL4I1 gene encodes an immunosuppressive enzyme (L-phenylalanine oxidase) that inhibits T-cell proliferation via H2O2 production (54) and is highly expressed in macrophages and DCs of granulomas from sarcoidosis and TB (55). In the present study, no significant functional categories or association networks were observed using the bioinformatics tools.
The response of AMTBs to Mtb infection indicated a higher induction of genes with the clinical isolate, UT127, compared with the transcriptional response induced by UT205. Thus, 22 genes (15.7%) were exclusively upregulated in response to infection with UT127 (Figure 1B, Supplementary Table 2), including receptors (AIM2, CD274, CD83, FCGR1A, and GPR132), enzymes (B4GALT5, GK, MTHFD2, PIM1, and WARS), cytokines (IL15, IL27, TNFAIP8, and TNFSF10), IFN-inducible genes (IFI44L and IFIH1), protein-trafficking (LAMP3, ANKRD22, RFTN1, and STX11), and transcription factors (ARID5B and STAT4). These genes were enriched in biological functional categories, including positive regulation of cytokine production (IL27, CD274, IL15, IFIH1, CD83, and AIM2), defense response to other organisms (IFI44L, IL27, IL15, IFIH1, and AIM2), interleukin-17 production (RFTN1, IL15), interleukin-10 production (CD274, CD83), aminoglycan metabolic process (IL15, PIM1, B4GALT5), regulation of cell–cell adhesion (IL27, CD274, IL15, CD83), and regulation of peptidase activity (TNFAIP8, LAMP3, TNFSF10, AIM2) (Figure 4A). The interaction network (Figure 4B) features nodes of genes (indicated in different colors) significantly associated with the functional categories described in Figure 4A.
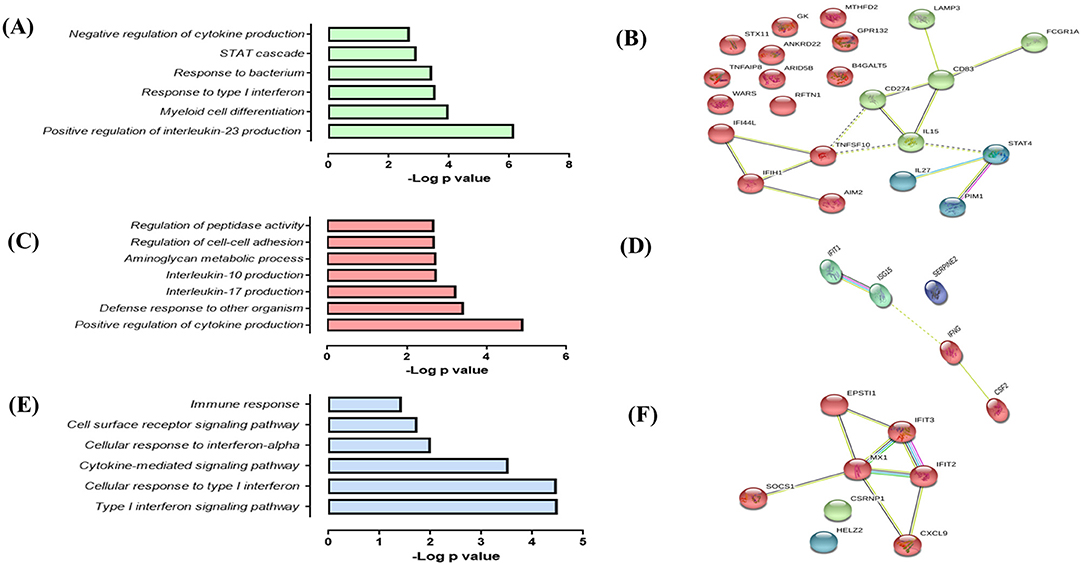
Figure 4. Response of alveolar macrophages (AMs) from TB patients (AMTBs) to infection with M. tuberculosis (A,C,E). Functional categories (biological process by GO and KEGG) in response unique to infection with UT127 (A), UT205 (C), or common DEGs of AMTBs upon infection with M. tuberculosis. (C) Functional association networks of protein–protein interactions were analyzed using String software (B,D,F). Association of upregulated DEGs (n = 22) in response to infection with M. tuberculosis UT127 (B), upregulated DEGs (n = 5) in response to infection with M. tuberculosis UT205, and commonly upregulated genes (n = 8) upon infection with M. tuberculosis UT127 or UT205.
In response to infection with UT205, AMTBs induced the expression of five genes (3.6%) (Figure 1B, Supplementary Table 2) associated with positive regulation of interleukin-23 production (CSF2, IFNG), myeloid cell differentiation (CSF2, IFNG, ISG15, SERPINE2), response to type I IFN, and negative regulation of cytokine production (IFIT1, ISG15) (Figures 4C,D).
Eight upregulated genes (5.7%) were common to infection of AMTBs with both clinical isolates of Mtb (Figure 1B, Supplementary Table 2) and were mainly associated with functional categories of ISGs (Figures 4E,F), including IFIT2, IFIT3, MX1, HELZ2, EPSTI1, CSRNP1, and CXCL9, which are induced by IFN-γ and participate in the recruitment of activated CD4 T cells and monocytes (56). Of interest, the SOCS1 gene (suppressor of cytokine signaling 1) was differentially expressed by AMTBs in response to Mtb. SOCS1 modulates immunity and inflammation, providing negative feedback to suppress cytokine activities, such as those dependent on IFN-γ (57). Recent studies have indicated that SOCS1 expression is higher in patients with active TB than in healthy subjects (58, 59). SOCS1 has also been reported to be associated with caseous necrosis in granulomas from patients with TB lymphadenitis (59).
SMs Display a Distinct and Attenuated Response to Infection With Mtb Clinical Isolates UT127 and UT205
In response to infection with Mtb UT127, SMs expressed 18 upregulated genes (Figure 5A), whereas in response to infection with UT205, SMs did not exhibit DEGs.
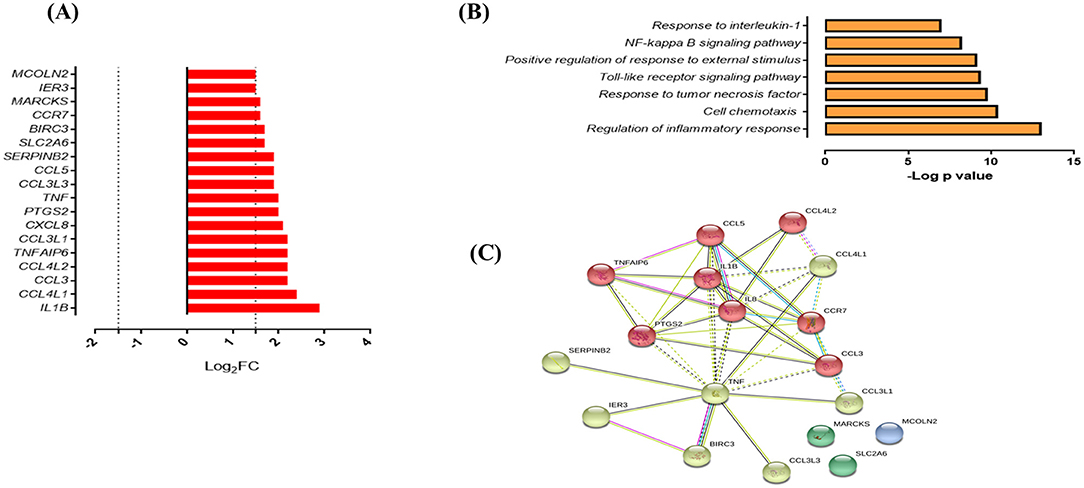
Figure 5. Response of SMs to infection with M. tuberculosis. (A) List of upregulated genes (red) expressed (log2 fold) in response to infection with M. tuberculosis UT127 (n = 18). (B) Functional categories (biological process by GO and KEGG) in response to infection with M. tuberculosis UT127. (C) Functional protein:protein association network of 18 genes upregulated in response to infection with UT127 as defined by the String database.
Functional analysis of these genes was mainly associated with the response to chemotaxis cells (CCL3, CCL3L1, CCL3L3, CCL4L1, CCL4L2, CCL5, CCR7, CXCL8, and IL1B), inflammatory response, and response to tumor necrosis factor (BIRC3, PTGS2, TNF, and TNFAIP6), response to interleukin-1 (CXCL8, CCL4L1, CCL3L3, CCL3, and CCL5), and regulation of response to external stimulus (SERPINB2, IER3, BIRC3, PTGS2, and TNFAIP6) (Figure 5B). The interaction network (Figure 5C) features nodes of genes significantly associated with the functional categories described in Figure 5B. Of these genes expressed by SMs in response to infection with UT127, 17 genes were common to AMs response to infection with Mtb (although with a lower fold-change compared to AM), whereas only one gene (SERPINB2) was expressed exclusively by SMs (data not shown). Although SMs featured few functional categories in response to infection with UT127, these were common to the functional categories found in AMs and therefore reflect the response of macrophages to Mtb infection.
Canonical Pathways and Network Analysis of DEGs
Canonical pathways and networks along with molecular and cellular functions were significantly identified (p < 0.01) and Z score that predicted activation (≥2) or repression (≤ 2) in AMCTs, AMTBs, and SMs infected with Mtb UT127 and UT205. A complete list of all the enriched pathways for each condition is shown in Supplementary Table 3.
A comparative analysis was aimed at visualizing the canonical pathways and upstream regulators across all conditions (Figure 6). Figure 6A displays the canonical pathways enriched in all groups, which were associated mainly with immune response reacting to Mtb infection. Most of the pathways were activated (Z score ≥2) in AMCTs and AMTBs; however “iNOS signaling,” “TNFR1 signaling,” “TNFR2 signaling,” “PI3K/AKT signaling,” “MIF regulation of innate immunity,” and “Apoptosis signaling” were only activated in AMCT-127 and AMCT-205, while “Interferon signaling” and “Activation of IRF cytosolic pattern recognition receptors” were pathways activated exclusively in AMTBs in response to infection with UT127 and UT205. All groups, including SMs, activated the canonical “TREM1 signaling,” while “Inflammasome pathway” was only activated in AMTB-127. In contrast, “LXR/RXR Activation” and “PPAR Signaling” were inhibited (Z score ≤ 2).
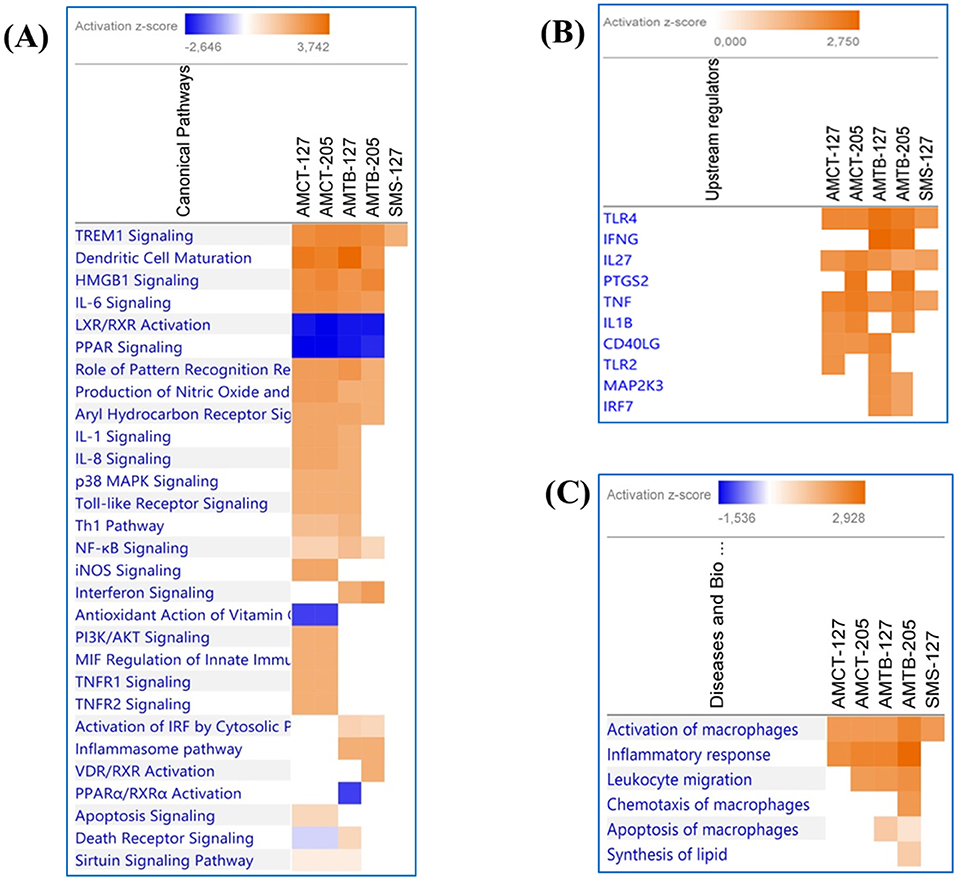
Figure 6. Comparison of significant canonical pathways and upstream regulators in AMCTs, AMTBs, and SMs infected with M. tuberculosis identified by the Ingenuity Pathway Analysis (IPA). (A) Top enriched canonical pathways, (B) upstream regulators, and (C) diseases and biological functions in AMCTs, AMTBs, and SMs infected with M. tuberculosis. Pathways were ranked according to the enrichment score (Fisher's exact test p value ≤ 0.05), and the Z score that predicts activation (≥2) or repression (≤ 2).
The upstream analysis revealed the activation of molecules, receptors, and transcriptional regulators of which prediction is based on DEGs in each group of macrophages (AMCTs, AMTBs, and SMs) in response to Mtb infection, which can be important during TB (Figure 6B). Thus, TLR4, IL27, and TNF were activated across all groups; IFNG was exclusively activated by AMTB-127 and AMTB-205; PTGS2 was activated in AMCTs and AMTBs in response to infection with Mtb UT205, whereas TLR2 was only activated in response to Mtb UT127. The biological functions in AMCTs, AMTBs, and SMs infected with Mtb UT127 and UT205 were mainly associated with macrophage activation and inflammatory response (Figure 6C).
Based on the biological importance of the AMTB response in the immunopathology of TB, we constructed a model based on the canonical pathways activated in response to infection with Mtb clinical isolates (Figure 7). This model showed the enrichment of genes in “Interferon signaling” and the “Inflammasome pathway,” suggesting cross-talk of IFNs and AIM2 inflammasome pathways during active TB response.
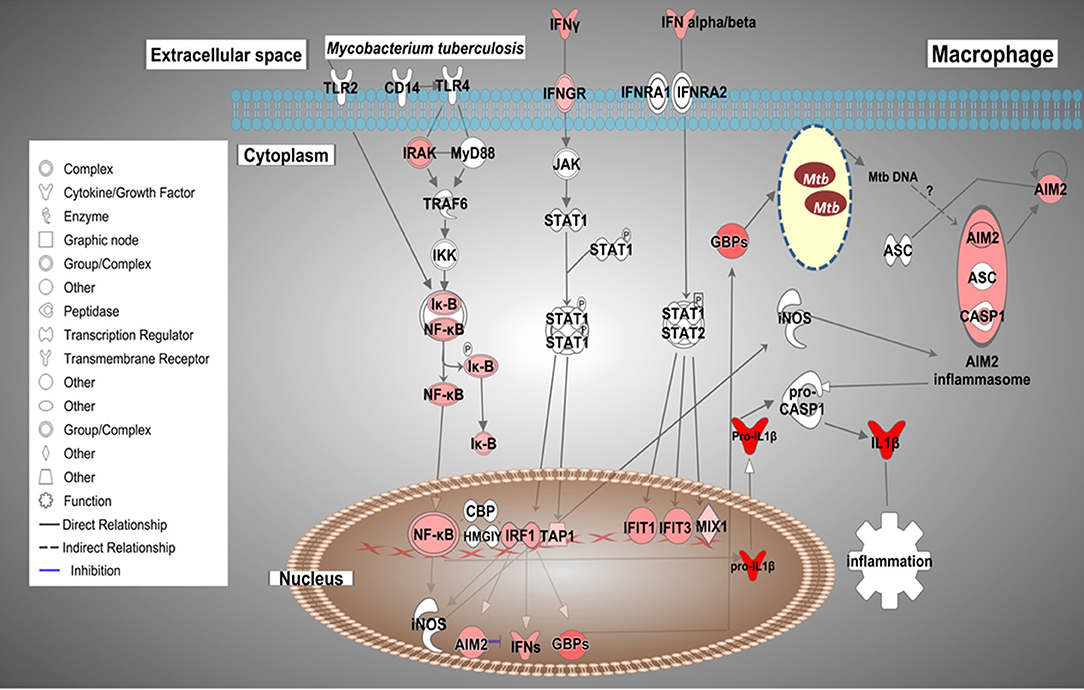
Figure 7. Possible cross-talk of IFNs and the AIM2 inflammasome pathways in AMs from TB patients (AMTB) modulated by M. tuberculosis. Upon recognition of mycobacterial components via TLR signaling and subsequent activation of the transcription factor, NF-kB, IFNs (type I and II) are expressed in AMs. IFNs bind to their specific receptors and activate the signaling pathway responsible for DNA transcription and expression of ISGs, including IRF1 as well as the inflammasome components, AIM2. IRF1 promotes the expression of GBPs and IFNs, mainly IFN-γ. GBPs permeabilize the membrane of Mtb, resulting in the release of bacterial DNA. M. tuberculosis cytosolic DNA is sensed by the AIM2 inflammasome. IRFs also stimulate the expression of antimicrobial genes, such as iNOS, which potentiates the activation of the AIM2 inflammasome. AIM2 promotes the maturation of pro-IL-1β to IL-1β, which has pro-inflammatory activity. The sustained production of IL-1β is based on AIM2-suppressing type I IFNs (see Discussion). Genes significantly upregulated are shown in red. The intensity of red corresponds to an increase in fold-change levels of AMTB infected with M. tuberculosis compared to control. Genes in white did not exhibit significant changes in expression. The network was generated with IPA (Fisher test, p value ≤ 0.05).
Technical Validation of Differential Expression by Quantitative Real-Time PCR
The results garnered by microarray were validated through qRT-PCR analysis evaluating the expression levels of four genes of interest (IL1B, IL8, TNF, and TNFAIP6), while the ACTB gene was used as the internal control. The relative expression showed that these genes were significantly upregulated (Supplementary Figure 3). The relative expression level of each gene was transformed into Log2FC and compared with the expression values obtained by microarray, and the results from the two techniques were complementary (Supplementary Figure 4).
Discussion
Macrophages are considered the first line of defense against respiratory pathogens and play essential roles in the pathophysiological response to Mtb infection in humans (60). AMs constitute the initial niche in which a proinflammatory response is triggered upon Mtb infection. However, under certain circumstances, Mtb can be disseminated to other organs and tissues by interacting with alternative macrophage populations. Remarkably, the response to Mtb infection by AMs from TB patients is poorly known, and very little is known about the transcriptomic response of extrapulmonary macrophages to Mtb infection.
AMs of TB Patients Respond to Infection With Virulent Mtb Clinical Isolates, With Upregulation of Genes Associated With IFN Signaling Pathways
Compared to AMCTs, infection of AMTBs with Mtb induced the expression of ISGs, by upregulating IFIT family genes and GBPs. In addition, essential ISGs, including IRF1 as well as the inflammasome component AIM2, were upregulated in AMTBs. IRF1 is a transcription factor that regulates the expression of GBPs, a family of large GTPases with antimicrobial functions by the destruction of vacuoles containing pathogens, inducing inflammasome assembly and autophagy (61). GBPs limit cytosolic bacteria and expose them to cytosolic PRRs and PAMPs, such as dsDNA (62). In murine macrophages exogenously treated with IFN-γ and infected with Mycobacterium bovis, BCG attenuation of Gbp1, Gbp5, or Gbp7 expression reversed the anti-mycobacterial effect of IFN-γ (63), demonstrating the importance of GBPs in mycobacterial infection. The role of IFIT family during Mtb infection remains unknown. In contrast to our observation of IFIT1 upregulation in AMs, a recent study showed that the IFIT1 gene was one of the most downregulated genes in murine BMDMs infected with Mtb H37Rv for 4 days (64). Although no anti-mycobacterial effects were attributed to IFIT1, an early anti- or pro-mycobacterial effect depending on Mtb strain or virulence and macrophage species cannot be ruled out.
Cytosolic dsDNA sensors, such as cGAS or AIM2, recognize mycobacterial DNA in the cytosol (65), and this recognition depends on the phagosomal rupture induced by the mycobacterial ESX-1 transport system (66–68). Interestingly, two recent reports in bovine AMs infected with M. bovis or Mtb H37Rv have also highlighted the role of TLR signaling and nucleic acid recognition in the innate immune response to mycobacterial antigens (69, 70), indicating a clear parallel between the human and bovine AM response to mycobacterial infections.
Notably, the AIM2 inflammasome is involved in the activation of mouse macrophages during infection with a virulent M. bovis strain presumably translocated to the cytosol (71). Macrophages from AIM2-deficient mice were highly susceptible to intratracheal infection with Mtb, and this deficiency resulted in severe inhibition of the AIM2 inflammasome, associated with defective IL1 and IL18 production and impaired Th1 responses (72).
The IL1 family of cytokines, including IL-1β, possesses potent pro-inflammatory activities (73) and is responsible for host defense against mycobacteria (74–76). We previously reported the baseline transcriptome of uninfected bystander AMTBs (26), where the IL1B gene was downregulated. However, in the present study, we showed that after infection with Mtb, AMTBs upregulated the IL1B gene. Consequently, these results suggest that the expression of IL1B may depend on the AIM2 signaling pathway in response to Mtb infection, mainly based on the clinical isolate, UT127. Thus, we speculate that Mtb or Mtb DNA may translocate to the cytosol and activate the AIM2 inflammasome. The mechanisms of Mtb DNA recognition in the cytosol by the AIM2 inflammasome remain unexplored.
Previous evidence indicates that AIM2 might be involved in the signaling pathway responsible for the suppression of type I IFNs (IFN-β) (3, 77). Mtb infection induces IFN-β expression, resulting in suppression of IL-1β production by mouse macrophages and dendritic cells (76) as well as human MDMs (77). As type I IFNs contribute to impaired host resistance to Mtb in mice (78–80), it may be possible that AIM2 participates in two signaling pathways: mediating the inflammasome-dependent processing of the IL1 family of cytokines, and the second mediating activation of pathways that may sustain the production of IL-1β by suppressing type I IFNs. Our findings suggest a critical role for AIM2 in Mtb infection. Based on these findings, we propose a model of cross-talk of ISGs and AIM2 inflammasome pathways/IL1B, which can be modulated by mycobacterial DNA inside infected AMs during TB (Figure 7).
Several studies support the finding that IFN-β promotes Mtb infection, while IFN-γ may exert a protective effect against Mtb (81, 82). Given that ISGs are induced by both type I IFN and type II IFN, our data suggest that both signaling pathways might be modulated in AMs during TB disease. These observations indicate that host control of Mtb and pathology may depend on the relative balance of type I and type II IFN functions.
FCGR1A was also expressed upon infection with Mtb. FCGR1A expression is induced by IFN-γ in monocytes and macrophages while also playing a critical role in the clearance of immune complexes and antibody-dependent cytotoxicity (83). Recently, it was determined that a subset of transcripts enriched for IgG receptors was present in the whole blood of symptomatic TB patients and individuals with subclinical disease, suggesting an early cellular response to antigen/antibody complexes during TB disease in HIV-infected individuals (84). Additionally, the higher expression levels of FCGR1A in TB patients regardless of HIV status or genetic background have been considered a remarkable and consistent classifier of active disease (85). FCGR1A, in combination with other genes, has evident discriminatory power between TB and latent TB infection (86, 87). Functional correlations of pathogenesis-driven gene expression signatures in TB indicate that FCGR1A is associated with apoptotic and pro-inflammatory regulators (88). Previous findings in South African TB patients showed a significant reduction in FCGR1A expression following treatment for TB (87). Therefore, we suggest that the expression of FCGR1A in AMTBs could indicate the likely importance of this receptor in TB pathogenesis and reinforces its possible use as a biomarker. However, these findings require further validation.
Additionally, the transcriptional signature observed in AMTBs in response to Mtb infection was associated with myeloid cell inflammation and TREM1 signaling as a top-scoring canonical pathway across all macrophage populations evaluated in this study (AMCTs, AMTBs, and SMs) (Figure 6A). Our findings are in line with recently published reports (15), indicating TREM1 as a top inflammatory signaling pathway playing a critical role in controlling inflammatory processes.
Overall, the response of AMTBs to Mtb infection is dominated by IFN-signaling pathways and associated genes (GBPs, ISGs, and IFITs), the implications of which are still under review. In addition to the IFN-signaling signature, several vital pathways in active TB, such as the inflammasome (AIM2), FC pathway receptor (FCGR1A), and myeloid inflammatory pathway (TREM1), were upregulated. However, the specific order in which these processes occur during the earliest stages of the disease are yet to be elucidated. Understanding the early host–pathogen interaction at the onset of infection and active disease may provide insights that could lead to novel approaches to diagnose and manage subclinical disease. To the best of our knowledge, no study has reported such signaling pathways in AMTBs so far.
SMs Showed an Attenuated Gene Expression Profile in Response to Infection With Mtb Clinical Isolates
In situations of immunosuppression, Mtb spreads to other organs and tissues, generating extrapulmonary forms of TB. Mtb DNA has been amplified from biopsies of organs belonging to individuals whose death was not because of TB (13), suggesting that even in conditions of latent TB, the bacillus could spread to different organs, and the biology of the infection is virtually unknown.
The analysis of the mRNA profiles of SMs infected with the clinical isolates showed a low level of differential gene expression with UT127 infection, and no DEGs were found with clinical isolate UT205 compared with non-infected SMs. These results suggest critical differences between AMs and SMs in their capacity to respond to Mtb.
Functional analysis of upregulated genes by UT127 was mainly associated with pro-inflammation, which could be sustained with the previous results of our group where non-infected SMs produced high basal levels of IL-10 but low levels of IL-12p70, resembling anti-inflammatory macrophages (31). Interestingly, in conditions mimicking high mycobacterial proliferation, SMs produced large amounts of IL-12p40 but not IL-12p70, resembling pro-inflammatory macrophages (31).
Surprisingly, infection with UT205 did not show any DEGs compared with non-infected SMs. We observed that in AMs, the response to infection with clinical isolate UT205 was attenuated when considering the number of DEGs, the magnitude of expression, p values of enrichment in functional analysis, and type of induced immune response compared with the response observed with UT127. Our group has provided evidence that these clinical isolates are phenotypically different at the level of cell death, cytokine production, growth kinetics upon in vitro infection of human tissue macrophages, membrane vesicle secretion upon culture in synthetic medium, and in their transcriptional strategy to adapt to the stressful conditions imposed by a carbon-poor medium (23, 24).
Recent evidence has shown that different macrophage populations display a distinct response to Mtb infection. For example, in mouse models, AMs are less capable of controlling infection compared to lung interstitial macrophages (89). In addition, SMs from infected mice displayed attenuated metabolomic profiling in response to Mtb infection compared to AMs (90). This difference may be sustained, at least in part, based on the observation that SMs and AMs display distinct transcriptomic profiles (91, 92). Therefore, our results extend and reinforce the fact that a particular response depends on the macrophage population involved, and, importantly, the attenuated response of SMs compared to AMs, which may suggest a better adaptation of Mtb to lung infection compared to extrapulmonary infections.
The Differential Transcriptomic Response to UT127 and UT205 Suggests Differences in Virulence
Throughout the entire study, we analyzed the impact of the infection by the two clinical isolates, UT127 and UT205, on the immune response of AMs and SMs. In general, both clinical isolates exhibited overlapping changes in the expression of specific genes and pathways, probably reflecting their genome similarity. However, a marked specific response was also observed for each clinical isolate. Interestingly, UT205 induced a low or no transcriptional response in AMCTs, AMTBs, and SMs, compared to the response induced by UT127. Therefore, we suggest that the low immune response observed after AM infection with clinical isolate UT205 and the non-expression of genes seen in SMs infected with UT205 could be partially based on the immune evasion pathways activated by a virulence strain to avoid being sensed by macrophages.
Both clinical isolates not only differentially induced the expression of ISGs via activating type I and type II IFN signaling pathways, differences were also observed in Z score values through the enrichment of pathways in IPA between clinical isolates UT127 and UT205 (Supplementary Table 3). We speculate that these differences could be due to differential gene expression in different isolates at early stages of infection. Usually, ISGs act as protective immune effectors in host fighting against pathogen infection, but some of them can also be exploited by pathogens to negatively regulate the immune response and help them survive within the host (93, 94). Therefore, the varied, and sometimes paradoxical, effects of IFNs on Mtb infection can be caused by different types and functions of ISGs. These findings provide insight into a combination of host factors and Mtb virulence factors that can influence multiple aspects of the host-immune response during active TB, and which could define the gene expression profiles seen in AMTBs.
Notable limitations of the present study include the small number of samples used, which may be explained by the challenges in obtaining BALs and macrophages from healthy people and TB patients, as well as splenic samples from deceased patients. However, the sample size used was sufficient to achieve statistical significance between the studied groups. The methodological strategy for selection of DEGs, including a robust normalization procedure, cutoffs for FC, and p values, allowed us to confidently detect sets of biologically relevant genes. Although microarrays have quantitative and qualitative limitations compared with more robust methods, like RNA-seq, its analytical platform is well-developed for generating reliable results. Whether our observations extend to other cases with active TB from different ancestry and/or infected with clinical strains of the LAM family or other families of Mtb, they need to be replicated in future studies using a larger number of samples. All samples studied were obtained from individuals from the Mestizo population of residents in the metropolitan area of Medellin. Different genetic studies have characterized the ancestry component of this Mestizo population showing mostly a European ancestry (95–97), therefore reducing the potential bias of in transcriptomic responses based on genetic differences among populations with different ancestry (98).
In conclusion, in this pilot study, we have provided, for the first time, evidence indicating that two human tissue macrophage populations show a distinctly differential transcriptional response to infection with circulating clinical strains of M. tuberculosis. The observed differences between AMs and SMs illustrate the higher pro-inflammatory capacity of AMs relative to SMs, which may suggest a better Mtb adaptation to the cellular microenvironment of AMs. Of note, AMTB patients express genes previously associated with the intracellular control of the infection as well as dysregulated genes associated with the compromised capability of macrophages to contain Mtb infection. In this sense, the early balance between the anti-mycobacterial activities of macrophages and the capacity of Mtb to adapt to the cellular microenvironment might be essential for defining appropriate strategies to contain Mtb infection. Finally, the use of circulating clinical strains of Mtb, instead of H37Rv, permitted us to observe a distinct transcriptomic response to both isolates. This last observation may partially explain the differences observed in the severity of TB disease and the response to TB treatment in different human populations.
Data Availability Statement
All data have been submitted to the NCBI gene expression omnibus (GEO) database with accession number GSE139825.
Ethics Statement
This study was approved by the Ethical Committee of the Faculty of Medicine, Universidad de Antioquia, Colombia, and by the Ethical Committee of Clínica Cardiovascular Santa María, Medellín, Colombia. Written consent was voluntarily signed by all pulmonary TB patients (PTB) and control subjects (CT) before sample acquisition. The patients/participants provided their written informed consent to participate in this study.
Author Contributions
LL performed the experiments, collected and analyzed the data, and wrote the manuscript. HO collected and analyzed the data. LB designed the study, interpreted the data, and wrote the manuscript.
Funding
This work was supported by Colciencias, Bogotá, Colombia, LB grant 1115-519-29046, and Programa de Sostenibilidad 2015-2016, Universidad de Antioquia, Medellín, Colombia.
Conflict of Interest
The authors declare that the research was conducted in the absence of any commercial or financial relationships that could be construed as a potential conflict of interest.
Acknowledgments
We wish to acknowledge all patients with pulmonary tuberculosis and controls who voluntarily donated BAL samples.
Supplementary Material
The Supplementary Material for this article can be found online at: https://www.frontiersin.org/articles/10.3389/fimmu.2020.00630/full#supplementary-material
Abbreviations
AMs, alveolar macrophages; AMCT, alveolar macrophages from control subjects; AMTB, alveolar macrophages from tuberculosis patients; BAL, bronchoalveolar lavage; DEGs, differentially expressed genes; FC, fold-change; FDR, false discovery rate; IFIT, interferon-induced proteins with tetratricopeptide repeats; ISG, interferon-stimulated genes; GBP, guanylate-binding proteins; MDMs, monocyte-derived macrophages; MOI, multiplicity of infection; MPS, mononuclear phagocytic system; Mtb, Mycobacterium tuberculosis; PAMP, pathogen-associated molecular patterns; PRR, pattern recognition receptors; PTB, pulmonary tuberculosis; TB, tuberculosis.
References
1. Bloom B R, Atun R, Cohen T, Dye C, Fraser H, Gomez GB, et al. Tuberculosis. In: Rd KK, Holmes S, Bertozzi B, Bloom R, Jha, P, editors. Major Infectious Diseases. Washington, DC: The International Bank for Reconstruction and Development/The World Bank (2017).
3. Mayer-Barber K D, Barber DL. Innate and adaptive cellular immune responses to Mycobacterium tuberculosis infection. Cold Spring Harb Perspect Med. (2015) 5:a018424. doi: 10.1101/cshperspect.a018424
4. Gengenbacher M, Kaufmann SH. Mycobacterium tuberculosis: success through dormancy. FEMS Microbiol Rev. (2012) 36:514–32. doi: 10.1111/j.1574-6976.2012.00331.x
5. Cooper AM. Mouse model of tuberculosis. Cold Spring Harb Perspect Med. (2014) 5:a018556. doi: 10.1101/cshperspect.a018556
6. Jo EK. Mycobacterial interaction with innate receptors: TLRs, C-type lectins, and NLRs. Curr Opin Infect Dis. (2008) 21:279–86. doi: 10.1097/QCO.0b013e3282f88b5d
7. Ahmad S. Pathogenesis, immunology, and diagnosis of latent Mycobacterium tuberculosis infection. Clin Dev Immunol. (2011) 2011:814943. doi: 10.1155/2011/814943
8. Mortaz E, Adcock IM, Tabarsi P, Masjedi MR, Mansouri D, Velayati AA, et al. Interaction of pattern recognition receptors with Mycobacterium tuberculosis. J Clin Immunol. (2015) 35:1–10. doi: 10.1007/s10875-014-0103-7
9. Cohen SB, Gern BH, Delahaye JL, Adams KN, Plumlee CR, Winkler JK, et al. Alveolar macrophages provide an early Mycobacterium tuberculosis niche and initiate dissemination. Cell Host Microbe. (2018) 24:439–46. e434. doi: 10.1016/j.chom.2018.08.001
10. Huang L, Nazarova EV, Russell DG. Mycobacterium tuberculosis: bacterial fitness within the host macrophage. Microbiol Spectr. (2019) 7:1–12. doi: 10.1128/microbiolspec.BAI-0001-2019
11. Ramakrishnan L. Revisiting the role of the granuloma in tuberculosis. Nat Rev Immunol. (2012) 12:352–66. doi: 10.1038/nri3211
12. Ketata W, Rekik WK, Ayadi H, Kammoun S. Extrapulmonary tuberculosis. Rev Pneumol Clin. (2015) 71:83–92. doi: 10.1016/j.pneumo.2014.04.001
13. Barrios-Payan J, Saqui-Salces M, Jeyanathan M, Alcantara-Vazquez A, Castanon-Arreola M, Rook G, et al. Extrapulmonary locations of Mycobacterium tuberculosis DNA during latent infection. J Infect Dis. (2012) 206:1194–205. doi: 10.1093/infdis/jis381
14. Silver RF, Walrath J, Lee H, Jacobson BA, Horton H, Bowman MR, et al. Human alveolar macrophage gene responses to Mycobacterium tuberculosis strains H37Ra and H37Rv. Am J Respir Cell Mol Biol. (2009) 40:491–504. doi: 10.1165/rcmb.2008-0219OC
15. Papp AC, Azad AK, Pietrzak M, Williams A, Handelman SK, Igo RP, et al. AmpliSeq transcriptome analysis of human alveolar and monocyte-derived macrophages over time in response to Mycobacterium tuberculosis infection. PLoS ONE. (2018) 13:e0198221. doi: 10.1371/journal.pone.0198221
16. Wang JP, Rought SE, Corbeil J, Guiney DG. Gene expression profiling detects patterns of human macrophage responses following Mycobacterium tuberculosis infection. FEMS Immunol Med Microbiol. (2003) 39:163–72. doi: 10.1016/S0928-8244(03)00223-2
17. Volpe E, Cappelli G, Grassi M, Martino A, Serafino A, Colizzi V, et al. Gene expression profiling of human macrophages at late time of infection with Mycobacterium tuberculosis. Immunology. (2006) 118:449–60. doi: 10.1111/j.1365-2567.2006.02378.x
18. Blischak JD, Tailleux L, Mitrano A, Barreiro LB, Gilad Y. Mycobacterial infection induces a specific human innate immune response. Sci Rep. (2015) 5:16882. doi: 10.1038/srep16882
19. Sampath P, Moideen K, Ranganathan UD, Bethunaickan R. Monocyte subsets: phenotypes and function in tuberculosis infection. Front Immunol. (2018) 9:1726. doi: 10.3389/fimmu.2018.01726
20. Blankley S, Graham CM, Levin J, Turner J, Berry MP, Bloom CI, et al. A 380-gene meta-signature of active tuberculosis compared with healthy controls. Eur Respir J. (2016) 47:1873–6. doi: 10.1183/13993003.02121-2015
21. Roe JK, Thomas N, Gil E, Best K, Tsaliki E, Morris-Jones S, et al. Blood transcriptomic diagnosis of pulmonary and extrapulmonary tuberculosis. JCI Insight. (2016) 1:e87238. doi: 10.1172/jci.insight.87238
22. Burel JG, Babor M, Pomaznoy M, Lindestam Arlehamn CS, Khan N, Sette A, et al. Host transcriptomics as a tool to identify diagnostic and mechanistic immune signatures of tuberculosis. Front Immunol. (2019) 10:221. doi: 10.3389/fimmu.2019.00221
23. Isaza JP, Duque C, Gomez V, Robledo J, Barrera LF, Alzate JF. Whole genome shotgun sequencing of one Colombian clinical isolate of Mycobacterium tuberculosis reveals DosR regulon gene deletions. FEMS Microbiol Lett. (2012) 330:113–20. doi: 10.1111/j.1574-6968.2012.02540.x
24. Baena A, Cabarcas F, Alvarez-Eraso KLF, Isaza JP, Alzate JF, Barrera LF. Differential determinants of virulence in two Mycobacterium tuberculosis Colombian clinical isolates of the LAM09 family. Virulence. (2019) 10:695–710. doi: 10.1080/21505594.2019.1642045
25. Duque C, Arroyo L, Ortega H, Montufar F, Ortiz B, Rojas M, et al. Different responses of human mononuclear phagocyte populations to Mycobacterium tuberculosis. Tuberculosis. (2014) 94:111–22. doi: 10.1016/j.tube.2013.11.001
26. Lavalett L, Rodriguez H, Ortega H, Sadee W, Schlesinger LS, Barrera LF. Alveolar macrophages from tuberculosis patients display an altered inflammatory gene expression profile. Tuberculosis. (2017) 107:156–67. doi: 10.1016/j.tube.2017.08.012
27. Del Corral H, Paris SC, Marin ND, Marin DM, Lopez L, Henao HM, et al. IFNgamma response to Mycobacterium tuberculosis, risk of infection and disease in household contacts of tuberculosis patients in Colombia. PLoS ONE. (2009) 4:e8257. doi: 10.1371/journal.pone.0008257
28. Rojas M, Barrera LF, Puzo G, Garcia LF. Differential induction of apoptosis by virulent Mycobacterium tuberculosis in resistant and susceptible murine macrophages: role of nitric oxide and mycobacterial products. J Immunol. (1997) 159:1352–61.
29. Norden MA, Kurzynski TA, Bownds SE, Callister SM, Schell RF. Rapid susceptibility testing of Mycobacterium tuberculosis (H37Ra) by flow cytometry. J Clin Microbiol. (1995) 33:1231–7. doi: 10.1128/JCM.33.5.1231-1237.1995
30. Realpe T, Correa N, Rozo JC, Ferro BE, Gomez V, Zapata E, et al. Population structure among Mycobacterium tuberculosis isolates from pulmonary tuberculosis patients in Colombia. PLoS ONE. (2014) 9:e93848. doi: 10.1371/journal.pone.0093848
31. Henao J, Sanchez D, Munoz CH, Mejia N, Arias MA, Garcia LF, et al. Human splenic macrophages as a model for in vitro infection with Mycobacterium tuberculosis. Tuberculosis. (2007) 87:509–17. doi: 10.1016/j.tube.2007.07.002
32. Du P, Kibbe WA, Lin SM. lumi: a pipeline for processing Illumina microarray. Bioinformatics. (2008) 24:1547–8. doi: 10.1093/bioinformatics/btn224
33. Lin SM, Du P, Huber W, Kibbe WA. Model-based variance-stabilizing transformation for Illumina microarray data. Nucleic Acids Res. (2008) 36:e11. doi: 10.1093/nar/gkm1075
34. Smyth GK. Linear models and empirical bayes methods for assessing differential expression in microarray experiments. Stat Appl Genet Mol Biol. (2004) 3:Article3. doi: 10.2202/1544-6115.1027
35. Kanehisa M, Goto S, Kawashima S, Okuno Y, Hattori M. The KEGG resource for deciphering the genome. Nucleic Acids Res. (2004) 32:D277–80. doi: 10.1093/nar/gkh063
36. Szklarczyk D, Morris JH, Cook H, Kuhn M, Wyder S, Simonovic M, et al. The STRING database in 2017: quality-controlled protein-protein association networks, made broadly accessible. Nucleic Acids Res. (2017) 45:D362–8. doi: 10.1093/nar/gkw937
37. Kramer A, Green J, Pollard J Jr, Tugendreich S. Causal analysis approaches in ingenuity pathway analysis. Bioinformatics. (2014) 30:523–30. doi: 10.1093/bioinformatics/btt703
38. Sia JK, Rengarajan J. Immunology of Mycobacterium tuberculosis infections. Microbiol Spectr. (2019) 7:1–37. doi: 10.1128/microbiolspec.GPP3-0022-2018
39. Coldren CD, Hashim P, Ali JM, Oh SK, Sinskey AJ, Rha C. Gene expression changes in the human fibroblast induced by Centella asiatica triterpenoids. Planta Med. (2003) 69:725–32. doi: 10.1055/s-2003-42791
40. Zhang G, Zhou B, Li S, Yue J, Yang H, Wen Y, et al. Allele-specific induction of IL-1beta expression by C/EBPbeta and PU.1 contributes to increased tuberculosis susceptibility. PLoS Pathog. (2014) 10:e1004426. doi: 10.1371/journal.ppat.1004426
41. Fu YR, Gao KS, Ji R, Yi ZJ. Differential transcriptional response in macrophages infected with cell wall deficient versus normal Mycobacterium tuberculosis. Int J Biol Sci. (2015) 11:22–30. doi: 10.7150/ijbs.10217
42. Pfaffl MW, Horgan GW, Dempfle L. Relative expression software tool (REST) for group-wise comparison and statistical analysis of relative expression results in real-time PCR. Nucleic Acids Res. (2002) 30:e36. doi: 10.1093/nar/30.9.e36
43. Vesosky B, Rottinghaus EK, Stromberg P, Turner J, Beamer G. CCL5 participates in early protection against Mycobacterium tuberculosis. J Leukoc Biol. (2010) 87:1153–65. doi: 10.1189/jlb.1109742
44. Volkman HE, Pozos TC, Zheng J, Davis JM, Rawls JF, Ramakrishnan L. Tuberculous granuloma induction via interaction of a bacterial secreted protein with host epithelium. Science. (2010) 327:466–9. doi: 10.1126/science.1179663
45. Zlotnik A, Yoshie O. Chemokines: a new classification system and their role in immunity. Immunity. (2000) 12:121–7. doi: 10.1016/S1074-7613(00)80165-X
46. Yoshie O, Imai T, Nomiyama H. Chemokines in immunity. Adv Immunol. (2001) 78:57–110. doi: 10.1016/S0065-2776(01)78002-9
47. Zhang Y, Broser M, Cohen H, Bodkin M, Law K, Reibman J, et al. Enhanced interleukin-8 release and gene expression in macrophages after exposure to Mycobacterium tuberculosis and its components. J Clin Invest. (1995) 95:586–92. doi: 10.1172/JCI117702
48. Gerszten RE, Garcia-Zepeda EA, Lim YC, Yoshida M, Ding HA, Gimbrone MA Jr, et al. MCP-1 and IL-8 trigger firm adhesion of monocytes to vascular endothelium under flow conditions. Nature. (1999) 398:718–23. doi: 10.1038/19546
49. Liebscher I, Muller U, Teupser D, Engemaier E, Engel KM, Ritscher L, et al. Altered immune response in mice deficient for the G protein-coupled receptor GPR34. J Biol Chem. (2011) 286:2101–10. doi: 10.1074/jbc.M110.196659
50. Jager E, Schulz A, Lede V, Lin CC, Schoneberg T, Le Duc D. Dendritic cells regulate GPR34 through mitogenic signals and undergo apoptosis in its absence. J Immunol. (2016) 196:2504–13. doi: 10.4049/jimmunol.1501326
51. Zolfaghari R, Chen Q, Ross AC. DHRS3, a retinal reductase, is differentially regulated by retinoic acid and lipopolysaccharide-induced inflammation in THP-1 cells and rat liver. Am J Physiol Gastrointest Liver Physiol. (2012) 303:G578–88. doi: 10.1152/ajpgi.00234.2012
52. Wheelwright M, Kim EW, Inkeles MS, De Leon A, Pellegrini M, Krutzik SR, et al. All-trans retinoic acid-triggered antimicrobial activity against Mycobacterium tuberculosis is dependent on NPC2. J Immunol. (2014) 192:2280–90. doi: 10.4049/jimmunol.1301686
53. Heckmann BL, Zhang X, Xie X, Liu J. The G0/G1 switch gene 2 (G0S2): regulating metabolism and beyond. Biochim Biophys Acta. (2013) 1831:276–81. doi: 10.1016/j.bbalip.2012.09.016
54. Boulland ML, Marquet J, Molinier-Frenkel V, Moller P, Guiter C, Lasoudris F, et al. Human IL4I1 is a secreted L-phenylalanine oxidase expressed by mature dendritic cells that inhibits T-lymphocyte proliferation. Blood. (2007) 110:220–7. doi: 10.1182/blood-2006-07-036210
55. Marquet J, Lasoudris F, Cousin C, Puiffe ML, Martin-Garcia N, Baud V, et al. Dichotomy between factors inducing the immunosuppressive enzyme IL-4-induced gene 1 (IL4I1) in B lymphocytes and mononuclear phagocytes. Eur J Immunol. (2010) 40:2557–68. doi: 10.1002/eji.201040428
56. Alessandri AL, Souza AL, Oliveira SC, Macedo GC, Teixeira MM, Teixeira AL. Concentrations of CXCL8, CXCL9 and sTNFR1 in plasma of patients with pulmonary tuberculosis undergoing treatment. Inflamm Res. (2006) 55:528–33. doi: 10.1007/s00011-006-5136-9
57. Yoshimura A, Suzuki M, Sakaguchi R, Hanada T, Yasukawa H. SOCS, inflammation, and autoimmunity. Front Immunol. (2012) 3:20. doi: 10.3389/fimmu.2012.00020
58. Masood KI, Rottenberg ME, Salahuddin N, Irfan M, Rao N, Carow B, et al. Expression of M. tuberculosis-induced suppressor of cytokine signaling (SOCS) 1, SOCS3, FoxP3 and secretion of IL-6 associates with differing clinical severity of tuberculosis. BMC Infect Dis. (2013) 13:13. doi: 10.1186/1471-2334-13-13
59. Masood KI, Pervez S, Rottenberg ME, Umar B, Hasan Z. Suppressor of cytokine signaling-1 and chemokine (C-X-C Motif) receptor 3 expressions are associated with caseous necrosis in granulomas from patients with tuberculous lymphadenitis. J Microbiol Immunol Infect. (2016) 49:984–7. doi: 10.1016/j.jmii.2015.08.018
60. Woo M, Wood C, Kwon D, Park K-HP, Fejer G, Delorme V. Mycobacterium tuberculosis infection and innate responses in a new model of lung alveolar macrophages. Front Immunol. (2018) 9:438. doi: 10.3389/fimmu.2018.00438
61. Praefcke GJK. Regulation of innate immune functions by guanylate-binding proteins. Int J Med Microbiol. (2018) 308:237–45. doi: 10.1016/j.ijmm.2017.10.013
62. Labzin LI, Lauterbach MA, Latz E. Interferons and inflammasomes: cooperation and counterregulation in disease. J Allergy Clin Immunol. (2016) 138:37–46. doi: 10.1016/j.jaci.2016.05.010
63. Kim BH, Shenoy AR, Kumar P, Das R, Tiwari S, Macmicking JD. A family of IFN-gamma-inducible 65-kD GTPases protects against bacterial infection. Science. (2011) 332:717–21. doi: 10.1126/science.1201711
64. Banks DA, Ahlbrand SE, Hughitt VK, Shah S, Mayer-Barber KD, Vogel SN, et al. Mycobacterium tuberculosis inhibits autocrine type I IFN signaling to increase intracellular survival. J Immunol. (2019) 202:2348–59. doi: 10.4049/jimmunol.1801303
65. Manzanillo PS, Shiloh MU, Portnoy DA, Cox JS. Mycobacterium tuberculosis activates the DNA-dependent cytosolic surveillance pathway within macrophages. Cell Host Microbe. (2012) 11:469–80. doi: 10.1016/j.chom.2012.03.007
66. Collins AC, Cai H, Li T, Franco LH, Li XD, Nair VR, et al. Cyclic GMP-AMP synthase is an innate immune DNA sensor for Mycobacterium tuberculosis. Cell Host Microbe. (2015) 17:820–8. doi: 10.1016/j.chom.2015.05.005
67. Wassermann R, Gulen MF, Sala C, Perin SG, Lou Y, Rybniker J, et al. Mycobacterium tuberculosis differentially activates cGAS- and inflammasome-dependent intracellular immune responses through ESX-1. Cell Host Microbe. (2015) 17:799–810. doi: 10.1016/j.chom.2015.05.003
68. Watson RO, Bell SL, Macduff DA, Kimmey JM, Diner EJ, Olivas J, et al. The cytosolic sensor cGAS detects Mycobacterium tuberculosis DNA to induce type I interferons and activate autophagy. Cell Host Microbe. (2015) 17:811–9. doi: 10.1016/j.chom.2015.05.004
69. Nalpas NC, Magee DA, Conlon KM, Browne JA, Healy C, Mcloughlin KE, et al. RNA sequencing provides exquisite insight into the manipulation of the alveolar macrophage by tubercle bacilli. Sci Rep. (2015) 5:13629. doi: 10.1038/srep13629
70. Malone KM, Rue-Albrecht K, Magee DA, Conlon K, Schubert OT, Nalpas NC, et al. Comparative 'omics analyses differentiate Mycobacterium tuberculosis and Mycobacterium bovis and reveal distinct macrophage responses to infection with the human and bovine tubercle bacilli. Microb Genom. (2018) 4:1–17. doi: 10.1099/mgen.0.000163
71. Yang Y, Zhou X, Kouadir M, Sh F, Ding T, et al. the AIM2 inflammasome is involved in macrophage activation during infection with virulent Mycobacterium bovis strain. J Infect Dis. (2013) 208:1849–58. doi: 10.1093/infdis/jit347
72. Saiga H, Kitada S, Shimada Y, Kamiyama N, Okuyama M, Makino M, et al. Critical role of AIM2 in Mycobacterium tuberculosis infection. Int Immunol. (2012) 24:637–44. doi: 10.1093/intimm/dxs062
73. Van De Veerdonk FL, Netea MG, Dinarello CA, Joosten LA. Inflammasome activation and IL-1beta and IL-18 processing during infection. Trends Immunol. (2011) 32:110–6. doi: 10.1016/j.it.2011.01.003
74. Juffermans NP, Florquin S, Camoglio L, Verbon A, Kolk AH, Speelman P, et al. Interleukin-1 signaling is essential for host defense during murine pulmonary tuberculosis. J Infect Dis. (2000) 182:902–8. doi: 10.1086/315771
75. Yamada H, Mizumo S, Horai R, Iwakura Y, Sugawara I. Protective role of interleukin-1 in mycobacterial infection in IL-1 alpha/beta double-knockout mice. Lab Invest. (2000) 80:759–67. doi: 10.1038/labinvest.3780079
76. Mayer-Barber KD, Andrade BB, Barber DL, Hieny S, Feng CG, Caspar P, et al. Innate and adaptive interferons suppress IL-1alpha and IL-1beta production by distinct pulmonary myeloid subsets during Mycobacterium tuberculosis infection. Immunity. (2011) 35:1023–34. doi: 10.1016/j.immuni.2011.12.002
77. Novikov A, Cardone M, Thompson R, Shenderov K, Kirschman KD, Mayer-Barber KD, et al. Mycobacterium tuberculosis triggers host type I IFN signaling to regulate IL-1beta production in human macrophages. J Immunol. (2011) 187:2540–7. doi: 10.4049/jimmunol.1100926
78. Manca C, Tsenova L, Bergtold A, Freeman S, Tovey M, Musser JM, et al. Virulence of a Mycobacterium tuberculosis clinical isolate in mice is determined by failure to induce Th1 type immunity and is associated with induction of IFN-alpha /beta. Proc Natl Acad Sci USA. (2001) 98:5752–7. doi: 10.1073/pnas.091096998
79. Stanley SA, Johndrow JE, Manzanillo P, Cox JS. The Type I IFN response to infection with Mycobacterium tuberculosis requires ESX-1-mediated secretion and contributes to pathogenesis. J Immunol. (2007) 178:3143–52 doi: 10.4049/jimmunol.178.5.3143
80. Cooper AM, Mayer-Barber KD, Sher A. Role of innate cytokines in mycobacterial infection. Mucosal Immunol. (2011) 4:252–60. doi: 10.1038/mi.2011.13
81. Chin KL, Anis FZ, Sarmiento ME, Norazmi MN, Acosta A. Role of interferons in the development of diagnostics, vaccines, and therapy for tuberculosis. J Immunol Res. (2017) 2017:5212910. doi: 10.1155/2017/5212910
82. Donovan ML, Schultz TE, Duke TJ, Blumenthal A. Type I interferons in the pathogenesis of tuberculosis: molecular drivers and immunological consequences. Front Immunol. (2017) 8:1633. doi: 10.3389/fimmu.2017.01633
83. Cliff JM, Lee JS, Constantinou N, Cho JE, Clark TG, Ronacher K, et al. Distinct phases of blood gene expression pattern through tuberculosis treatment reflect modulation of the humoral immune response. J Infect Dis. (2013) 207:18–29. doi: 10.1093/infdis/jis499
84. Esmail H, Lai RP, Lesosky M, Wilkinson KA, Graham CM, Horswell S, et al. Complement pathway gene activation and rising circulating immune complexes characterize early disease in HIV-associated tuberculosis. Proc Natl Acad Sci USA. (2018) 115:E964–73. doi: 10.1073/pnas.1711853115
85. Sutherland JS, Loxton AG, Haks MC, Kassa D, Ambrose L, Lee JS, et al. Differential gene expression of activating Fcgamma receptor classifies active tuberculosis regardless of human immunodeficiency virus status or ethnicity. Clin Microbiol Infect. (2014) 20:O230–8. doi: 10.1111/1469-0691.12383
86. Joosten SA, Goeman JJ, Sutherland JS, Opmeer L, De Boer KG, Jacobsen M, et al. Identification of biomarkers for tuberculosis disease using a novel dual-color RT-MLPA assay. Genes Immun. (2012) 13:71–82. doi: 10.1038/gene.2011.64
87. Mihret A, Loxton AG, Bekele Y, Kaufmann SH, Kidd M, Haks MC, et al. Combination of gene expression patterns in whole blood discriminate between tuberculosis infection states. BMC Infect Dis. (2014) 14:257. doi: 10.1186/1471-2334-14-257
88. Maertzdorf J, Ota M, Repsilber D, Mollenkopf HJ, Weiner J, Hill PC, et al. Functional correlations of pathogenesis-driven gene expression signatures in tuberculosis. PLoS ONE. (2011) 6:e26938. doi: 10.1371/journal.pone.0026938
89. Huang L, Nazarova EV, Tan S, Liu Y, Russell DG. Growth of Mycobacterium tuberculosis in vivo segregates with host macrophage metabolism and ontogeny. J Exp Med. (2018) 215:1135–52. doi: 10.1084/jem.20172020
90. Shin JH, Yang JY, Jeon BY, Yoon YJ, Cho SN, Kang YH, et al. (1)H NMR-based metabolomic profiling in mice infected with Mycobacterium tuberculosis. J Proteome Res. (2011) 10:2238–47. doi: 10.1021/pr101054m
91. Gautier EL, Shay T, Miller J, Greter M, Jakubzick C, Ivanov S, et al. Gene-expression profiles and transcriptional regulatory pathways that underlie the identity and diversity of mouse tissue macrophages. Nat Immunol. (2012) 13:1118–28. doi: 10.1038/ni.2419
92. Lavin Y, Winter D, Blecher-Gonen R, David E, Keren-Shaul H, Merad M, et al. Tissue-resident macrophage enhancer landscapes are shaped by the local microenvironment. Cell. (2014) 159:1312–26. doi: 10.1016/j.cell.2014.11.018
93. Schoggins JW, Wilson SJ, Panis M, Murphy MY, Jones CT, Bieniasz P, et al. Corrigendum: a diverse range of gene products are effectors of the type I interferon antiviral response. Nature. (2015) 525:144. doi: 10.1038/nature14554
94. Dos Santos PF, Van Weyenbergh J, Delgobo M, Oliveira Patricio D, Ferguson BJ, Guabiraba R, et al. ISG15-Induced IL-10 is a novel anti-inflammatory myeloid axis disrupted during active tuberculosis. J Immunol. (2018) 200:1434–2. doi: 10.4049/jimmunol.1701120
95. Bedoya G, Montoya P, García J, Soto I, Bourgeois S, Carvajal L, et al. Admixture dynamics in Hispanics: a shift in the nuclear genetic ancestry of a South American population isolate. Proc Natl Acad Sci USA. (2006) 103:7234–9 doi: 10.1073/pnas.0508716103
96. Rishishwar L, Conley AB, Wigington CH, Wang L, Valderrama-Aguirre A, Jordan IK. Ancestry, admixture and fitness in Colombian genomes. Sci Rep. (2015) 5:12376. doi: 10.1038/srep12376
97. Wang S, Ray N, Rojas W, Parra MV, Bedoya G, Gallo C, et al. Geographic patterns of genome admixture in Latin American Mestizos. PLoS Genet. (2008) 4:e1000037. doi: 10.1371/journal.pgen.1000037
Keywords: human alveolar macrophages, splenic macrophages, M. tuberculosis, clinical isolates, microarray, transcriptome
Citation: Lavalett L, Ortega H and Barrera LF (2020) Human Alveolar and Splenic Macrophage Populations Display a Distinct Transcriptomic Response to Infection With Mycobacterium tuberculosis. Front. Immunol. 11:630. doi: 10.3389/fimmu.2020.00630
Received: 12 November 2019; Accepted: 19 March 2020;
Published: 21 April 2020.
Edited by:
Alexandre Corthay, Oslo University Hospital, NorwayReviewed by:
Niaina Rakotosamimanana, Institut Pasteur de Madagascar, MadagascarMichelle Ryndak, New York University, United States
David E. MacHugh, University College Dublin, Ireland
Copyright © 2020 Lavalett, Ortega and Barrera. This is an open-access article distributed under the terms of the Creative Commons Attribution License (CC BY). The use, distribution or reproduction in other forums is permitted, provided the original author(s) and the copyright owner(s) are credited and that the original publication in this journal is cited, in accordance with accepted academic practice. No use, distribution or reproduction is permitted which does not comply with these terms.
*Correspondence: Luis F. Barrera, bHVpcy5iYXJyZXJhQHVkZWEuZWR1LmNv