 Hua Zha1,2,3†
 Haifeng Lu1†
 Jieyun Wu2,4†
 Kevin Chang5Qiangqiang Wang1
 Hua Zhang1Jinyou Li6
 Qixia Luo1Yanmeng Lu1
 Lanjuan Li1*
- 1State Key Laboratory for Diagnosis and Treatment of Infectious Disease, Collaborative Innovation Center for Diagnosis and Treatment of Infectious Diseases, National Clinical Research Center for Infectious Diseases, The First Affiliated Hospital, College of Medicine, Zhejiang University, Hangzhou, China
- 2School of Biological Sciences, The University of Auckland, Auckland, New Zealand
- 3Institute of Marine Science, The University of Auckland, Auckland, New Zealand
- 4Plant Health and Environment Laboratory, Ministry for Primary Industries, Auckland, New Zealand
- 5Department of Statistics, The University of Auckland, Auckland, New Zealand
- 6Department of Geriatrics, The First Affiliated Hospital, College of Medicine, Zhejiang University, Hangzhou, China
The dysbiosis of oropharyngeal (OP) microbiota is associated with multiple diseases, including H7N9 infection. Different OP microbial colonization states may reflect different severities or stages of disease and affect the effectiveness of the treatments. Current study aims to determine the vital bacteria that could possibly drive the OP microbiota in the H7N9 patients to more severe microbial dysbiosis state. The OP microbiotas of 42 H7N9 patients and 30 healthy subjects were analyzed by a series of bioinformatics and statistical analyses. Two clusters of OP microbiotas in H7N9 patients, i.e., Cluster_1_Diseased and Cluster_2_Diseased, were determined at two microbial colonization states by Partition Around Medoids (PAM) clustering analysis, each characterized by distinct operational taxonomic units (OTUs) and functional metabolites. Cluster_1_Diseased was determined at more severe dysbiosis status compared with Cluster_2_Diseased, while OTU143_Capnocytophaga and OTU269_Treponema acted as gatekeepers for both of the two clustered microbiotas. Nine OTUs assigned to seven taxa, i.e., Alloprevotella, Atopobium, Megasphaera, Oribacterium, Prevotella, Stomatobaculum, and Veillonella, were associated with both H7N9 patients with and without secondary bacterial lung infection in Cluster_1. In addition, two groups of healthy cohorts may have potential different susceptibilities to H7N9 infection. These findings suggest that two OP microbial colonization states of H7N9 patients were at different dysbiosis states, which may help determine the health status of H7N9 patients, as well as the susceptibility of healthy subjects to H7N9 infection.
Introduction
Avian influenza has caused great mortalities to human beings and animals during the last two decades (1–4). The highly pathogenic avian influenza A H7N9 virus emerged in eastern China in 2013 (5, 6). This virus has resulted in severe illness in the infected patients, including pneumonia and acute respiratory distress syndrome, with significant intensive care unit admission and a high case-fatality rate of 39% from 2013 to 2018 (7, 8).
Secondary bacterial lung infection (SBLI) is a usual condition in the H7N9 patients (9). Acinetobacter baumanii, Candida albicans, Flavobacterium indologenes, Klebsiella, Pseudomonas, and Staphylococcus have been isolated from blood, white blood cell, or sputum of H7N9 patients with SBLI (H7N9_SBLI), whereas no bacterium was isolated from those in the H7N9 patients without SBLI (H7N9_NSI) (10).
Oropharynx acts as one key gatekeeper of human airway (11) and the dysbiosis of oropharyngeal (OP) microbiotas are associated with multiple diseases (12–15). The disordered OP microbiotas were associated with H7N9_SBLI, with more abundant Atopobium, Eubacterium, Leptotrichia, Oribacterium, Rothia, Solobacterium, and Streptococcus in H7N9_SBLI than H7N9_NSI (10). Whether some bacteria could possibly contribute to the worse OP microbial colonization state(s) in both H7N9_SBLI or H7N9_NSI needs further investigations.
Diseased cohorts could have different microbial colonization states in the affected tissues or organs (16–18), which may reflect the severity or stages of disease and affect the effectiveness of the treatments. The OP microbial colonization states of the H7N9 patients remain poorly understood. The present study was designed to (1) determine the vital members and characteristics of different OP microbial colonization states in H7N9 patients; (2) investigate the bacteria that possibly drive the OP microbiotas to worse microbial dysbiosis state in both H7N9_NSI and H7N9_SBLI; and, in addition, (3) determine whether the healthy subjects could have potential different susceptibilities to H7N9 infection.
Methods
Patients and Sampling
The current study recruited a total of 72 OP samples from 72 individuals collected by Lu et al. (10), including 21 H7N9 patients with no SBLI (H7N9_NSI), 21 H7N9 patients with SBLI (H7N9_SBLI), and 30 healthy subjects. The selection criteria for the H7N9 patients and healthy subjects were provided in our previous study (10). Written informed consent was obtained from all patients and healthy subjects, and the study was approved by the institutional review board and ethics committee of the First Affiliated Hospital of Zhejiang University.
Molecular Methods
The molecular experiments were conducted by Lu, et al. (10). Briefly, DNA extraction was performed by using a Qiagen Mini DNA extraction Kit (Qiagen Inc., Germany) as per manufacturer's instructions, with some slight modifications. DNA was then amplified by bacterial 16S rRNA primers targeting V3-V4 regions before being submitted for Illumina sequencing.
Bioinformatics Analyses
The raw sequencing data generated from our previous work (10) were used for bioinformatics analyses in the present study. Paired-end read sequences were merged and quality filtered using USEARCH analysis tool (19). Sequences were chimera filtered and clustered into groups of operational taxonomic units (OTUs) with identity threshold ≥97% using the clustering pipeline UPARSE (19). Phylotypes were then classified using QIIME against SILVA database (20). Each sample was rarefied to 4,300 randomly selected reads per sample, consistent with the shallowest sample.
Clustering of OP Microbiotas of All Individuals Based on Their Colonization States
The OP microbiotas in all the H7N9 and healthy subjects were clustered by Partition Around Medoids (PAM) clustering analysis in order to determine their microbial colonization states. Before PAM clustering, the average silhouette method was used to determine the optimal numbers of clusters for all the OP microbiotas (21).
Two clusters of OP microbiotas were determined in healthy cohorts (i.e., Cluster_1_Healthy and Cluster_2_Healthy) and H7N9 cohorts (i.e., Cluster_1_Diseased and Cluster_2_Diseased). A Pearson χ2 test was performed to compare the numbers of healthy and H7N9 cohorts in the two clusters.
Comparisons of OP Microbiotas of H7N9 Patients in the Two Clusters
Permutation analysis of variance (PERMANOVA) was performed in R software version 3.6.1 with the vegan package (22) to determine the difference between Cluster_1_Diseased and Cluster_2_Diseased. Similarity percentage (SIMPER) analysis was conducted to identify the similarities within Cluster_1_Diseased and within Cluster_2_Diseased, as well as the dissimilarity of Cluster_1_Diseased and Cluster_2_Diseased. The richness (observed species), diversity (Shannon index), and evenness (Pielou index) of Cluster_1_Diseased and Cluster_2_Diseased were calculated and compared with t test.
OTUs and Functional Metabolites Associated With the Two Clustered OP Microbiotas of H7N9 Patients
Linear discriminant analysis (LDA) effect size (LEfSe) was performed using Kruskal–Wallis test (α < 0.05), followed by a Wilcoxon rank-sum test (α < 0.05), and a one-against-all strategy for multiclass analysis (23). It was applied to identify the OTUs associated with Cluster_1_Diseased or Cluster_2_Diseased, with an LDA threshold >3.0. The functional metabolites of Cluster_1_Diseased or Cluster_2_Diseased were determined by using Tax4fun package in R software against SILVA database (24), followed by an LEfSe analysis to determine the functional metabolites associated with Cluster_1_Diseased or Cluster_2_Diseased.
Bacterial Networks and Gatekeepers in the Two Clustered OP Microbiotas of H7N9 Patients
Co-occurrence Network (CoNet) analysis was carried out to investigate the co-occurrence and coexclusion of OTUs in Cluster_1_Diseased and Cluster_2_Diseased and to determine the top 10 OTUs with most correlations in the OP bacterial networks of Cluster_1_Diseased and Cluster_2_Diseased. The detailed processes followed the procedures described by Wagner Mackenzie et al. (25). Briefly, Pearson, Spearman, mutual information, Bray Curtis, and Kullback–Leibler dissimilarities were used to calculate the ensemble inference and the top 1,000 positive and negative correlations were recorded. The method-specific P values were computed by a permutation step, followed by a bootstrap procedure to merge the P values into one final P value using a method by Brown (26).
Gatekeepers were defined as the phylotypes interacting with different parts of the network to hold together the bacterial community (25, 27). In the present study, network fragmentation analysis was performed to identify the gatekeepers of OP bacterial networks of Cluster_1_Diseased and Cluster_2_Diseased. The detailed manipulations were performed as described by Wagner Mackenzie et al. (25). A null distribution of fragmentation scores was created from 10, 000 randomly constructed networks with identical node and edge distributions to the original network, and statistical significance was defined as the number of times a fragmentation score greater than the null fragmentation score resulting from the removal of the OTU observed within the null distribution.
Dysbiosis Status of OP Microbiotas in Patients Within the Two Clusters
The OTUs differentiating the OP microbiotas of H7N9 patients from those of healthy subjects were determined by using the Galaxy implementation of LEfSe run by Huttenhower laboratory (23).
Dysbiosis ratios of bacterial taxa were associated with different diseases and conditions (28, 29). In the current study, avian influenza dysbiosis ratio (AIDR) was defined as the abundance ratio of OTUs associated with healthy cohort and OTUs associated with H7N9, to assist in determining the dysbiosis states of OP microbiotas in the H7N9 cohorts within the two clusters. Avian influenza dysbiosis ratios of the healthy and H7N9 cohorts were transformed in log10 to satisfy the assumptions of normal distribution and equal variance before being compared with a t test. The same data transformation and statistical approach were applied for the comparison of the AIDRs of Cluster_1_Diseased and Cluster_2_Diseased.
A series of statistical analyses were also performed to help determine the dysbiosis status of the two clusters of OP microbiotas in H7N9 patients. Mann–Whitney U test was used to compare the abundances of the OTUs associated with H7N9 between Cluster_1_Diseased and Cluster_2_Diseased. The same approach was performed for the comparisons of OTUs associated with healthy cohort between Cluster_1_Diseased and Cluster_2_Diseased. A Pearson χ2 test was applied to compare the numbers of OTUs that were associated with H7N9 and more abundant in Cluster_1_Diseased or Cluster_2_Diseased. The same test was carried out for the comparisons of the numbers of OTUs, which were associated with healthy cohort and more abundant in Cluster_1_Diseased or Cluster_2_Diseased.
Comparisons of OP Microbiotas in H7N9_NSI or H7N9_SBLI Between Cluster_1 and Cluster_2
The two clustered OP microbiotas in H7N9_NSI (or H7N9_SBLI) were compared to determine whether some OTUs could possibly drive the OP microbiotas to worse microbial dysbiosis state in both H7N9_NSI and H7N9_SBLI.
Avian influenza dysbiosis ratios of H7N9_NSI cohorts in the two clusters were compared by a t test, after being transformed in log10 to satisfy the assumptions of normal distribution and equal variance. The same approaches were applied for the comparisons of the AIDRs of H7N9_SBLI cohorts in the two clusters.
An LEfSe analysis was applied to determine the OTUs differentiating the two clustered OP microbiotas in H7N9_NSI (i.e., Cluster_1_H7N9_NSI and Cluster_2_H7N9_NSI). The same approach was carried out for determining the OTUs associated with each of the two clustered OP microbiotas in H7N9_SBLI (i.e., Cluster_1_H7N9_SBLI or Cluster_2_H7N9_SBLI).
Similarly, an LEfSe analysis was used to determine the functional metabolites associated with Cluster_1_H7N9_NSI or Cluster_2_H7N9_NSI. The same analysis was used to determine the functional metabolites associated with Cluster_1_H7N9_SBLI or Cluster_2_H7N9_SBLI.
The OTUs associated with both Cluster_1_H7N9_NSI and Cluster_1_H7N9_SBLI were determined by an online program Venny diagram version 2.1 (30). The same program was used to determine the OTUs associated with both Cluster_2_H7N9_NSI and Cluster_2_H7N9_SBLI.
Comparisons of the Two Clustered Healthy OP Microbiotas
Permutation analysis of variance was applied to determine the difference between Cluster_1_Healthy and Cluster_2_Healthy. Avian influenza dysbiosis ratios of Cluster_1_Healthy and Cluster_2_Healthy were transformed in log10 to satisfy the assumptions of normal distribution and equal variance, before being compared by a t test.
An LEfSe analysis was applied to determine the OTUs associated with each of the two clustered OP microbiotas in healthy cohorts. The same approach was used for identifying the functional metabolites associated with Cluster_1_Healthy or Cluster_2_Healthy.
Results
Clustering of OP Microbiotas in All Individuals
Silhouette analysis identified two as the most optimal number for clustering all the 72 OP microbiotas (Figure S1). Therefore, the OP microbiotas of all individuals were clustered into two clusters (i.e., Cluster_1 and Cluster_2) by PAM clustering analysis (Figure 1). Cluster_1 included a total of 31 H7N9 microbiotas (Cluster_1_Diseased) and 11 healthy microbiotas (Cluster_1_Healthy), whereas Cluster_2 contained 11 H7N9 microbiotas (Cluster_2_Diseased) and 19 healthy microbiotas (Cluster_2_Healthy) (Figure 1). There was a significant difference between the numbers of OP microbiotas from H7N9 or healthy cohorts in the two clusters (χ2 = 9.933, P = 0.002).
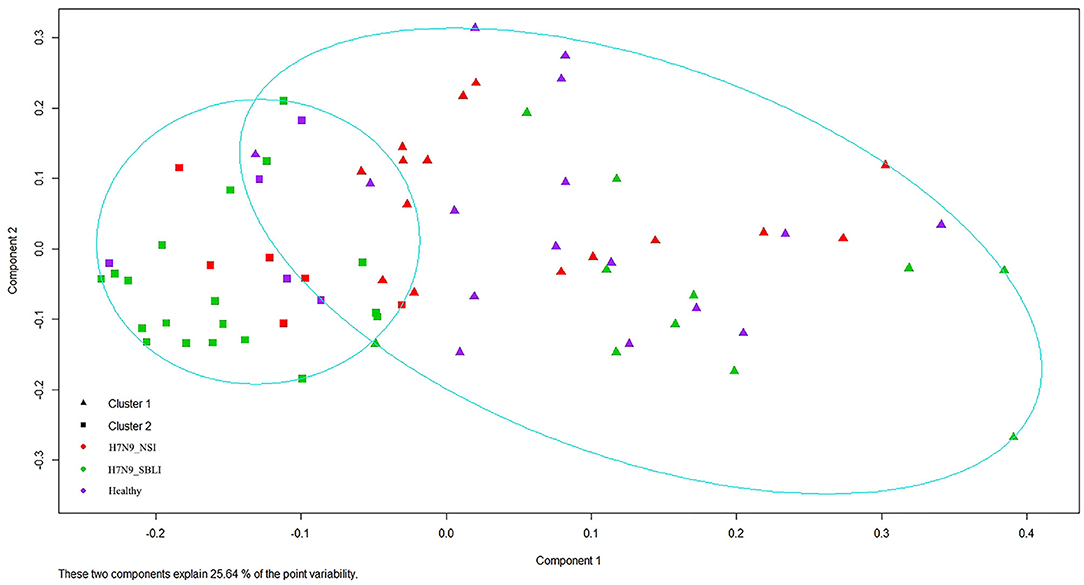
Figure 1. All the 72 oropharyngeal (OP) microbiotas were clustered into two clusters by Partition Around Medoids (PAM) clustering analysis.
Differences Between Cluster_1_Diseased and Cluster_2_Diseased
The five most abundant phyla in the OP microbiotas of H7N9 patients accounted for >90% abundance of the OP microbiotas. Among them, Bacteroidetes, Fusobacteria, and Proteobacteria were more abundant in Cluster_2_Diseased compared with Cluster_1_Diseased, whereas Firmicutes and Saccharibacteria were more abundant in Cluster_1_Diseased than in Cluster_2_Diseased. Nine most abundant orders in the H7N9 patients constituted >90% abundance of all the orders in H7N9 microbiotas, among which Campylobacterales, Clostridiales, Flavobacteriales, Lactobacillales, and Selenomonadales had greater abundances in Cluster_1_Diseased compared with Cluster_2_Diseased, whereas Bacteroidales, Fusobacteriales, Neisseriales, and Pasteurellales were more abundant in Cluster_2_Diseased than in Cluster_1_Diseased.
Permutation analysis of variance determined that Cluster_1_Diseased and Cluster_2_Diseased were significantly different (R2 = 0.090, P < 0.001). The dissimilarity between Cluster_1_Diseased and Cluster_2_Diseased was relatively high (SIMPER dissimilarity = 64.8%) according to SIMPER results. The similarity within Cluster_1_Diseased (SIMPER average similarity = 38.2%) was lower than that within Cluster_2_Diseased (SIMPER average similarity = 44.1%). Both richness and diversity were similar in Cluster_1_Diseased and Cluster_2_Diseased (t test, all P > 0.07), but the evenness was significantly higher in Cluster_1_Diseased than in Cluster_2_Diseased (t test, P < 0.05) (Table 1).
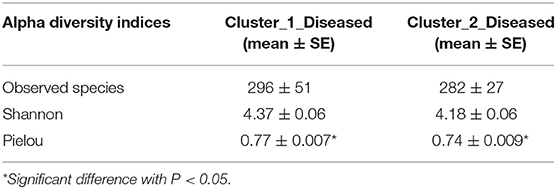
Table 1. Comparisons of richness (observed species), diversity (Shannon), and evenness (Pielou) of two clustered oropharyngeal (OP) microbiotas in H7N9 patients (i.e., Cluster_1_Diseased and Cluster_2_Diseased).
A total of 38 OTUs were identified differentiating Cluster_1_Diseased and Cluster_2_Diseased, among which OTU2 and OTU9 (both assigned to Neisseria) with the largest LDA scores were closely associated with Cluster_1_Diseased and Cluster_2_Diseased, respectively (Figure 2A). Likewise, a range of 17 functional metabolites were determined capable of differentiating Cluster_1_Diseased and Cluster_2_Diseased (Figure 2B). Methyl-accepting chemotaxis protein was the leading metabolite differentiating Cluster_1_Diseased from Cluster_2_Diseased.
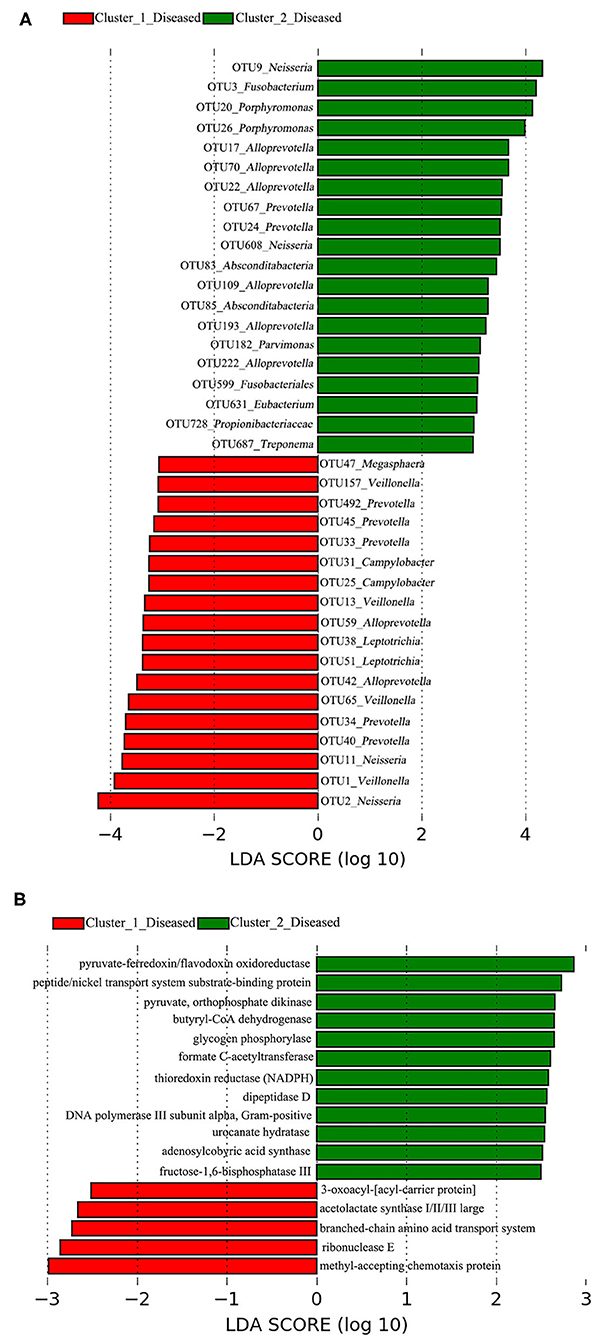
Figure 2. Linear discriminant analysis (LDA) effect size (LEfSe) determined the (A) operational taxonomic units (OTUs) and (B) functional metabolites associated with each of the two clustered OP microbiotas of H7N9 patients.
Dysbiosis Status of Cluster_1_Diseased and Cluster_2_Diseased
The LEfSe results showed that 69 OTUs were associated with H7N9, and 22 OTUs were associated with healthy cohort, which were used for the calculations and comparisons of AIDRs in different groups (Table S1). The healthy subjects have a significantly greater AIDR (14.27 ± 2.83 SE) than that of H7N9 patients (2.48 ± 0.41 SE) (t test, P < 0.001), suggesting a lower AIDR was likely to indicate the dysbiosis of OP microbiotas in H7N9 patients compared with healthy subjects. The AIDR was significantly higher in Cluster_2_Diseased (5.28 ± 1.12 SE) than Cluster_1_Diseased (1.48 ± 0.21 SE) (t test, P < 0.001).
Eleven (of 69) OTUs associated with H7N9 were determined with significantly different abundances between Cluster_1_Dieased and Cluster_2_Diseased (Mann–Whitney test, all P < 0.05) (Figure 3A). Among them, significantly more OTUs (10 OTUs) associated with H7N9 were more abundant in Cluster_1_Diseased than in Cluster_2_Diseased (χ2 = 11.0, P = 0.001).
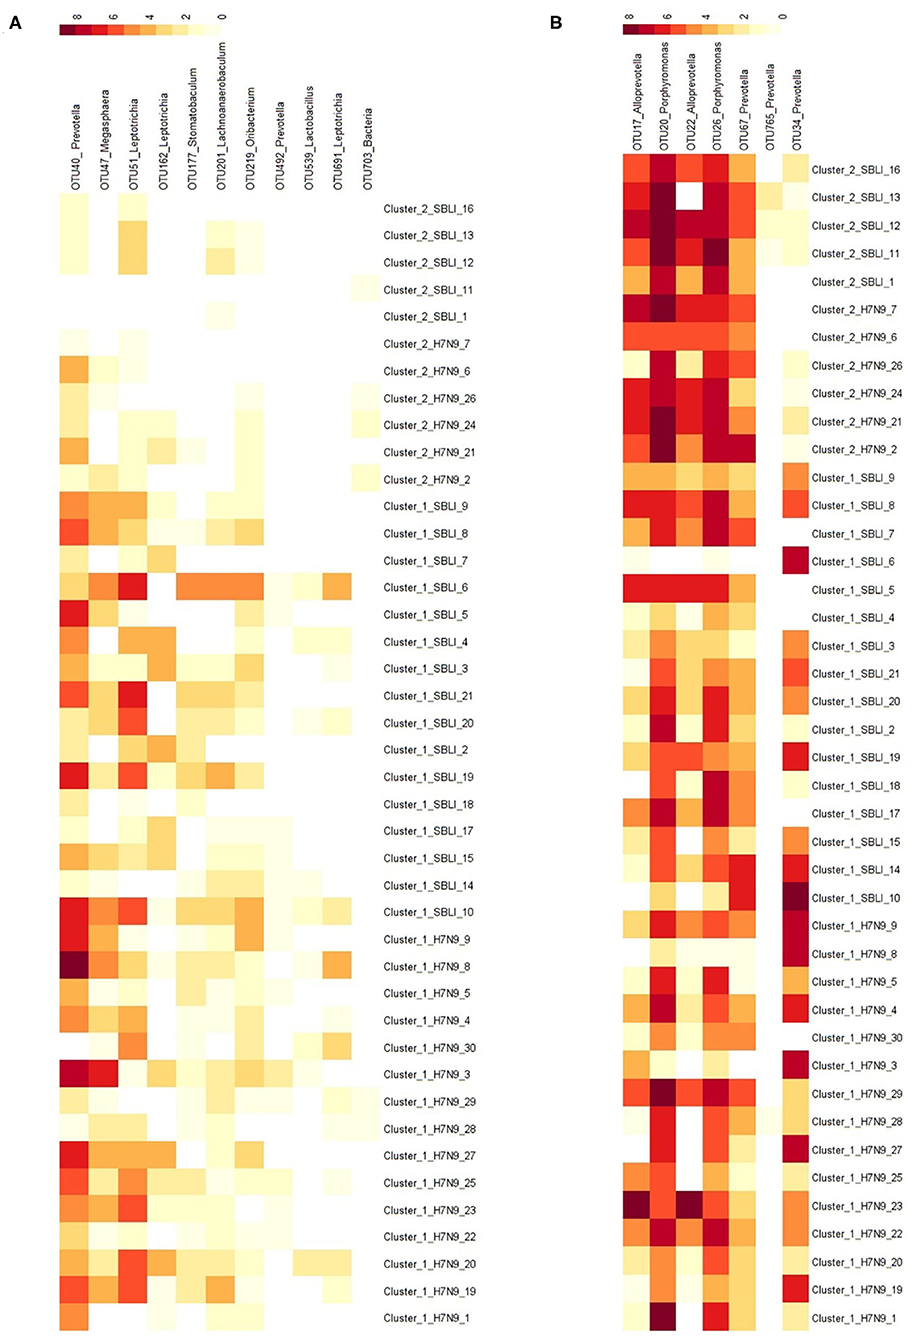
Figure 3. Distributions of the OTUs associated with (A) H7N9 or (B) healthy cohort in the two clustered H7N9 patients. The demonstrated OTUs had significantly different abundances between the two clustered H7N9 patients.
Likewise, seven (of 22) OTUs associated with healthy cohort were determined with significantly different abundances between the two clustered H7N9 microbiotas (Mann–Whitney test, all P < 0.02) (Figure 3B). Among them, significantly more OTUs (six OTUs) associated with healthy cohort were more abundant in Cluster_2_Diseased than in Cluster_1_Diseased (χ2 = 7.0, P < 0.01).
These above results consistently suggested that Cluster_2_Diseased were at better dysbiosis status compared with Cluster_1_Diseased.
Networks and Gatekeepers in Cluster_1_Diseased and Cluster_2_Diseased
The two bacterial networks of Cluster_1_Diseased and Cluster_2_Diseased were determined by CoNet analysis (Figure S2). None of the top 10 OTUs with the most correlations was found in the networks of both Cluster_1_Diseased and Cluster_2_Diseased (Table 2).
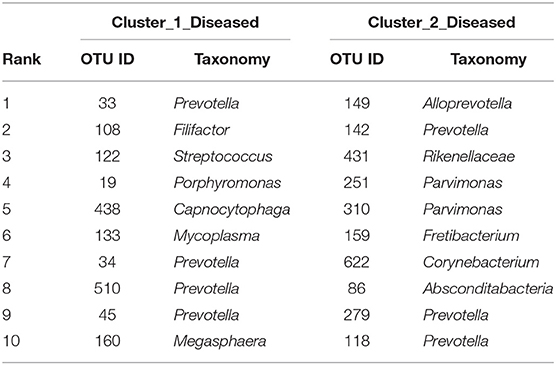
Table 2. The top 10 OTUs with most correlations in the OP bacterial networks of the two clustered OP microbiotas of H7N9 patients.
Fragmentation results demonstrated a lower fragmentation score in Cluster_2_Diseased (i.e., 0.419) than that of Cluster_1_Diseased (i.e., 0.717), suggesting that Cluster_2_Diseased had stronger co-occurrence patterns and greater biotic interactions than Cluster_1_Diseased. A group of nine OTUs was determined to be gatekeepers of Cluster_1_Diseased, and another group of nine OTUs was identified as gatekeepers of Cluster_2_Diseased (Table 3). OTU143_Capnocytophaga and OTU269_Treponema were determined as gatekeepers for both Cluster_1_Diseased and Cluster_2_Diseased.
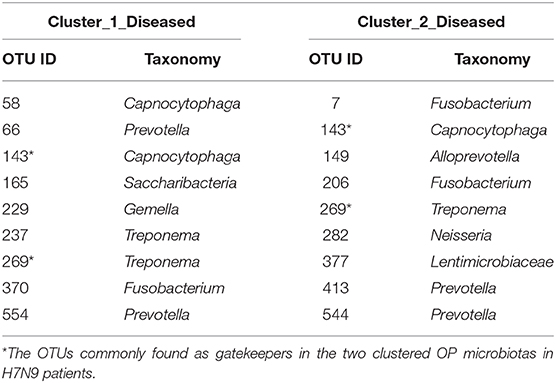
Table 3. Gatekeepers in the two OP bacterial networks of the two clustered H7N9 microbiotas identified by fragmentation analysis.
Comparisons of Two Clustered OP Microbiotas in H7N9_NSI or H7N9_SBLI
The two clustered OP microbiotas in H7N9_NSI or H7N9_SBLI were compared to determine the bacteria that could possibly drive the OP microbiotas to more severe microbial dysbiosis state in both H7N9_NSI and H7N9_SBLI.
Avian influenza dysbiosis ratio was significantly higher in Cluster_2_H7N9_NSI (5.98 ± 1.51 SE) compared with Cluster_1_H7N9_NSI (1.43 ± 0.31 SE) (t test, P = 0.001). Likewise, Cluster_2_H7N9_SBLI (4.44 ± 1.76 SE) had a significantly higher AIDR compared with Cluster_1_H7N9_SBLI (1.53 ± 0.30 SE) (t test, P < 0.03).
LEfSe results showed that 33 OTUs were associated with OP microbiotas of H7N9_NSI in Cluster_1 (Cluster_1_H7N9_NSI), and 20 OTUs were associated with OP microbiotas of H7N9_NSI in Cluster_2 (Cluster_2_H7N9_NSI) (Figure 4A). A total of 22 functional metabolites were determined to differentiate the Cluster_1_H7N9_NSI and Cluster_2_H7N9_NSI (Figure 5A).
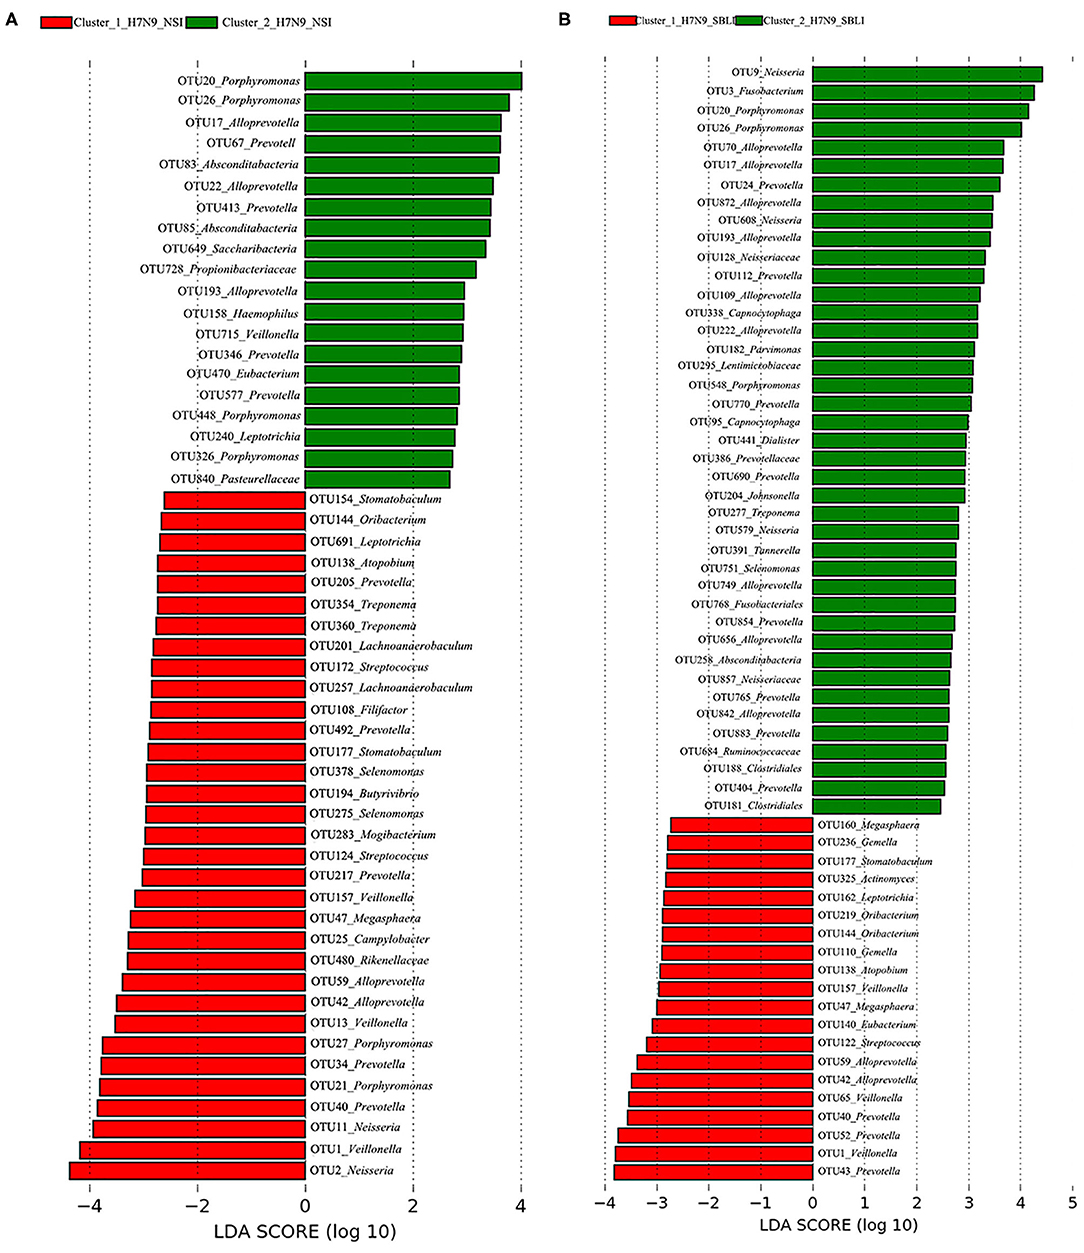
Figure 4. Operational taxonomic units associated with each of the two clustered OP microbiotas of (A) H7N9 patients with no secondary bacterial lung infection (H7N9_NSI) and (B) H7N9 patients with secondary bacterial lung infection (H7N9_SBLI).
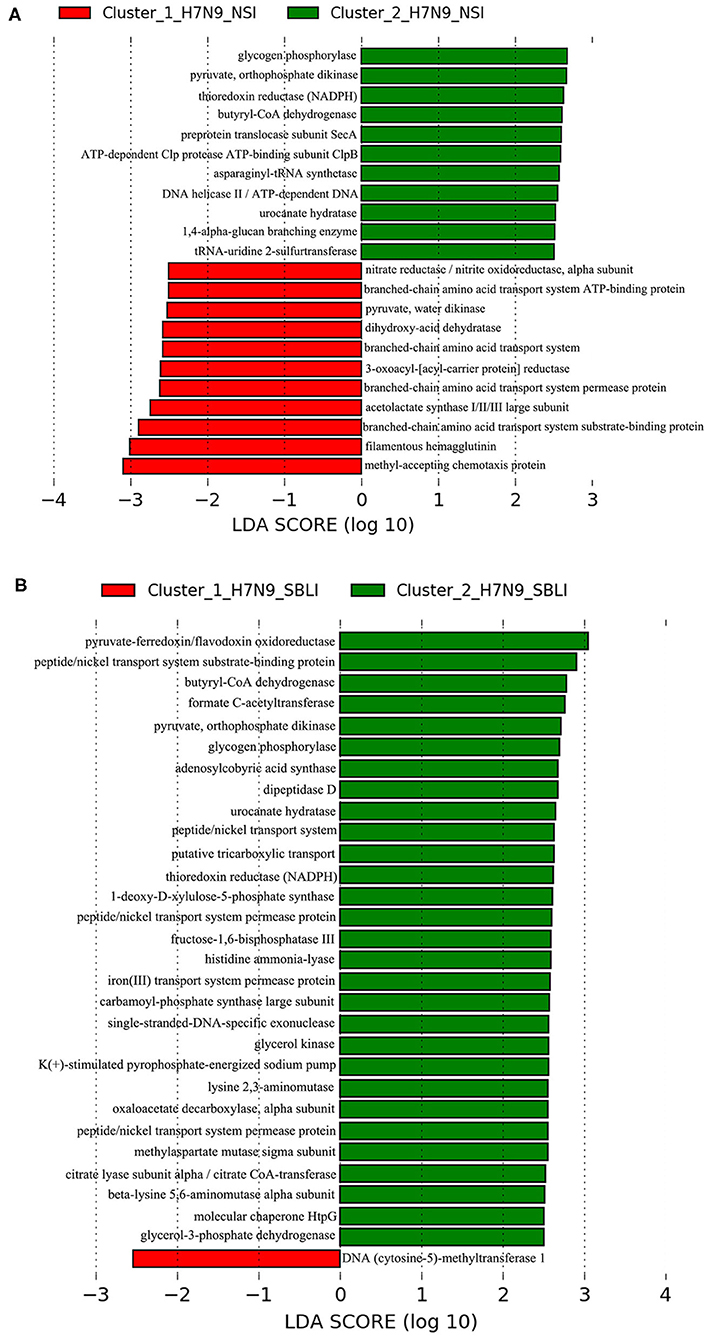
Figure 5. Functional metabolites associated with each of the two clustered OP microbiotas of (A) H7N9_NSI and (B) H7N9_SBLI.
Likewise, a total of 20 OTUs were more associated with Cluster_1_H7N9_SBLI, and 41 OTUs were more associated with Cluster_2_H7N9_SBLI (Figure 4B). A total of 30 functional metabolites were determined differentiating Cluster_1_H7N9_SBLI and Cluster_2_H7N9_SBLI, most of which (29) were more associated with Cluster_1_H7N9_SBLI, whereas only DNA (cytosine-5)-methyltransferase 1 was more associated with Cluster_2_H7N9_SBLI (Figure 5B).
More importantly, there were nine OTUs (i.e., OTUs 1, 40, 42, 47, 59, 138, 144, 157, and 177) associated with both Cluster_1_H7N9_NSI and Cluster_1_H7N9_SBLI (Figure 6A), which were assigned to seven taxa, including Alloprevotella, Atopobium, Megasphaera, Oribacterium, Prevotella, Stomatobaculum, and Veillonella. Likewise, four OTUs (i.e., 17, 20, 26, and 193) assigned to Alloprevotella or Porphyromonas were associated with both Cluster_2_H7N9_NSI and Cluster_2_H7N9_SBLI (Figure 6B).
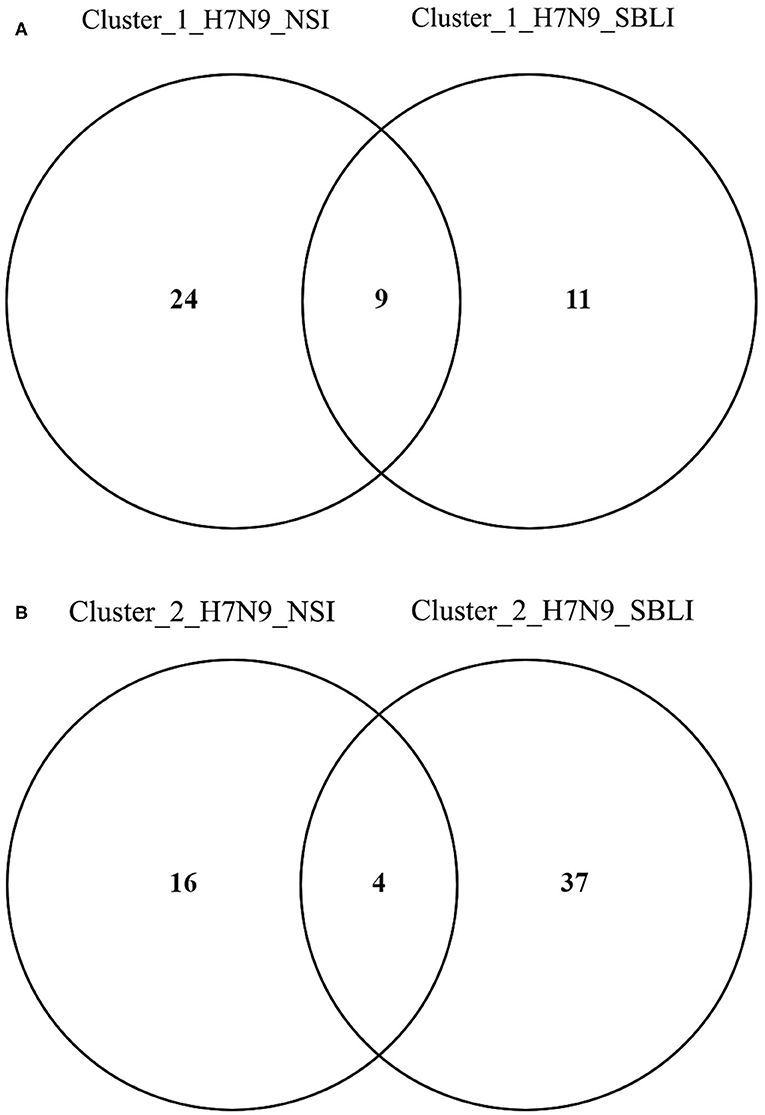
Figure 6. Operational taxonomic units associated with (A) OP microbiotas of both H7N9_NSI and H7N9_SBLI in Cluster_1 (i.e., Cluster_1_H7N9_NSI and Cluster_1_H7N9_SBLI) and (B) OP microbiotas of both H7N9_NSI and H7N9_SBLI in Cluster_2 (i.e., Cluster_2_H7N9_NSI and Cluster_2_H7N9_SBLI).
In addition, five of the 20 OTUs (i.e., OTUs 17, 20, 22, 26, and 67) associated with Cluster_2_H7N9_NSI were also identified being associated with healthy cohort. Likewise, five of 41 OTUs (i.e., OTUs 17, 20, 26, 749, and 765) associated with Cluster_2_H7N9_SBLI were also determined being associated with healthy cohort.
Correlations of the OTUs Associated With H7N9_NSI or H7N9_SBLI in Two Clusters
The correlations of the OTUs associated with each of the four groups, that is, Cluster_1_H7N9_NSI, Cluster_2_H7N9_NSI, Cluster_1_H7N9_SBLI, and Cluster_2_H7N9_SBLI, were determined by CoNet analyses (Figure 7). OTU441_Dialister was negatively correlated with four other OTUs associated with Cluster_2_H7N9_SBLI (Figure 7D), whereas most of the other OTUs had positive correlations in the four bacterial networks.
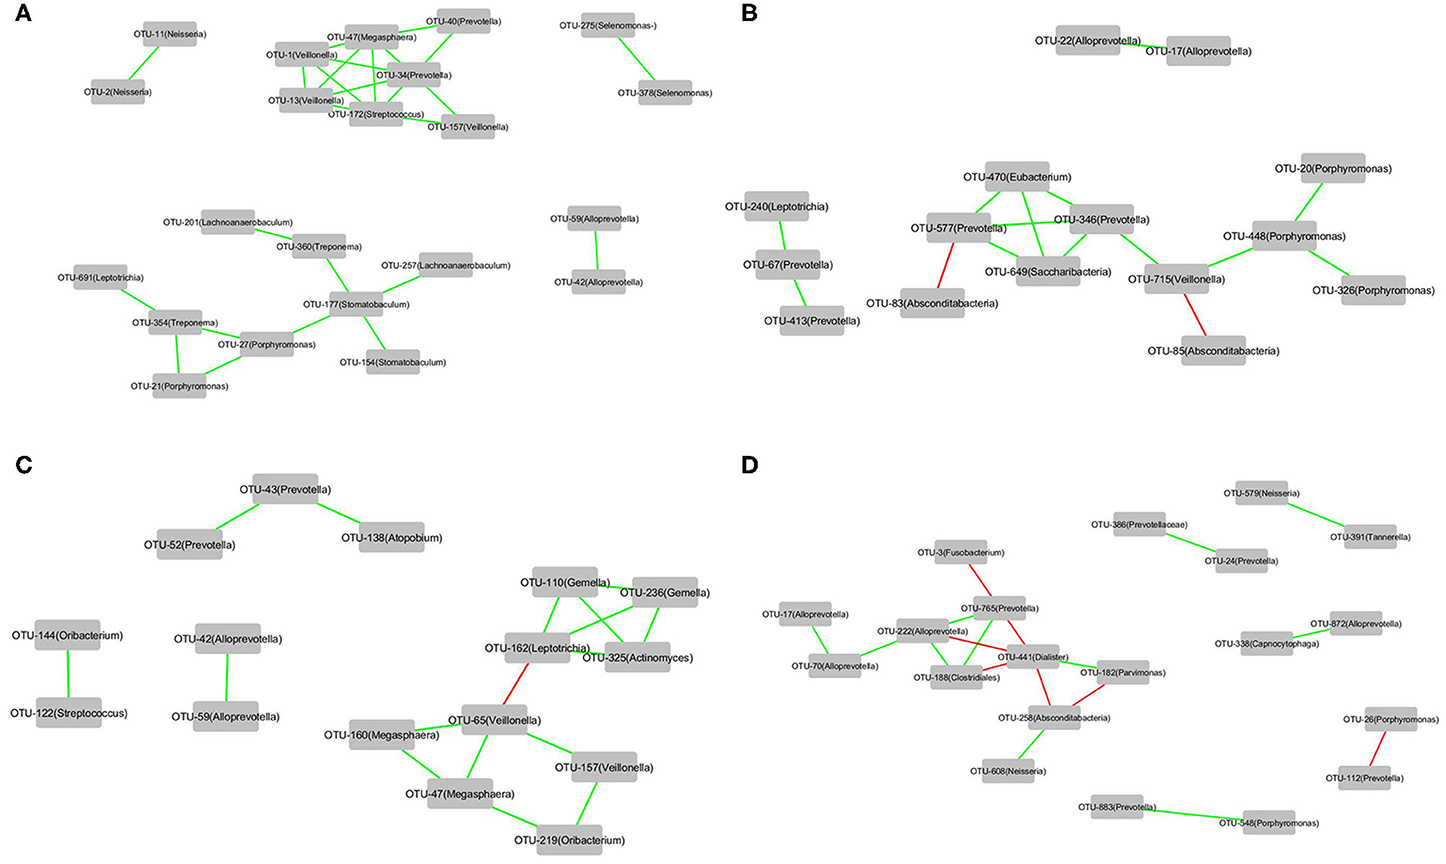
Figure 7. The correlations of the OTUs that were associated with (A) Cluster_1_H7N9_NSI, (B) Cluster_2_H7N9_NSI, (C) Cluster_1_H7N9_SBLI, and (D) Cluster_2_H7N9_SBLI.
Differences Between Cluster_1_Healthy and Cluster_2_Healthy
The PERMANOVA results showed a significant difference between the Cluster_1_Healthy and Cluster_2_Healthy (R2 = 0.689, P < 0.001). Avian influenza dysbiosis ratio was significantly higher in Cluster_2_Healthy (19.74 ± 3.83 SE) than Cluster_1_Healthy (4.83 ± 1.91 SE) (t test, P < 0.001).
A total of 28 OTUs were associated with Cluster_1_Healthy, with OTU1_Veillonella, OTU34_Prevotella, and OTU25_Campylobacter as the top three phylotypes differentiating Cluster_1_Healthy from Cluster_2_Healthy (Figure 8A). Likewise, 26 OTUs were associated with Cluster_2_Healthy, among which OTU9_Neisseria, OTU12_Neisseria, OTU7_Fusobacterium, OTU20_Porphyromonas, and OTU26_Porphyromonas were the leading phylotypes differentiating Cluster_2_Healthy from Cluster_1_Healthy (Figure 8A).
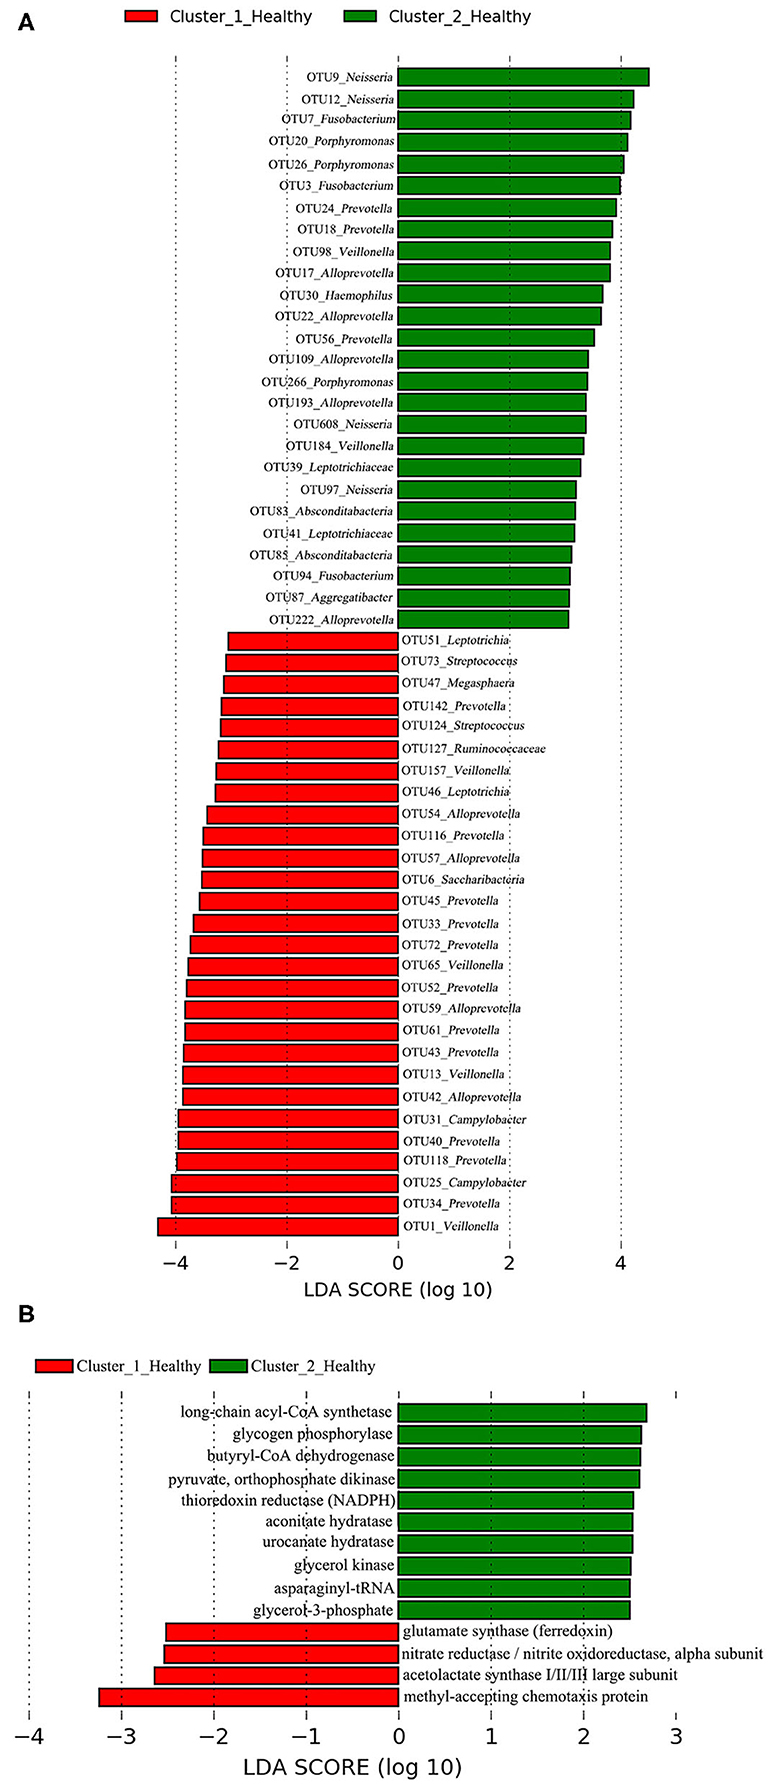
Figure 8. LEfSe analyses determined the (A) OTUs and (B) functional metabolites associated with each of the two clustered OP microbiotas of healthy subjects.
Four and 10 functional metabolites were associated with Cluster_1_Healthy and Cluster_2_Healthy, respectively (Figure 8B). The methyl-accepting chemotaxis protein was the metabolite most associated with Cluster_1_Healthy. By contrast, long-chain acyl-CoA synthetase, glycogen phosphorylase, and butyryl-CoA dehydrogenase were the three metabolites most associated with Cluster_2_Healthy.
Discussion
Highly pathogenic avian influenza virus, that is, H5N1, H5N6, and H7N9, could cause mortalities in human beings (3, 4, 7, 31–34). H7N9 has attracted great scientific interests since its emergence from the year 2013 (4, 35–42). However, there is a lack of research on the microbiotas in H7N9 patients (10, 43).
Oropharyngeal microbiota was believed as an important source of lung microbiota in human adults and children (11, 44, 45). Disordered OP microbiota was associated with multiple human diseases, such as schizophrenia, chronic obstructive pulmonary disease, and OP, head, and neck cancers (46–49). Different microbial colonization states have been determined on the affected tissues or organs of diseased cohorts (16–18). Different OP microbial colonization states could be associated with the stages or severities of disease and affect the effectiveness of the treatments. In the current study, we explored the vital members and characteristics of different OP microbial colonization states in H7N9 patients.
Comparisons of Two OP Microbial Colonization States in H7N9 Patients
Partition Around Medoids clustering analysis has been used to cluster the bacterial communities in different disease studies (16–18, 50, 51). In the present study, the OP microbiotas of both H7N9 and healthy cohorts were clustered into two clusters by PAM analysis. The significantly greater presence of H7N9 patients in Cluster_1 than in Cluster_2 suggested that OP microbiotas in the H7N9 patients within Cluster_1 were at worse dysbiosis status than those within Cluster_2.
Great difference was determined between Cluster_1_Diseased and Cluster_2_Diseased according to the PERMANOVA and SIMPER results, as well as the different evenness, suggesting that the two OP microbial colonization states in H7N9 patients were largely different.
Dysbiosis ratios of bacterial taxa are associated with different diseases and conditions (28, 52–54). For example, cirrhosis dysbiosis ratio was associated with the health status of cirrhotic cohorts (29). In the current study, AIDR was used to help determine the dysbiosis status of the two clustered OP microbiotas of H7N9 patients. Significantly lower AIDR in OP microbiotas of H7N9 patients than healthy subjects suggested AIDR is associated with the more severe dysbiosis status of OP microbiotas in H7N9 patients at baseline.
Avian influenza dysbiosis ratio was significantly higher in Cluster_2_Diseased than in Cluster_1_Diseased, suggesting the Cluster_2_Diseased was at better dysbiosis status compared with Cluster_1_Diseased. Less OTUs associated with H7N9 and more OTUs associated with healthy cohort were more abundant in Cluster_2_Diseased than in Cluster_1_Diseased, further suggesting that Cluster_2_Diseased was at better dysbiosis status compared with Cluster_1_Diseased.
Neisseria was determined as both pathogenic and non-pathogenic bacteria (55). In the present study, OTU2_Neisseria and OTU9_Neisseria were most closely associated with Cluster_1_Diseased and Cluster_2_Diseased, respectively, suggesting the OTUs with the same taxon could play different roles in the two clustered OP microbiotas of H7N9 patients. Veillonella was more abundant in the gut of H7N9 patients with or without antibiotics compared with healthy controls (43). In the current study, four Veillonella phylotypes (i.e., OTUs 1, 65, 13, and 157) were associated with Cluster_1_Diseased, whereas no Veillonella was associated with Cluster_2_Diseased, suggesting that the increased Veillonella in the OP microbiota could be a source of Veillonella in the gut of H7N9 patients with Cluster_1_Diseased.
Fragmentation analysis has been performed to determine the fragmentation levels and gatekeepers of microbiotas in some disease studies (16, 25). In the present study, lower level of network fragmentation was found in Cluster_2_Diseased than Cluster_1_Diseased, suggesting the Cluster_2_Diseased had stronger co-occurrence patterns and increased biotic interactions, implying the bacterial network of Cluster_1_Diseased may experience greater interruptions. Capnocytophaga was part of resident OP microbiota in human and could be opportunistic pathogens of extraoral infections (56–59), whereas Treponema was associated with endodontic infections (60, 61). Among the gatekeepers for Cluster_1_Diseased and Cluster_2_Diseased, OTU143_Capnocytophaga and OTU269_Treponema were determined as gatekeepers for both the two clustered microbiotas, suggesting the two phylotypes could possibly maintain the OP bacterial networks for consistent H7N9 infections in the recruited patients.
Comparisons of H7N9_NSI and H7N9_SBLI in the Two Clusters
The OP microbiotas of H7N9_NSI and H7N9_SBLI in Cluster_2 were both determined at better dysbiosis status compared with those in Cluster_1 according to the AIDR comparison results, suggesting both Cluster_2_H7N9_NSI and Cluster_2_H7N9_SBLI contributed to the better dysbiosis status of Cluster_2_Diseased compared with Cluster_1_Diseased.
Atopobium and Oribacterium could differentiate the OP microbiotas in H7N9_SBLI from those in H7N9_NSI (10). The current study revealed some phylotypes assigned to Atopobium and Oribacterium were associated with worse OP microbial colonization states (i.e., Cluster_1_H7N9_NSI and Cluster_1_H7N9_SBLI), suggesting these phylotypes were likely to cause more severe conditions in H7N9 patients. Some Alloprevotella and Porphyromonas species were determined as opportunistic oral pathogens (62–64). In the present study, OTU17_Alloprevotella, OTU20_Porphyromonas, OTU26_Porphyromonas, and OTU193_Alloprevotella were associated with both Cluster_2_H7N9_NSI and Cluster_2_H7N9_SBLI, suggesting the four phylotypes were more likely as opportunistic pathogens for inducing H7N9_NSI or H7N9_SBLI.
Correlations of the OTUs Associated With H7N9_NSI or H7N9_SBLI in the Two Clusters
A few Dialister species were associated with some oral diseases, such as periodontal disease, apical periodontitis, and dentinal caries (65–67). Among the OTUs associated with Cluster_2_H7N9_SBLI, OTU441_Dialister was negatively correlated with four OTUs in Cluster_2_H7N9_SBLI, suggesting this phylotype was more likely as pathogenic bacteria and had competitive interactions with some other phylotypes within this OP microbial colonization state. We acknowledge that further studies are needed to confirm it.
Functional Metabolites Associated With Each of the Two OP Microbial Colonization States in H7N9 Patients
Methyl-accepting chemotaxis protein is vital to the cell survival, pathogenesis, and biodegradation (68). In the current study, increased levels of methyl-accepting chemotaxis protein were more associated with both Cluster_1_Diseased and Cluster_1_H7N9_NSI compared with Cluster_2_Diseased and Cluster_2_H7N9_NSI, suggesting this metabolite was associated with worse dysbiosis state of OP microbiotas in H7N9 patients, possibly via enhancing the bacterial pathogenicity. Overexpression of DNA (cytosine-5)-methyltransferase 1 is associated with multiple diseases (i.e., psychosis vulnerability, liver, and stomach cancers) and plays a critical role in the malignant progression of hepatocellular carcinomas (69–71). DNA (cytosine-5)-methyltransferase 1 was the only functional metabolite differentiating Cluster_1_H7N9_SBLI from Cluster_2_H7N9_SBLI, suggesting this metabolite was commonly associated with the SBLI caused by varied bacteria during H7N9 infection.
Potential H7N9-Susceptible and H7N9-Tolerant Healthy Subjects
Greater AIDR was determined in Cluster_2_Healthy than Cluster_1_Healthy, suggesting the healthy subjects in Cluster_2 could be more tolerant to H7N9 infection than those in Cluster_1. Veillonella was more abundant in the gut of H7N9 patients than healthy controls as described above (43), whereas methyl-accepting chemotaxis protein plays a vital role in bacterial pathogenicity as described above (68). In the present study, OTU1_Veillonella and methyl-accepting chemotaxis protein were determined as the phylotype and functional metabolite most associated with Cluster_1_Healthy, suggesting they were more likely to enhance the greater susceptibility of the healthy subjects to H7N9 infection.
In conclusion, two OP microbial colonization states were determined in the H7N9 patients, each characterized by distinct phylotypes. Nine phylotypes assigned to Alloprevotella, Atopobium, Megasphaera, Oribacterium, Prevotella, Stomatobaculum, and Veillonella were likely to drive the OP microbiotas to worse microbial dysbiosis state in both H7N9_NSI and H7N9_SBLI. In addition, healthy subjects could have different susceptibilities to H7N9 infection.
Data Availability Statement
The raw sequencing data were deposited in NCBI under BioProject accession no. PRJNA638222.
Ethics Statement
The studies involving human participants were reviewed and approved by The Institutional Review Board and Ethics Committee of the First Affiliated Hospital of Zhejiang University. The patients/participants provided their written informed consent to participate in this study.
Author Contributions
HZha and LL designed the study. HL and HZhang collected samples and provided the raw sequencing data. HZha, JW, and KC contributed to the data analyses. HZha interpreted the results and drafted the manuscript. HZ, HL, and JW reviewed the manuscript. QW, JL, QL, and YL contributed to the literature search and participate in the study design. All authors approved the final manuscript.
Funding
This work was supported by the National Natural Science Foundation of China (81790631), the National Key Research and Development Program of China (2018YFC2000500).
Conflict of Interest
The authors declare that the research was conducted in the absence of any commercial or financial relationships that could be construed as a potential conflict of interest.
Acknowledgments
Thanks to Ang Li, Ting Zhang, Zhigang Ren for their help in the laboratory.
Supplementary Material
The Supplementary Material for this article can be found online at: https://www.frontiersin.org/articles/10.3389/fmed.2020.00396/full#supplementary-material
References
1. Nili H, Asasi K. Avian influenza (H9N2) outbreak in Iran. Avian Dis. (2003) 47:828–31. doi: 10.1637/0005-2086-47.s3.828
2. Alexander DJ. A review of avian influenza in different bird species. Vet Microbiol. (2000) 74:3–13. doi: 10.1016/S0378-1135(00)00160-7
3. Komar N, Olsen B. Avian influenza virus (H5N1) mortality surveillance. Emerg Infect Dis. (2008) 14:1176. doi: 10.3201/eid1407.080161
4. Dudley JP Mackay IM. Age-specific and sex-specific morbidity and mortality from avian influenza A (H7N9). J Clin Virol. (2013) 58:568–70. doi: 10.1016/j.jcv.2013.09.004
5. Chen Y, Liang W, Yang S, Wu N, Gao H, Sheng J, et al. Human infections with the emerging avian influenza A H7N9 virus from wet market poultry: clinical analysis and characterisation of viral genome. Lancet. (2013) 381:1916–25. doi: 10.1016/S0140-6736(13)60903-4
6. Uyeki TM, Cox NJ. Global concerns regarding novel influenza A (H7N9) virus infections. N Engl J Med. (2013) 368:1862–4. doi: 10.1056/NEJMp1304661
7. Gao H-N, Lu H-Z, Cao B, Du B, Shang H, Gan J-H, et al. Clinical findings in 111 cases of influenza A (H7N9) virus infection. N Engl J Med. (2013) 368:2277–85. doi: 10.1056/NEJMoa1305584
8. Subbarao K. Avian influenza H7N9 viruses: a rare second warning. Cell Res. (2018) 28:1–2. doi: 10.1038/cr.2017.154
9. Haynes L, Szaba FM, Eaton SM, Kummer LW, Lanthier PA, Petell AH, et al. Immunity to the conserved influenza nucleoprotein reduces susceptibility to secondary bacterial infections. J Immunol. (2012) 189:4921–9. doi: 10.4049/jimmunol.1201916
10. Lu H-f, Li A, Zhang T, Ren Z-g, He K-x, Zhang H, et al. Disordered oropharyngeal microbial communities in H7N9 patients with or without secondary bacterial lung infection. Emerg Microbies Infect. (2017) 6:1–11. doi: 10.1038/emi.2017.101
11. Man WH, de Steenhuijsen Piters WA, Bogaert D. The microbiota of the respiratory tract: gatekeeper to respiratory health. Nat Rev Microbiol. (2017) 15:259. doi: 10.1038/nrmicro.2017.14
12. Pereira PA, Aho VT, Paulin L, Pekkonen E, Auvinen P Scheperjans F. Oral and nasal microbiota in Parkinson's disease. Parkinsonism Relat Disord. (2017) 38:61–7. doi: 10.1016/j.parkreldis.2017.02.026
13. Dang HT, Park HK, Shin JW, Park S-G, Kim W. Analysis of oropharyngeal microbiota between the patients with bronchial asthma and the non-asthmatic persons. J Bacteriol Virol. (2013) 43:270–8. doi: 10.4167/jbv.2013.43.4.270
14. Zhu X-X, Yang X-J, Chao Y-L, Zheng H-M, Sheng H-F, Liu H-Y, et al. The potential effect of oral microbiota in the prediction of mucositis during radiotherapy for nasopharyngeal carcinoma. EBioMedicine. (2017) 18:23–31. doi: 10.1016/j.ebiom.2017.02.002
15. Lu H, Qian G, Ren Z, Zhang C, Zhang H, Xu W, et al. Alterations of Bacteroides sp., Neisseria sp., Actinomyces sp., and Streptococcus sp. populations in the oropharyngeal microbiome are associated with liver cirrhosis and pneumonia. BMC Infect Dis. (2015) 15:239. doi: 10.1186/s12879-015-0977-x
16. Zha H, Lewis G, Waite DW, Wu J, Chang K, Dong Y, et al. Bacterial communities associated with tail fan necrosis in spiny lobster, Jasus edwardsii. FEMS Microbiol Ecol. (2019) 95:fiz070. doi: 10.1093/femsec/fiz070
17. Chen Y, Guo J, Shi D, Fang D, Chen C Li L. Ascitic bacterial composition is associated with clinical outcomes in cirrhotic patients with culture-negative and nonneutrocytic ascites. Front Cell Infect Mi. (2018) 8:420. doi: 10.3389/fcimb.2018.00420
18. Stokholm J, Blaser MJ, Thorsen J, Rasmussen MA, Waage J, Vinding RK, et al. Maturation of the gut microbiome and risk of asthma in childhood. Nat Commun. (2018) 9:141. doi: 10.1038/s41467-017-02573-2
19. Edgar RC. UPARSE: highly accurate OTU sequences from microbial amplicon reads. Nat Methods. (2013) 10:996. doi: 10.1038/nmeth.2604
20. Caporaso JG, Kuczynski J, Stombaugh J, Bittinger K, Bushman FD, Costello EK, et al. QIIME allows analysis of high-throughput community sequencing data. Nat Methods. (2010) 7:335. doi: 10.1038/nmeth.f.303
21. Rousseeuw PJ. Silhouettes: a graphical aid to the interpretation and validation of cluster analysis. J Comput Appl Math. (1987) 20:53–65. doi: 10.1016/0377-0427(87)90125-7
22. Anderson MJ. A new method for non-parametric multivariate analysis of variance. Austral Ecol. (2001) 26:32–46. doi: 10.1111/j.1442-9993.2001.01070.pp.x
23. Segata N, Izard J, Waldron L, Gevers D, Miropolsky L, Garrett WS, et al. Metagenomic biomarker discovery and explanation. Genome Biol. (2011) 12:R60. doi: 10.1186/gb-2011-12-6-r60
24. Aßhauer KP, Wemheuer B, Daniel R Meinicke P. Tax4Fun: predicting functional profiles from metagenomic 16S rRNA data. Bioinformatics. (2015) 31:2882–4. doi: 10.1093/bioinformatics/btv287
25. Wagner Mackenzie B, Waite DW, Hoggard M, Douglas RG, Taylor MW Biswas K. Bacterial community collapse: a meta-analysis of the sinonasal microbiota in chronic rhinosinusitis. Environ Microbiol. (2017) 19:381–92. doi: 10.1111/1462-2920.13632
26. Brown MB. 400: A method for combining non-independent, one-sided tests of significance. Biometrics. (1975) 31:987–92. doi: 10.2307/2529826
27. Widder S, Besemer K, Singer GA, Ceola S, Bertuzzo E, Quince C, et al. Fluvial network organization imprints on microbial co-occurrence networks. Proc Natl Acad Sci USA. (2014) 111:12799–804. doi: 10.1073/pnas.1411723111
28. He C, Wang H, Liao W-D, Peng C, Shu X, Zhu X, et al. Characteristics of mucosa-associated gut microbiota during treatment in Crohn's disease. World J Gastroenterol. (2019) 25:2204. doi: 10.3748/wjg.v25.i18.2204
29. Bajaj JS, Heuman DM, Hylemon PB, Sanyal AJ, White MB, Monteith P, et al. Altered profile of human gut microbiome is associated with cirrhosis and its complications. J Hepatol. (2014) 60:940–7. doi: 10.1016/j.jhep.2013.12.019
30. Oliveros J. An Interactive Tool for Comparing Lists with Venn's Diagrams (2007–2015) (2018). Available online at: https://bioinfogp.cnb.csic.es/tools/venny/index.html.
31. Seo SH, Hoffmann E, Webster RG. Lethal H5N1 influenza viruses escape host anti-viral cytokine responses. Nat Med. (2002) 8:950. doi: 10.1038/nm757
32. Peiris J, Yu W, Leung C, Cheung C, Ng W, Nicholls Ja, et al. Re-emergence of fatal human influenza A subtype H5N1 disease. Lancet. (2004) 363:617–9. doi: 10.1016/S0140-6736(04)15595-5
33. de Jong MD, Cam BV, Qui PT, Hien VM, Thanh TT, Hue NB, et al. Fatal avian influenza A (H5N1) in a child presenting with diarrhea followed by coma. N Engl J Med. (2005) 352:686–91. doi: 10.1056/NEJMoa044307
34. Wu Z-Q, Zhang Y, Zhao N, Yu Z, Pan H, Chan T-C, et al. Comparative epidemiology of human fatal infections with novel, high (H5N6 and H5N1) and low (H7N9 and H9N2) pathogenicity avian influenza A viruses. Int J Environ Res Public Health. (2017) 14:263. doi: 10.3390/ijerph14030263
35. Li Q, Zhou L, Zhou M, Chen Z, Li F, Wu H, et al. Epidemiology of human infections with avian influenza A (H7N9) virus in China. N Engl J Med. (2014) 370:520–32. doi: 10.1056/NEJMoa1304617
36. Zhou L, Tan Y, Kang M, Liu F, Ren R, Wang Y, et al. Preliminary epidemiology of human infections with highly pathogenic avian influenza A (H7N9) virus, China, 2017. Emerg Infect Dis. (2017) 23:1355. doi: 10.3201/eid2308.170640
37. Wang X, Jiang H, Wu P, Uyeki TM, Feng L, Lai S, et al. Epidemiology of avian influenza A H7N9 virus in human beings across five epidemics in mainland China, 2013–17: an epidemiological study of laboratory-confirmed case series. Lancet Infect Dis. (2017) 17:822–32. doi: 10.1016/S1473-3099(17)30323-7
38. Shi J, Deng G, Ma S, Zeng X, Yin X, Li M, et al. Rapid evolution of H7N9 highly pathogenic viruses that emerged in China in 2017. Cell Host Microbe. (2018) 24:558–68. doi: 10.1016/j.chom.2018.08.006
39. Wang Z, Zhu L, Nguyen TH, Wan Y, Sant S, Quiñones-Parra SM, et al. Clonally diverse CD38+ HLA-DR+ CD8+ T cells persist during fatal H7N9 disease. Nat Commun. (2018) 9:824. doi: 10.1038/s41467-018-03243-7
40. Lam TT-Y, Zhou B, Wang J, Chai Y, Shen Y, Chen X, et al. Dissemination, divergence and establishment of H7N9 influenza viruses in China. Nature. (2015) 522:102. doi: 10.1038/nature14348
41. Gostic KM, Ambrose M, Worobey M Lloyd-Smith JO. Potent protection against H5N1 and H7N9 influenza via childhood hemagglutinin imprinting. Science. (2016) 354:722–6. doi: 10.1126/science.aag1322
42. Ma M-J, Yang Y Fang L-Q. Highly pathogenic avian H7N9 influenza viruses: recent challenges. Trends Microbiol. (2019) 27:93–5. doi: 10.1016/j.tim.2018.11.008
43. Qin N, Zheng B, Yao J, Guo L, Zuo J, Wu L, et al. Influence of H7N9 virus infection and associated treatment on human gut microbiota. Sci Rep. (2015) 5:14771. doi: 10.1038/srep14771
44. Bassis CM, Erb-Downward JR, Dickson RP, Freeman CM, Schmidt TM, Young VB, et al. Analysis of the upper respiratory tract microbiotas as the source of the lung and gastric microbiotas in healthy individuals. MBio. (2015) 6:e00037–15. doi: 10.1128/mBio.00037-15
45. Marsh R, Kaestli M, Chang AB, Binks M, Pope C, Hoffman L, et al. The microbiota in bronchoalveolar lavage from young children with chronic lung disease includes taxa present in both the oropharynx and nasopharynx. Microbiome. (2016) 4:37. doi: 10.1186/s40168-016-0182-1
46. Castro-Nallar E, Bendall ML, Pérez-Losada M, Sabuncyan S, Severance EG, Dickerson FB, et al. Composition, taxonomy and functional diversity of the oropharynx microbiome in individuals with schizophrenia and controls. PeerJ. (2015) 3:e1140. doi: 10.7717/peerj.1140
47. Lim Y, Totsika M, Morrison M Punyadeera C. Oral microbiome: A new biomarker reservoir for oral and oropharyngeal cancers. Theranostics. (2017) 7:4313. doi: 10.7150/thno.21804
48. Liu H-Y, Zhang S-Y, Yang W-Y, Su X-F, He Y, Zhou H-W, et al. Oropharyngeal and sputum microbiomes are similar following exacerbation of chronic obstructive pulmonary disease. Front Microbiol. (2017) 8:1163. doi: 10.3389/fmicb.2017.01163
49. Galvão-Moreira LV da Cruz MCFN. Oral microbiome, periodontitis and risk of head and neck cancer. Oral Oncol. (2016) 53:17–9. doi: 10.1016/j.oraloncology.2015.11.013
50. Seekatz AM, Rao K, Santhosh K Young VB. Dynamics of the fecal microbiome in patients with recurrent and nonrecurrent Clostridium difficile infection. Genome Med. (2016) 8:47. doi: 10.1186/s13073-016-0298-8
51. Zha H, Fang D-Q, van der Reis A, Chang K, Yang L-Y, Xie J-J, et al. Vital members in the gut microbiotas altered by two probiotic Bifidobacterium strains against liver damage in rats. BMC Microbiol. (2020) 20:1–12. doi: 10.1186/s12866-020-01827-2
52. Lu Y, Chen J, Zheng J, Hu G, Wang J, Huang C, et al. Mucosal adherent bacterial dysbiosis in patients with colorectal adenomas. Sci Rep. (2016) 6:26337. doi: 10.1038/srep26337
53. De Minicis S, Rychlicki C, Agostinelli L, Saccomanno S, Candelaresi C, Trozzi L, et al. Dysbiosis contributes to fibrogenesis in the course of chronic liver injury in mice. Hepatology. (2014) 59:1738–49. doi: 10.1002/hep.26695
54. Sze MA Schloss PD. Looking for a signal in the noise: revisiting obesity and the microbiome. MBio. (2016) 7:e01018–16. doi: 10.1128/mBio.01018-16
55. Snyder LA Saunders NJ. The majority of genes in the pathogenic Neisseria species are present in non-pathogenic Neisseria lactamica, including those designated as' virulence genes'. BMC Genomics. (2006) 7:128. doi: 10.1186/1471-2164-7-128
56. Frandsen EV, Poulsen K, Könönen E Kilian M. Diversity of Capnocytophaga species in children and description of Capnocytophaga leadbetteri sp. nov. and Capnocytophaga genospecies AHN8471. Int J Syst Evol Microbiol. (2008) 58:324–36. doi: 10.1099/ijs.0.65373-0
57. Bonatti H, Rossboth D, Nachbaur D, Fille M, AspöUck C, Hend I, et al. A series of infections due to Capnocytophaga spp. in immunosuppressed and immunocompetent patients. Clin Microbiol Infect. (2003) 9:380–7. doi: 10.1046/j.1469-0691.2003.00538.x
58. Gerster J Dudler J. Cellulitis caused by Capnocytophaga cynodegmi associated with etanercept treatment in a patient with rheumatoid arthritis. Clin Rheumatol. (2004) 23:570–1. doi: 10.1007/s10067-004-0950-3
59. Butler T. Capnocytophaga canimorsus: an emerging cause of sepsis, meningitis, and post-splenectomy infection after dog bites. Eur J Clin Microbiol Infect Dis. (2015) 34:1271–80. doi: 10.1007/s10096-015-2360-7
60. Siqueira Jr J, Rôças I, Favieri A Santos K. Detection of Treponema denticola in endodontic infections by 16S rRNA gene-directed polymerase chain reaction. Oral Microbiol Immunol. (2000) 15:335–7. doi: 10.1034/j.1399-302x.2000.150512.x
61. Foschi F, Izard J, Sasaki H, Sambri V, Prati C, Müller R, et al. Treponema denticola in disseminating endodontic infections. J Dent Res. (2006) 85:761–5. doi: 10.1177/154405910608500814
62. Hu Y, Zhang C, Pang W, Huang Y Zhang Y. The gastric microbiome is perturbed in advanced gastric adenocarcinoma identified through shotgun metagenomics. Front Cell Infect Mi. (2018) 8:433. doi: 10.3389/fcimb.2018.00433
63. Bostanci N Belibasakis GN. Porphyromonas gingivalis: an invasive and evasive opportunistic oral pathogen. FEMS Microbiol Lett. (2012) 333:1–9. doi: 10.1111/j.1574-6968.2012.02579.x
64. Lee J, Roberts JS, Atanasova KR, Chowdhury N, Han K Yilmaz Ö. Human primary epithelial cells acquire an epithelial-mesenchymal-transition phenotype during long-term infection by the oral opportunistic pathogen, Porphyromonas gingivalis. Front Cell Infect Mi. (2017) 7:493. doi: 10.3389/fcimb.2017.00493
65. Ferraro CTL, Gornic C, Barbosa AS, Peixoto RJM, Colombo APV. Detection of Dialister pneumosintes in the subgingival biofilm of subjects with periodontal disease. Anaerobe. (2007) 13:244–8. doi: 10.1016/j.anaerobe.2007.09.002
66. Rôças IN Siqueira Jr JF. Characterization of Dialister species in infected root canals. J Endod. (2006) 32:1057–61. doi: 10.1016/j.joen.2006.04.010
67. Siqueira Jr JF Rôças IN. As-yet-uncultivated oral bacteria: breadth and association with oral and extra-oral diseases. J Oral Microbiol. (2013) 5:21077. doi: 10.3402/jom.v5i0.21077
68. Ud-Din AIMS, Roujeinikova A. Methyl-accepting chemotaxis proteins: a core sensing element in prokaryotes and archaea. Cell Mol Life Sci. (2017) 74:3293–303. doi: 10.1007/s00018-017-2514-0
69. Saito Y, Kanai Y, Nakagawa T, Sakamoto M, Saito H, Ishii H, et al. Increased protein expression of DNA methyltransferase (DNMT) 1 is significantly correlated with the malignant potential and poor prognosis of human hepatocellular carcinomas. Int J Cancer. (2003) 105:527–32. doi: 10.1002/ijc.11127
70. Etoh T, Kanai Y, Ushijima S, Nakagawa T, Nakanishi Y, Sasako M, et al. Increased DNA methyltransferase 1 (DNMT1) protein expression correlates significantly with poorer tumor differentiation and frequent DNA hypermethylation of multiple CpG islands in gastric cancers. Am J Pathol. (2004) 164:689–99. doi: 10.1016/s0002-9440(10)63156-2
Keywords: H7N9, microbial colonization states, oropharyngeal microbiota, dysbiosis status, secondary bacterial lung infection, illumina sequencing
Citation: Zha H, Lu H, Wu J, Chang K, Wang Q, Zhang H, Li J, Luo Q, Lu Y and Li L (2020) Vital Members in the More Dysbiotic Oropharyngeal Microbiotas in H7N9-Infected Patients. Front. Med. 7:396. doi: 10.3389/fmed.2020.00396
Received: 16 March 2020; Accepted: 24 June 2020;
Published: 11 August 2020.
Edited by:
Ying Zhang, Johns Hopkins University, United StatesCopyright © 2020 Zha, Lu, Wu, Chang, Wang, Zhang, Li, Luo, Lu and Li. This is an open-access article distributed under the terms of the Creative Commons Attribution License (CC BY). The use, distribution or reproduction in other forums is permitted, provided the original author(s) and the copyright owner(s) are credited and that the original publication in this journal is cited, in accordance with accepted academic practice. No use, distribution or reproduction is permitted which does not comply with these terms.
*Correspondence: Lanjuan Li, bGpsaUB6anUuZWR1LmNu
†These authors have contributed equally to this work