 Satoshi Nagase1†
 Shigehiro Karashima2†
 Hiromasa Tsujiguchi3Hirohito Tsuboi4Sakae Miyagi3
 Mitsuhiro Kometani2Daisuke Aono2Takuya Higashitani2Masashi Demura5
 Hiroyuki Sakakibara6
 Akihiro Yoshida7Akinori Hara3Hiroyuki Nakamura3Yoshiyu Takeda2Hidetaka Nambo8Takashi Yoneda2,9*
 Shigefumi Okamoto1*
- 1Department of Laboratory Science, Faculty of Health Sciences, Kanazawa University, Kanazawa, Japan
- 2Department of Endocrinology and Metabolism, Kanazawa University Hospital, Kanazawa, Japan
- 3Department of Environmental and Preventive Medicine, Advanced Preventive Medical Sciences, Kanazawa University, Kanazawa, Japan
- 4Division of Psychosomatic Medicine, Institute of Medical, Pharmaceutical, and Health Sciences, Kanazawa University, Kanazawa, Japan
- 5Department of Hygiene, Kanazawa University Graduate School of Medicine, Kanazawa, Japan
- 6Graduate School of Agriculture, University of Miyazaki, Miyazaki, Japan
- 7Department of Oral Microbiology, Matsumoto Dental University Graduate School of Oral Medicine, Shiojiri, Japan
- 8School of Electrical, Information, and Communication Engineering, College of Science and Engineering, Kanazawa University, Kanazawa, Japan
- 9Department of Health Promotion and Medicine of the Future, Kanazawa University Graduate School of Medicine, Kanazawa, Japan
Salt intake is one of the most important environmental factors impacting hypertension onset. Meanwhile, the potential roles of the gut microbiome (GM) in altering the health status of hosts have drawn considerable attention. Here, we aimed to perform an observational study to investigate the impact of intestinal bacterial flora in hypertensive patients with low-salt or high-salt intake. A total of 239 participants were enrolled, and their gut microbiomes, clinical and demographic details, as well as physiological parameters pertaining to the renin-angiotensin-aldosterone system and inflammatory cytokine profiles, were examined. The participants were classified into four groups based on the presence of different enterotype bacteria, as determined via cluster analysis, and salt intake: low salt/GM enterotype 1, low salt/GM enterotype 2, high salt/GM enterotype 1, and high salt/GM enterotype 2. Results show that the prevalence of hypertension was significantly lower in the low-salt/GM enterotype 2 group (27%) compared to the low salt/GM enterotype 1 group (47%; p = 0.04). Alternatively, no significant differences were observed in hypertension prevalence between the two high-salt intake groups (GM enterotype 1 = 50%, GM enterotype 2 = 47%; p = 0.83). Furthermore, The low-salt/GM enterotype 2 was higher in the relative abundances of Blautia, Bifidobacterium, Escherichia-Shigella, Lachnoclostridium, and Clostridium sensu stricto than the low-salt/GM enterotype 1. differed significantly between the GM enterotypes. These results suggested that consumption of a low-salt diet was ineffective in regulating hypertension in individuals with a specific gut bacteria composition. Our findings support the restoration of GM homeostasis as a new strategy for controlling blood pressure and preventing the development of hypertension.
Introduction
Hypertension has become an important global health issue and is a major risk factor for cardiovascular, cerebrovascular, and kidney diseases (1, 2). It is believed that the etiology of hypertension depends on the complex interplay of both genetic and environmental factors (3, 4). Salt intake is one of the most important environmental factors of hypertension onset. For instance, the Intersalt Cooperative Research Group found significant positive relationships between 24 h urinary sodium excretion and blood pressure (BP) in the study participants (5). In addition, the Dietary Approaches to Stop Hypertension (DASH) interventional study showed that dietary salt-intake patterns may affect BP in the adult population with BP in the high normal range compared to those that are moderately hypertensive (6). Most studies show that excess sodium consumption raises BP in a dose-dependent manner; however, salt sensitivity, that is how BP responds to salt, varies, with less than one-third of normotensive individuals and less than one-half of hypertensive individuals classified as salt sensitive (7–10). Known sources of such variability include genetic polymorphisms of the associated renin-angiotensin-aldosterone system (RAAS), dietary intake, and kidney disease.
In recent decades, the potential roles of the gut microbiome (GM) in altering the health status of hosts have drawn considerable attention. Several lines of evidence suggest a link between GM and lifestyle disease, including diabetes, obesity, and hypertension (11–13). For instance, GM dysbiosis accompanies hypertension in rodents (14, 15). In Dahl rats, distinct differences in metagenomic composition have been identified for salt-sensitive and salt-resistant strains (16). Furthermore, the GM of salt-sensitive rats is suggested to have symbiotic relationships with their hosts (16). This suggests that changes in GM precede the onset of hypertension, which is supported by the findings of Wilck et al., who demonstrated that feeding mice a high-salt diet decreases the proportion of gut Lactobacillus murinus, which is associated with increased number and activation of TH17 cells (17). These cells secrete a pro-inflammatory cytokine, interleukin-17 (IL-17), which is believed to promote high BP and accompanying inflammation in artery walls (17). However, most of these studies were performed using animal models, which may not directly translate to human disease. Furthermore, there are only limited human clinical trials that have been performed to decipher the relationships between dietary salt, GM, immunological reactions, and BP. The aim of the current observational study was to, therefore, investigate the impact of the intestinal bacterial flora on hypertensive patients with low-salt intake.
Materials and Methods
Study Population
We used cross-sectional data of the Shika study, which is a population-based study that aims to establish a method to prevent lifestyle-related diseases (18, 19). It includes interviews, questionnaires, and health examinations. Health examination data was collected between March 2014 and January 2018 from the residents of Shika, a town with more than 20,000 residents (20), located in a north area of Ishikawa Prefecture, Japan (21). The present study was conducted from December 2017 through January 2018 with four model districts in Shika being selected, including Horimatsu, Higashi-Masuho, Tsuchida, and Togi.
Ethical Considerations
The study was approved by the Ethics Committee for Human Studies at Kanazawa University Hospital (No. 1491) and was performed in accordance with the principles of the Declaration of Helsinki and the Microorganism Safety Management Regulations of Kanazawa University. All participants were provided an explanation of the research and subsequently provided written informed consent prior to the collection of gut microorganisms. Collected microorganisms were processed in a biosafety level-2 laboratory.
Data Collection
Data through the Shika study were collected by participant interviews and included demographics, such as age, sex, underlying diseases, and medications. Height, weight, and BP were measured during study visits. Specifically, BP was measured when the subjects were seated in a chair. A suitably sized cuff was placed on the right upper arm and attached to UM-15P (Parama-tech Co., Ltd., Fukuoka, Japan) and HEM-907 (OMRON Co., Ltd., Kyoto, Japan). BP monitors contained automated digital sphygmomanometer based on the oscillometric method (18). Hypertension was defined as sBP of 140 mmHg, dBP of 90 mmHg, or if participants reported use of antihypertensive drugs. Venous blood samples were collected in the mornings after 15 min periods of rest following a 12 h overnight fast.
Daily salt-intake was evaluated by urine sodium levels and creatine ratios in urine samples (22). Estimated glomerular filtration rates (eGFR) were calculated using serum creatinine levels. Plasma renin activity (PRA) and plasma aldosterone concentration (PAC) were measured using radioimmunoassays, as previously reported (23). Serum levels of cytokines, including, granulocyte-macrophage colony-stimulating factor (GM-CSF), interleukin-17a (IL-17a), and tumor necrosis factor alfa (TNF-α) were measured using a MILLIPLEX MAP Human High Sensitivity T Cell Panel-Immunology Multiplex Assay (Merck KGaA, Darmstadt, Germany) and Luminex® 200TM flow cytometry system (Thermo Fisher Scientific, MA, US).
Stool Sample Collection and DNA Extraction
Stool samples were collected from 254 participants. However, 15 of the samples were excluded due to the subjects taking antimicrobial or steroid drugs, resulting in 239 stool samples for analysis. Fecal sample collection was accomplished using clean paper (AS ONE Inc., Osaka Japan) and a clean spatula with plastic tube (AS ONE Inc.). The fecal samples were then transferred to sterile closed plastic tubes the in morning and transported to the laboratory on ice within the day. The samples were stored at −80°C until DNA extraction. Whole DNA was extracted from the fecal samples using NucleoSpin® DNA Stool (Macherey-Nagel Inc., Düren Germany) according to the manufacturer's instructions.
Next Generation Sequencing (NGS)
The extracted DNA of gut microbiome was processed for 16S rRNA gene sequencing by NGS using methods previously described (24). V3-4 regions of the 16S rRNA gene were amplified using Ex Taq® Hot Start Version polymerase and TaKaRa PCR Thermal Cycler Dice® Gradient (TaKaRa Bio Inc., Shiga, Japan). The PCR products were purified by Agencourt AMPure XP magnetic beads (Beckman Coulter, Inc., CA, USA). The amount of the PCR products were measured by Qubit® dsDNA HS Assay Kit and Qubit® 3.0 fluorometer (Thermo Fisher Scientific, Inc.). All purified PCR products were sent to Hokkaido System Science Co., Ltd. (Hokkaido, Japan) for Illumina MiSeq sequencing. The NGS data were registered in the DNA Data Bank of Japan (DDBJ; accession number PRJDB8820).
Microbiome Analysis
Microbiome analysis was performed according to methods reported in a previous study (24). The pair-end sequences were filtered by Sickle (version 1.33) (25) and assembled by PANDAseq (version 2.11) (26). Removed chimera sequences were used by USEARCH (version 10.0.240_i86linux32) (27) and Silva 16S rRNA database (release 132) (28). From non-chimeric sequences, the “pick_de_novo_otus.py” command in Qiime (version 1.9.1) and the Silva 16S rRNA gene database (release 132) was used to generate operational taxonomic unit (OTU) (97% similarity threshold) (29). Finally, global singletons were removed using the “filter_otus_from_otu_table.py” command in Qiime.
Statistics
R Package (version 3.5.0) software was used for all statistical analyses (30). Box plots showed the median, 1st quartile, 3rd quartile with 1st quartile + 1.5 × interquartile range (IQR), and 3rd quartile – 1.5 × IQR whiskers, and points exhibited outliers. Participant characteristics and relative abundance among each group were compared using one-way analysis of variance (ANOVA) and analysis of covariance (ANCOVA) with adjustment for age, sex, and body mass index (BMI). The relative abundance of each microgram was compared using the DESeq2 package (31). Cluster analysis was performed based on the previous study (32). Principal component analysis (PCA) used Jensen-Shannon divergence values based on the genus level. Cluster analysis was performed used Partitioning Around Medoid (PAM) clustering. The PCA and cluster analysis were performed using “philentropy” and “pamr” package (32, 33). A random forest analysis used the randomForest package of R (34). All microorganisms and participant information [age, sex, BMI, PRA, PAC, eGFR, diabetes mellitus (DM) rate, hyperlipidemia (HL) rate, IL-17a levels, GM-CSF levels, and TNF-α levels] were evaluated with the random forest function using default parameters. Random forest analysis of bacterial genera and participant information contained out of bag error rates of 44.3 and 37.7%, respectively. The similarity of microbiome composition between each participant group was assessed by permutational multivariate analysis of variance (PERMANOVA) using the “adonis” command in the vegan package of R (10,000 simulations) (35).
Results
Enterotype Clustering and Salt Intake
In total, 239 participants were included for analysis. The prevalence of hypertension was 44.8% in the study population. Mean systolic BP (SBP) and diastolic BP (DBP) were 136 ± 17 and 80 ± 11 mmHg, respectively. The mean daily salt-intake was 9.4 ± 1.9 g/day (median 9.6 g/day). The antihypertensive drug usage rate was 11.7% (28/239). Specifically, 25 participants were treated with angiotensin converting enzyme inhibitors and/or angiotensin receptor blockers. There was no participant treated with mineralocorticoid receptor antagonists. There were three patients treated with the other antihypertensives excluding RAAS inhibitors.
To explore the potential differences between hypertension rates with respect to microbiome and salt intake, the participants were separated into four groups based on cluster analysis. First, the GMs of the participants were structured into two enterotypes using the PAM clustering method based on Jensen-Shannon distance (Figures 1A,B). There was no significant difference in the participant information between the two enterotypes (Supplemental Table 1). Next, two groups were formed based on median salt-intake values, a high-salt group which was defined as higher than 9.6 g/day of daily salt-intake, and a low-salt group which was defined as the lower. There was no significant difference in relative microgram levels of salt between the high-salt and low-salt groups. Finally, we classified the study participants into four groups based on GM enterotype and salt intake. These included a low salt/GM enterotype 1 group, a low salt/GM enterotype 2 group, a high salt/GM enterotype 1 group, and a high salt/GM enterotype 2 group.
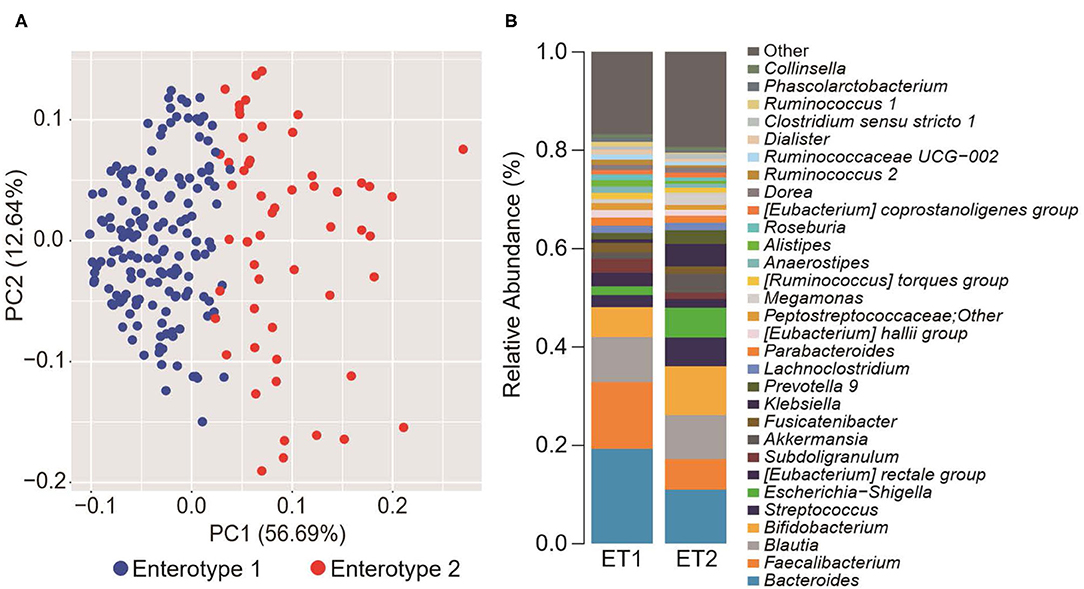
Figure 1. Gut microbiome differences determined by clustering analysis. (A) Principal component analysis (PCA) plot generated using the Partitioning Around Medoid (PAM) clustering method based on Jensen-Shannon distance of operational taxonomic unit (OTU) counts. Blue, enterotype 1; Red, enterotype 2. (B) Relative abundance of the top 30 microorganisms identified by the gut microbiome cluster.
Clinical Background
The clinical background information for the four groups of participants based on salt intake and GM are shown in Table 1. There were significant differences among the four groups with respect to the prevalence of females (p = 0.04), daily salt intake (p < 0.01), and PAC (p < 0.01). However, no differences were observed for any other clinical parameters including sBP (p = 0.21) and dBP (p = 0.34). There were, however, significant difference observed between the low-salt groups with respect to the prevalence of females (p = 0.02). Meanwhile, the high-salt groups did not exhibit significant differences between enterotype 1 and enterotype 2 (Supplemental Table 2).
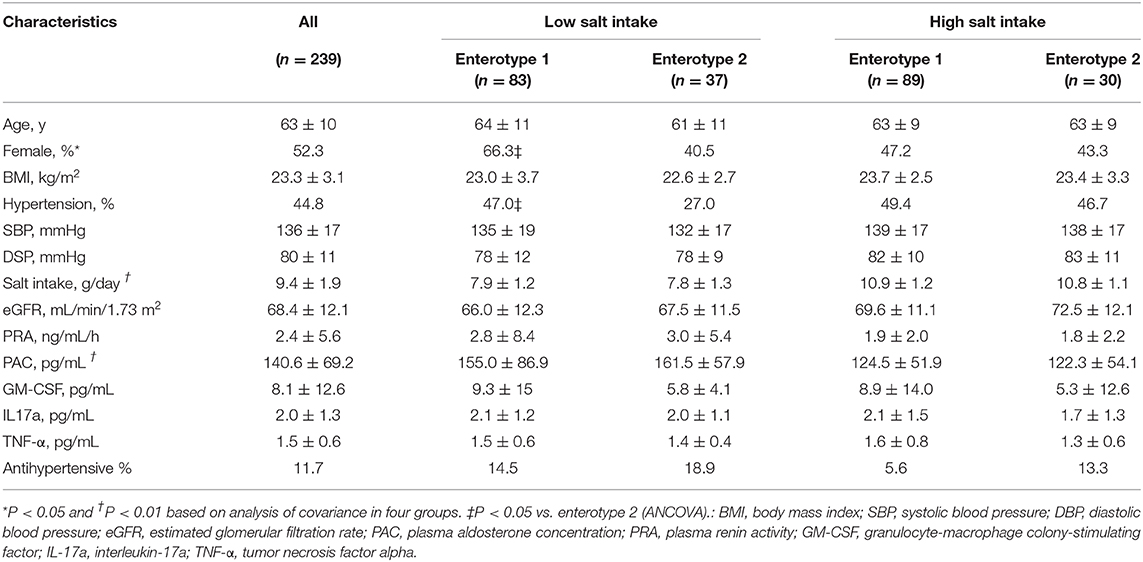
Table 1. Characteristics of the four groups of study participants categorized by gut microbiome clustering and daily salt-intake.
Prevalence of Hypertension a Random Forest Analysis
Figure 2 shows the prevalence of hypertension in the four groups of participants categorized by enterotype and daily salt-intake. The prevalence of hypertension was significantly different (p < 0.05) for the two GM enterotype groups with low-salt intake (enterotype 1, 47%; enterotype 2, 27%). However, there was no significant difference (p = 0.83) in hypertension prevalence for the two GM enterotype groups with high-salt intake (enterotype 1, 50%; enterotype 2, 47%).
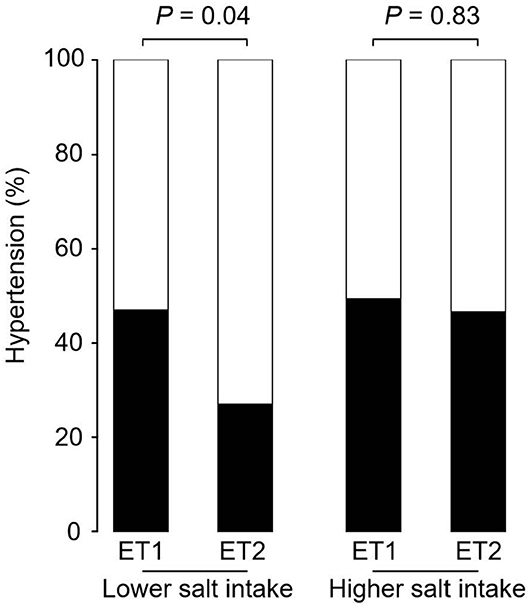
Figure 2. Hypertension prevalence rates for enterotype and salt-intake groups. Hypertension rates are shown based on GM clustering and salt-intake. Black, hypertension rate; White, non-hypertension rate. P-values were calculated using Fisher's test.
Univariate analysis and multiple logistic regression analysis adjusted for age, sex, and BMI revealed that predictive changes in GM enterotypes were associated with hypertension in the low-salt group (Supplemental Table 3). Scatter plots of systolic and diastolic BP vs. salt intake are shown in Figure 3. The slopes of the approximate straight lines were greater for enterotype 2 (SBP = 2.00, DBP = 1.30) than for enterotype 1 (SBP = 1.23, DBP = 1.18).
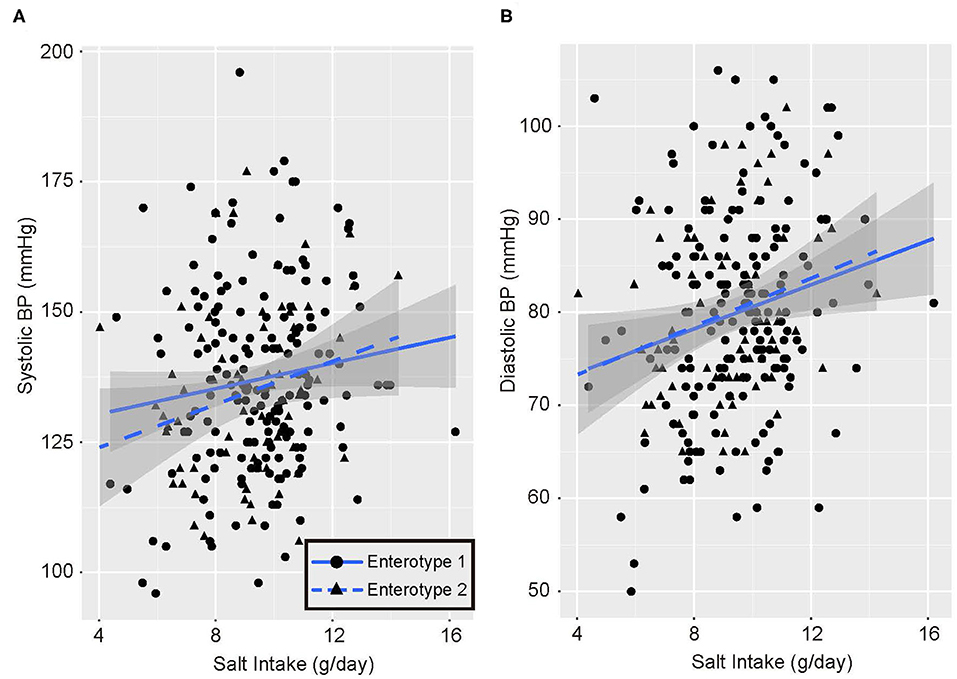
Figure 3. Blood pressure and salt intake scatter plots. (A) Systolic blood pressure (BP) and salt intake. (B) Diastolic blood pressure and salt intake. Black circles and solid blue line, enterotype 1; Black triangles and broken blue line, enterotype 2.
Significant Intestinal Bacteria Genera
Figure 4 shows the GM compositions of the low-salt groups. The relative abundance of certain microorganisms was significantly different between enterotype 1 and enterotype 2 groups. For instance, the relative abundances of Blautia, Bifidobacterium, Escherichia-Shigella, Lachnoclostridium, and Clostridium. sensu. stricto. were significantly higher in the enterotype 2 groups. Feature importance ranking indicated that the Eubacterium rectale group and Blautia were the top two most discriminatory bacteria between enterotype 1 and enterotype 2 groups in the low-salt groups. Also, in high-salt group, Bifidobacterium and Lachnoclostridium differed significantly between enterotype 1 and enterotype 2 (Bifidobacterium p < 0.01, Lachnoclostridium p = 0.01), while, Escherichia-Shigella, Clostridium sensu stricto.1, and Blautia did not differ significantly (Escherichia-Shigella p = 0.09, Clostridium sensu stricto.1 p = 0.89, Blautia p = 0.99).
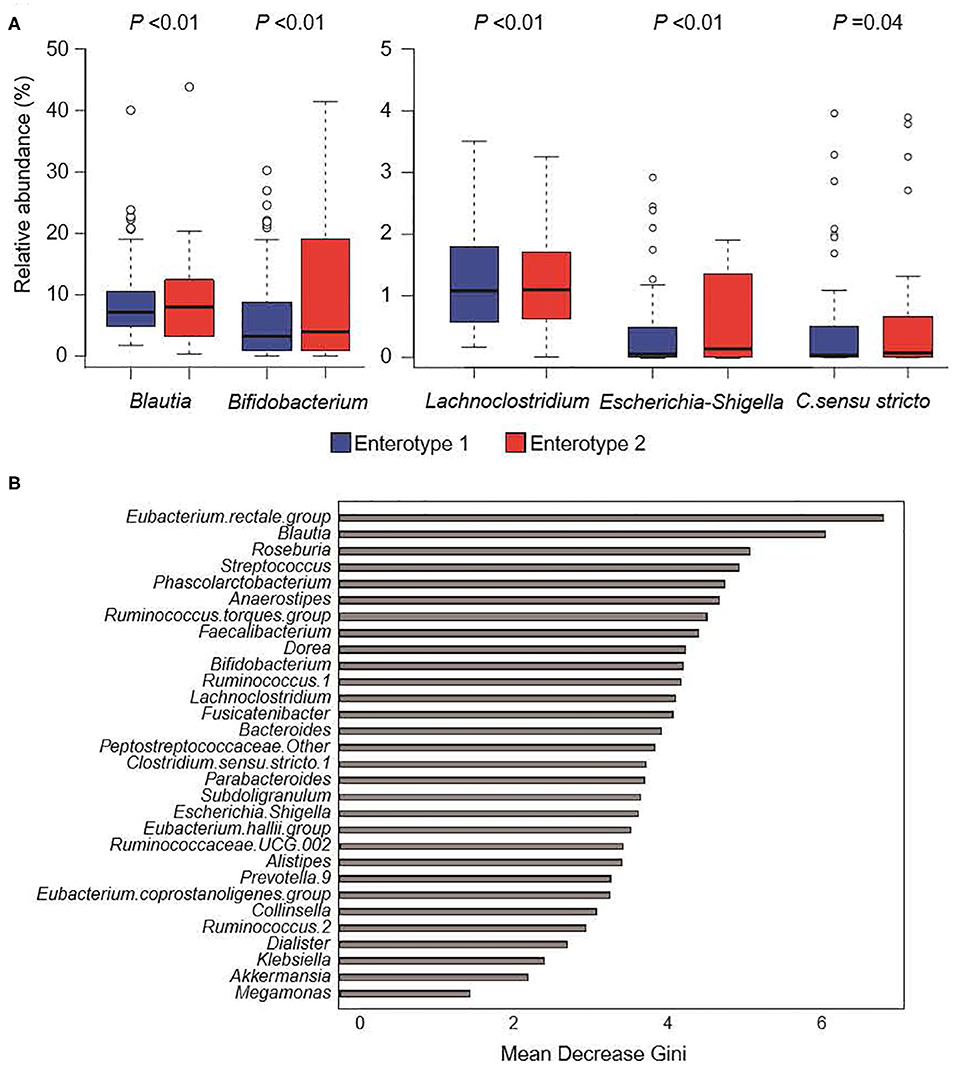
Figure 4. Gut microbiome composition in low-salt groups. (A) Relative abundance of gut microorganisms with significant differences between enterotype 1 and enterotype 2. P-values were calculated using DESeq2 differential gene expression analysis. (B) Random forest model using explanatory variables of gut microorganisms.
The Renin-Angiotensin-Aldosterone System and Inflammatory Cytokines
Enterotype 1 and enterotype 2 were categorized using PCA. The PCA plot included age, sex, BMI, PRA, PAC, eGFR, IL-17a, GM-CSF, and TNF-α, past history of DM, and past history of HL. In the low-salt groups, there was a significant difference in these components between the enterotype 1 and enterotype 2 groups (PERMANOVA; p < 0.05). However, in the high-salt group and all-participants group, there were no significant differences between the enterotype 1 and enterotype 2 groups (Supplemental Figure 1A). Feature importance ranking revealed that GM-CSF, PRA, TNF-α, PAC, and IL-17a were the most discriminatory factors between the groups (Supplemental Figure 1B).
Discussion
We defined two distinct enterotype groups based on the composition of fecal microbial communities in the general Japanese population. There was a significantly higher prevalence of hypertension in the enterotype 1 group with low-salt intake compared to the enterotype 2 group with low-salt intake. Six significant candidate bacterial genera were identified for classifying the two enterotypes with low-salt intake. Blautia, Bifidobacterium, Escherichia-Shigella, Lachnoclostridium, and Clostridium sensu stricto showed significant differences in their prevalence ratios for fecal bacteria genera and the Eubacterium rectale group and Blautia had higher feature importance rankings used to define the two enterotype groups with low-salt intake. Further, Bifidobacterium and Lachnoclostridium differed significantly between the two enterotype groups in both low-salt intake and high-salt intake.
Several previous studies have recently reported evidence that GM and the regulation of BP are linked and have described the potential mechanisms involved (14–16). For instance, the following candidate mechanisms for an association between GM and hypertension have been presented: (1) immunomodulatory function via GM (17, 36); (2) short-chain fatty acids (SCFA)-producing GM (37, 38); (3) trimethylamine N-oxide (TMAO) (39, 40); (4) glucocorticoid metabolism (41); and (5) epigenetic regulation (42–44).
First, GM demonstrates a multitude of physiological functions through the modulation of the host immune system (45). The subtle imbalance of GM composition may play a key role in the onset of hypertension. Wilck et al. showed that high-salt intake also drives autoimmunity by inducing T-helper (Th)17 cells, which then contribute to hypertension by depleting Lactobacillus murinus (17). They also demonstrated that a 14-d challenge of a high-salt diet increases BP and the number of circulating IL-17A+/TNF-α+/CD4+ T-cells while reducing fecal Lactobacillus species in humans (17). In our current investigation, there were few Lactobacillus and no significant differences in composition between enterotype 1 and enterotype 2. Therefore, Lactobacillus composition was not regarded as a contributor to the prevalence of hypertension in our population group. Bifidobacterium is reported to induce the development of regulatory T-cells (Treg) and Th17 cell compartments in the intestine and the secretion of IL-17 (46). This suggests that bacteria may play a role in balancing the development of Treg and Th17 cell compartments. This may induce an effector function such as secreting IL-17 or a regulatory action such as suppressing the activation of the immune system, depending on the environment and the nature of the stimuli, including high-salt intake (47).
Second, among the six candidate bacterial genera identified for classifying the two enterotypes with low-salt intake, Blautia, Bifidobacterium, Lachnoclostridium, and the Eubacterium rectale group are reported to be SCFA-producing bacteria. SCFAs are the major nutrients produced by bacterial fermentation with the three major SCFAs being acetate, propionate, and butyrate. Acetate was produced by all four of the bacteria genera. In addition, Blautia obeum is able to produce both propionate and butyrate (48) whereas Eubacterium spp. produces mainly butyrate. SCFAs are known to influence several aspects of host physiology, including the regulation of BP (49). SCFAs can influence host cells by interacting with host G protein-coupled receptor 41 (Gpr41) and olfactory receptor 78 (Olfr78). Intriguingly, Olfr78 null mice are hypotensive (37), whereas Gpr41 null mice are hypertensive (38). SCFAs are known to induce vasorelaxation (50, 51). Thus, SCFAs acting on Gpr41 in the vascular endothelium may help to set the vascular tone. These pathways may be physiologically important links between SCFAs and the control of host BP.
Third, TMAO is a small organic compound derived mainly from choline and is metabolized by the microbiota to produce trimethylamine (TMA). TMAO is a known predictor of prevalent cardiovascular diseases (CVDs) (52) and of future cardiovascular events in clinical cohorts (53). Ge et al. recently performed a systematic review and meta-analysis and found that subjects with high TMAO concentrations have a 12% greater risk of hypertension compared to those with low circulating TMAO concentrations (39). Furthermore, Martin et al. showed that TMAO prolongs the hypertensive effect of angiotensin II in rats (40). Therefore, TMAO may play a key mediator role in the development of hypertension via angiotensin II activation. However, there are currently few reports regarding the association of TMAO with the six genera of bacteria that we identified in the current study. Additional investigation is needed regarding this topic.
Fourth, other investigators have proposed an alternative relationship between hypertension-onset and GM system. Gut bacteria are involved in metabolizing the endogenous glucocorticoids corticosterone and cortisol (41), which are able to bind and activate mineralocorticoid receptors (MR), causing sodium retention, hypertension, and renal injury (54). 21-deoxycortisol is derived from 21-dehydroxylation of corticosterone or cortisol by intestinal bacteria and most notably the inhibition of 11β-hydroxysteroid dehydrogenase (11β-HSD) type 1 and type 2. Plasma levels of 21-deoxycortisol are elevated in humans with hypertension compared with that of normotensive controls (55).
Finally, recent studies have provided evidence for gut-derived effector molecules affecting host epigenetics as another mechanism of dynamic interactions between hosts and GM, including histone deacetylation. Diet, including salt intake, and GM can influence epigenetics (56–58). There are several reports on the relevance of Histone deacetylases (HDACs) to the development of hypertension (42–44, 59). In addition, SCFAs generated from SCFA-producing bacteria have histone deacetylase inhibitory activity and alter the expression of specific hypertension-related genes via conformational changes in the active site of HDAC, resulting in HDAC inactivation (60, 61). Pharmacological inhibition of HDACs is expected to be a practical novel therapeutic strategy for the treatment of hypertension.
While our current study provided important new details on the impact of the intestinal bacterial flora on hypertensive patients with high-salt intake, certain limitations should also be addressed. The study design was cross-sectional, and therefore, the causality of the relationships could not be assessed. Furthermore, although this study includes a relatively large amount of information on the Japanese general population, however, only small sample sizes were included for two of the four final groups, the low-salt/GM enterotype 2 and the high-salt/GM enterotype 2. Regarding the six candidate GM biomarkers we identified, further interventional studies are necessary using both animal- and human-based study designs to investigate the change in GM by salt-intake and the effect on BP by feces transplant, bacteria transplant, or prebiotics. Further, daily salt-intake was estimated by urine sodium levels and creatine ratios in spot urine samples, and not in the 24 h urine samples. However, Huang et al. reported that the estimated daily salt-intake by spot urine testing was unable to detect the differences in sodium excretion measured by 24 h urine samples (62). Spot urine-based methods may be enough to evaluate daily salt-intake.
In conclusion, the current study demonstrated that the prevalence of hypertension is associated with the constitution of fecal bacteria and salt intake, and six microbial genera related to hypertension prevalence were identified in subjects who had low-salt intake. This suggested that there may be individuals with a specific gut bacteria composition for which changing dietary habits to low salt would be ineffective in preventing hypertension. The specific gut bacteria composition may not mean large quantities of a specific bacteria but appropriate population ratio with some bacteria. Physicians could identify the specific GM composition of hypertensive patients on salt diets for whom control of blood pressure has been difficult and could provide them the appropriate advice regarding low salt diets. Furthermore, treatment for gut dysbiosis, such as the administration of probiotics or fecal microbiota transplantation, might be affected by the stability of BP control in patients with hypertension. Our findings indicate a new strategy for controlling BP and the development of hypertension through the restoration of GM homeostasis. However, further studies examining the prospective relationship between the microbiome and hypertension induced by high-salt intake and the detailed mechanisms are still needed.
Data Availability Statement
The result in DDBJ (DRA009074) can be seen in NCBI at the following URL; https://www.ncbi.nlm.nih.gov/sra/?term=DRA009074.
Ethics Statement
The studies involving human participants were reviewed and approved by the Ethics Committee for Human Studies at Kanazawa University Hospital. The patients/participants provided their written informed consent to participate in this study.
Author Contributions
SN, SK, TY, and SO contributed to the study design and conducted the study. SN and SK wrote the manuscript. SN, SK, and HNam analyzed statistically. HTsuj, SM, AH, and HNak prepared the application to the ethics committee. MK, DA, TH, and YT collected the clinical data. SN, AY, and SO performed DNA extraction from stool samples and Next Generation Sequencing. HTsub and HS measured cytokine levels. SK, MD, and YT edited the manuscript. SN and SO are the guarantor of this work and, as such, had full access to all the data in the study and takes responsibility for the integrity of the data and the accuracy of the data analysis. All the authors have read the manuscript and have approved this submission. All authors contributed to the article and approved the submitted version.
Funding
This work was supported by a grant from the Ministry of Health, Labor, and Welfare, Japan (Nanbyo-Ippan-046, YT) and JSPS KAKENHI Grant Number JP19K17956 (SK).
Conflict of Interest
The authors declare that the research was conducted in the absence of any commercial or financial relationships that could be construed as a potential conflict of interest.
Acknowledgments
We thank Editage (Tokyo, Japan; www.editage.jp) for English language editing. We also thank the entire staff of the Endocrine and Hypertension group at Kanazawa University Hospital for their support in obtaining clinical data: Mikiya Usukura, Ayako Wakayama, Atsushi Hashimoto, Shunsuke Mori, Masashi Ohe, Toshitaka Sawamura, Rika Okuda, Seigo Konishi, Yoshimichi Takeda, Kei Sawada, Kenro Sugiyama, Yusuke Wakabayashi, Koichiro Takakuwa, Yui Soma, Tomomi Kimura, Tomoko Takahashi, Youhei Toyoda, Shohei Yoshikura, Yuya Nishimoto, Eiko Smimizu, and Yukiko Takamiya.
Supplementary Material
The Supplementary Material for this article can be found online at: https://www.frontiersin.org/articles/10.3389/fmed.2020.00475/full#supplementary-material
References
1. Hillege HL, Girbes AR, de Kam PJ, Boomsma F, de Zeeuw D, Charlesworth A, et al. Renal function, neurohormonal activation, and survival in patients with chronic heart failure. Circulation. (2000) 102:203–10. doi: 10.1161/01.CIR.102.2.203
2. Pierdomenico SD, Di Nicola M, Esposito AL, Di Mascio R, Ballone E, Lapenna D, et al. Prognostic value of different indices of blood pressure variability in hypertensive patients. Am J Hypertens. (2009) 22:842–7. doi: 10.1038/ajh.2009.103
3. He FJ, Li J, Macgregor GA. Effect of longer-term modest salt reduction on blood pressure. Cochrane Database Syst Rev. (2013) CD004937. doi: 10.1002/14651858.CD004937.pub2
4. Kato N, Takeuchi F, Tabara Y, Kelly TN, Go MJ, Sim X, et al. Meta-analysis of genome-wide association studies identifies common variants associated with blood pressure variation in East Asians. Nat Genet. (2011) 43:531–8. doi: 10.1038/ng.834
5. Intersalt Cooperative Research Group. Intersalt: an international study of electrolyte excretion and blood pressure. Results for 24-hour urinary sodium and potassium excretion. BMJ. (1988) 297:319–28. doi: 10.1136/bmj.297.6644.319
6. Sacks FM, Svetkey LP, Vollmer WM, Appel LJ, Bray GA, Harsha D, et al. DASH-Sodium Collaborative Research Group. Effects on blood pressure of reduced dietary sodium and the Dietary Approaches to Stop Hypertension (DASH) diet. DASH-Sodium Collaborative Research Group. N Engl J Med. (2001) 344:3–10. doi: 10.1056/NEJM200101043440101
7. Kotchen TA, Cowley AW Jr., Frohlich ED. Salt in health and disease–a delicate balance. N Engl J Med. (2013) 368:1229–37. doi: 10.1056/NEJMra1212606
8. Kawasaki T, Delea CS, Bartter F, Smith H. The effect of high-sodium and low-sodium intakes on blood pressure and other related variables in human subjects with idiopathic hypertension. Am J Med. (1978) 64:193–8. doi: 10.1016/0002-9343(78)90045-1
9. Grim CE, Luft FC, Fineberg NS, Weinberger MH. Responses to volume expansion and contraction in categorized hypertensive and normotensive man. Hypertension. (1979) 1:476–85. doi: 10.1161/01.HYP.1.5.476
10. Weinberger MH, Miller JZ, Luft FC, Grim CE, Finberg NS. Definitions and characteristics of sodium sensitivity and blood pressure resistance. Hypertension. (1986) 8:II127–34. doi: 10.1161/01.HYP.8.6_Pt_2.II127
11. Qin J, Li Y, Cai Z, Li S, Zhu J, Zhang F, et al. A metagenome-wide association study of gut microbiota in type 2 diabetes. Nature. (2012) 490:55–60. doi: 10.1038/nature11450
12. Chang CJ, Lin CS, Lu CC, Martel J, Ko YF, Ojcius DM, et al. Ganoderma lucidum reduces obesity in mice by modulating the composition of the gut microbiota. Nat Commun. (2015) 6:7489. doi: 10.1038/ncomms8489
13. Li J, Zhao F, Wang Y, Chen J, Tao J, Tian G, et al. Gut microbiota dysbiosis contributes to the development of hypertension. Microbiome. (2017) 5:14. doi: 10.1186/s40168-016-0222-x
14. Yang T, Santisteban MM, Rodriguez V, Li E, Ahmari N, Carvajal JM, et al. Gut dysbiosis is linked to hypertension. Hypertension. (2015) 65:1331–40. doi: 10.1161/HYPERTENSIONAHA.115.05315
15. Santisteban MM, Qi Y, Zubcevic J, Kim S, Yang T, Shenoy V, et al. Hypertension-linked pathophysiological alterations in the gut. Circ Res. (2017) 120:312–23. doi: 10.1161/CIRCRESAHA.116.309006
16. Mell B, Jala VR, Mathew AV, Byun J, Waghulde H, Zhang Y, et al. Evidence for a link between gut microbiota and hypertension in the Dahl rat. Physiol Genomics. (2015) 47:187–97. doi: 10.1152/physiolgenomics.00136.2014
17. Wilck N, Matus MG, Kearney SM, Olesen SW, Forslund K, Bartolomaeus H, et al. Salt-responsive gut commensal modules TH17 axis and disease. Nature. (2017) 551:585–9. doi: 10.1038/nature24628
18. Nakamura H, Tsujiguchi H, Hara A, Kambayashi Y, Miyagi S, Thu Nguyen TT, et al. Dietary calcium intake and hypertension: importance of serum concentrations of 25-hydroxyvitamin D. Nutrients. (2019) 11:E911. doi: 10.3390/nu11040911
19. Karashima S, Kometani M, Tsujiguchi H, Asakura H, Nakano S, Usukura M, et al. Prevalence of primary aldosteronism without hypertension in the general population: results in Shika study. Clin Exp Hypertens. (2018) 40:118–25. doi: 10.1080/10641963.2017.1339072
20. Shika Town Shikatown Population. Available online at: http://www.town.shika.ishikawa.jp/jyuumin/shika_town_pop/shika_population.html (accessed March 1, 2019).
21. Nakamura H, Hara A, Tsujiguchi H, Thi Thu Nguyen T, Kambayashi Y, Miyagi S, et al. Relationship between dietary n-6 fatty acid intake and hypertension: e?ect of glycated hemoglobin levels. Nutrients. (2018) 10:E1825. doi: 10.3390/nu10121825
22. Umemura S, Arima H, Arima S, Asayama K, Dohi Y, Hirooka Y, et al. The Japanese Society of Hypertension guidelines for the management of hypertension (JSH 2019). Hypertens Res. (2019) 42:1235–481. doi: 10.1038/s41440-019-0284-9
23. Karashima S, Yoneda T, Kometani M, Ohe M, Mori S, Sawamura T, et al. Comparison of eplerenone and spironolactone for the treatment of primary aldosteronism. Hypertens Res. (2016) 39:133–7. doi: 10.1038/hr.2015.129
24. Ogai K, Nagase S, Mukai K, Iuchi T, Mori Y, Matsue M, et al. A comparison of techniques for collecting skin microbiome samples: swabbing versus tape-stripping. Front Microbiol. (2018) 9:2362. doi: 10.3389/fmicb.2018.02362
25. Joshi NA, Fass JN. Sickle: A Sliding-Window, Adaptive, Quality-Based Trimming Tool for FastQ Files. (2016). Available online at: https://github.com/najoshi/sickle (accessed November 11, 2016).
26. Masella AP, Bartram AK, Truszkowski JM, Brown DG, Neufeld JD. PANDAseq: paired-end assembler for illumina sequences. BMC Bioinformatics. (2012) 13:31. doi: 10.1186/1471-2105-13-31
27. Edgar RC. Search and clustering orders of magnitude faster than BLAST. Bioinformatics. (2010) 26:2460–1. doi: 10.1093/bioinformatics/btq461
28. Quast C, Pruesse E, Yilmaz P, Gerken J, Schweer T, Yarza P, et al. The SILVA ribosomal RNA gene database project: improved data processing and web-based tools. Nucleic Acids Res. (2013) 41:D590–6. doi: 10.1093/nar/gks1219
29. Caporaso JG, Kuczynski J, Stombaugh J, Bittinger K, Bushman FD, Costello EK, et al. QIIME allows analysis of high-throughput community sequencing data. Nat Methods. (2010) 7:335–6. doi: 10.1038/nmeth.f.303
30. R Core Team. R: A Language and Environment for Statistical Computing. (2018). Available online at: https://www.r-project.org/ (accessed December 4, 2018).
31. Love MI, Huber W, Anders S. Moderated estimation of fold change and dispersion for RNA-Seq data with DESeq2. Genome Biol. (2014) 15:550. doi: 10.1186/s13059-014-0550-8
32. Drost H-G. Philentropy: information theory and distance quantification with R. J Open Source Softw. (2018) 3:765. doi: 10.21105/joss.00765
33. Tibshirani R, Hastie T, Narasimhan B, Chu G. Diagnosis of multiple cancer types by shrunken centroids of gene expression. PNAS. (2002) 99:6567–72. doi: 10.1073/pnas.082099299
35. The Comprehensive R Archive Network. vegan: Community Ecology Package. (2016). Available online at: https://cran.r-project.org/web/packages/vegan/
36. Norlander AE, Madhur MS, Harrison DG. The immunology of hypertension. J Exp Med. (2018) 215:21–33. doi: 10.1084/jem.20171773
37. Pluznick JL, Protzko RJ, Gevorgyan H, Peterlin Z, Sipos A, Han J, et al. Olfactory receptor responding to gut microbiota-derived signals plays a role in renin secretion and blood pressure regulation. Proc Natl Acad Sci USA. (2013) 110:4410–5. doi: 10.1073/pnas.1215927110
38. Natarajan N, Hori D, Flavahan S, Steppan J, Flavahan NA, Berkowitz DE, et al. Microbial short chain fatty acid metabolites lower blood pressure via endothelial G-protein coupled receptor 41. Physiol Genomics. (2016) 48:826–34. doi: 10.1152/physiolgenomics.00089.2016
39. Ge X, Zheng L, Zhuang R, Yu P, Xu Z, Liu G, et al. The gut microbial metabolite trimethylamine N-oxide and hypertension risk: a systematic review and dose-response meta-analysis. Adv Nutr. (2019) 11:66–76. doi: 10.1093/advances/nmz064
40. Ufnal M, Jazwiec R, Dadlez M, Drapala A, Sikora M, Skrzypecki J. Trimethylamine-N-oxide: a carnitine- derived metabolite that prolongs the hypertensive effect of angiotensin II in rats. Can J Cardiol. (2014) 30:1700–5. doi: 10.1016/j.cjca.2014.09.010
41. Morris DJ, Brem AS. Role of gut metabolism of adrenal corticosteroids and hypertension: clues gut-cleansing antibiotics give us. Physiol Genomics. (2019) 51:83–9. doi: 10.1152/physiolgenomics.00115.2018
42. Choi SY, Kee HJ, Sun S, Seok YM, Ryu Y, Kim GR, et al. Histone deacetylase inhibitor LMK235 attenuates vascular constriction and aortic remodelling in hypertension. J Cell Mol Med. (2019) 23:2801–12. doi: 10.1111/jcmm.14188
43. Lemon DD, Horn TR, Cavasin MA, Jeong MY, Haubold KW, Long CS, et al. Cardiac HDAC6 catalytic activity is induced in response to chronic hypertension. J Mol Cell Cardiol. (2011) 51:41–50. doi: 10.1016/j.yjmcc.2011.04.005
44. Lee HA, Lee DY, Cho HM, Kim SY, Iwasaki Y, Kim IK. Histone deacetylase inhibition attenuates transcriptional activity of mineralocorticoid receptor through its acetylation and prevents development of hypertension. Circ Res. (2013) 112:1004–12. doi: 10.1161/CIRCRESAHA.113.301071
45. Honda K, Littman DR. The microbiota in adaptive immune homeostasis and disease. Nature. (2016) 535:75–84. doi: 10.1038/nature18848
46. López P, González-Rodríguez I, Gueimonde M, Margolles A, Suárez A. Immune response to Bifidobacterium bifidum strains support Treg/Th17 plasticity. PLoS ONE. (2011) 6:e24776. doi: 10.1371/journal.pone.0024776
47. Ivanov II, Frutos Rde L, Manel N, Yoshinaga K, Rifkin DB, Sartor RB, et al. Specific microbiota direct the differentiation of IL-17-producing T-helper cells in the mucosa of the small intestine. Cell Host Microbe. (2008) 4:337–49. doi: 10.1016/j.chom.2008.09.009
48. Louis P, Flint HJ. Formation of propionate and butyrate by the human colonic microbiota. Environ Microbiol. (2017) 19:29–41. doi: 10.1111/1462-2920.13589
49. Pluznick JL. Microbial short-chain fatty acids and blood pressure regulation. Curr Hypertens Rep. (2017) 19:25. doi: 10.1007/s11906-017-0722-5
50. Mortensen FV, Nielsen H, Mulvany MJ, Hessov I. Short chain fatty acids dilate isolated human colonic resistance arteries. Gut. (1990) 31:1391–4. doi: 10.1136/gut.31.12.1391
51. Knock G, Psaroudakis D, Abbot S, Aaronson PI. Propionate-induced relaxation in rat mesenteric arteries: a role for endothelium-derived hyperpolarising factor. J Physiol. (2002) 538:879–90. doi: 10.1113/jphysiol.2001.013105
52. Wang Z, Klipfell E, Bennett BJ, Koeth R, Levison BS, Dugar B, et al. Gut flora metabolism of phosphatidylcholine promotes cardiovascular disease. Nature. (2011) 472:57–63. doi: 10.1038/nature09922
53. Tang WH, Wang Z, Levison BS, Koeth RA, Britt EB, Fu X, et al. Intestinal microbial metabolism of phosphatidylcholine and cardiovascular risk. N Engl J Med. (2013) 368:1575–84. doi: 10.1056/NEJMoa1109400
54. Zhu A, Yoneda T, Demura M, Karashima S, Usukura M, Yamagishi M, et al. Effect of mineralocorticoid receptor blockade on the renal renin-angiotensin system in Dahl salt-sensitive hypertensive rats. J Hypertens. (2009) 27:800–5. doi: 10.1097/HJH.0b013e328325d861
55. Eisenhofer G, Peitzsch M, Kaden D, Langton K, Pamporaki C, Masjkur J, et al. Reference intervals for plasma concentrations of adrenal steroids measured by LC-MS/MS: impact of gender, age, oral contraceptives, body mass index and blood pressure status. Clin Chim Acta. (2017) 470:115–24. doi: 10.1016/j.cca.2017.05.002
56. Schwenk RW, Vogel H, Schürmann A. Genetic and epigenetic control of metabolic health. Mol Metab. (2013) 2:337–47. doi: 10.1016/j.molmet.2013.09.002
57. Liu Y, Liu P, Yang C, Cowley AW Jr., Liang M. Base-resolution maps of 5-methylcytosine and 5-hydroxymethylcytosine in Dahl S rats: effect of salt and genomic sequence. Hypertension. (2014) 63:827–38. doi: 10.1161/HYPERTENSIONAHA.113.02637
58. Stilling RM, Dinan TG, Cryan JF. Microbial genes, brain & behaviour - epigenetic regulation of the gut-brain axis. Genes Brain Behav. (2014) 13:69–86. doi: 10.1111/gbb.12109
59. Kim GW, Gocevski G, Wu CJ, Yang XJ. Dietary, metabolic, and potentially environmental modulation of the lysine acetylation machinery. Int J Cell Biol. (2010) 2010:632739. doi: 10.1155/2010/632739
60. Aoyama M, Kotani J, Usami M. Butyrate and propionate induced activated or non-activated neutrophil apoptosis via HDAC inhibitor activity but without activating GPR-41/GPR-43 pathways. Nutrition. (2010) 26:653–61. doi: 10.1016/j.nut.2009.07.006
61. Bhat MI, Kapila R. Dietary metabolites derived from gut microbiota: critical modulators of epigenetic changes in mammals. Nutr Rev. (2017) 75:374–89. doi: 10.1093/nutrit/nux001
Keywords: gut microbiome, blood pressure, salt-intake, renin-angiotensin-aldosterone system, hypertension
Citation: Nagase S, Karashima S, Tsujiguchi H, Tsuboi H, Miyagi S, Kometani M, Aono D, Higashitani T, Demura M, Sakakibara H, Yoshida A, Hara A, Nakamura H, Takeda Y, Nambo H, Yoneda T and Okamoto S (2020) Impact of Gut Microbiome on Hypertensive Patients With Low-Salt Intake: Shika Study Results. Front. Med. 7:475. doi: 10.3389/fmed.2020.00475
Received: 04 March 2020; Accepted: 14 July 2020;
Published: 02 September 2020.
Edited by:
Zhengrong Guan, University of Alabama at Birmingham, United StatesReviewed by:
Wei Chen, Sun Yat-sen University, ChinaElaine Mary Richards, University of Florida, United States
Copyright © 2020 Nagase, Karashima, Tsujiguchi, Tsuboi, Miyagi, Kometani, Aono, Higashitani, Demura, Sakakibara, Yoshida, Hara, Nakamura, Takeda, Nambo, Yoneda and Okamoto. This is an open-access article distributed under the terms of the Creative Commons Attribution License (CC BY). The use, distribution or reproduction in other forums is permitted, provided the original author(s) and the copyright owner(s) are credited and that the original publication in this journal is cited, in accordance with accepted academic practice. No use, distribution or reproduction is permitted which does not comply with these terms.
*Correspondence: Takashi Yoneda, ZW5kb2NyaW5AbWVkLmthbmF6YXdhLXUuYWMuanA=; Shigefumi Okamoto, c29rYW1vdG9AbWhzLm1wLmthbmF6YXdhLXUuYWMuanA=
†These authors have contributed equally to this work