 Stella A. Belonwu1,2
 Yaqiao Li1,2
 Daniel G. Bunis1,3,4Arjun Arkal Rao3,4,5Caroline Warly Solsberg1,2,6,7
 Tomiko Oskotsky1,8Alice L. Taubes1,9Brian Grone9Kelly A. Zalocusky9
 Gabriela K. Fragiadakis3,4,10Yadong Huang5,9,11
 Marina Sirota1,8*
- 1Bakar Computational Health Sciences Institute, University of California, San Francisco, San Francisco, CA, United States
- 2Pharmaceutical Sciences and Pharmacogenomics Graduate Program, University of California, San Francisco, San Francisco, CA, United States
- 3CoLabs, University of California, San Francisco, San Francisco, CA, United States
- 4Bakar ImmunoX Initiative, University of California, San Francisco, San Francisco, CA, United States
- 5Department of Pathology, University of California, San Francisco, San Francisco, CA, United States
- 6Memory and Aging Center, University of California, San Francisco, San Francisco, CA, United States
- 7Department of Neurology and Weill Institute for Neurosciences, University of California, San Francisco, San Francisco, CA, United States
- 8Department of Pediatrics, University of California, San Francisco, San Francisco, CA, United States
- 9Gladstone Institute of Neurological Disease, San Francisco, CA, United States
- 10Division of Rheumatology, Department of Medicine, University of California, San Francisco, San Francisco, CA, United States
- 11Department of Neurology, University of California, San Francisco, San Francisco, CA, United States
Alzheimer’s Disease (AD) is a complex neurodegenerative disease that gravely affects patients and imposes an immense burden on caregivers. Apolipoprotein E4 (APOE4) has been identified as the most common genetic risk factor for AD, yet the molecular mechanisms connecting APOE4 to AD are not well understood. Past transcriptomic analyses in AD have revealed APOE genotype-specific transcriptomic differences; however, these differences have not been explored at a single-cell level. To elucidate more complex APOE genotype-specific disease-relevant changes masked by the bulk analysis, we leverage the first two single-nucleus RNA sequencing AD datasets from human brain samples, including nearly 55,000 cells from the prefrontal and entorhinal cortices. In each brain region, we performed a case versus control APOE genotype-stratified differential gene expression analysis and pathway network enrichment in astrocytes, microglia, neurons, oligodendrocytes, and oligodendrocyte progenitor cells. We observed more global transcriptomic changes in APOE4 positive AD cells and identified differences across APOE genotypes primarily in glial cell types. Our findings highlight the differential transcriptomic perturbations of APOE isoforms at a single-cell level in AD pathogenesis and have implications for precision medicine development in the diagnosis and treatment of AD.
Introduction
Alzheimer’s disease (AD) is a heterogeneous neurodegenerative disorder, which accounts for at least 60% of dementia cases (Lane et al., 2018). Further underscoring the importance of AD research, cases of AD are projected to increase by more than threefold by 2050, yet there are currently no disease altering treatments (Hebert et al., 2013; Maresova et al., 2020). AD is defined by pathological hallmarks of aggregated extracellular amyloid-β (Aβ) plaques, and intracellular tau neurofibrillary tangles (Lane et al., 2018; Long and Holtzman, 2019). As a complex disease, AD has several environmental risk factors. Demographic risk factors include advanced age, low education level, and female sex. AD genetic risk factors such as Aβ precursor protein (APP), presenilin 1 (PSEN1), and presenilin 2 (PSEN2) point mutations lead to dominantly inherited early-onset AD and account for less than 1% of AD cases (Karch and Goate, 2015; Lane et al., 2018; Long and Holtzman, 2019).
The strongest genetic risk factor for late-onset or sporadic AD is the ε4 allele of the apolipoprotein E (APOE) gene. In humans, there are three common APOE allelic variants: ε2, ε3, and ε4, which differ based on single substitutions at amino acid residues 112 and 158. The ε3 allele is the most common variant, and is generally considered as a neutral form (Roses and Allen, 1996; Yu et al., 2014; Long and Holtzman, 2019). The ε2 allele is considered protective, and the ε4 allele is associated with increasing the risk of developing AD in a gene dose dependent manner (Long and Holtzman, 2019; Montagne et al., 2020). Specifically, one copy of the ε4 allele of APOE increases the risk of developing AD by three–fourfold, and two copies increases this risk by 12- to 15-fold (Karch and Goate, 2015; Long and Holtzman, 2019).
The APOE is a lipid-binding protein, which serves a central role in regulating lipid transport and metabolism. It is highly expressed in the liver and brain, where in the latter, it is primarily expressed in astrocytes (Yu et al., 2014; Long and Holtzman, 2019). APOE’s functionality in the central nervous system has implications for AD in both Aβ-dependent and Aβ-independent pathways. For instance, in addition to regulating Aβ clearance, APOE regulates lipoprotein metabolism, supports cell proliferation, repairs membranes, supports myelination, and maintains blood brain barrier (BBB) integrity (Mahley et al., 2006; Yu et al., 2014; Long and Holtzman, 2019). With regards to APOE isoforms, APOE4 has been linked to promoting Aβ retention by blocking its LRP1-mediated clearance (Mahley et al., 2006; Wan et al., 2020), insulin resistance through impaired insulin signaling (Zhao et al., 2017), BBB dysfunction and increased permeability (Zlokovic, 2011; Montagne et al., 2020), and regulating glycogen synthase kinase 3 (GSK3), a kinase highly involved in phosphorylation of tau (Hoe et al., 2006; Yu et al., 2014). Our study aims to identify transcriptomic differences associated with APOE isoforms at a single-cell level to better understand the underlying mechanisms contributing to AD pathophysiology and their specificity to each isoform. Transcriptomics represent a valuable means of understanding molecular underpinnings in disease conditions (Magistri et al., 2015; Allen et al., 2016; Wang et al., 2016; Patel et al., 2019; Wan et al., 2020; Neff et al., 2021); however, to our knowledge, in AD, APOE isoforms are yet to be investigated at a single-cell level, which can depict molecular profiles that would be otherwise masked in a bulk analysis.
In recent years, single-cell transcriptomic datasets were generated from the prefrontal (Mathys et al., 2019) and entorhinal (Grubman et al., 2019) cortices of human AD patients. First, Mathys et al. (2019) performed single-cell RNA sequencing (RNA-Seq) using prefrontal cortex samples from 24 individuals with high Aβ burden and related AD pathology, and 24 individuals with little to no Aβ burden or other pathologies. They observed distinct cell-type-specific perturbations mainly in myelination-related and protein homeostasis encoding genes. Second, Grubman et al. (2019) surveyed single-nucleus transcriptomes from the entorhinal cortices of 6 AD individuals and 6 cognitively normal controls. They identified repressed AD risk-associated gene expression patterns in the entorhinal cortex, such as transcription factor EB and regulator of lysosomal function, in astrocytes but upregulated in microglia. While both studies provided valuable human transcriptomic profiles at single-cell resolution and consistently reported cell type-variable APOE expression in AD, upregulated in microglia and downregulated in astrocytes, the authors did not examine cell type-specific gene expression differences in disease based on APOE genetic variants. In this study, we leverage these two publicly available datasets to study the cell type-specific transcriptomic effects of APOE genotype in AD across two brain regions: the prefrontal and entorhinal cortices. We aim to answer the following questions: (1) Which cell types are most affected at the transcriptomic level by APOE genotype in the context of AD? (2) What are the global and cell type-specific transcriptomic changes with respect to APOE genotype in the context of AD? and (3) Are there any transcriptomic changes that are specific to APOE4 that better explain AD pathophysiology?
Materials and Methods
Data and Code Availability
Single nuclei RNA-Seq (snRNA-seq) data and metadata were accessedfrom their respective repositories: the prefrontal cortex from the Accelerating Medicines Partnership Alzheimer’s Disease Project (AMP-AD) Knowledge Portal under the Religious Orders Study and Memory and Aging Project (ROSMAP)1,2, and the entorhinal cortex from a data repository provided3 by Grubman et al. (2019). Data from the entorhinal cortex may also be accessed from the Gene Expression Omnibus under the accession number GSE138852. Access to the prefrontal cortex dataset requires a formal request to ROSMAP. To enable other researchers to explore these datasets, all code necessary for recreating the reported analyses and figures within R, are available on Github at https://github.com/stebel5/AD_APOE_snRNAseq.
Study Cohort Identification
We acquired publicly available snRNA-seq datasets from repositories specified by the first two single-cell transcriptomic AD studies (Grubman et al., 2019; Mathys et al., 2019). The prefrontal cortex dataset comprised 17,296 genes and 70,634 cells while the entorhinal cortex comprised 10,850 genes and 13,214 cells. Across both datasets, there was an overlap of 9,868 genes. Samples were classified based on tau neurofibrillary tangles, and Aβ plaque burden, using Braak clinical staging and Consortium to Establish a Registry for Alzheimer’s Disease (CERAD) scores, respectively (Mirra et al., 1991). Cases were identified as individuals with severe tau deposition (Braak stage ≥ 4) and high Aβ load (CERAD score ≤ 2), while non-AD controls were identified as individuals with low tau deposition (Braak stage ≤ 3) and low Aβ load (CERAD score ≥ 3). We also restricted our analysis to include samples with APOE3/3 (homozygous for allele ε3) and APOE3/4 (heterozygous ε3/ε4) genotypes due to the limited number of samples for relatively rare APOE genotypes (Figure 1).
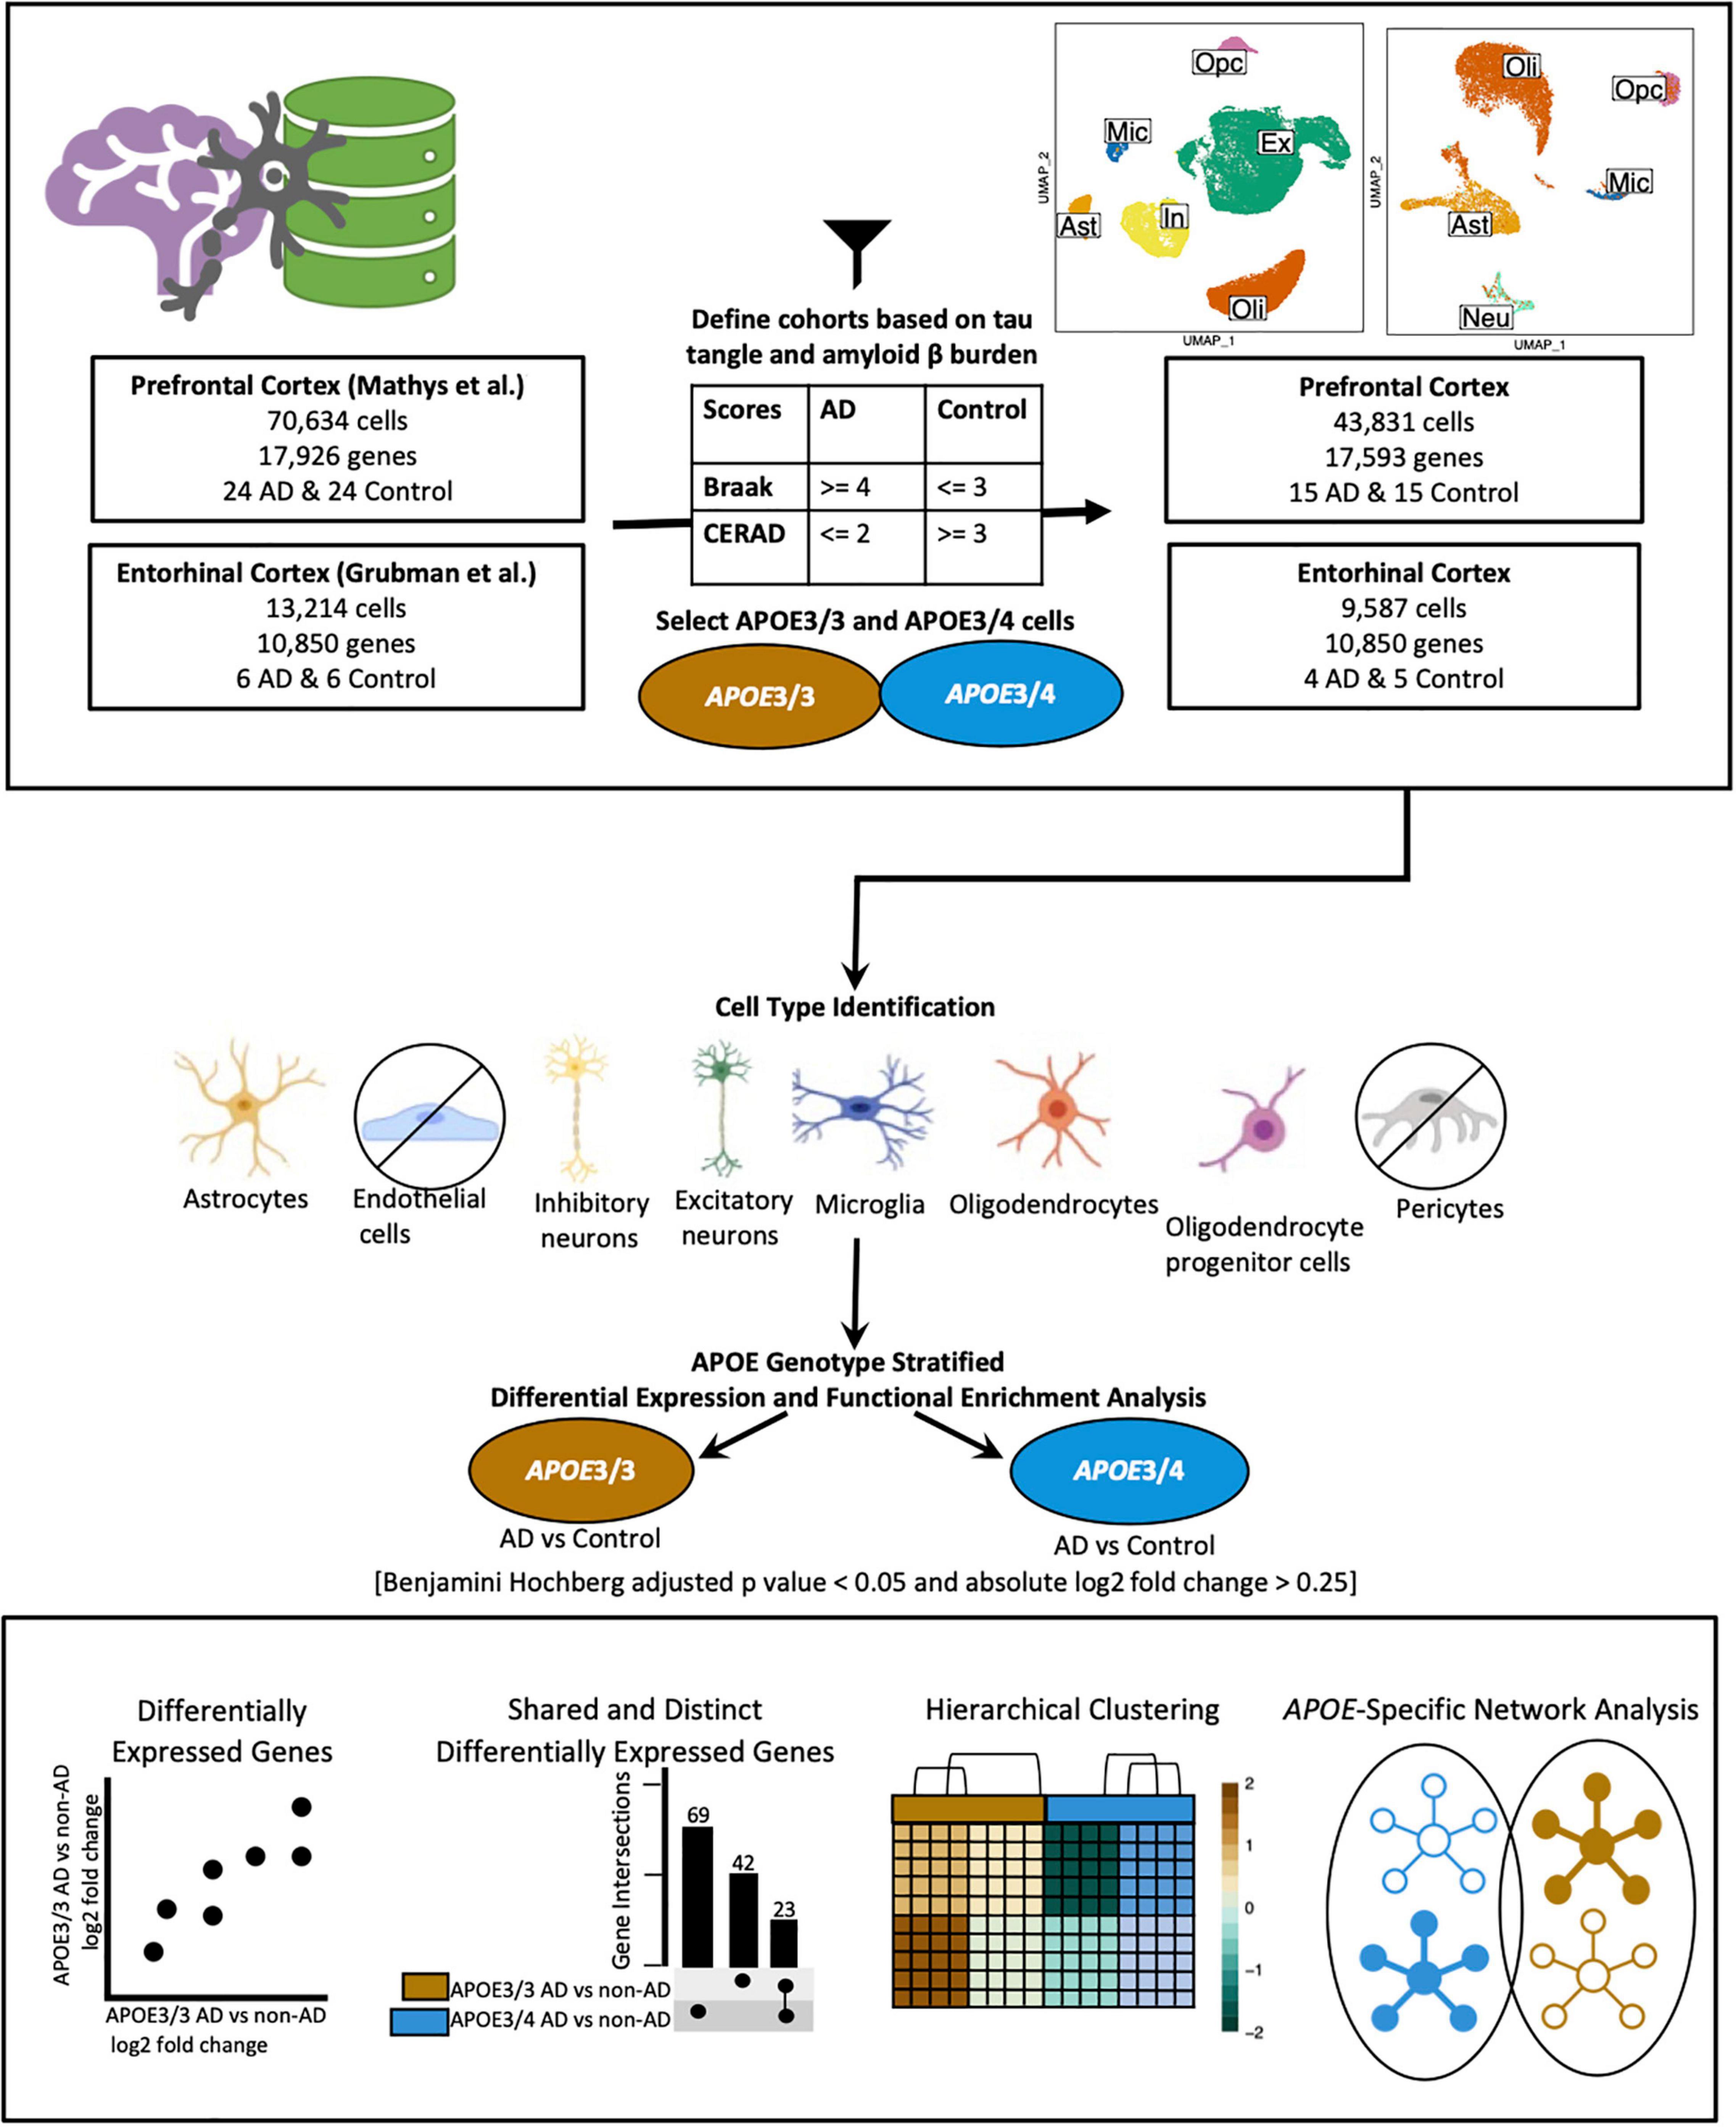
Figure 1. Workflow for sample definition and APOE genotype-stratified cell type-specific differential gene expression analysis and functional enrichment. AD and non-AD cells were determined based on tau tangle (Braak) and amyloid β plaque (CERAD) burden. Cell types were identified, and AD versus non-AD differential expression and pathway network enrichment analyses were performed separately for APOE3/3 and APOE3/4 cells.
The prefrontal cortex dataset initially consisted of age and sex matched samples from 48 individuals with varying levels of AD pathology. For the prefrontal cortex APOE genotype-stratified analysis, samples consisted of 14 APOE3/3 controls, 1 APOE3/4 control, 9 APOE3/3 cases and 8 APOE3/4 cases (Table 1).
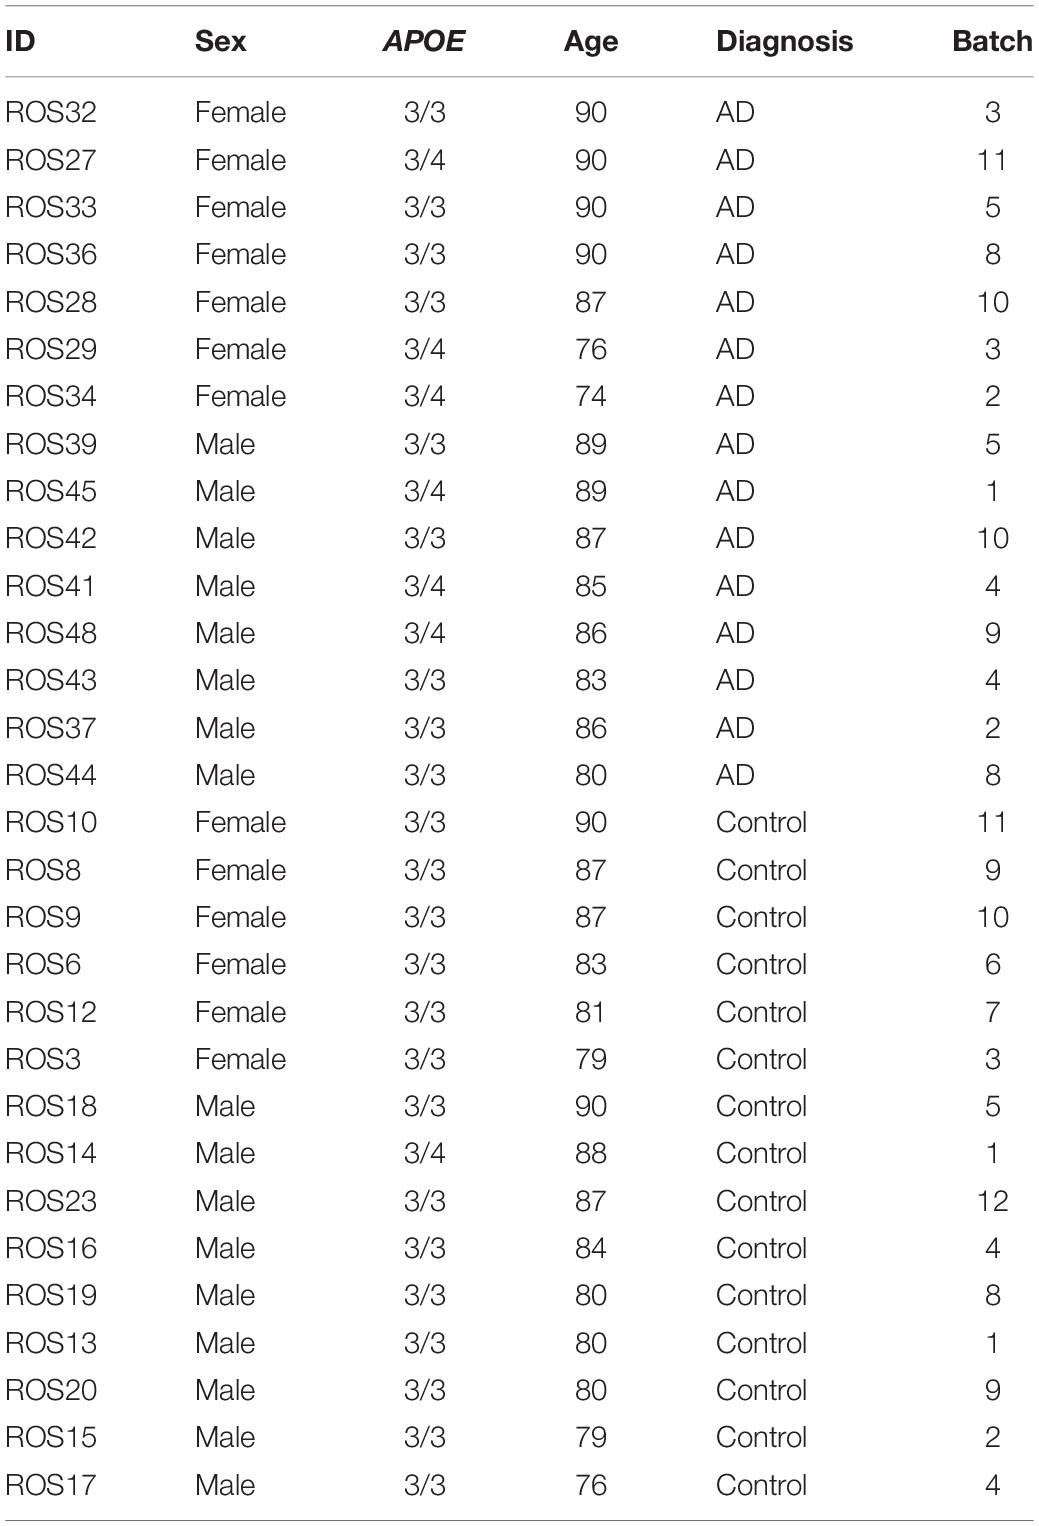
Table 1. Prefrontal cortex cohort.
The entorhinal cortex dataset initially consisted of age and sex matched samples from 6 AD and 6 control subjects, as indicated by Grubman et al. (2019). Cases were noted to have a history of AD, while controls had no history of AD or cognitive impairment, as reported by treating general practitioners. Braak scores were provided only for cases, while clinical history and amyloid pathology records were provided for all subjects. Amyloid pathology information was provided using the categories: “Numerous diffuse and neuritic Aβ plaque,” “Occasional diffuse plaque in cortex,” and “None.” Using criteria from the Rush Alzheimer’s Disease Center clinical codebook provided with the prefrontal cortex dataset, we converted these measures of neuritic plaques into CERAD scores of 1 (Definite), 3 (Possible), and 4 (No AD), respectively. This allowed us to systematically identify cases and controls in both datasets using the same criteria. For the entorhinal cortex APOE genotype-stratified analysis, samples consisted of 4 cases, and 5 controls (Table 2). Three of the cases were from APOE3/4 individuals, while one was from an APOE3/3 individual, and of the controls, four were from APOE3/3 individuals and the one was from an APOE3/4 individual.
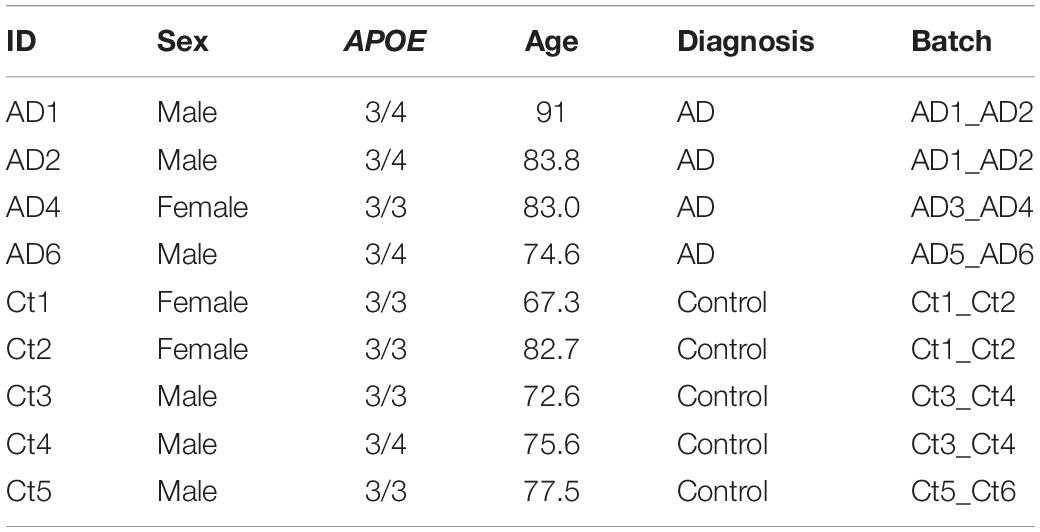
Table 2. Entorhinal cortex cohort.
Single Cell Data Processing, Cell Type Identification, and Batch Correction
All data processing was conducted separately for each dataset with (R Core Team, 2020) version 4.0.0 (2020-04-24) using RStudio (R Studio Team, 2020), using Seurat (Stuart et al., 2019) (v3.1.5). We generated visualizations using BioRender4 (Figure 1), dittoSeq (Bunis et al., 2020) (v1.0.2), an R package for analysis and color blind friendly visualization of single-cell and bulk RNA-Seq data, ggplot2 (Wickham, 2009), and UpsetR (Conway et al., 2017).
Prefrontal Cortex
We downloaded a filtered raw expression matrix of 17,296 genes and 70,634 cells from the prefrontal cortex from the AMP-AD Knowledge Portal and used Seurat’s Read10x function to generate a count data matrix using the raw count matrix, cell names, and barcodes files provided. A Seurat object was created with the count data matrix and metadata, keeping genes present in at least 3 cells, and cells meeting cohort selection criteria with at least 200 genes. Additionally, we selected samples from APOE3/3 and APOE3/4 individuals (Table 1), which resulted in a dataset with 43,831 cells (Supplementary Table 1) and 17,593 genes. Log normalization was performed with a scale.factor of 10,000, and FindVariableFeatures was run using 3,188 features, as specified in the original paper. The data matrix was then scaled with “nCount_RNA” regressed out, and dimensionality reduction was performed with the appropriate dimensions selected based on the corresponding Principal component analysis (PCA) elbow plot. Dimensionality reduction confirmed that there were no batch effects present (Supplementary Figure 1). As we found the original paper’s cell type identification to be comprehensive, we kept the cell type labels for the further analysis (Supplementary Table 1). Due to low cell counts, we did not analyze pericytes and endothelial cells.
Entorhinal Cortex
A filtered raw expression matrix of 10,850 genes and 13,214 cells from the entorhinal cortex was downloaded from a data repository provided by Grubman et al. (2019). Originally composed of 33,694 genes and 14,876 cells, genes and cells were filtered as described by Grubman et al. (2019). Cells from APOE3/3 and APOE3/4 individuals were selected (Table 2), and a Seurat object was created to consist of genes in at least 3 cells, and cells with at least 200 genes. Normalization was performed using Seurat’s SCTransform method, and Seurat’s integration workflow (Stuart et al., 2019) was performed to correct the confounded batches introduced by the experimental design. In this dataset, as shown in Table 2, control samples were processed separately from cases, male samples were processed separately from female samples, and all but one batch contained one APOE genotype. Dimensionality reduction was performed using values from the integrated assay to assess successful batch correction (Supplementary Figure 1).
To identify cell types, we adopted techniques from the original paper. Briefly, Grubman et al. (2019) used Seurat’s AddModuleScore function to calculate association scores using lists of brain cell type markers of an unspecified number from the BRETIGEA (McKenzie et al., 2018) package. They labeled cells based on which set of markers they had the highest score for, identified hybrids as cells where the highest and second highest score were within 20% of each other, and relabeled unidentified cells based on z-score transformation of the gene score distribution. In our case, we used lists of 200 genes for astrocytes, neurons, microglia, oligodendrocytes, oligodendrocyte progenitor cells (OPCs), and endothelial cells to label cells and hybrids to exclude as defined by Grubman et al. (2019). We further confirmed successful cell type identification by visualizing scores in a feature plot and assessing homogeneity and separation of clusters in PCA, and Uniform Manifold Approximation and Projection (UMAP) plots based on principal components and expression of top marker genes across cell types. Due to limitations in the number of cells, we excluded endothelial cells from further analyses, which resulted in a dataset comprising 10,850 genes and 9,587 cells (Supplementary Table 2).
Cell Type-Specific APOE Genotype-Stratified Differential Expression Analysis
To generate transcriptomic disease signatures relative to APOE genotype in each cell type, we used Limma-Voom (Law et al., 2014; Ritchie et al., 2015; Phipson et al., 2016). We included the risk factor sex as a covariate in our design formula for both datasets. In the entorhinal cortex dataset, sex, instead of batch, also accounted for the confounding relationships introduced by the original study design, allowed for an appropriate model fit, and avoided the collinearity limitation observed with including batch in the design. Additionally, as samples were age matched, we also did not include age in our design formula. A DGEList object was then created from a matrix of counts extracted from the corresponding Seurat objects. To improve the accuracy of mean-variance trend modeling and lower the severity of multiple testing correction, lowly expressed genes were filtered out using edgeR’s FilterByExpr with default parameters. Normalization was performed with Trimmed Mean of M-values with singleton pairing (TMMwsp), followed by voom, model fitting with a contrast matrix of each case-control comparison for each cell type-APOE group, and Empirical Bayes fitting of standard errors. We performed a cell type-specific AD versus control gene expression comparison in each APOE variant group separately in our defined prefrontal cortex cohort, entorhinal cohort, and male-only prefrontal cortex cohort, in which we excluded sex as a covariate. Differentially expressed genes (DEGs) were selected using a Benjamini-Hochberg (BH) corrected p-value less than 0.05, and an absolute log base twofold change (log2 FC) greater than 0.25, meaning greater than 20% change in expression. We visualized unique and shared disease related gene expression changes in cell types of each APOE genotype using pairwise and violin plots of gene expression, hierarchical clustering of samples using AD compared to control pseudobulk cell type gene expression, and Upset plots, where genes with more overlaps across the groups compared were prioritized for labeling.
Functional Enrichment Analysis and Network Visualization
We performed an overrepresentation analysis of DEGs from the cell type-specific APOE genotype-stratified analysis of cells from the prefrontal and entorhinal cortex using gprofiler (Raudvere et al., 2019), a web tool for functional enrichment using an input gene list. We queried DEGs comparison split by upregulated and downregulated expression to identify enriched pathways. In addition to Gene Ontology, we include pathways from KEGG Reactome and WikiPathways; miRNA targets from miRTarBase and regulatory motif matches from TRANSFAC; tissue specificity from Human Protein Atlas; protein complexes from CORUM, and human disease phenotypes from Human Phenotype Ontology. We followed a previously established protocol (Reimand et al., 2019) for network enrichment analysis on pathway results derived from our cell type-specific DEGs. Briefly, pathway results were imported into the Cytoscape visualization application, EnrichmentMap. We collapsed redundant and related pathways into single biological themes and further filtered significant pathways using a BH adjusted p-value < 0.01. Individual biological themes were defined and summarized using the AutoAnnotate Cytoscape application.
Results
Sample Classification and Analytic Workflow
We classified samples into AD and control groups based on tau tangle and Aβ plaque burdens, using Braak clinical staging and CERAD scores (Mirra et al., 1991), respectively (AD: Braak stage ≥ 4, CERAD score ≤ 2; Control: Braak stage ≤ 3, CERAD score ≥ 3) (Figure 1). Next, from the prefrontal cortex cohort (Table 1), we analyzed snRNA-seq data containing 43,831 cells (Supplementary Table 1) and 17,593 genes, and from the entorhinal cortex cohort (Table 2), we analyzed snRNA-seq data containing 9,587 cells (Supplementary Table 2) and 10,850 genes. Both datasets were acquired from different sets of individuals.
Due to the limited number of samples for relatively rare APOE genotypes, we focused our analysis on comparisons between AD and non-AD groups with APOE3/3 (homozygous for allele ε3) and APOE3/4 (heterozygous ε3/ε4) genotypes. We performed an APOE genotype-stratified differential gene expression (DGE) analysis comparing age-matched AD cases to controls, with sex as a covariate, in excitatory (Ex) and inhibitory (In) neurons for the prefrontal cortex specifically, undistinguished neurons (Neu) for the entorhinal cortex, and astrocytes (Ast), microglia (Mic), oligodendrocytes (Oli), and OPCs for both cohorts (Supplementary Figures 1, 2). DEGs were selected using cutoffs of a BH adjusted p-value < 0.05 and >20% change in expression. DEGs were further passed as inputs to identify pathways for subsequent network analysis. We examined gene expression and network changes in AD compared to non-AD samples to identify cell type-specific and shared changes based on APOE genotype (Figure 1).
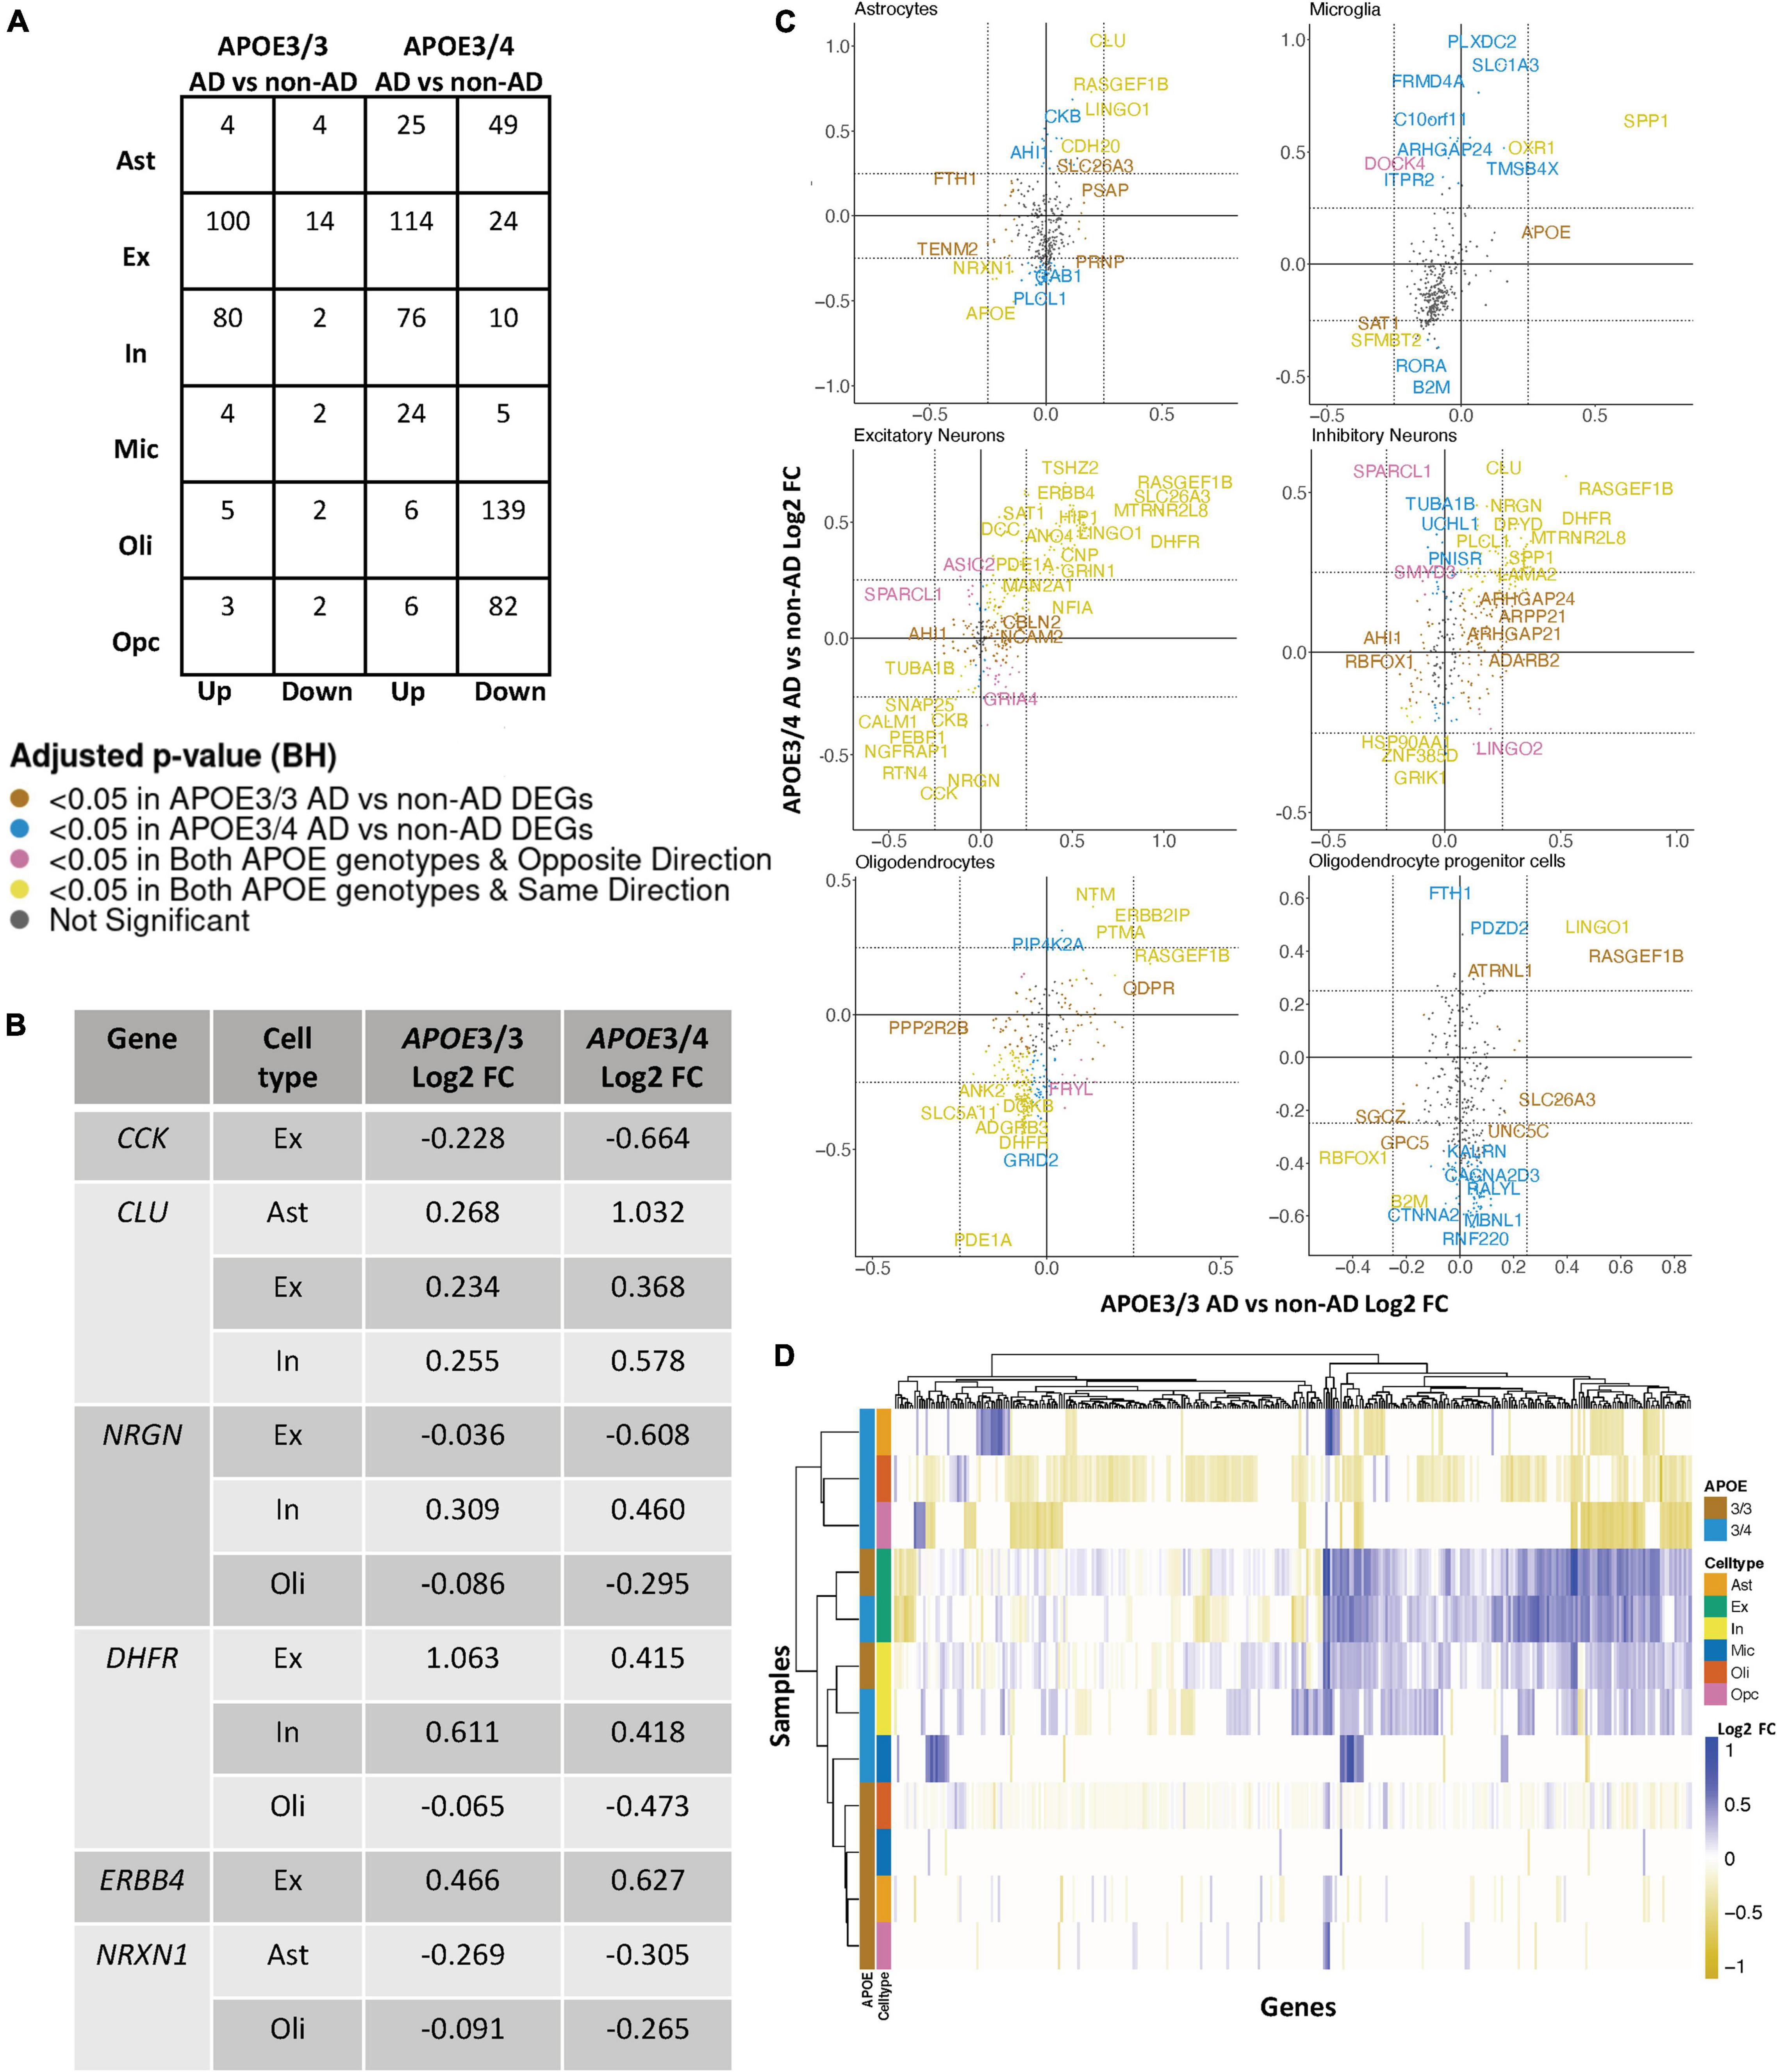
Figure 2. APOE genotype-stratified cell type-specific disease signatures in the prefrontal cortex. (A) AD versus non-AD DEG counts for astrocytes (Ast), excitatory (Ex) and inhibitory (In) neurons, microglia (Mic), oligodendrocytes (Oli), and oligodendrocyte progenitor cells (Opc) in surveyed APOE genotypes. DEGs were selected using a BH adjusted p-value < 0.05 and >20% change in expression. (B) Subset of DEGs shared by both APOE genotypes and their corresponding change in expression. (C) Pairwise DEG plots of DEGs in APOE3/3 and APOE3/4 samples using change in expression. Genes shown are significant and have >20% change in expression in at least one APOE genotype. Colors indicate significance level of DEGs and whether DEGs are unique or shared by APOE genotypes. (D) Change in expression of all genes in the DE analysis clustered by cell type and APOE genotype.
APOE Genotype-Stratified Differential Gene Expression Analysis in the Prefrontal Cortex Identifies Distinct Alzheimer’s Disease-Related Changes in Astrocytes, Oligodendrocytes, and Oligodendrocyte Progenitor Cells
Leveraging data from Mathys et al. (2019), we identified DEGs in all cell type and APOE genotype pairings when comparing AD to control tissue from 43,831 cells covering 17,593 genes (Supplementary Figure 2). Interestingly, DEGs were primarily downregulated in APOE3/4 astrocytes, oligodendrocytes and OPCs, while they were primarily upregulated in both APOE3/3 and APOE3/4 neurons (Figure 2A). Altogether, across all cell types we identified 278 unique DEGs (Supplementary Table 3). Of the 278 DEGs, 8 were specific to APOE3/3 and 135 were specific to APOE3/4. We observed DEGs previously linked to AD [CLU (Kok et al., 2011; Karch and Goate, 2015), CCK (Mazurek and Beal, 1991; Chen et al., 2019; Plagman et al., 2019), NRGN (Thorsell et al., 2010; Jin et al., 2013), DHFR (Cario et al., 2011; Philip et al., 2015), ERBB4 (Mitchell et al., 2013; Mouton-Liger et al., 2020), NRXN1 (Mozhui et al., 2011)], which were shared by APOE3/3 and APOE3/4 cells. In most cases, expression differences in these genes were in the same direction across genotypes, but with greater fold changes in APOE3/4 as compared to APOE3/3 cells (Figure 2B). Across cell types, while the majority of DEGs were shared and in consistent direction across APOE3/3 and APOE3/4 cells (Figure 2C, yellow color and Supplementary Figure 2), there were a few shared DEGs with opposite directionality of expression changes, such as DOCK4 in microglia, SPARCL1 in neurons, and FRYL in oligodendrocytes (Figure 2C, pink colorand Supplementary Figure 2).
Notably, some DEGs in AD patients relative to controls were shared across multiple cell types (Figure 3A). Examples of some DEGs in AD patients relative to controls that overlap most across cell types within or across APOE genotypes include APP binding family B member 1 interacting protein (APBB1IP), and DOCK8, a protein highly involved in brain development and immune response (Nishikimi et al., 2013). Both were differentially expressed in most APOE3/4 cell types and in APOE3/3 neurons (Figure 3A). Interestingly, for both APBB1IP and DOCK8, we observed cell type-specific effects. Both genes were downregulated in astrocytes, oligodendrocytes and OPCs and upregulated in microglia and neurons from APOE3/4 AD patients versus APOE3/4 controls. In APOE3/3 individuals, both genes were only significantly upregulated in neurons in AD patients versus controls. APOE itself was also differentially expressed in AD patients versus controls, with an increase in both APOE3/4 and APOE3/3 neurons and in APOE3/3 microglia as well as a decrease in APOE3/4 astrocytes, oligodendrocytes, and OPCs. MTRNR2L12 expression, which encodes a humanin isoform necessary for neuroprotection and anti-apoptotic function suggested to have utility as a blood marker for cognitive disability and early dementia for adults with Down Syndrome (Bik-Multanowski et al., 2015; Mahajan et al., 2018), was very similar to APOE expression. Hierarchical clustering of samples using AD compared to control pseudobulk cell type gene expression (Figure 2D) showed samples to cluster by APOE genotype before cell type identity for all cell types except neurons. Generally, through our APOE genotype-stratified analysis we observed more similarities in AD versus control DEGs across APOE genotypes in neuronal populations (both excitatory and inhibitory neurons), and differences primarily in non-neuronal cells (astrocytes, oligodendrocytes, and OPCs) (Figure 3A). In addition to identifying shared DEGs across cell types and APOE genotypes, we also observed a larger range of expression change in the analysis of APOE3/4 AD versus control (−0.834, 1.032; median = −0.273) compared to the analysis of APOE3/3 AD versus control (−0.503,1.115; median = 0.342), which we visualized in a few shared DEGs such as LINGO1, NRXN1, RASGEF1B, and CLU (Figure 3B).
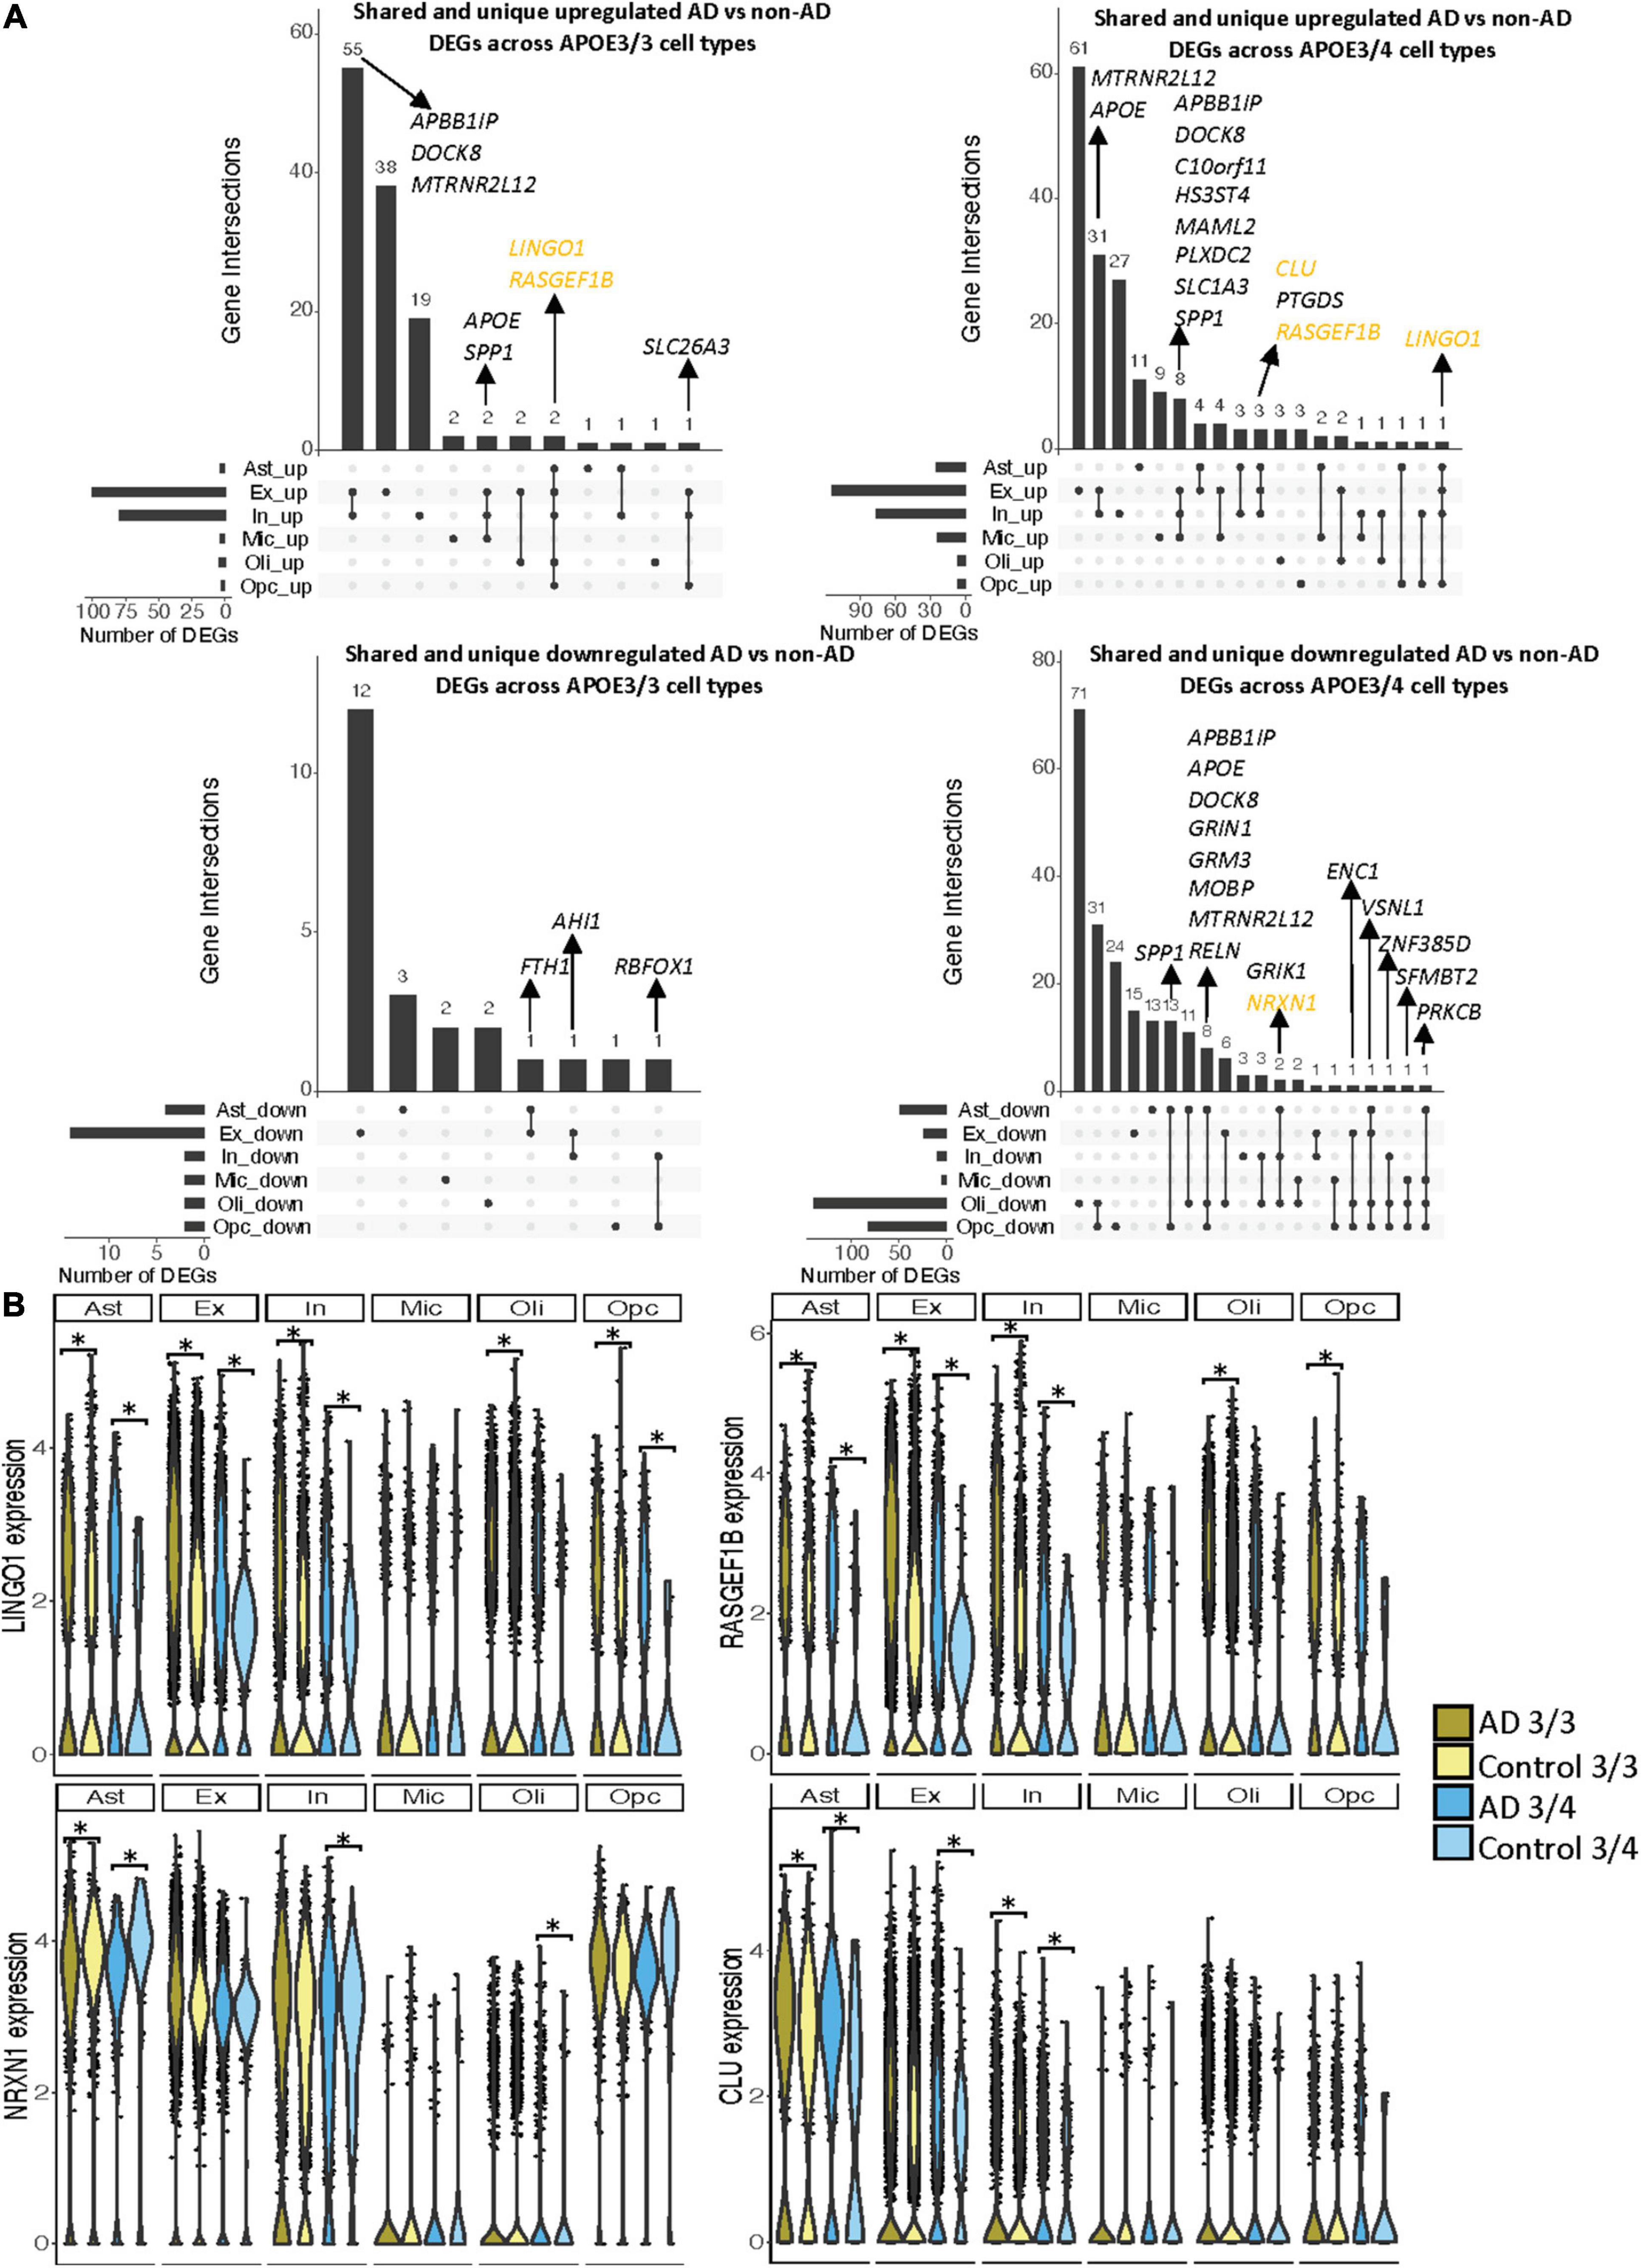
Figure 3. Shared and unique disease signatures across cell types in APOE3/3 and APOE3/4 prefrontal cortex samples. (A) Upset plots indicating intersections of AD versus non-AD DEGs (BH adjusted p-value < 0.05 and >20% change in expression) across cell types. Rows correspond to cell types. The bar chart shows the number of single and common sets of DEGs across cell types. Single filled dots represent a unique set of DEGs for each cell type. Multiple filled black dots connected by vertical lines represent common sets of DEGs across cell types. DEGs with more overlaps across groups were prioritized for labeling. (B) LINGO1, RASGEF1B, NRXN1 and CLU expression. Asterisks represent meeting both significance (BH adjusted p-value < 0.05) and change in expression (>20%) thresholds. Colors correspond to APOE genotype and AD status.
As the prefrontal cohort contained a sole non-AD sample with the APOE3/4 genotype from a male donor, we performed a sensitivity analysis in male samples to determine whether similar gene signatures remain. We identified 300 unique DEGs across all cell types (Supplementary Figure 3 and Supplementary Table 4). Of these DEGs, 18 were specific to APOE3/3 cells and 128 to APOE3/4 cells. Like the previous analysis, we observed more differences in perturbed gene profiles across APOE genotypes in astrocytes, oligodendrocytes, and OPCs, where DEGs were primarily downregulated in APOE3/4 cells. Additionally, clustering samples using AD compared to control pseudobulk cell type gene expression also showed a stronger clustering by APOE genotype than cell type identity (Supplementary Figure 3).
APOE Genotype-Stratified Differential Gene Expression Analysis in the Entorhinal Cortex Identifies Distinct Alzheimer’s Disease-Related Changes in Microglia and Oligodendrocytes
Leveraging data from Grubman et al. (2019), we identified DEGs in all cell type and APOE genotype pairings when comparing AD to control tissue from 9,587 cells and 10,850 genes. We found DEGs to be primarily downregulated in APOE3/3 AD versus control and upregulated in APOE3/4 AD versus control (Figure 4A). Altogether, across all cell types we identified 232 unique DEGs (Supplementary Table 5). Of the DEGs, 29 were specific to the APOE3/4 AD, and none were specific to the APOE3/3 AD. In each cell type, we observed more DEGs in the APOE3/4 comparison, some of which were shared with the APOE3/3 analysis, though often with consistent opposite directionality [Figure 4B; yellow (same) and pink (opposite) colors and Supplementary Figure 2]. For DEGs shared across APOE genotypes with consistent directionality, we observed differences in fold changes (Figure 4C). We also observed a higher proportion of common DEGs across APOE groups in microglia and oligodendrocytes than in other cell types, and in most cases, there was opposite directionality of gene expression changes between the APOE3/3 AD versus control comparison and APOE3/4 AD versus control comparison. Overall, clustering samples using AD compared to control pseudobulk cell type gene expression (Figure 4D) showed consistent clustering of samples by APOE genotype.
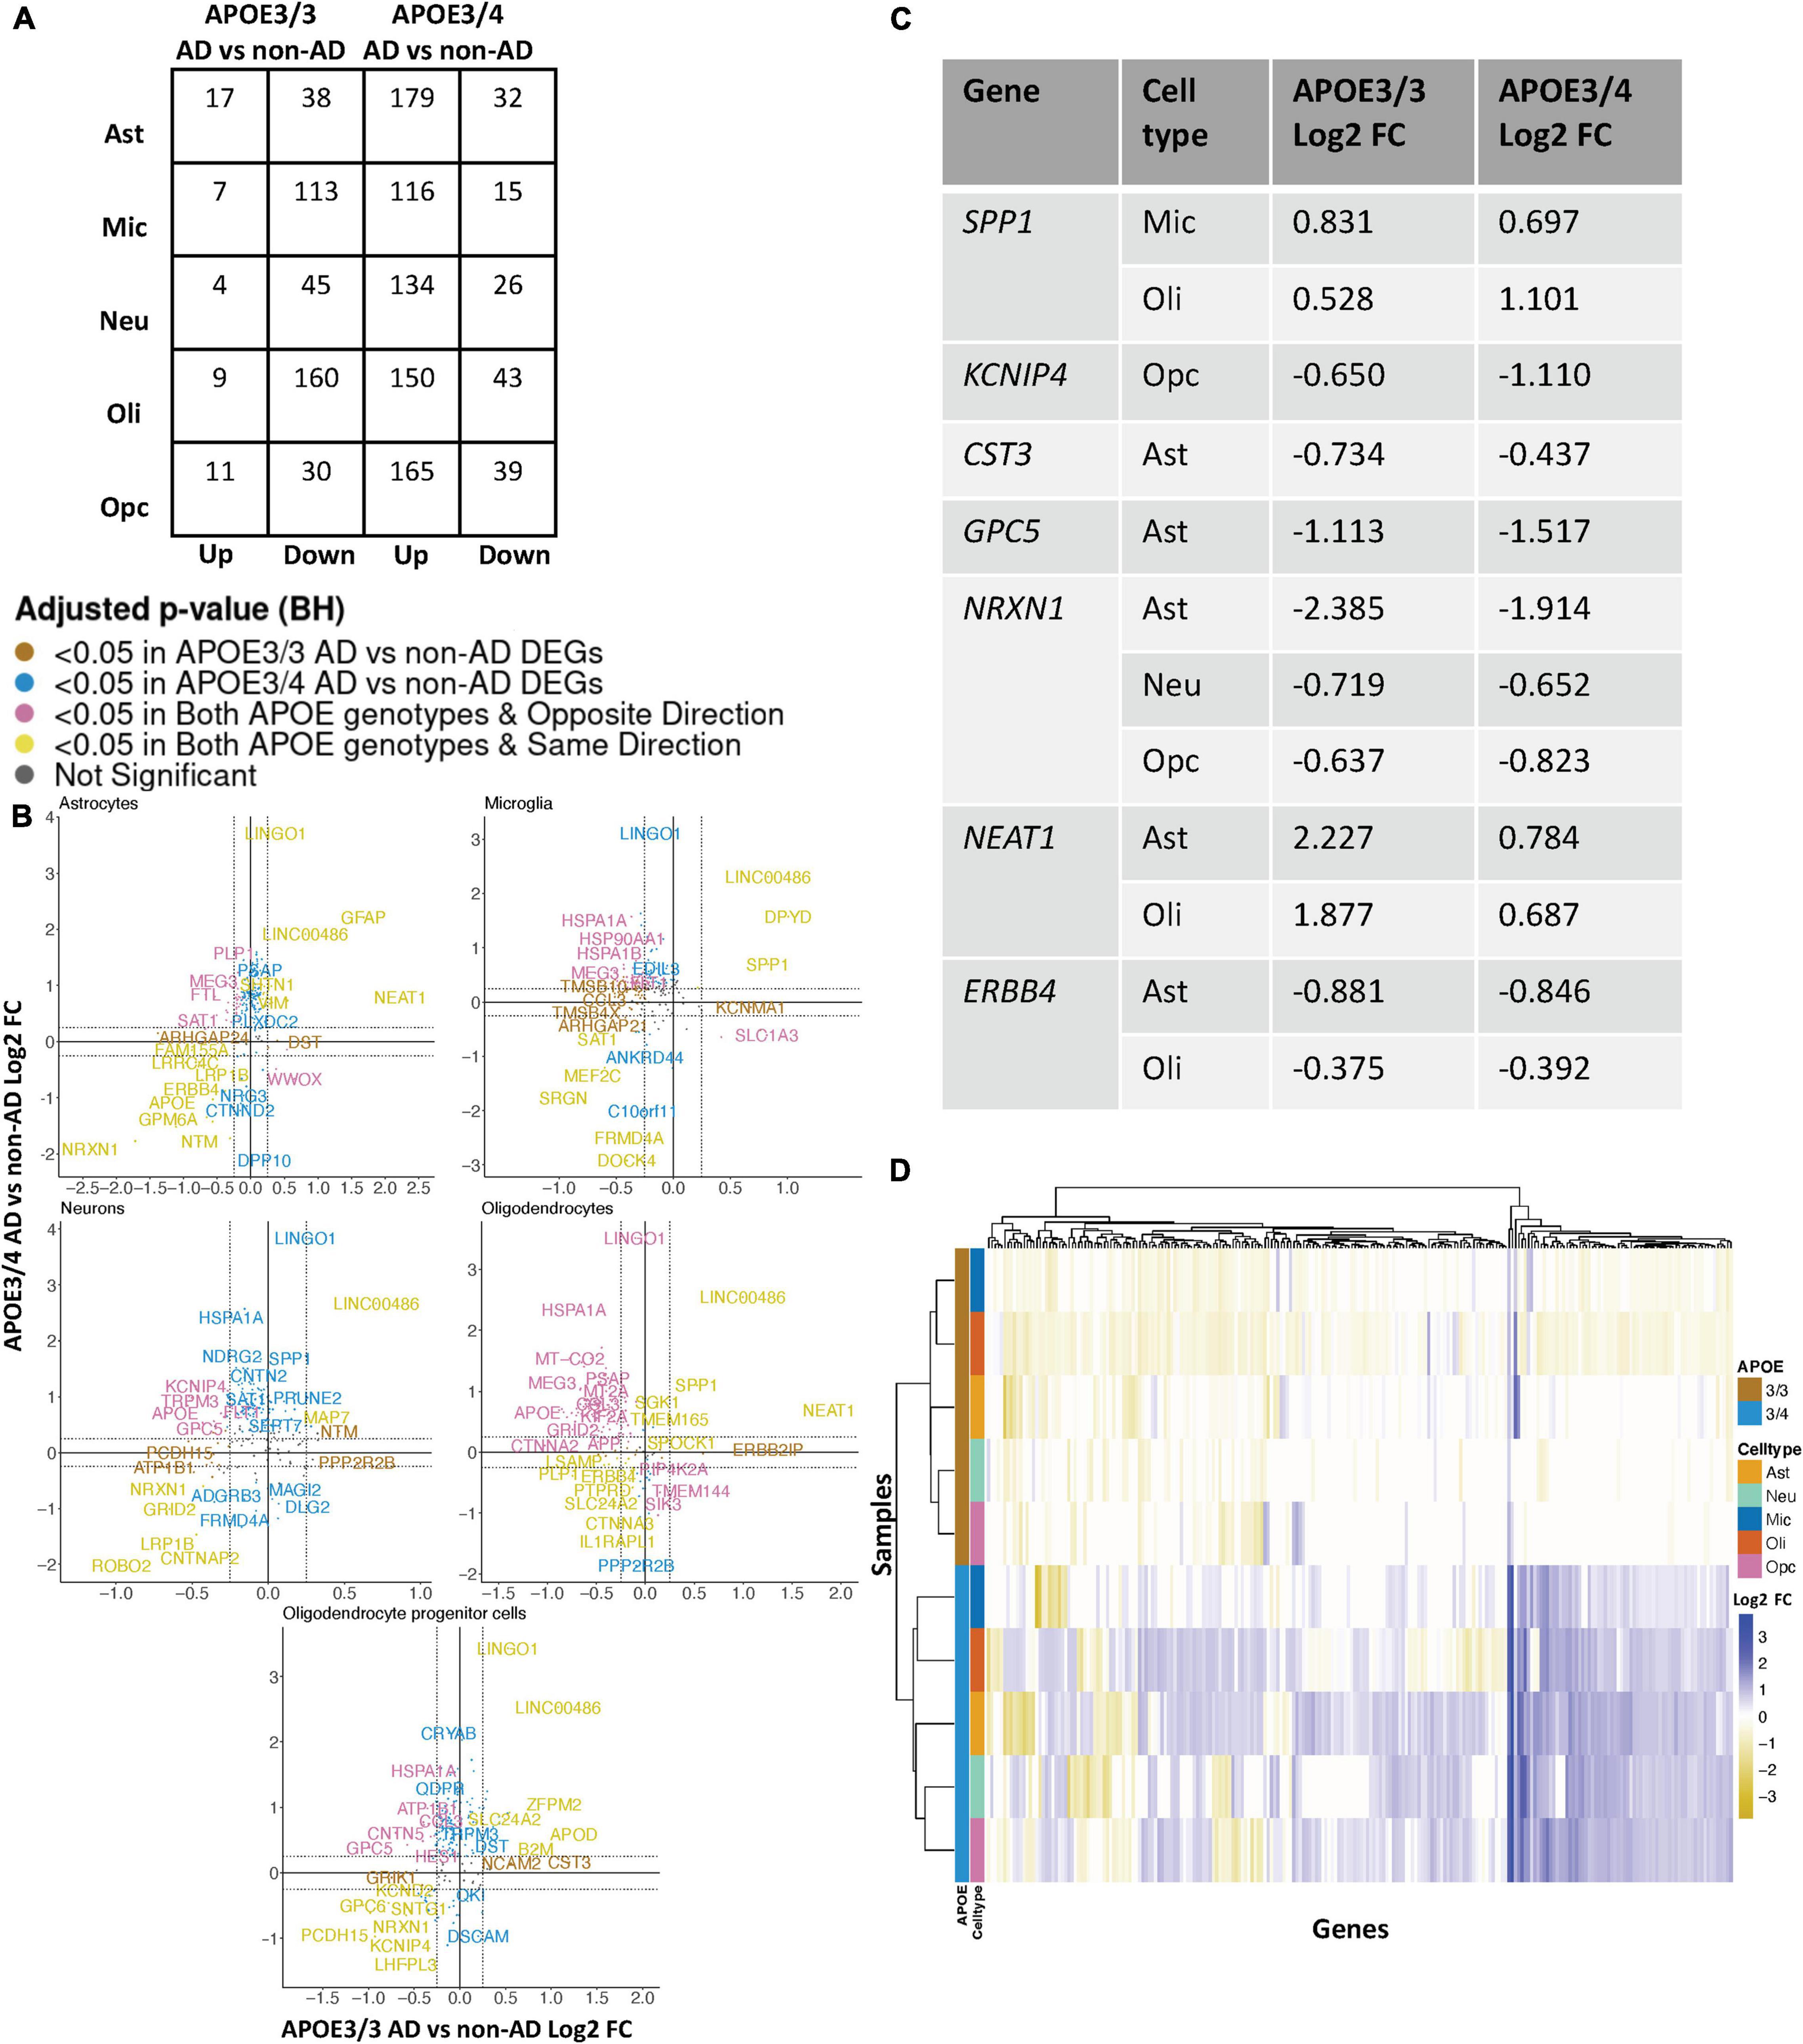
Figure 4. APOE genotype-stratified cell type-specific disease signatures in the entorhinal cortex. (A) AD versus non-AD DEG counts for astrocytes (Ast), neurons (Neu), microglia (Mic), oligodendrocytes (Oli), and oligodendrocyte progenitor cells (Opc) in surveyed APOE genotypes. DEGs were selected using a BH adjusted p-value < 0.05 and >20% change in expression. (B) Pairwise DEG plots of DEGs in APOE3/3 and APOE3/4 samples using change in expression. Genes shown are significant and have >20% change in expression in at least one APOE genotype. Colors indicate significance level of DEGs and whether DEGs are unique or shared by APOE genotypes. (C) Subset of DEGs shared by both APOE genotypes and their corresponding change in expression. (D) Change in expression of all genes in the DE analysis clustered by cell type and APOE genotype.
When surveying DEG overlaps across cell types in the entorhinal cortex, consistent with the prefrontal cortex analysis, we observed more DEGs in AD patients relative to controls shared across APOE3/4 cell types than across APOE3/3 cell types (Figure 5A). To highlight some of these DEGs that overlap most across cell types, in the APOE3/3 case-control comparisons, six DEGs –ATP1B1 (Wen et al., 2018), a sodium and potassium ATPase necessary for regulating ionic gradients; CST3 (Hua et al., 2012), an AD risk factor; GPC5 (Shin et al., 2013), a neurotrophic factor; MEG3 (Zhou et al., 2012), a long non-coding RNA and apoptosis regulator; NRXN1; and LINC00486, a relatively uncharacterized long non-coding transcript – were shared by all cell types. LINC00486 was upregulated in all APOE3/3 cell types in AD, ATP1B1, GPC5, MEG3, and NRXN1 were downregulated in all APOE3/3 cell types in AD, and CST3 was downregulated in all APOE3/3 cell types in AD, except OPCs where it was upregulated. These DEG’s were also reflected in APOE3/4 cells, with LINC00486 upregulated in all cell types, ATP1B1 and MEG3 upregulated in non-neuronal cell types, NRXN1 upregulated in oligodendrocytes and downregulated in all other cell types, GPC5 downregulated in astrocytes and upregulated in all other cell types, and CST3 downregulated in astrocytes and upregulated in neurons and oligodendrocytes in case-control comparisons.
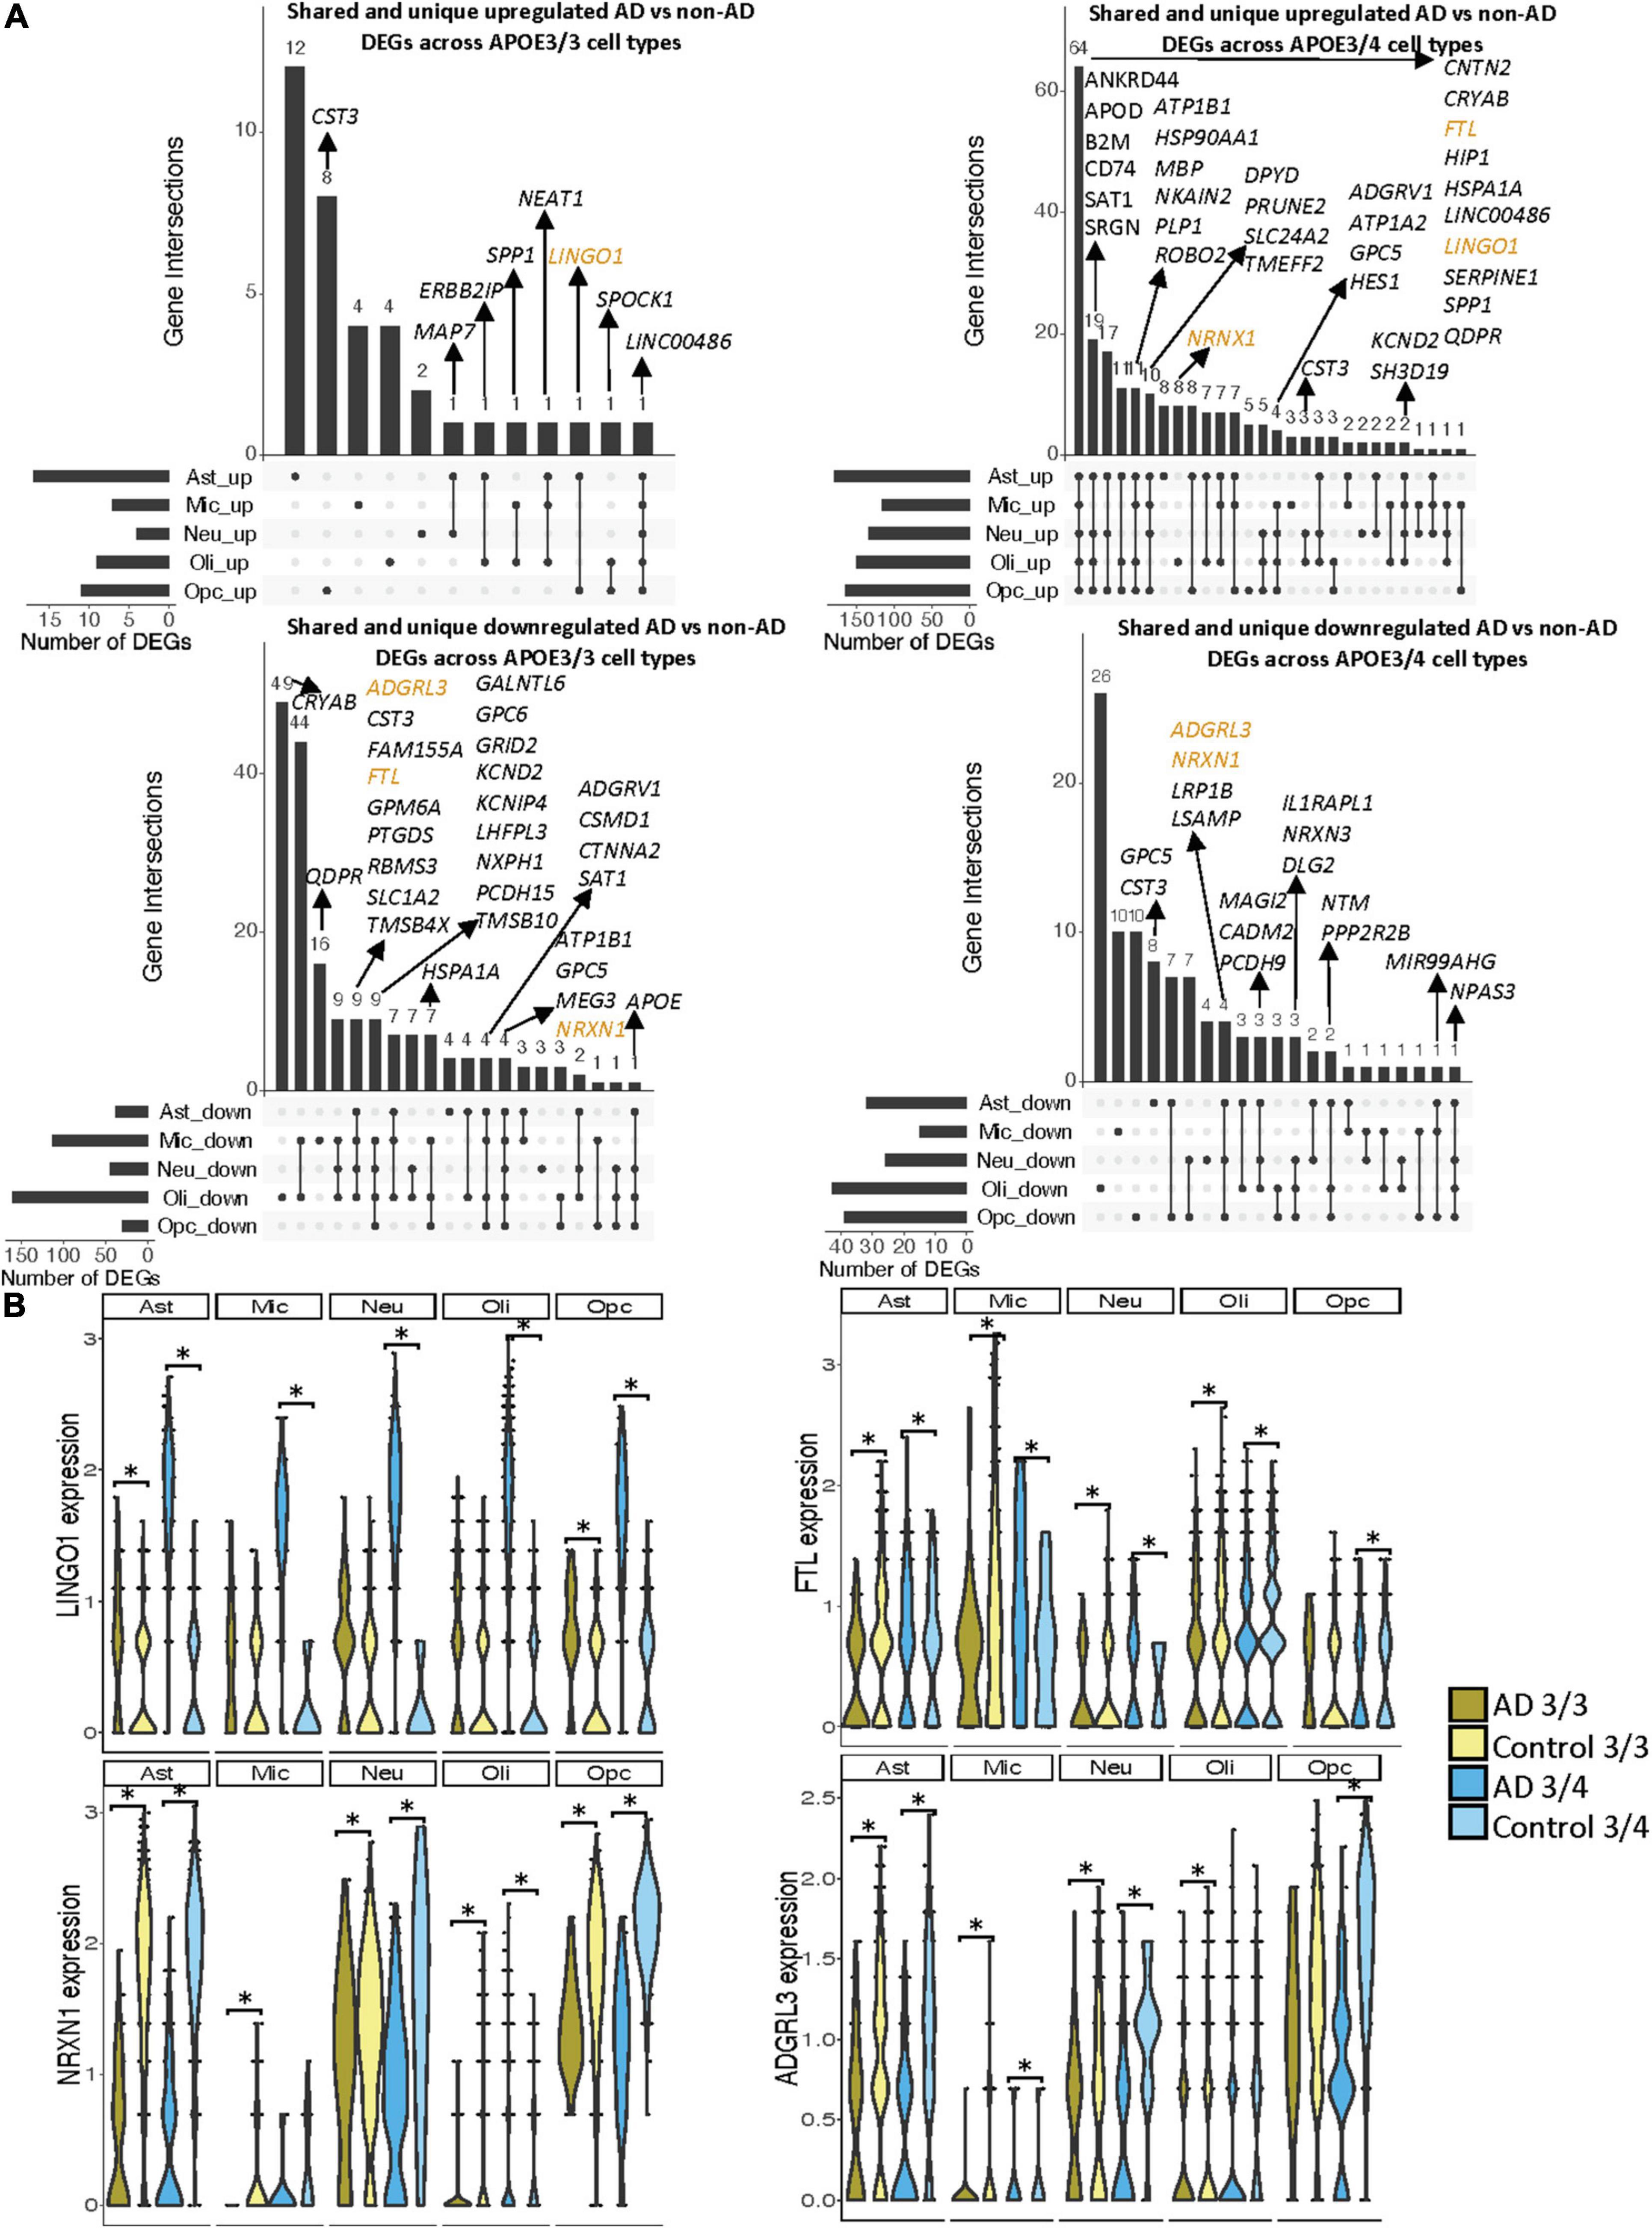
Figure 5. Shared and unique disease signatures across cell types in APOE3/3 and APOE3/4 entorhinal cortex samples. (A) Upset plots indicating intersections of AD versus non-AD DEGs (BH adjusted p-value < 0.05 and >20% change in expression) across cell types. Rows correspond to cell types. The bar chart shows the number of single and common sets of DEGs across cell types. Single filled dots represent a unique set of DEGs for each cell type. Multiple filled black dots connected by vertical lines represent common sets of DEGs across cell types. A subset of DEGs shared are highlighted to show examples of shared genes. (B) LINGO1, FTL, NRXN1, and ADGRL3 expression. Asterisks represent meeting both significance (BH adjusted p-value < 0.05) and change in expression (>20%) thresholds. Colors represent APOE genotype and diagnosis.
Overall, in the APOE3/4 case-control comparisons, 87 DEGs were shared in all cell types, with 64 consistently upregulated in AD tissue and 23 with mixed directionality across cell types when comparing AD to control tissue (Figure 5A). Of these shared DEGs, a few with higher expression changes between AD and controls include MBP, a gene important for myelination (Koenning et al., 2012; Ferrer and Andrés-Benito, 2020) that was upregulated in all APOE3/4 cell types in AD except oligodendrocytes, and LINGO1, which was upregulated in all APOE3/4 cell types as well as APOE3/3 astrocytes and OPCs in AD. Interestingly the average expression change for LINGO1 in APOE3/4 AD samples (3.52) was much higher than that of the APOE3/3 AD samples (0.451). Additionally, protein folding HSPA1A, the neuroprotective chaperone and apoptosis regulator CRYAB (Ousman et al., 2007), and quinoid dihydropteridine reductase (QDPR) were upregulated in all APOE3/4 cell types in AD. However, HSPA1A was downregulated in APOE3/3 microglia, oligodendrocytes, and OPCs, CRYAB was downregulated in APOE3/3 oligodendrocytes, and QDPR was downregulated in APOE3/3 microglia in AD. The latter two genes have previously been observed to be upregulated in oligodendrocytes and OPCs of pathologically confirmed AD individuals (Mathys et al., 2019), most of them are usually APOE4 carriers. We also observed a larger range of case-control expression change in APOE3/4 cells (−2.918, 3.839; median = 0.688) compared to APOE3/3 cells (−2.385, 2.227; median = −0.436), which we visualized in a few shared DEGs such as LINGO1, NRXN1, FTL, and ADGRL3 (Figure 5B). Largely, when comparing AD to non-AD cells in the entorhinal cortex, while we observed changes relevant to AD pathophysiology across APOE3/3 and APOE3/4 genotypes, we also observed flipped DEG expression profiles across both APOE genotypes primarily in non-neuronal cells, and more universal transcriptional changes and changes of higher amplitude in the APOE3/4 AD versus control comparison as compared to APOE3/3 AD versus control comparison.
Comparative Analysis Across Brain Regions Shows More Alzheimer’s Disease-Related Transcriptomic Changes in the Entorhinal Cortex Compared to the Prefrontal Cortex, With Consistent APOE Genotype-Specific Disease Signatures
We observed a higher number of DEGs and larger expression change magnitudes across cell types in the entorhinal cortex than in the prefrontal cortex in AD. The number of shared DEGs within cell types across APOE genotype groups was highest in the entorhinal cortex in AD, while the number of shared DEGs within cell types across brain regions was highest in APOE3/4 cells in AD (Figure 6A). With hierarchical clustering of per-cell and genotype group pseudobulk expression, while we do not observe total clustering by any of the variables examined, we see some clustering by brain region, and within these brain regions, by APOE genotype (Figure 6B).

Figure 6. APOE genotype-stratified cell type-specific disease signatures across brain regions. (A) Upset plots indicating intersections of AD versus non-AD DEGs (BH adjusted p-value < 0.05 and >20% change in expression) within cell types across brain region and APOE genotype. Rows correspond to brain region and APOE genotype pairings. The bar chart shows the number of single and common sets of DEGs across brain regions and APOE genotype pairings. Single filled dots represent a unique set of DEGs for each brain region and APOE genotype pairing. Multiple filled black dots connected by vertical lines represent common sets of DEGs across brain region and APOE genotype pairings. Bar chart colors correspond to whether DEGs are shared between brain regions or APOE genotype using the bottom right key. DEGs with more overlaps across groups were prioritized for labeling. (B) Change in expression of all genes in the DE analysis of both brain regions clustered by cell type, brain region, and APOE genotype.
Pathway and Network Analysis Reveal APOE Genotype-Specific Perturbed Biological Processes Primarily in Glial Cells Across Brain Regions
Pathway enrichment was performed using g:Profiler (Raudvere et al., 2019), a web tool that performs functional enrichment using an input of gene lists. Separate lists of upregulated and downregulated DEGs in AD relative to control, with a BH corrected adjusted p-value < 0.05 and a relaxed expression change cutoff of above 0.1, in each cell type and APOE genotype were used as inputs for g:Profiler (Supplementary Tables 6–9). A network analysis was performed to cluster the disease enriched pathways into biologically relevant groups using pathways with an adjusted p-value < 0.01 as inputs. Modules of biological themes were generated for each cell type based on the APOE genotype (Figure 7 and Supplementary Figures 4, 5).
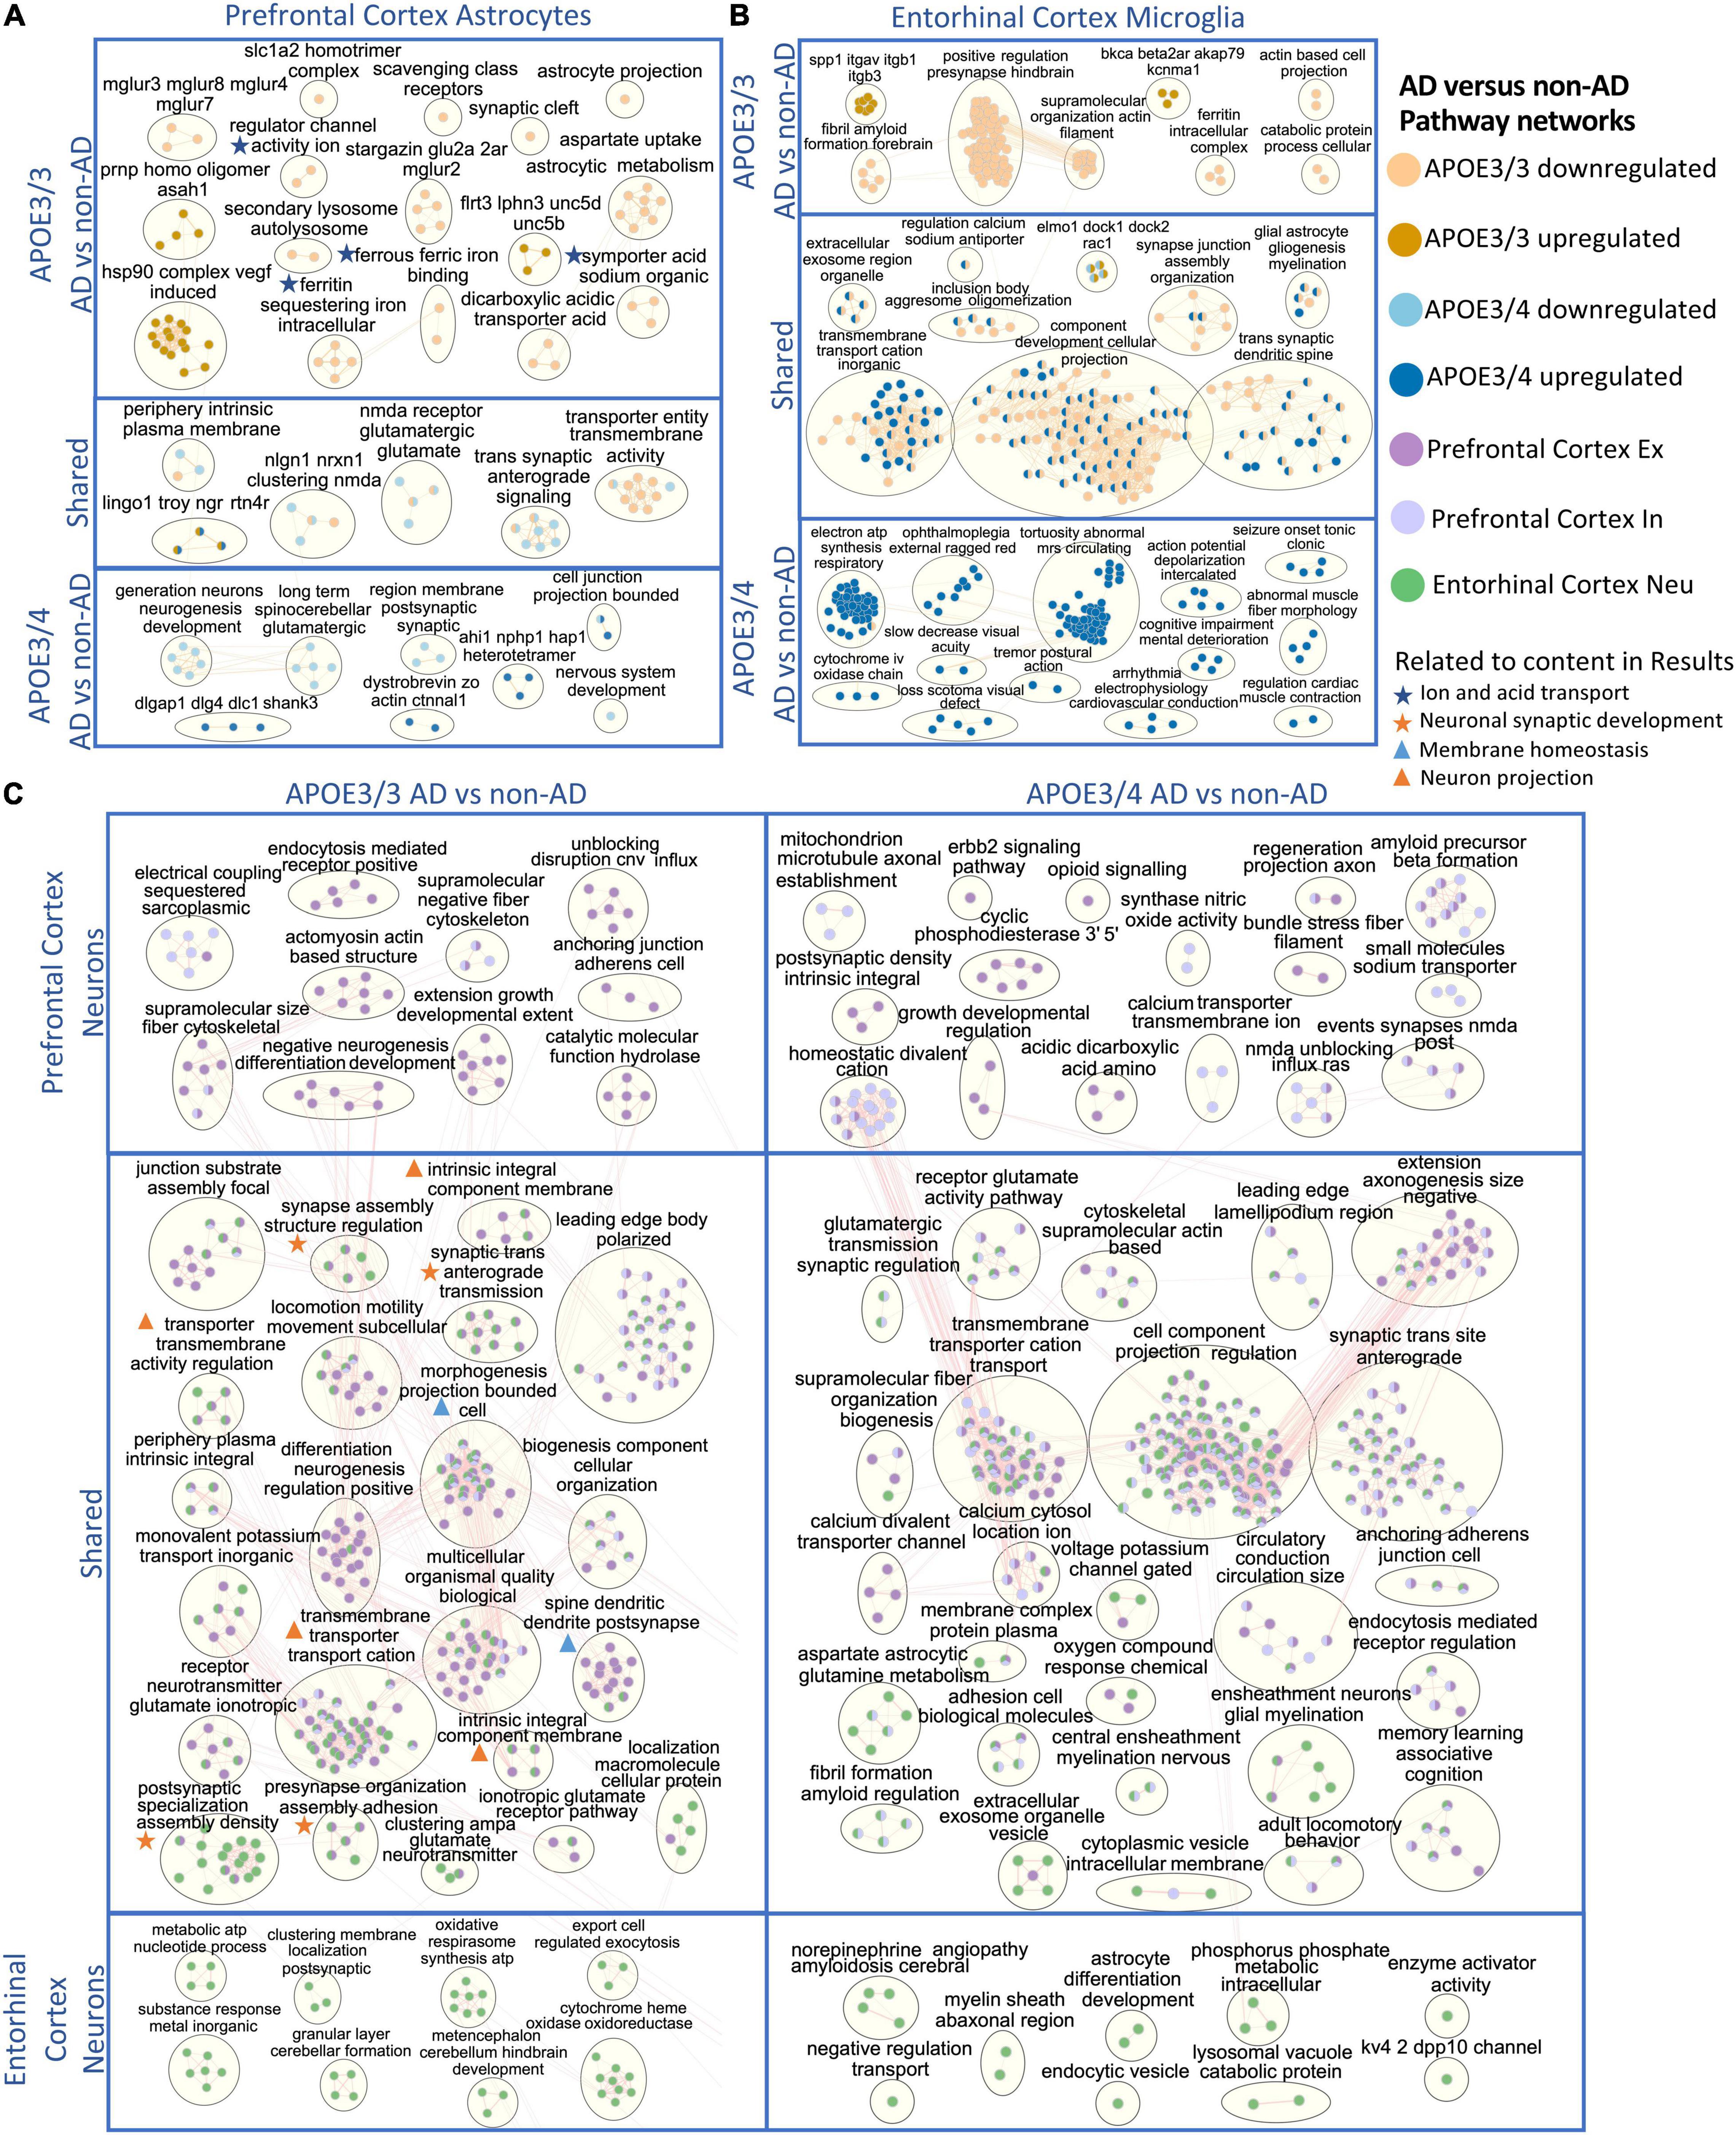
Figure 7. Enriched disease pathway networks in APOE3/3 and APOE3/4 cells. AD compared to non-AD functionally enriched pathways with a BH adjusted p-value < 0.01 clustered into biological themes for: (A) astrocytes of the prefrontal cortex, (B) microglia of the entorhinal cortex, and (C) prefrontal cortex excitatory (Ex) and inhibitory (In) neurons, and entorhinal cortex undistinguished neurons (Neu). Lines represent gene set overlaps with magnitude showed by thickness.
Through GO enrichment analysis for the prefrontal cortex, we observed pathways related to cell junctions in excitatory neurons, postsynaptic density in inhibitory neurons, Glutamatergic synapse in astrocytes, and Scavenging by Class A Receptors in microglia to be most significantly perturbed in APOE3/3 diseased samples (Supplementary Table 6). In APOE3/4 diseased samples, the top significantly perturbed pathways were related to cell junctions and upregulated in excitatory neurons, inhibitory neurons, and astrocytes, while Apelin signaling pathway was upregulated and most significant in microglia (Supplementary Table 7). Also, we observed terms associated with inflammatory processes such as TNF-α and NF-kappa B signaling complex to be upregulated in APOE3/3 diseased astrocytes compared to controls, but not in APOE3/4. Functional pathways related to synapse organization, neuron differentiation, neurogenesis, and axon development were downregulated in APOE3/4 diseased individuals compared to controls only.
In astrocytes from the prefrontal cortex, we identified six enriched functional modules in both APOE3/3 and APOE3/4 AD relative to controls (Figure 7A). Five out of six were downregulated in AD, and one, the LINGO1-TROY-NgR complex, which was previously suggested to be important for modulating glial-neuronal interactions in demyelinating lesions, was upregulated in AD (Satoh et al., 2007). In APOE3/3 astrocytes, ion and acid transport, glutamate receptor activity (mGLUR2, mGLUR3, mGLUR4, mGLUR7, and mGLUR8), metabolic (aspartate uptake and astrocytic metabolism) as well as autolysosome activities (scavenging class receptors, secondary lysosome, and autolysosome) were downregulated in AD, and myelin maintenance (PRNP and ASAH1), cell adhesion (FLRT3, LPHN3, UNC5B, and UNC5D), and Vascular endothelial growth factor (VEGF) induced heat shock protein 90 (hsp90) complex were upregulated in AD, indicating perturbation in processes important for autophagy and stress response which are known to accompany disease progression (Karch and Goate, 2015; Long and Holtzman, 2019). APOE3/4 astrocytes uniquely showed upregulation in pathways related to post-synaptic scaffold proteins (e.g., DLGAP1, DLG4, DLC1, and SHANK3) and actin assembly at cell junctions, but downregulation of synaptic membrane and neurotransmitter pathways, neurogenesis, and nervous system development in AD.
In APOE3/3 astrocytes of the entorhinal cortex, we observed a downregulation of ion and neurotransmitter transport related pathways (intracellular ion and ferritin iron sequestering) in AD. APOE3/4 astrocytes in the entorhinal cortex had mostly upregulated pathway enrichment modules in AD, in contrast to what was observed in prefrontal cortex (Supplementary Figure 5). Many of these pathways governing cellular homeostasis, such as ATP synthesis, transmembrane cation transport, amyloid fibril formation and exosome regulation, and macromolecule and protein plasma membrane localization.
Microglia, the resident brain macrophage, contributes to neuroinflammation in AD and produces APOE upon activation in the brain (Lane et al., 2018; Long and Holtzman, 2019). Differentially enriched pathways were predominantly upregulated in APOE3/4 microglia in AD patients in both prefrontal (Supplementary Figure 4) and entorhinal cortices (Figure 7B), while downregulated in APOE3/3 microglia. Within the entorhinal cortex, changes in gliogenesis, myelination, cation transmembrane transport, cellular projection, synaptic spine development, and synaptic junction assembly pathway network modules were shared in APOE3/3 AD and APOE3/4 AD but perturbed in opposite directions, downregulated in APOE3/3, and upregulated in APOE3/4 microglia (Figure 7B). The ITGAV-ITGB-SPP1 complex, not previously linked to AD to our knowledge, was significantly upregulated in both brain regions in APOE3/3 microglia in AD, but only in the prefrontal cortex in APOE3/4 microglia in AD (Figure 7B and Supplementary Figure 4). The downregulation of iron homeostasis and ferritin complex, a protein that binds to iron and reflects the level of iron storage in the body, was observed in APOE3/3 microglia and astrocytes of both prefrontal and entorhinal cortex in AD (Figures 7A,B and Supplementary Figure 4).
The GO enrichment analysis of the entorhinal cortex revealed the most pronounce difference between APOE3/3 and APOE3/4 were pathways related to cellular projection development in microglia and astrocytes, such as morphogenesis of plasma membrane, cellular compartment, and plasma membrane bounded cell projection (Supplementary Tables 8, 9). Moreover, GO terms related to homeostatic process, neurogenesis, regulation of transport, and multicellular signaling process were also upregulated in APOE4 all cell types except neurons and downregulated in APOE3/3 microglia and oligodendrocytes.
Overall, network analysis comparing neurons from two brain regions yielded many similar perturbed biological processes within each APOE genotype in AD (Figure 7C). In APOE3/3 neurons, shared differentially perturbed processes between brain regions were mostly related to regulation of membrane homeostasis, neuron projection, and synaptic development. Pathway networks in APOE3/3 neurons specific to the prefrontal cortex pertain to cell structure development (actomyosin actin-based structure, extension growth development, anchoring junction, cell adherens), while the entorhinal cortex showed unique modules relevant to cellular energy production (oxidative respirasome synthesis and metabolic ATP nucleotide process). From APOE3/4 neurons, we observed a more diverse population of shared network modules between the two brain regions, including functional processes related to protein trafficking vesicles, myelination, membrane assembly, and voltage gated channel and neurotransmitter receptor regulation. Amyloid fibril formation was uniquely differentially regulated in APOE3/4 neurons and observed in both brain regions in AD, while an amyloid beta precursor formation module was only observed APOE3/4 neurons in prefrontal cortex in AD.
In oligodendrocytes, which provide myelination, APOE3/3 carriers in the prefrontal cortex showed an upregulation of the ITGAV-ITGB-SPP1 complex and downregulation of pathways related to myelin organization (e.g., juxtaparanode region of axon), ion transport activity, protein refolding, and regulation of MAP kinase signaling activity (e.g., positive regulation of Erk1 and Erk2 in AD). APOE3/4 oligodendrocytes, on the other hand, showed upregulation of stress responses through chaperone mediated protein folding, and downregulation of axon guidance and nervous system development processes in AD. In the entorhinal cortex, we observed modules of processes including neurogenesis, gliogenesis, amyloidosis, aerobic metabolic processes, and exocytosis to be upregulated in APOE3/4 cells and downregulated in APOE3/3 cells in AD (Supplementary Figure 5). Lastly, we observed postsynaptic structural specialization to be uniquely downregulated in APOE3/4 oligodendrocytes.
For OPCs in the prefrontal cortex, there were no common network modules across APOE genotypes. In APOE3/3 AD, we identified downregulation for brain cell development processes (AHI1-NPHP1-HAP1) (Supplementary Figure 4). In APOE3/4 OPCs, we observed upregulated modules for the ferritin, GAIT and LINGO1-TROY-NgR complexes, and downregulation for glutamatergic synaptic activity, plasma membrane and cell organization, and lipoprotein density in AD, which may have implications for neuronal integrity and lipid transport and metabolism. In the entorhinal cortex of AD, we also observed upregulation of the LINGO1-TROY-NgR, and downregulation of glutamatergic signaling in APOE3/3 OPCs in AD. Specific to APOE3/4 OPCs in AD, we identified upregulation of processes related to aerobic metabolic processes, stress response, autophagy, amyloid fibril regulation, demyelination, and immune response.
Discussion
APOE4 is the greatest known genetic risk factor for AD; however, along with other APOE isoforms, its molecular profiles are yet to be investigated at a single-cell level. Here, we analyzed recently available single-cell transcriptomic datasets from two brain regions to better understand how APOE genotype plays into transcriptional profiles of AD in a cell type-specific manner. We aimed to understand whether transcriptional differences exist, and if so, how they might be represented in different cell types across brain regions; which cell types were most affected by APOE genotype; what changes were shared or dissimilar across cell types; and whether such findings are consistent across brain regions. We performed an APOE genotype-stratified differential gene expression analysis comparing AD to control samples within each cell type. Due to the limited number of samples for relatively rare APOE genotypes, we restricted our analysis to individuals with APOE3/3 and APOE3/4 genotypes.
In both the prefrontal and entorhinal cortices, we observed shared and unique gene signatures across these APOE genotypes that were often cell type-specific, but sometimes spanned many cell types (Figures 2–5). In both brain regions, we observed differing molecular profiles between APOE genotypes primarily in glial cells. Interestingly, in both brain regions, we observed a subset of shared DEGs and enriched pathway networks to be perturbed in opposite directions between APOE genotypes in AD relative to healthy state, which may indicate potential compensatory or deleterious mechanisms in disease progression in each genotype. Additionally, we observed more DEGs unique to APOE3/4 cells in AD versus control when compared to DEGs for APOE3/3 cells in AD versus control and more DEG overlaps across cell types in APOE3/4 AD, suggesting distinct disease-relevant molecular profiles between APOE genotypes and more global AD-related molecular responses when one copy of the APOE4 allele is present.
In the prefrontal cortex, most DEGs that are common across cell types tend to be more strongly differentially expressed in APOE3/4 AD as compared to those in APOE3/3 AD. Additionally, we observed most of the APOE genotype-specific changes in APOE3/4 astrocytes, oligodendrocytes and OPCs, where these genes are predominantly downregulated in AD as compared to controls. Neurons, on the other hand, tended to exhibit DEGs of AD versus control that were common across APOE genotypes (Figure 2A and Supplementary Figure 2). Through hierarchical clustering of samples using AD compared to control pseudobulk cell type gene expression (Figure 2C), we observed clustering by APOE genotype in all cell types except neurons.
In the entorhinal cortex, microglia and oligodendrocytes had the highest proportion of DEGs of AD versus control that were shared across APOE genotypes. Interestingly, these DEGs frequently exhibited opposite changes in expression between APOE3/3 AD cells and APOE3/4 AD cells, implying differing mechanisms of neurodegeneration based on the presence of the APOE4 isoform. Additionally, through hierarchical clustering of samples using AD compared to control pseudobulk cell type gene expression, we observed some influence of brain region and APOE genotype on gene expression (Figure 6B). Compared to the prefrontal cortex, the entorhinal cortex, which is implicated in early stages of AD where tau begins to accumulate and the occurrence of synaptic and neuronal loss is associated with the onset of cognitive impairment (Khan et al., 2014; Lane et al., 2018; Long and Holtzman, 2019), had a larger expression change range for DEGs overall, implying a greater magnitude of molecular changes in this region in AD.
Through pathway and network analysis, we identified biological processes potentially involved in AD pathogenesis that were uniquely modified by APOE genotype (Figure 7 and Supplementary Figures 4, 5). While many essential cellular processes were differentially regulated in APOE3/3 neurons in AD, most were related to energy production, membrane regulation, and cellular signaling through synapse. APOE3/4 neurons in AD, on the other hand, demonstrated a perturbation of enriched pathways linked to myelination and protein trafficking vesicle regulation (both endocytosis and exosome), which are important cellular processes that protect the integrity of neurons by providing insulation and filtering toxic elements from these cells. This evidence suggests that APOE, a known lipid metabolizing protein, may play differential roles in maintaining essential metabolic processes for neuronal myelination and vesicle trafficking based on its isoform. Glial cells from APOE3/3 and APOE3/4 AD had many uniquely versus common altered biological processes, identified by the APOE genotype-specific pathway modules. This suggests that APOE genotype modifies glial cell biology in different ways compared to its effects on neuronal cell biology during AD progression. Further study on AD pathogenesis focusing on glial cell modification by the APOE genotype might facilitate personalized therapeutic development for AD patients with different APOE genotypes.
While we were able to examine APOE genotype-specific changes across cell types in both brain regions, some limitations exist. First, due to limited APOE genotypes that restricted our analysis to APOE3/3 and APOE3/4 samples, we could not explore more transcriptional profiles such as that of higher AD risk genotypes like APOE4/4. While we focus our analysis on AD-related changes in APOE3/3 and APOE3/4 genotype, it is important to highlight that while one copy of APOE4 can alter gene expression patterns, one copy of APOE3 may be protective against APOE4-related pathological changes. In future studies, it will be of interest to not only include more genotypes such as APOE4/4, but to also compare gene expression changes in associated with APOE genotype in healthy controls.
Each dataset contained only one APOE3/4 control, which was a male sample in both cases. This is a limitation of the data that is currently available and in future studies additional controls should be included. We performed a sensitivity analysis in males of the prefrontal cortex cohort (Supplementary Figure 3), where we also observed more differences in perturbed gene profiles across APOE genotypes in astrocytes, oligodendrocytes, and OPCs, and a stronger clustering by APOE genotype than cell type identity.
The entorhinal cortex dataset also presents several constraints. It has a small sample size of four cases and five controls, which are also imbalanced with regards to APOE genotypes and sex. Specifically, all APOE3/3 samples are from female subjects, all APOE3/4 samples are from male subjects, one of the four cases is an APOE3/3 sample, and one of the five controls is an APOE3/4 sample. Additionally, we observed a batch effect, where cases were sequenced in separate batches from controls, and each batch contained only one sex. To mitigate these limitations, we used Seurat’s integration workflow to integrate the batches and used dimensionality reduction to confirm appropriate batch correction (Supplementary Figure 1). We also included sex as a covariate in our model for differential expression to account for batch while avoiding the collinearity observed with including batch. Another limitation was that the effects of degree of amyloid beta peptide (Aβ) and tau accumulation had not been considered as a potential confounder. These peptides are known to play a major role in Alzheimer disease, with APOE4 increasing accumulation of Aβ and tau neurofibrillary tangles (Schmechel et al., 1993; Shi et al., 2017). Although samples were initially classified as AD or control based on the burden of Aβ plaque and tau neurofibrillary tangles, using CERAD and Braak scores, respectively, a future extension of this work will be to include this potential confounder in the analysis.
Furthermore, we recognize some limits to our findings. Interpretation at the DEG level (Figures 3A, 5A, 6A) was limiting without cell type-specific associations and AD-related mechanistic insights. To consolidate the novel and previously explored DEGs in AD into meaningful insights, we performed a pathway and network enrichment analysis. Comparing disease-relevant signatures across brain regions, we recognize that our observations are influenced by the entorhinal cortex dataset’s constraints and the variability in acquiring each cohort, which is sourced from different sets of individuals and studies. With this limitation, we could not explore further molecular profiles unique to each brain region and their implications for the spread of AD pathology. Overall, the nature of our analysis only allows for association of transcriptomic changes with APOE genotype, so links to causality might be hypothesized, but additional followup are needed to prove any such potential links.
Despite the limitations in our study, we present disease-relevant biology with regards to APOE-genotype, which we hope spurs further investigation as more single-cell AD datasets become available. We hope that more single-cell AD datasets become available from more brain regions and from diverse sets of individuals, across different ages, racial and ethnic backgrounds, with a greater diversity of APOE genotypes and disease severity, thus allowing for more extensive insights. With more diverse genomic data, researchers may (1) integrate datasets from multiple sources and brain regions, (2) examine disease-relevant molecular changes based on APOE genotype across brain regions and covariates like age, sex, and severity of pathology, (3) further investigate cell type-and brain region-specificity to uncover APOE genotype related molecular profiles associated with the spread pathology, and (4) computationally validate findings with relevant multiomics studies, and subsequently conduct follow-up studies in vitro and in vivo. Ultimately, we identified key AD-related genes and pathways that are specific to APOE genotypes and cell types, especially glial cells, as well as certain consistently affected pathways. These results will inform how glial cells are potentially primary sites of AD-related transcriptional differences based on APOE genotype, suggesting possible mechanisms and vulnerable cell subpopulations relevant to AD pathogenesis, and thus can help to facilitate precision medicine diagnostic and drug discovery efforts.
Data Availability Statement
Publicly available datasets were analyzed in this study. This data can be found here: single nuclei RNA-Seq (snRNA-seq) data and metadata were accessed from their respective repositories: the prefrontal cortex from the Accelerating Medicines Partnership Alzheimer’s Disease Project (AMP-AD) Knowledge Portal under the Religious Orders Study and Memory and Aging Project (ROSMAP) (https://www.synapse.org/#!Synapse:syn18485175 and https://www.synapse.org/#!Synapse:syn3157322), and the entorhinal cortex from a data repository provided by Grubman et al. (2019) (http://adsn.ddnetbio.com/). Data from the entorhinal cortex may also be accessed from the Gene Expression Omnibus under the accession number GSE138852. Access to the prefrontal cortex dataset requires a formal request to ROSMAP. To enable other researchers to explore these datasets, all code necessary for recreating the reported analyses and figures within R, are available on Github at https://github.com/stebel5/AD_APOE_snRNAseq.
Author Contributions
SB and MS conceived the study. SB designed the study and performed data analysis and interpretation of results (snRNAseq differential gene expression analysis and pathway functional enrichment), generated figures, and drafted the manuscript. DB assisted in developing methods and figures for the analysis and drafted the manuscript. AR assisted in developing methods for data analysis. YL performed network analysis, generated figures for the network analysis, and drafted the manuscript. CS, TO, AT, BG, KZ, GF, and YH contributed to the discussion of methods and results as well as the implications of the findings. MS oversaw the study. All authors read and contributed to the final manuscript.
Funding
This work was funded by the National Institute on Aging (NIA) grants R01AG060393 and R01AG057683. This material is based upon work supported by the National Science Foundation Graduate Research Fellowship Program under Grant No. 1650113. Any opinions, findings, and conclusions or recommendations expressed in this material are those of the author(s) and do not necessarily reflect the views of the National Science Foundation.
Conflict of Interest
YH is a cofounder and scientific advisory board member of Escape Bio, Inc., GABAeron, Inc., and Mederon Bio, LLC. MS is on the advisory board of Aria Pharmaceuticals.
The remaining authors declare that the research was conducted in the absence of any commercial or financial relationships that could be construed as a potential conflict of interest.
Publisher’s Note
All claims expressed in this article are solely those of the authors and do not necessarily represent those of their affiliated organizations, or those of the publisher, the editors and the reviewers. Any product that may be evaluated in this article, or claim that may be made by its manufacturer, is not guaranteed or endorsed by the publisher.
Acknowledgments
We are grateful to Martin Kampmann for fruitful discussions and suggestions during the progress of this work. We thank Katharine Yu, Idit Kosti, Dmitry Rychkov, Alice Tang, and the rest of the Sirota Lab for scientific guidance and support in this project.
Supplementary Material
The Supplementary Material for this article can be found online at: https://www.frontiersin.org/articles/10.3389/fnagi.2022.749991/full#supplementary-material
Footnotes
- ^ https://www.synapse.org/#!Synapse:syn18485175
- ^ https://www.synapse.org/#!Synapse:syn3157322
- ^ http://adsn.ddnetbio.com/
- ^ https://biorender.com/
References
Allen, M., Carrasquillo, M. M., Funk, C., Heavner, B. D., Zou, F., Younkin, C. S., et al. (2016). Human whole genome genotype and transcriptome data for Alzheimer’s and other neurodegenerative diseases. Sci. Data 3:160089. doi: 10.1038/sdata.2016.89
Bik-Multanowski, M., Pietrzyk, J. J., and Midro, A. (2015). MTRNR2L12: a candidate blood marker of early Alzheimer’s disease-like dementia in adults with down syndrome. J. Alzheimers Dis. 46, 145–150. doi: 10.3233/JAD-143030
Bunis, D. G., Andrews, J., Fragiadakis, G. K., Burt, T. D., and Sirota, M. (2020). dittoSeq: universal user-friendly single-cell and bulk RNA sequencing visualization toolkit. Bioinformatics 36, 5535–5536. doi: 10.1093/bioinformatics/btaa1011
Cario, H., Smith, D. E. C., Blom, H., Blau, N., Bode, H., Holzmann, K., et al. (2011). Dihydrofolate reductase deficiency due to a homozygous DHFR mutation causes megaloblastic anemia and cerebral folate deficiency leading to severe neurologic disease. Am. J. Hum. Genet. 88, 226–231. doi: 10.1016/j.ajhg.2011.01.007
Chen, X., Li, X., Wong, Y. T., Zheng, X., Wang, H., Peng, Y., et al. (2019). Cholecystokinin release triggered by NMDA receptors produces LTP and sound-sound associative memory. PNAS 116, 6397–6406. doi: 10.1073/pnas.1816833116
Conway, J. R., Lex, A., and Gehlenborg, N. (2017). UpSetR: an R package for the visualization of intersecting sets and their properties. Bioinformatics 33, 2938–2940. doi: 10.1093/bioinformatics/btx364
Ferrer, I., and Andrés-Benito, P. (2020). White matter alterations in Alzheimer’s disease without concomitant pathologies. Neuropathol. Appl. Neurobiol. 46, 654–672. doi: 10.1111/nan.12618
Grubman, A., Chew, G., Ouyang, J. F., Sun, G., Choo, X. Y., McLean, C., et al. (2019). A single-cell atlas of entorhinal cortex from individuals with Alzheimer’s disease reveals cell-type-specific gene expression regulation. Nat. Neurosci. 22, 2087–2097. doi: 10.1038/s41593-019-0539-534
Hebert, L. E., Weuve, J., Scherr, P. A., and Evans, D. A. (2013). Alzheimer disease in the United States (2010-2050) estimated using the 2010 census. Neurology 80, 1778–1783. doi: 10.1212/WNL.0b013e31828726f5
Hoe, H.-S., Freeman, J., and Rebeck, G. W. (2006). Apolipoprotein E decreases tau kinases and phospho-tau levels in primary neurons. Mol. Neurodegeneration 1:18. doi: 10.1186/1750-1326-1-18
Hua, Y., Zhao, H., Lu, X., Kong, Y., and Jin, H. (2012). Meta-Analysis of the Cystatin C(CST3) Gene G73A polymorphism and susceptibility to Alzheimer’s disease. Int. J. Neurosci. 122, 431–438. doi: 10.3109/00207454.2012.672502
Jin, Z., Fu, Z., Yang, J., Troncosco, J., Everett, A. D., and Van Eyk, J. E. (2013). Identification and characterization of citrulline-modified brain proteins by combining HCD and CID fragmentation. Proteomics 13, 2682–2691. doi: 10.1002/pmic.201300064
Karch, C. M., and Goate, A. M. (2015). Alzheimer’s disease risk genes and mechanisms of disease pathogenesis. Biol. Psychiatry 77, 43–51. doi: 10.1016/j.biopsych.2014.05.006
Khan, U. A., Liu, L., Provenzano, F. A., Berman, D. E., Profaci, C. P., Sloan, R., et al. (2014). Molecular drivers and cortical spread of lateral entorhinal cortex dysfunction in preclinical Alzheimer’s disease. Nat. Neurosci. 17, 304–311. doi: 10.1038/nn.3606
Koenning, M., Jackson, S., Hay, C. M., Faux, C., Kilpatrick, T. J., Willingham, M., et al. (2012). Myelin gene regulatory factor is required for maintenance of myelin and mature oligodendrocyte identity in the adult CNS. J. Neurosci. 32, 12528–12542. doi: 10.1523/JNEUROSCI.1069-12.2012
Kok, E. H., Luoto, T., Haikonen, S., Goebeler, S., Haapasalo, H., and Karhunen, P. J. (2011). CLU, CR1 and PICALM genes associate with Alzheimer’s-related senile plaques. Alzheimer’s Res. Therapy 3:12. doi: 10.1186/alzrt71
Lane, C. A., Hardy, J., and Schott, J. M. (2018). Alzheimer’s disease. Eur. J. Neurol. 25, 59–70. doi: 10.1111/ene.13439
Law, C. W., Chen, Y., Shi, W., and Smyth, G. K. (2014). voom: precision weights unlock linear model analysis tools for RNA-seq read counts. Genome Biol. 15:R29. doi: 10.1186/gb-2014-15-2-r29
Long, J. M., and Holtzman, D. M. (2019). Alzheimer disease: an update on pathobiology and treatment strategies. Cell 179, 312–339. doi: 10.1016/j.cell.2019.09.001
Magistri, M., Velmeshev, D., Makhmutova, M., and Faghihi, M. A. (2015). Transcriptomics profiling of Alzheimer’s disease reveal neurovascular defects, altered Amyloid-β homeostasis, and deregulated expression of long noncoding RNAs. J. Alzheimers Dis. 48, 647–665. doi: 10.3233/JAD-150398
Mahajan, G. J., Vallender, E. J., Garrett, M. R., Challagundla, L., Overholser, J. C., Jurjus, G., et al. (2018). Altered neuro-inflammatory gene expression in hippocampus in major depressive disorder. Prog. Neuro-Psychopharmacol. Biol. Psychiatry 82, 177–186. doi: 10.1016/j.pnpbp.2017.11.017
Mahley, R. W., Weisgraber, K. H., and Huang, Y. (2006). Apolipoprotein E4: a causative factor and therapeutic target in neuropathology, including Alzheimer’s disease. Proc. Natl. Acad. Sci. U S A. 103, 5644–5651. doi: 10.1073/pnas.0600549103
Maresova, P., Hruska, J., Klimova, B., Barakovic, S., and Krejcar, O. (2020). Activities of daily living and associated costs in the most widespread neurodegenerative diseases: a systematic review. Clin. Interv. Aging 15, 1841–1862. doi: 10.2147/CIA.S264688
Mathys, H., Davila-Velderrain, J., Peng, Z., Gao, F., Mohammadi, S., Young, J. Z., et al. (2019). Single-cell transcriptomic analysis of Alzheimer’s disease. Nature 570, 332–337. doi: 10.1038/s41586-019-1195-1192
Mazurek, M. F., and Beal, F. M. (1991). Cholecystokinin and somatostatin in Alzheimer’s disease postmortem cerebral cortex. Neurology 41, 716–719. doi: 10.1212/WNL.41.5.716
McKenzie, A. T., Wang, M., Hauberg, M. E., Fullard, J. F., Kozlenkov, A., Keenan, A., et al. (2018). Brain cell type specific gene expression and co-expression network architectures. Sci. Rep. 8:8868. doi: 10.1038/s41598-018-27293-27295
Mirra, S. S., Heyman, A., McKeel, D., Sumi, S. M., Crain, B. J., Brownlee, L. M., et al. (1991). The Consortium to Establish a Registry for Alzheimer’s Disease (CERAD). Part II. standardization of the neuropathologic assessment of Alzheimer’s disease. Neurology 41, 479–486. doi: 10.1212/wnl.41.4.479
Mitchell, R. M., Janssen, M. J., Karavanova, I., Vullhorst, D., Furth, K., Makusky, A., et al. (2013). ErbB4 reduces synaptic GABAA currents independent of its receptor tyrosine kinase activity. Proc. Natl. Acad. Sci. U S A. 110, 19603–19608. doi: 10.1073/pnas.1312791110
Montagne, A., Nation, D. A., Sagare, A. P., Barisano, G., Sweeney, M. D., Chakhoyan, A., et al. (2020). APOE4 leads to blood-brain barrier dysfunction predicting cognitive decline. Nature 581, 71–76. doi: 10.1038/s41586-020-2247-2243
Mouton-Liger, F., Dumurgier, J., Cognat, E., Hourregue, C., Zetterberg, H., Vanderstichele, H., et al. (2020). CSF levels of the BACE1 substrate NRG1 correlate with cognition in Alzheimer’s disease. Alzheimer’s Res. Therapy 12:88. doi: 10.1186/s13195-020-00655-w
Mozhui, K., Wang, X., Chen, J., Mulligan, M. K., Li, Z., Ingles, J., et al. (2011). Genetic regulation of Nrnx1 expression: an integrative cross-species analysis of schizophrenia candidate genes. Transl. Psychiatry 1:e25. doi: 10.1038/tp.2011.24
Neff, R. A., Wang, M., Vatansever, S., Guo, L., Ming, C., Wang, Q., et al. (2021). Molecular subtyping of Alzheimer’s disease using RNA sequencing data reveals novel mechanisms and targets. Sci. Adv. 7:eabb5398. doi: 10.1126/sciadv.abb5398
Nishikimi, A., Kukimoto-Niino, M., Yokoyama, S., and Fukui, Y. (2013). Immune regulatory functions of DOCK family proteins in health and disease. Exp. Cell Res. 319, 2343–2349. doi: 10.1016/j.yexcr.2013.07.024
Ousman, S. S., Tomooka, B. H., van Noort, J. M., Wawrousek, E. F., O’Conner, K., Hafler, D. A., et al. (2007). Protective and therapeutic role for αB-crystallin in autoimmune demyelination. Nature 448, 474–479. doi: 10.1038/nature05935
Patel, H., Dobson, R. J. B., and Newhouse, S. J. (2019). A meta-analysis of Alzheimer’s disease brain transcriptomic data. J. Alzheimer’s Dis. 68, 1635–1656. doi: 10.3233/JAD-181085
Philip, D., Buch, A., Moorthy, D., Scott, T. M., Parnell, L. D., Lai, C.-Q., et al. (2015). Dihydrofolate reductase 19-bp deletion polymorphism modifies the association of folate status with memory in a cross-sectional multi-ethnic study of adults123. Am. J. Clin. Nutr. 102, 1279–1288. doi: 10.3945/ajcn.115.111054
Phipson, B., Lee, S., Majewski, I. J., Alexander, W. S., and Smyth, G. K. (2016). Robust hyperparameter estimation protects against hypervariable genes and improves power to detect differential expression. Ann. Appl. Stat. 10, 946–963. doi: 10.1214/16-AOAS920
Plagman, A., Hoscheidt, S., McLimans, K. E., Klinedinst, B., Pappas, C., Anantharam, V., et al. (2019). Cholecystokinin and Alzheimer’s disease: a biomarker of metabolic function, neural integrity, and cognitive performance. Neurobiol. Aging 76, 201–207. doi: 10.1016/j.neurobiolaging.2019.01.002
Raudvere, U., Kolberg, L., Kuzmin, I., Arak, T., Adler, P., Peterson, H., et al. (2019). g:Profiler: a web server for functional enrichment analysis and conversions of gene lists (2019 update). Nucleic Acids Res. 47, W191–W198. doi: 10.1093/nar/gkz369
Reimand, J., Isserlin, R., Voisin, V., Kucera, M., Tannus-Lopes, C., Rostamianfar, A., et al. (2019). Pathway enrichment analysis and visualization of omics data using g:Profiler, GSEA, Cytoscape and EnrichmentMap. Nat. Protocols 14, 482–517. doi: 10.1038/s41596-018-0103-109
Ritchie, M. E., Phipson, B., Wu, D., Hu, Y., Law, C. W., Shi, W., et al. (2015). limma powers differential expression analyses for RNA-sequencing and microarray studies. Nucleic Acids Res. 43:e47. doi: 10.1093/nar/gkv007
Roses, M. D., and Allen, D. (1996). Apolipoprotein e alleles as risk factors in Alzheimer’s disease. Annu. Rev. Med. 47, 387–400. doi: 10.1146/annurev.med.47.1.387
Satoh, J., Tabunoki, H., Yamamura, T., Arima, K., and Konno, H. (2007). TROY and LINGO-1 expression in astrocytes and macrophages/microglia in multiple sclerosis lesions. Neuropathol. Appl. Neurobiol. 33, 99–107. doi: 10.1111/j.1365-2990.2006.00787.x
Schmechel, D. E., Saunders, A. M., Strittmatter, W. J., Crain, B. J., Hulette, C. M., Joo, S. H., et al. (1993). Increased amyloid beta-peptide deposition in cerebral cortex as a consequence of apolipoprotein E genotype in late-onset Alzheimer disease. Proc. Natl. Acad. Sci. U S A. 90, 9649–9653. doi: 10.1073/pnas.90.20.9649
Shi, Y., Yamada, K., Liddelow, S. A., Smith, S. T., Zhao, L., Luo, W., et al. (2017). ApoE4 markedly exacerbates tau-mediated neurodegeneration in a mouse model of tauopathy. Nature 549, 523–527. doi: 10.1038/nature24016
Shin, J.-G., Kim, H. J., Park, B. L., Bae, J. S., Kim, L. H., Cheong, H. S., et al. (2013). Putative association of GPC5 polymorphism with the risk of inflammatory demyelinating diseases. J. Neurol. Sci. 335, 82–88. doi: 10.1016/j.jns.2013.08.031
Stuart, T., Butler, A., Hoffman, P., Hafemeister, C., Papalexi, E., Mauck, W. M., et al. (2019). Comprehensive integration of single-cell data. Cell 177, 1888–1902.e21. doi: 10.1016/j.cell.2019.05.031.
Thorsell, A., Bjerke, M., Gobom, J., Brunhage, E., Vanmechelen, E., Andreasen, N., et al. (2010). Neurogranin in cerebrospinal fluid as a marker of synaptic degeneration in Alzheimer’s disease. Brain Res. 1362, 13–22. doi: 10.1016/j.brainres.2010.09.073
Wan, Y.-W., Al-Ouran, R., Mangleburg, C. G., Perumal, T. M., Lee, T. V., Allison, K., et al. (2020). Meta-Analysis of the Alzheimer’s disease human brain transcriptome and functional dissection in mouse models. Cell Rep. 32:107908. doi: 10.1016/j.celrep.2020.107908
Wang, M., Roussos, P., McKenzie, A., Zhou, X., Kajiwara, Y., Brennand, K. J., et al. (2016). Integrative network analysis of nineteen brain regions identifies molecular signatures and networks underlying selective regional vulnerability to Alzheimer’s disease. Genome Med. 8:104. doi: 10.1186/s13073-016-0355-353
Wen, H., Liu, L., Zhan, L., Liang, D., Li, L., Liu, D., et al. (2018). Neuroglobin mediates neuroprotection of hypoxic postconditioning against transient global cerebral ischemia in rats through preserving the activity of Na + /K + ATPases. Cell Death Dis.ase 9, 1–18. doi: 10.1038/s41419-018-0656-650
Yu, J.-T., Tan, L., and Hardy, J. (2014). Apolipoprotein E in Alzheimer’s disease: an update. Annu. Rev. Neurosci. 37, 79–100. doi: 10.1146/annurev-neuro-071013-14300
Zhao, N., Liu, C.-C., Van Ingelgom, A. J., Martens, Y. A., Linares, C., Knight, J. A., et al. (2017). Apolipoprotein E4 impairs neuronal insulin signaling by trapping insulin receptor in the endosomes. Neuron 96, 115–129.e5. doi: 10.1016/j.neuron.2017.09.003.
Zhou, Y., Zhang, X., and Klibanski, A. (2012). MEG3 noncoding RNA: a tumor suppressor. J. Mol. Endocrinol. 48, R45–R53. doi: 10.1530/JME-12-18
Keywords: Alzheimer’s disease, APOE, single-cell, RNA-sequencing, differential expression, network enrichment
Citation: Belonwu SA, Li Y, Bunis DG, Rao AA, Solsberg CW, Oskotsky T, Taubes AL, Grone B, Zalocusky KA, Fragiadakis GK, Huang Y and Sirota M (2022) Bioinformatics Analysis of Publicly Available Single-Nuclei Transcriptomics Alzheimer’s Disease Datasets Reveals APOE Genotype-Specific Changes Across Cell Types in Two Brain Regions. Front. Aging Neurosci. 14:749991. doi: 10.3389/fnagi.2022.749991
Received: 30 July 2021; Accepted: 14 March 2022;
Published: 27 April 2022.
Edited by:
Ligen Shi, Zhejiang University, ChinaReviewed by:
Nobuyuki Kimura, National Center for Geriatrics and Gerontology (NCGG), JapanMarie-Claude Potier, Centre National de la Recherche Scientifique (CNRS), France
Copyright © 2022 Belonwu, Li, Bunis, Rao, Solsberg, Oskotsky, Taubes, Grone, Zalocusky, Fragiadakis, Huang and Sirota. This is an open-access article distributed under the terms of the Creative Commons Attribution License (CC BY). The use, distribution or reproduction in other forums is permitted, provided the original author(s) and the copyright owner(s) are credited and that the original publication in this journal is cited, in accordance with accepted academic practice. No use, distribution or reproduction is permitted which does not comply with these terms.
*Correspondence: Marina Sirota, bWFyaW5hLnNpcm90YUB1Y3NmLmVkdQ==