 Rouven Kenville
 Tom Maudrich
 Daniel Carius
 Patrick Ragert
- 1Faculty of Sport Science, Institute for General Kinesiology and Exercise Science, University of Leipzig, Leipzig, Germany
- 2Department of Neurology, Max Planck Institute for Human Cognitive and Brain Sciences, Leipzig, Germany
Functional near-infrared spectroscopy (fNIRS) serves as a promising tool to examine hemodynamic response alterations in a sports-scientific context. The present study aimed to investigate how brain activity within the human motor system changes its processing in dependency of different barbell load conditions while executing a barbell squat (BS). Additionally, we used different fNIRS probe configurations to identify and subsequently eliminate potential exercise induced systemic confounders such as increases in extracerebral blood flow. Ten healthy, male participants were enrolled in a crossover design. Participants performed a BS task with random barbell load levels (0% 1RM (1 repetition maximum), 20% 1RM and 40% 1RM for a BS) during fNIRS recordings. Initially, we observed global hemodynamic response alterations within and outside the human motor system. However, short distance channel regression of fNIRS data revealed a focalized hemodynamic response alteration within bilateral superior parietal lobe (SPL) for oxygenated hemoglobin (HbO2) and not for deoxygenated hemoglobin (HHb) when comparing different load levels. These findings indicate that the previously observed load/force-brain relationship for simple and isolated movements is also present in complex multi-joint movements such as the BS. Altogether, our results show the feasibility of fNIRS to investigate brain processing in a sports-related context. We suggest for future studies to incorporate short distance channel regression of fNIRS data to reduce the likelihood of false-positive hemodynamic response alterations during complex whole movements.
Introduction
Recent animal and human studies have provided compelling evidence, that the brain modulates its activity as a function of applied load. In animals, a pioneer study, conducted by Evarts (1968) showed that the brain reorganizes itself when exposed to external force requirements. These results applied to isolated movements and were later supplemented for more complex motion sequences (Georgopoulos et al., 1982).
Similar findings were described in human studies using functional magnetic resonance imaging (fMRI), positron emission tomography (PET) and electroencephalography (EEG). For example, Thickbroom et al. (1998) could demonstrate by means of fMRI that an increase in applied force during a finger flexion task is accompanied by a spread of activation within the contralateral hand area of M1. Further, a much higher activity in contralateral sensory and motor areas of the hand was observed during a “power grip” task (Ehrsson et al., 2000). A positive linear relationship could also be observed between the applied force and the activity in the contralateral primary motor cortex (M1) and primary somatosensory cortex (SSC)(S1) during a hand grip task (Kuhtz-Buschbeck et al., 2008). Accordingly, it could be shown that, for the flexion of forearm and the extension of finger muscles, force and neural activity in the contralateral M1 were proportional to each other, so that the neural activity was amplified with increasing strength (Dai et al., 2001). Additionally, a high correlation was shown for the applied force during the contraction of the index finger and the activity in several areas of the cortex (van Duinen et al., 2008). Further, Ward and Frackowiak (2003) found a high correlation between the height of the blood oxygen level dependent (BOLD) signal (contralateral M1 and S1) and the force applied during a hand grip task. These results were later confirmed by subsequent fMRI studies (Talelli et al., 2008; Ward et al., 2008; Noble et al., 2011). Using PET, Dettmers et al. (1995) observed a logarithmic relationship between power stages during pressing of a Morse key and regional cerebral blood flow changes. Here, M1 showed the strongest correlation between blood flow and applied force. On the other hand, differences in neural activity between a “precision grip” (compression of the thumb and index finger) and a “power grip” (clenching of the fist) were assessed by Takasawa et al. (2003), who found no significant differences in brain activity between “precision grip” and “power grip”.
Similar findings regarding the relation between applied load and associated brain processing were also shown using EEG recordings in humans. For example, during a pinch force task an inverse-linear correlation was seen between the alpha-band activity over the contralateral sensorimotor cortex (SMC) and respective force levels. Exclusively in the gamma-band, increased activities were recorded at the strongest contractions, which was attributed to increased communication of several cortical networks (Mima et al., 1999). Furthermore, recordings of movement related cortical potentials (MRCP) could show that there was a strong association between MRCP amplitudes and respective load/force levels (Siemionow et al., 2000; Slobounov et al., 2002; do Nascimento et al., 2005).
One major drawback of the aforementioned studies is that so far only isolated movements were investigated. Hence, it still remains elusive whether or not a similar load force-brain relationship can also be observed for complex multi-joint whole body movements. Since fMRI and PET are limited to stationary use and EEG is potentially confounded by motion artifacts, such multi-joint whole body movements can obviously not be sufficiently investigated. One potential non-invasive alternative for mobile recordings is functional near-infrared spectroscopy (fNIRS). fNIRS determines site-specific concentration changes of oxygenated (HbO2) and deoxygenated (HHb) hemoglobin in analogy to fMRI. Hence, fNIRS is an indirect measure of neural activity by investigating changes in the oxygenation level of the blood (Obrig et al., 1996).
Using fNIRS, it could be shown that brain activity during a finger tapping task is modulated in dependency of the tapping frequency (Obrig et al., 1996). Furthermore, an increased neural activity as a function of grip intensity was described by Bhambhani et al. (2006). Additionally, rises in exerted strength during a handgrip task seem to be accompanied by an increase in neural activity in the ipsilateral premotor cortex (PMC) (Shibuya et al., 2008). Further studies could show that neural activity also increases in primary sensorimotor areas (SM1) and prefrontal cortex (PFC) in response to increased force levels during an unimanual handgrip task (Derosière et al., 2014). Moreover, neural activity in M1 seems to be correlated with the respective force applied during a hand grip task (Derosiere and Perrey, 2012). Finally, significant differences in the activation level of the contralateral M1 were observed in dependency of applied force during unilateral finger flexion (Shibuya et al., 2014).
In accordance with previous non-invasive brain imaging studies, fNIRS has been exclusively used to investigate simple and isolated movements regarding the load/force brain relationship. However, some fNIRS feasibility studies provided compelling evidence that this imaging technique is capable of providing results in complex movement patterns such as walking (Suzuki et al., 2004) or cycling (Shibuya et al., 2004). Therefore, its application is potentially appropriate concerning our fundamental question dealing with investigating the load/force brain relationship in complex whole body movements.
However, previous studies indicated that fNIRS brain recordings especially during complex movement patterns might be confounded by certain systemic variables such as the cardiac output volume (Ide et al., 1998; Giller et al., 2000; van Lieshout et al., 2001) and blood pressure (Harper, 1966; Edwards et al., 2002). Both parameters seem to have a considerable influence on the cerebral blood flow rate, which in turn is closely related to the measured fNIRS signal (Madsen et al., 1995; Smielewski et al., 1995). Alterations in blood pressure and/or cardiac output volume during task performance might influence and therefore confound the fNIRS signal. Additionally, two distinct vascular supply systems, the cerebral vascular and the subcutaneous vascular system of the scalp are located within the penetration range of the near infrared light. The transmitted light can thus detect chromophore concentrations of both systems (Tachtsidis and Scholkmann, 2016), which is potentially unfavorable. Studies showed that chromophore progressions differ between both systems, when monitoring their behavior during exercise (Auger et al., 2016). However, recent methodological approaches have been developed to reduce such potential confounds during fNIRS recordings. For example, it has been proposed that reducing the penetration depth of the near-infrared light might potentially be effective in differentiating between fNIRS signals that are of cerebral and/or extracerebral origin. In fact, Yücel et al. (2015) demonstrated the effectiveness of a short-separation regression in that context.
Based on the aforementioned findings and limitations with respect to fNIRS, the present study aimed to investigate how brain activity within the human motor system changes its processing in dependency of different load conditions while executing a barbell squat (BS). Furthermore, we investigated different fNIRS configurations to expose global effects and applied a short distance channel regression to eliminate potential confounders. More specifically, we hypothesized, in accordance to previous findings using simple and isolated movements of the upper limbs, that neural processing in the human motor system reorganizes as a function of the applied load during a complex whole body movement. Additionally, we expected a more localized brain activity in movement-related brain regions such as M1 area when fNIRS recordings were paired with short distance channel regression of the fNIRS signal.
Materials and Methods
Participants
A total number of 10 healthy, male participants (age: 25.7 ± 2.2 years (mean ± SD)) were enrolled in the present study. The study was approved by the local ethics committee of the Medical Faculty at the University of Leipzig (ref.-nr. 410-15-16112015) and all participants gave their written informed consent to participate in the experiments in accordance with the Declaration of Helsinki. Prior to participation, each participant was instructed, in terms of content and about the procedure. Participants were excluded from the present study in case the following exclusion criteria were present: neurological/ psychological disease, intake of central acting drugs, caffeine or alcohol intake 24 h before the experiment, acute, chronic and/or inadequately regenerated pathologies of the knee joint, the ankle joints and/or the spine to minimize the risk of injury. The experiment consisted of a randomized cross-over design where each participant underwent three experimental sessions, separated by at least 3 days. The only difference between sessions was a different fNIRS channel arrangement that was used to capture different brain regions during task performance (for details see below). All participants were familiar with and/or experienced in the task (BS).
Behavioral Task (Barbell Squat)
At the beginning of each experimental session, a dynamic maximum strength test was conducted using the BS with additional load (one repetition maximum (1RM)). For that purpose, participants had to perform the BS with a stepwise increase of additional loads. After each successful BS, the load was increased individually until participants could complete no more than three correct BS movements. The respective absolute maximum force value, i.e., the load with which the subject can exactly complete a repetition (rep) (kg), was calculated from this value. The calculation was made using the following “Epley equation”: 1RM = Load × (1 + (0.033 × rep)) (Epley, 1985).
Subsequently, participants had to perform the BS under three different experimental conditions (L0%, L20%, L40%) representing the execution of BS with 0% of 1RM (L0%), BS with 20% 1RM (L20%) and BS with 40% 1RM (L40%). The order of the conditions was randomized across participants. During each condition a total number of five BS was performed within one activity block. The movement during BS was subdivided into three chronologically standardized phases: (A) eccentric, (B) concentric phase and (C) repetition pause (see Figure 1). The duration of each phase was 2 s giving a total block length of 30 s. A total number of five blocks per condition was performed resulting in 15 blocks per session. Between each block there was a rest period of 30 s which lead to a total recording time of 15 min per session. The total duration of each session was approximately 25 min.
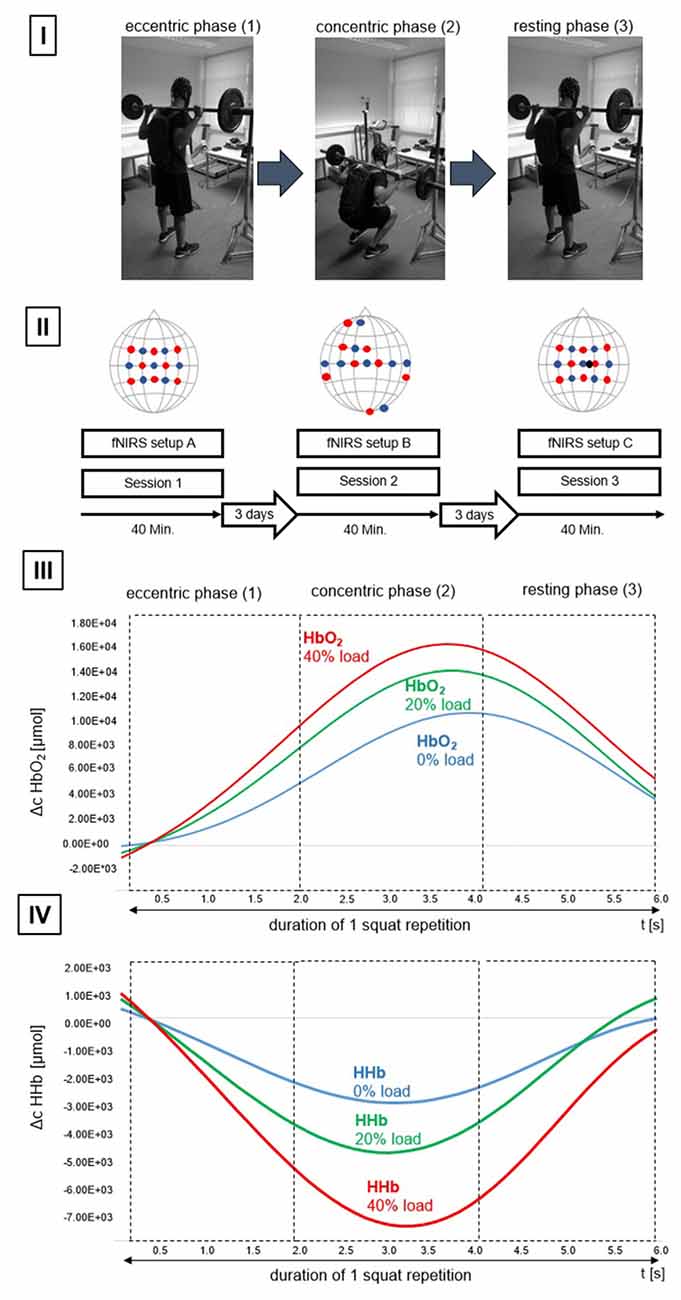
Figure 1. Study design. (I) Subdivision of the activation phase (barbell squat (BS)). (1) Initiation of the eccentric phase, (2) end of the eccentric phase and subsequent initiation of the concentric phase, (3) end of the concentric phase and concurrently the initial position of the resting phase (R). (II) Overview of the configurations used per session. Illustrated are configurations (functional near-infrared spectroscopy (fNIRS) setup (A), (B) and (C)). Detectors are shown as blue dots, transmitters are shown as red dots. The short—distance detector is shown as a black dot. Also illustrated are time of one session (40 min), as well as the time between individual sessions (3 days). (III) Progression of oxygenated hemoglobin (HbO2) for one repetition. Data is based on mean average progression across all participants. Chromophore progression is illustrated for L0% (blue line), L20% (green line) and L40% (red line) and divided to showcase the different movement phases. (IV) Progression of deoxygenated Hemoglobin (HHb) for one repetition. Data is based on mean average progression across all participants. Chromophore progression is illustrated for L0% (blue line), L20% (green line) and L40% (red line) and divided to showcase the different movement phases. Please note that the participant displayed in (I) gave written informed consent to use the pictures illustrating the study design.
To ensure a standardized movement amplitude of 95° in the knee joint during BS, a gyroscope was attached to the distal quarter of the vastus lateralis muscle of each subject and provided an acoustic feedback as soon as the desired angle was reached. The default position during BS was an external rotation of the shoulder joint (articulatio humeri), which was paired with flexed elbows and slightly adducted shoulder blades. In this position, the hands were at the level of the larynx, 7–8 cm to the left or to the right of the head, respectively, so that the dumbbell bar rested on the trapezius muscle and the open palms. To ensure a timely accurate BS, the respective phase was displayed on a PC screen.
Neuronavigation
To transform topographic maps from the recorded hemodynamic responses, the fNIRS probe positions (x, y, z space) were registered to Montreal Neurological Institute (MNI) space. This was done via the neuronavigation device: Brainsight™ (Version 2, Rogue Research, Montreal, QC, Canada). Subsequently, the respective MNI coordinates for each fNIRS probe were fed into a probabilistic atlas to allow the assignment of the hemodynamic response alterations during BS with different loads to a specific brain region. For that purpose, the Juelich histological (cyto- and myelo-architectonic) atlas was used within the program FSL (FMRIB Software Library v5.0, Created by the Analysis Group, FMRIB, Oxford, UK; for reference see e.g., Eickhoff et al., 2005, 2006, 2007).
NIRS—Recording and Analysis
Hemodynamic response alterations were assessed using the portable fNIRS system NIRSport™ (NIRx Medical Technologies, New York, NY, USA). For that purpose, different fNIRS cap/probe arrangements were utilized comprising of an 8 “source” (transmitter) × 8 “receiver” (detector) probe arrangement. The center of the cap was placed according to the international 10-20 system over the vertex (Cz) of each participant. Cz was determined over the intersection of the courses: nasion-inion and left preauricular point-right preauricular point according to Jurcak et al. (2007). In general, three distinct fNIRS cap configurations, one for each session, were used in the present study. The aim of using three distinct cap configurations was motivated by the fact that we intended to disentangle hemodynamic response alterations as a function of the applied load, (A) specifically within the bilateral sensorimotor system, including cortical motor regions such as primary motor cortex (M1), PMC, supplementary motor area (SMA), inferior parietal lobe (IPL) and superior parietal lobe (SPL) and (B) in brain areas that are not predominantly task related (such as auditory, frontal and visual areas, see Figure 1(II)). Respective brain regions were targeted by a 10-20 system transfer method, introduced by Lancaster et al. (2000).
Additionally, we used another fNIRS cap configuration (C) to eliminate potential fNIRS confounders, such as extracerebral blood flow alterations. For that purpose, we used an additional short-distance probe within configuration (A) with an inter-optode distance of 1 cm, as opposed to the inter-optode distance for all other channels of our configurations (3 cm). For a detailed overview of the respective fNIRS probe setups please see Figure 1(II). The order of the sessions was counterbalanced across participants.
During fNIRS recordings, we used a sampling rate of 7.81 Hz. Spectroscopically, the NIRSport™ operated via a so-called “continuous wave” method. This means that the sources emit light at constant frequency and intensity (Scholkmann et al., 2014).
After each session, hemodynamic response alterations were analyzed (post-processing steps) using an NIRS-SPM (statistical parametric mapping) tool (Ye et al., 2009), which was included in the analysis software nirsLAB (v2014, NIRx Medical Technologies, New York, NY, USA). Initially, the length of task (BS) onsets and rest periods (R, no BS) were defined (each block had trial length of 30 s). Signal-to-noise performance of individual channels was evaluated via variation coefficients (CV) which is a common method for multi-channel fNIRS measurements (Schmitz et al., 2005; Schneider et al., 2011; Piper et al., 2014). A CV is mathematically defined as 100 times the standard deviation divided by the mean value, where the standard deviation and mean are computed from all the raw-data values in the measurement time series. fNIRS channels were removed when respective channels exceeded a variation coefficient of 15% (Piper et al., 2014). Subsequently data was subjected to a baseline correction (10 s before onset) and then filtered (band pass filter: low cutoff frequency = 0.01 Hz high cutoff frequency = 0.2 Hz) to attenuate high-frequency noise and cardiovascular artifacts (Huppert et al., 2009).
Conditions (BS during 0% 1RM (no load, L0%), 20% 1RM (L20%) and 40% 1RM (L40%) were modeled using a “boxcar” function folded with the canonic hemodynamic response function according to Helmich et al. (2013). Data were then transformed into a General Linear Model (GLM) estimation to obtain beta values, which were indicators of the correlation between the obtained signal and the model-immanent regressors, the conditions and the timely progression of the distinct chromophores HbO2 and HHb.
Apart from the aforementioned post-processing steps for fNIRS cap configurations (A) and (B), a fourth condition, corresponding to the averaged chromophore progression over the individual short-distance channels, was included in the GLM for the session which included the short distance channel (fNIRS configuration (C)). In general, post-processing steps were comparable across fNIRS configurations except that for (C), the individually averaged short distance channel profile was extracted for each participant and subsequently integrated into the GLM as a regressor. On a group level, these individual models were grouped together and used for final group statistics.
Data were subsequently analyzed using the software package SPSS Statistics 22 (IBM, Armonk, NY, USA). Initially, normal distribution of data was evaluated by Shapirro-Wilk-Test. All data were normally distributed. Hence, only parametric tests were used for subsequent statistical analyses. To assess statistical differences in hemodynamic response alterations among the 0%, 20% and 40% 1RM barbell load levels, a repeated measures ANOVA was used to test for significant effects of force level (0%, 20% and 40% barbell load) on beta-values of HbO2 and HHb. If necessary, data were corrected for sphericity using Greenhouse-Geisser correction. Partial eta-squared () for ANOVA’s are provided as measures of effect size and used to aid in the interpretation of inferential statistics.
When appropriate, a post hoc analysis with paired t-tests was used to detect significant differences between load levels for each channel. Furthermore, paired t-tests were performed for comparing load levels and baseline values (BL) in respective channels for each group. Bonferroni corrected p-values (configuration (A) p < 0.0023; configuration (B) p < 0.0038; configuration (C) p < 0.0023) were used as a threshold for significance. Visualization of hemodynamic response alterations was performed using the Brain Function Mapping Tool from Wang et al. (2016).
Results
The mean 1RM value during BS was 98 kg (±11.35 SD) and did not differ between sessions since 1RM values were identical within participants.
Hemodynamic Response Alterations within Sensorimotor Areas (fNIRS Configuration (A))
Repeated measures ANOVA revealed significant changes in HbO2 and HHb beta-values between all load levels for HbO2 (F(1.55,341.10) = 528.55, p < 0.0001, = 0.71) and HHb (F(1.47,322.01) = 107.63, p < 0.0001, = 0.33).
Post hoc analysis revealed significant hemodynamic response alterations for L20% vs. L0% in M1, right PMC, SMA, left IPL and right SPL for HbO2. No such effects could be observed for HHb. Comparing L40% vs. L0% revealed significant hemodynamic response alterations in all channels except channels 12, 18 and 22 for HbO2. For HHb, significant hemodynamic response alterations could be shown in left SSC and IPL when comparing L40% vs. L0%. Comparisons between L40% vs. L20% revealed significant hemodynamic response alterations in all channels except channels 4, 9, 12 and 18 for HbO2, while the comparison for HHb revealed no statistical differences (see Figures 2(I) and 3(I); for detailed statistics please see also Supplementary Table S1).
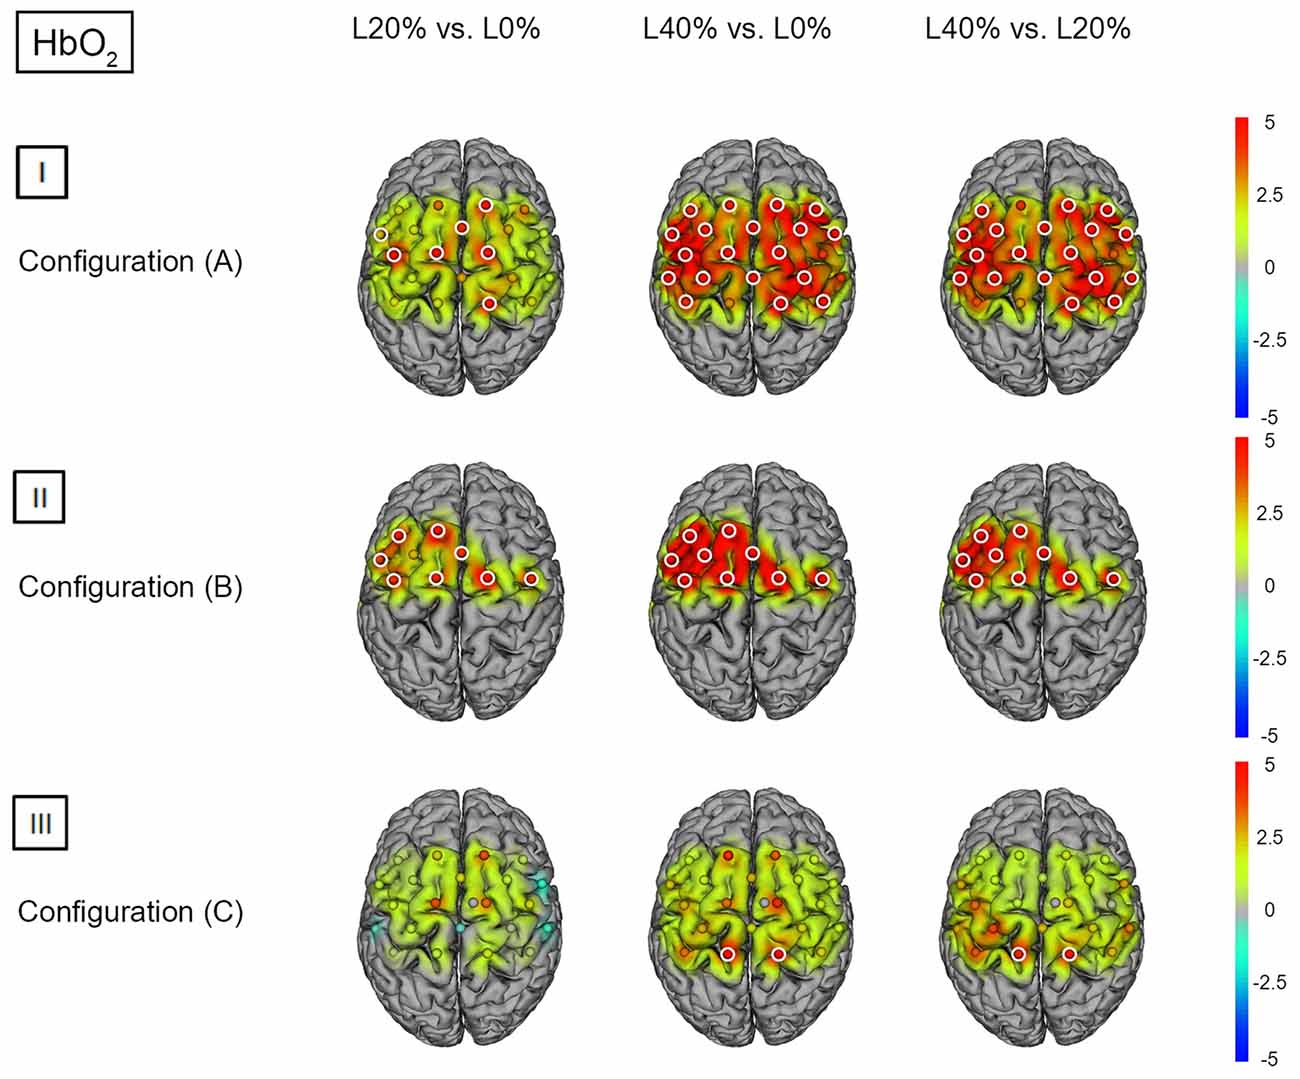
Figure 2. HbO2 t statistics for fNIRS configurations (A, B) and (C). Channels (centered between transmitters and detectors) are shown for each image. Decreases in HbO2 responses are illustrated in dark blue, increases in HbO2 responses are illustrated in dark red. The entire range is illustrated in the attached legend. Significant channels are marked with white circles. (I) Areas that are significantly more active for BS at L20% vs. L0%, L40% vs. L0% and L40% vs. L20% for configuration (A). All images are thresholded at p < 0.0023. (II) Areas that are significantly more active for BS at L20% vs. L0%, L40% vs. L0% and L40% vs. L20% for configuration (B). All images are thresholded at p < 0.0038. (III) Areas that are significantly more active for BS L20% vs. L0%, L40% vs. L0% and L40% vs. L20% for configuration (C). All images are thresholded at p < 0.0023.
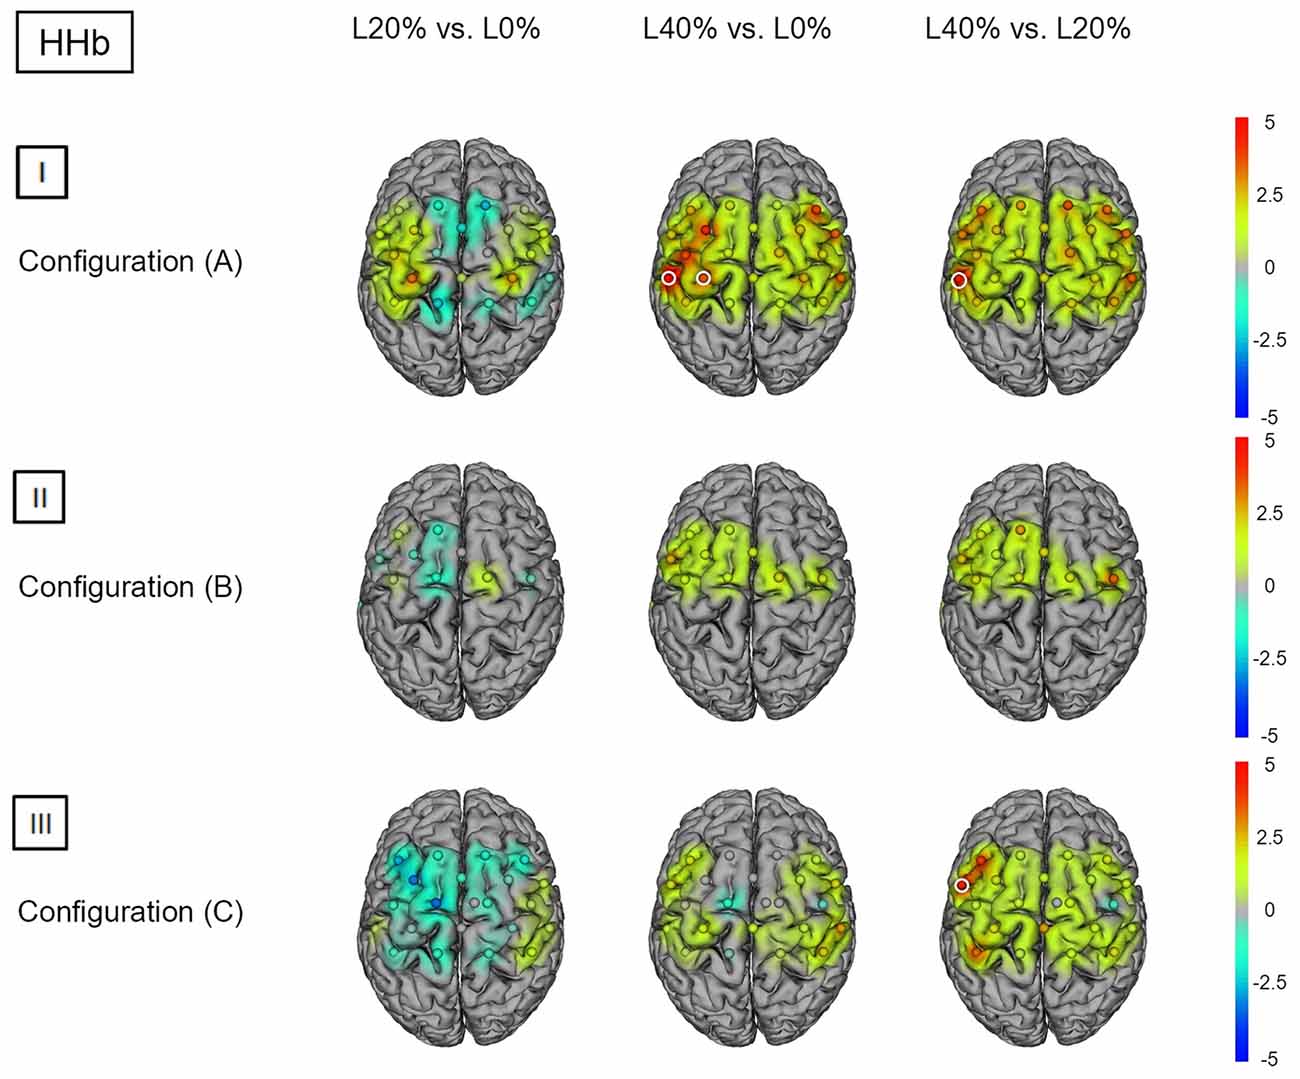
Figure 3. HHb t statistics for fNIRS configurations (A, B) and (C). Channels (centered between transmitters and detectors) are shown for each image. Decreases in HbO2 responses are illustrated in dark blue, increases in HbO2 responses are illustrated in dark red. The entire range is illustrated in the attached legend. Significant channels are marked with white circles. (I) Areas that are significantly more active for BS at L20% vs. L0%, L40% vs. L0% and L40% vs. L20% for configuration (A). All images are thresholded at p < 0.0023. (II) Areas that are significantly more active for BS at L20% vs. L0%, L40% vs. L0% and L40% vs. L20% for configuration (B). All images are thresholded at p < 0.0038. (III) Areas that are significantly more active for BS L20% vs. L0%, L40% vs. L0% and L40% vs. L20% for configuration (C). All images are thresholded at p < 0.0023.
Comparing BS during L0% vs. BL revealed significant hemodynamic response alterations for HbO2 in bilateral M1, SSC, SMA, SPL, left IPL and right PMC. When comparing BS during L20% and L40% vs. BL, a similar effect was observed for HbO2. For HHb we did not find significant differences (see Figures 4(I) and 5(I); for detailed statistics please see also Supplementary Table S4).
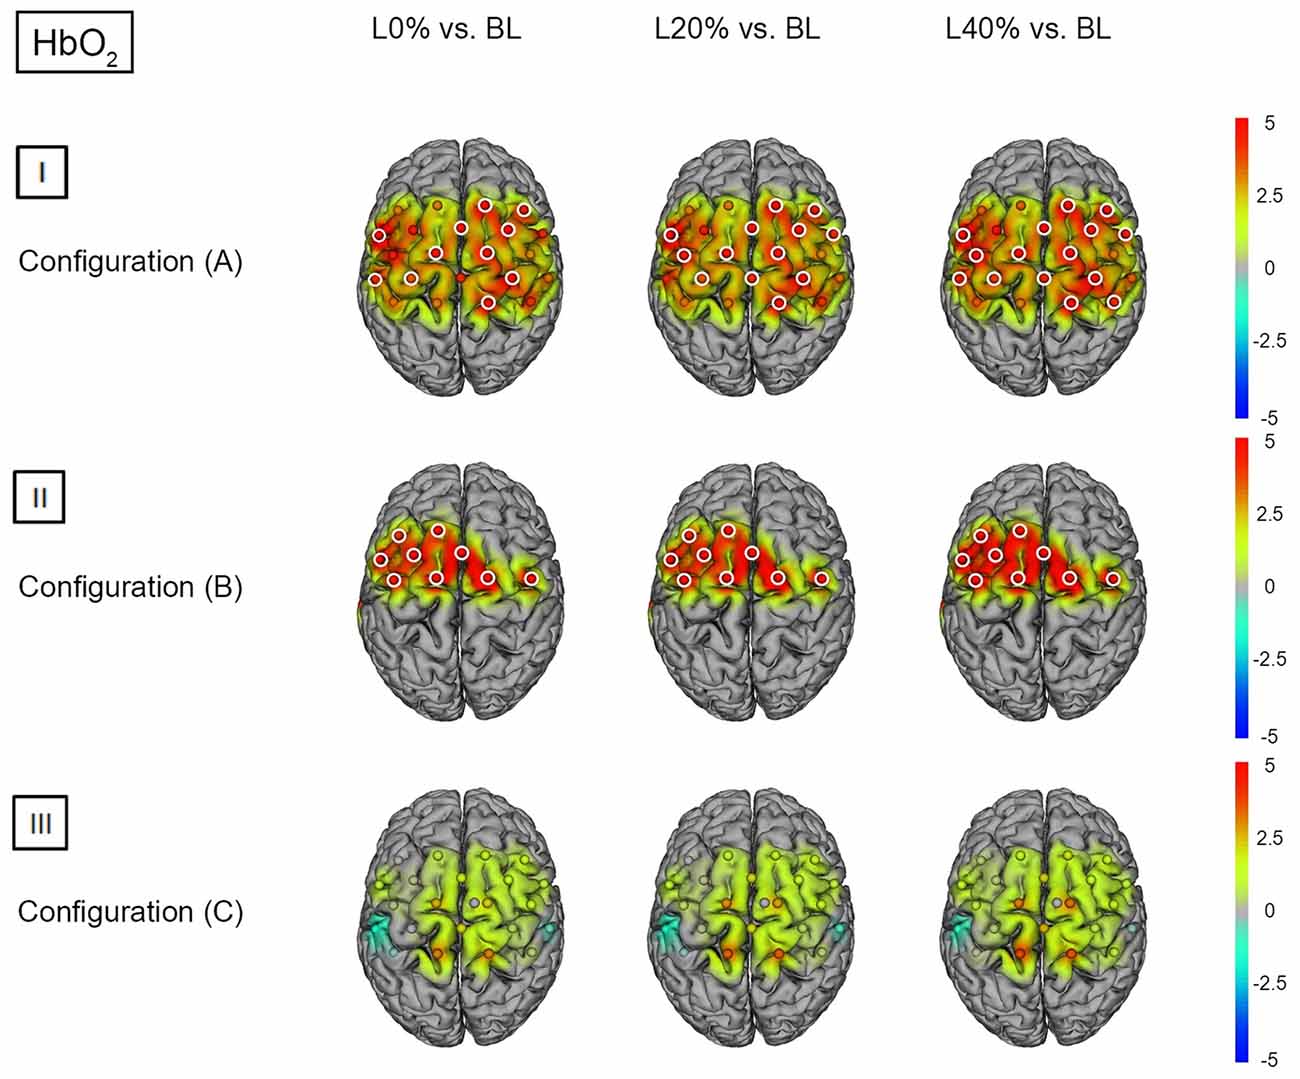
Figure 4. HbO2 t statistics for fNIRS configurations (A, B) and (C). Channels (centered between transmitters and detectors) are shown for each image. Decreases in HbO2 responses are illustrated in dark blue, increases in HbO2 responses are illustrated in dark red. The entire range is illustrated in the attached legend. Significant channels are marked with white circles. (I) Areas that are significantly more active for BS at L0% vs. baseline values (BL), L20% vs. BL and L40% vs. BL for configuration (A). All images are thresholded at p < 0.0023. (II) Areas that are significantly more active for BS at L0% vs. BL, L20% vs. BL and L40% vs. BL for configuration (B). All images are thresholded at p < 0.0038. (III) Areas that are significantly more active for BS at L0% vs. BL, L20% vs. BL and L40% vs. BL for configuration (C). All images are thresholded at p < 0.0023.
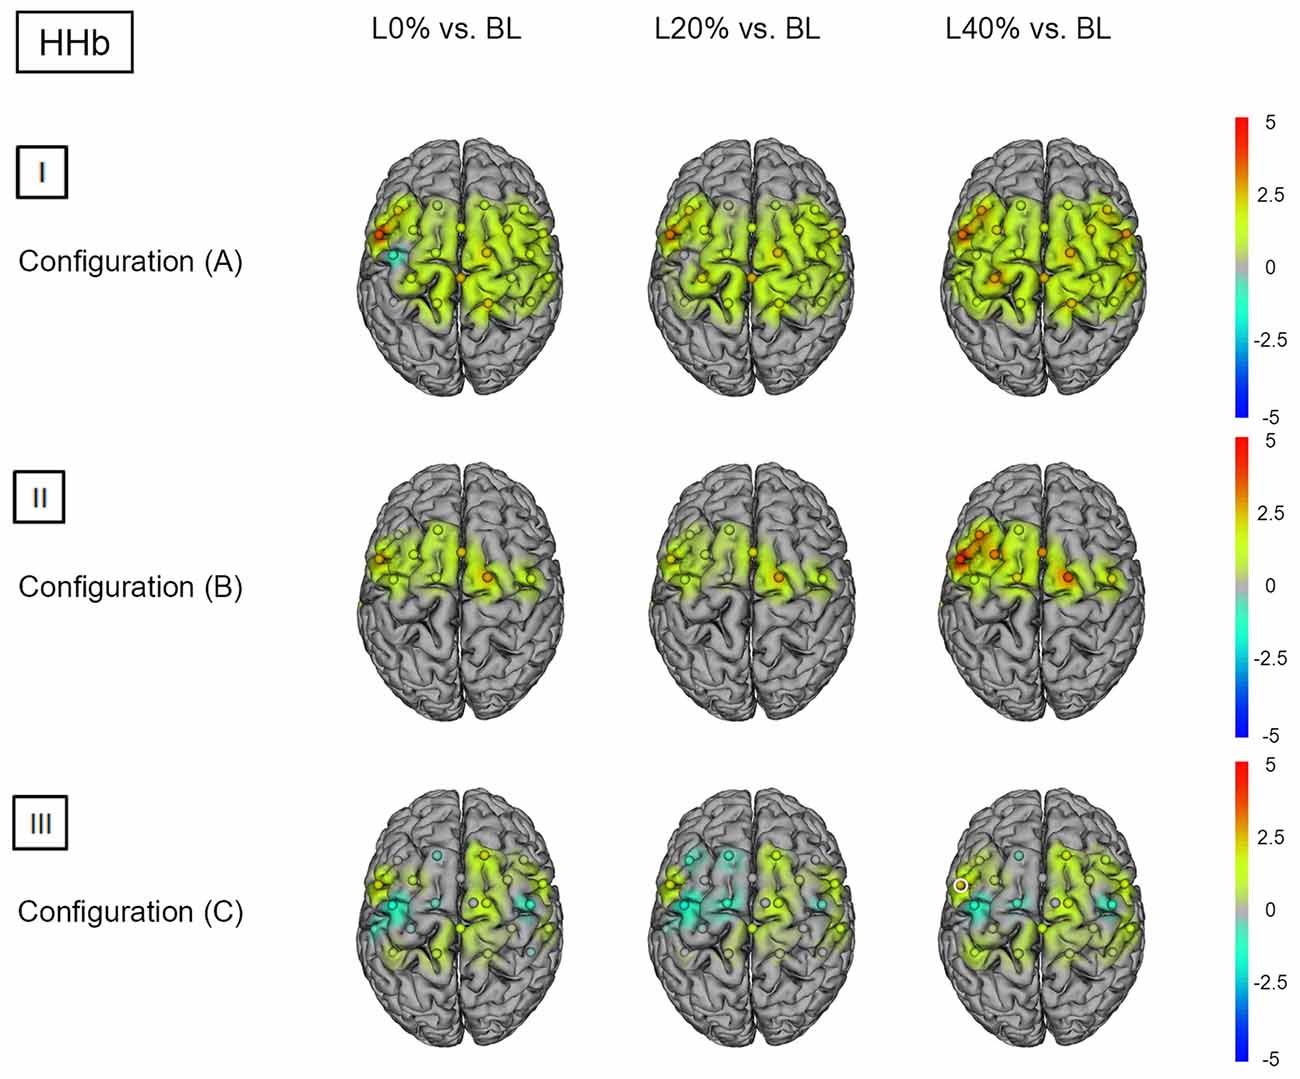
Figure 5. HHb t statistics for fNIRS configurations (A, B) and (C). Channels (centered between transmitters and detectors) are shown for each image. Decreases in HbO2 responses are illustrated in dark blue, increases in HbO2 responses are illustrated in dark red. The entire range is illustrated in the attached legend. Significant channels are marked with white circles. (I) Areas that are significantly more active for BS at L0% vs. BL, L20% vs. BL and L40% vs. BL for configuration (A). All images are thresholded at p < 0.0023. (II) Areas that are significantly more active for BS at L0% vs. BL, L20% vs. BL and L40% vs. BL for configuration (B). All images are thresholded at p < 0.0038. (III) Areas that are significantly more active for BS at L0% vs. BL, L20% vs. BL and L40% vs. BL for configuration (C). All images are thresholded at p < 0.0023.
Hemodynamic Response Alterations Outside of Sensorimotor Areas (fNIRS Configuration (B))
Repeated measures ANOVA revealed significant changes in HbO2 and HHb beta-values between all load levels for HbO2 (F(1.36,176.01) = 208.54, p < 0.0001, = 0.62) and HHb (F(1.69,217.56) = 14.64, p < 0.0001, = 0.10).
Post hoc analysis revealed significant hemodynamic response alterations for L20% vs. L0% in bilateral M1, IPL, SMA, and PMC for HbO2, while no such effect could be observed for HHb. Comparing L40% vs. L0% revealed comparable significant hemodynamic response alterations in all channels except channels 1, 12 and 13 for HbO2. For HHb, L40% vs. L0% showed no significant hemodynamic response alterations. Comparisons between L40% vs. L20% revealed significant hemodynamic response alterations in all channels except channels 1 and 13 for HbO2. The comparison for HHb revealed no significant effects (see Figures 2(II) and 3(II); for detailed statistics please see also Supplementary Table S2).
Comparing BS during L0%, L20% and L40% vs. BL revealed significant hemodynamic response alterations for HbO2 in all fNIRS channels except channels 1 and 13. No significant modulation could be observed for HHb (see Figures 4(II) and 5(II); for detailed statistics please see also Supplementary Table S5).
Hemodynamic Response Alterations within Sensorimotor Areas after Short Distance Channel Regression (fNIRS Configuration (C))
Repeated measures ANOVA revealed significant changes in HbO2 and HHb beta-values between all load levels for HbO2 (F(1.74,398.62) = 102.52, p < 0.0001, = 0.31) and HHb (F(2.00,452.98) = 19.59, p < 0.0001, = 0.08).
Post hoc analysis between barbell load levels during BS revealed no significant hemodynamic response alterations for L20% vs. L0% for either chromophore. Comparing L40% vs. L0% revealed significant hemodynamic response alterations in bilateral SPL for HbO2, while no significant effects could be observed for HHb. For HbO2, L40% vs. L20% also revealed significant hemodynamic response alterations in bilateral SPL. The same comparison for HHb revealed significant effects in left PMC (see Figures 2(III) and 3(III); for detailed statistics please see also Supplementary Table S3).
Comparing BS during L0%, L20% and L40% vs. BL showed no significant hemodynamic response alterations for HbO2. For HHb, only L40% vs. BL revealed a significant hemodynamic response alterations in left PMC (see Figures 4(III) and 5(III); for detailed statistics please see also Supplementary Table S6).
Discussion
Based on our results, we provide novel evidence that fNIRS is capable of assessing hemodynamic response alterations within the human motor system during the execution of a complex whole body movement (BS). Furthermore, we could demonstrate that a short distance channel regression of fNIRS data seems to be suitable of improving fNIRS data analysis. Here, short distance channel regression revealed a focalized hemodynamic response alteration within bilateral SPL during BS performed at 40% 1RM. Hence, the present study is the first of its kind to reveal brain regions that are potentially involved in the execution of a BS, as well as the first study to report correspondence between cortical activity and force requirements in a complex whole body movement. This indicates that sensorimotor areas, such as bilateral SPL, modulate their activity as a function of applied load during the execution of a complex whole body movement (BS). Further, our results are in accordance with previous findings, who also reported force-dependent modulation of cortical activity during isolated simple movements (Bhambhani et al., 2006; Rasmussen et al., 2007; Shibuya et al., 2008, 2014; Rupp and Perrey, 2009; Shibusawa et al., 2009; Derosiere and Perrey, 2012). However, we did not see significant hemodynamic response alterations in M1 when comparing different barbell load levels which contrasts with previous studies (Shibuya et al., 2008, 2014; Shibusawa et al., 2009; Derosiere and Perrey, 2012; Derosière et al., 2014). Even though we can only speculate about these divergent findings, it seems reasonable to assume that especially during complex whole body movements extra-cortical brain regions such as the cerebellum might play a pivotal role. In fact, several brain imaging studies could demonstrate that apart from cortical brain regions such as M1 (Shibuya et al., 2008), the cerebellum also shows a similar load-related brain reorganization (Dai et al., 2001; Sehm et al., 2010; Noble et al., 2011; Spraker et al., 2012; Charles et al., 2013). Furthermore, previous fMRI studies could show that cerebellar-parietal circuits modulate movement complexity in unilateral sequential finger movements, underlining the importance of subcortical output paths in complex movements (Haslinger et al., 2002).
Obviously, fNIRS is not capable of assessing extra- and/or sub-cortical regions because of its limited penetration depth. Therefore, other approaches must be adopted to shed more light on the role of the cerebellum during force-dependent alterations in complex whole body movements.
It is also important to note that hemodynamic response alterations during the BS were primarily observed for HbO2. To date, it has been controversially discussed which chromophore (HbO2 or HHb) is more reliable and valid in respect to the indirect measurement of cortical activity via fNIRS (Schroeter et al., 2002; Strangman et al., 2002; Obrig and Villringer, 2003). During a test-retest reliability study for event-related fNIRS measurements, Plichta et al. (2006) concluded that, though locally more specific, HHb is limited regarding reproducibility of the localization over time and over subjects, when compared to HbO2. In accordance, several fNIRS studies describe arbitrary behavior of HHb (Maki et al., 1996; Watanabe et al., 1996; Miyai et al., 2001). For example, Miyai et al. (2001) observed both increases and decreases in concentration of HHb for a standardized task between participants. Contrarily, several studies could draw conclusions on active areas based on HHb courses (Durduran et al., 2004; Sato et al., 2007; Shibuya et al., 2008). Regarding the assessment of neural activity with fNIRS, there are studies which use a simultaneous increase in HbO2 and decrease in HHb as indicators of neural activity (Shibuya et al., 2014). Also, there are fNIRS studies dealing with force/load-activity relationships in which only the increase of HbO2 and a constant behavior of HHb were used as indicators of neural activation (Derosiere and Perrey, 2012). Lastly, to our knowledge, no fNIRS studies investigating motor tasks have established neural activity by specific HHb courses combined with constant HbO2 behavior, underlining the fact, that merely using HHb behavior to assess neural activity in fNIRS measurements, seems to be too unreliable.
Our results show broad regional variations regarding significant hemodynamic response alterations for HHb. The absence of a regionally consistent HHb response can generally be attributed to its vascular as well as its hemodynamic dependencies. Thus, HHb behavior varies depending on the degree of oxygenation in venous blood (Hoshi et al., 2001; Miyai et al., 2001). In addition, the individuality of the diameters of distinct arteries or venules can also influence the task-dependent HHb behavior (Hoshi et al., 2001). Additionally, a physiological crosstalk between the chromophores (HbO2 and HHb) can potentially be induced depending on the chosen wavelengths. Although many studies consider a value of 830 nm as the best maximum value (Yamashita et al., 2001; Strangman et al., 2003; Sato et al., 2004; Okui and Okada, 2005; Kawaguchi et al., 2008) there are also studies that show contrary results (Uludag et al., 2004; Correia et al., 2010). Thus, there is potentially the risk of negating certain physiological chromophore responses due to improper selection of wavelength combinations. However, since the wavelengths in the present study (760 nm and 850 nm) correspond to the optimal ranges postulated in current literature, this risk can be considered as minor. Lastly, it can be speculated that although we standardized the task (BS) as much as possible, a differing peripheral activation pattern during the execution of BS between individuals cannot be ruled out. Accordingly, a comprehensive review by Clark et al. (2012) highlighted several determinants which might cause a change in peripheral activation during a BS, inter alia “depth of the BS”, “width of the stance”, “load” and “torso power”. Consequently, it could be the case that the varying peripheral activity patterns provoke differential cortical HHb responses between individuals, which vary in such a way that there is no regional uniform HHb response in the group analysis and thus no HHb hemodynamic response alteration. Finally, it is also possible that eccentric and concentric phases differ regarding their underlying cortical initiation and control during performance of BS, which could potentially result in spatially heterogenic hemodynamic response alterations across the fNIRS channels. It could be shown that movement-related cortical potentials (MRCP’s; Fang et al., 2001, 2004) as well as BOLD signals (Yao et al., 2014) vary between eccentric and concentric contractions. No studies have been investigating this phenomenon in complex whole-body movements with fNIRS so far, which is why we can’t draw definite conclusions with regards to this issue. It should be mentioned that the transfer from eccentric to concentric phases is more distinct and pronounced in isolated movements when compared to BS (for a detailed view of the respective chromophore progressions for concentric and eccentric phases, please see Figures 1(III,IV)). This effect should be investigated in complex whole body movements in the future.
As mentioned above, our results show global hemodynamic response alterations within and outside the sensorimotor system during BS without short-distance channel regression. These results indicate that the obtained signal might be confounded by several potential factors such as certain systemic variables like cardiac output volume (Ide et al., 1998; Giller et al., 2000; van Lieshout et al., 2001) and blood pressure (Harper, 1966; Edwards et al., 2002). Both have a considerable influence on the cerebral blood flow rate, which in turn is closely related to the measured fNIRS signal (Madsen et al., 1995; Smielewski et al., 1995). Blood pressure, in most cases the MAP (mean arterial pressure), as well as cardiac output volume, are subject to potential modulators of various types. Daily movements, for example diffraction in the shoulder joint (Minati et al., 2011), but also visual stimulations (Minati et al., 2009), i.e., influences free from movement, manipulate the blood pressure. Cardiac output is strongly modulated by its close association with the acute state of the vegetative nervous system (VNS), above all through sporting activity (Astrand et al., 1964). It is therefore important to observe systemic influences and, at best, to survey them in parallel to be able to make conclusions about the causes of the derived signal with maximum precision. However, to date, there is no solid methodological approach to continuously monitor blood pressure during physical activity.
Additionally, extracerebral blood flow of the scalp can also confound the fNIRS signal. Two distinct vascular supply systems, the cerebral vascular system and the subcutaneous vascular system of the scalp are located within the penetration range of near-infrared light. The transmitted light can thus detect chromophore concentrations stemming from both vascular systems (Tachtsidis and Scholkmann, 2016).
As a first step to control for this potential confounder we incorporated a short distance channel in our fNIRS configuration (C). Subsequently this channel was utilized as a regressor to potentially eliminate the influence of extracerebral hemodynamics on the fNIRS signal. In recent literature, multi-channel configurations, i.e., configurations that incorporate multiple short and long distance channels, have been discussed and used to potentially eliminate extracerebral signal components (Gagnon et al., 2011, 2012; Zhang et al., 2015). It is currently regarded as the most promising approach to globally correct the fNIRS signal. In the present study, the argument can be made, that a single short distance channel is insufficient to detect and globally adjust for extracerebral confounders. However, several studies could show that altering systemic influences, for example cardiac pulsations, are globally homogenous across the scalp (Tian et al., 2011; Zhang et al., 2015), although there are reports which argue the converse (Gagnon et al., 2012). From our point of view, this validates the usage of one short distance channel. Still, it seems worthwhile to shift future fNIRS measurements, especially those investigating motor tasks, toward multi-distance measurements of the whole brain.
Finally, it should be mentioned that the validity of fNIRS during complex movements should be addressed in more detail by future studies. For example, Suzuki et al. (2004) did not observe walking-speed dependent modulations in sensorimotor areas, while during cycling, Auger et al. (2016) in fact reported power-dependent fNIRS alterations. These divergent findings, in light with our findings, point to task-dependent fNIRS modulations and therefore give no definite answer regarding the validity of fNIRS especially during complex movements.
Conclusion
In the present study, we provide novel evidence that performing the BS leads to hemodynamic response alterations within the human motor system after short-distance channel regression of the fNIRS signal. Furthermore, hemodynamic responses vary as a function of the applied load during the complex whole body movement BS as previously shown for simple and isolated movements (Shibuya et al., 2014). Future studies should further investigate: (1) the potential role of systemic factors; and (2) the validity of fNIRS during complex whole body movements. This seems to be of pivotal interest in studies aiming to assess neural activation during the execution of complex movements in the context of sport.
Author Contributions
RK and PR designed the experiment. RK performed and analyzed the study. TM and DC helped in data acquisition and analysis. RK and PR wrote the article. All authors interpreted and discussed the results.
Supplementary Material
The Supplementary Material for this article can be found online at: http://journal.frontiersin.org/article/10.3389/fnhum.2017.00241/full#supplementary-material
Conflict of Interest Statement
The authors declare that the research was conducted in the absence of any commercial or financial relationships that could be construed as a potential conflict of interest.
References
Astrand, P. O., Cuddy, T. E., Saltin, B., and Stenberg, J. (1964). Cardiac output during submaximal and maximal work. J. Appl. Physiol. 19, 268–274.
Auger, H., Bherer, L., Boucher, É., Hoge, R., Lesage, F., and Dehaes, M. (2016). Quantification of extra-cerebral and cerebral hemoglobin concentrations during physical exercise using time-domain near infrared spectroscopy. Biomed. Opt. Express 7, 3826–3842. doi: 10.1364/boe.7.003826
Bhambhani, Y., Maikala, R., Farag, M., and Rowland, G. (2006). Reliability of near-infrared spectroscopy measures of cerebral oxygenation and blood volume during handgrip exercise in nondisabled and traumatic brain-injured subjects. J. Rehabil. Res. Dev. 43, 845–856. doi: 10.1682/jrrd.2005.09.0151
Charles, S. K., Okamura, A. M., and Bastian, A. J. (2013). Does a basic deficit in force control underlie cerebellar ataxia? J. Neurophysiol. 109, 1107–1116. doi: 10.1152/jn.00152.2012
Clark, D. R., Lambert, M. I., and Hunter, A. M. (2012). Muscle activation in the loaded free barbell squat: a brief review. J. Strength Cond. Res. 26, 1169–1178. doi: 10.1519/JSC.0b013e31822d533d
Correia, T., Gibson, A., and Hebden, J. (2010). Identification of the optimal wavelengths for optical topography: a photon measurement density function analysis. J. Biomed. Opt. 15:056002. doi: 10.1117/1.3484747
Dai, T. H., Liu, J. Z., Sahgal, V., Brown, R. W., and Yue, G. H. (2001). Relationship between muscle output and functional MRI-measured brain activation. Exp. Brain Res. 140, 290–300. doi: 10.1007/s002210100815
Derosière, G., Alexandre, F., Bourdillon, N., Mandrick, K., Ward, T. E., and Perrey, S. (2014). Similar scaling of contralateral and ipsilateral cortical responses during graded unimanual force generation. Neuroimage 85, 471–477. doi: 10.1016/j.neuroimage.2013.02.006
Derosiere, G., and Perrey, S. (2012). Relationship between submaximal handgrip muscle force and NIRS-measured motor cortical activation. Adv. Exp. Med. Biol. 737, 269–274. doi: 10.1007/978-1-4614-1566-4_40
Dettmers, C., Fink, G. R., Lemon, R. N., Stephan, K. M., Passingham, R. E., Silbersweig, D., et al. (1995). Relation between cerebral activity and force in the motor areas of the human brain. J. Neurophysiol. 74, 802–815.
do Nascimento, O. F., Nielsen, K. D., and Voigt, M. (2005). Relationship between plantar-flexor torque generation and the magnitude of the movement-related potentials. Exp. Brain Res. 160, 154–165. doi: 10.1007/s00221-004-1996-9
Durduran, T., Yu, G., Burnett, M. G., Detre, J. A., Greenberg, J. H., Wang, J., et al. (2004). Diffuse optical measurement of blood flow, blood oxygenation, and metabolism in a human brain during sensorimotor cortex activation. Opt. Lett. 29, 1766–1768. doi: 10.1364/ol.29.001766
Edwards, M. R., Martin, D. H., and Hughson, R. L. (2002). Cerebral hemodynamics and resistance exercise. Med. Sci. Sports Exerc. 34, 1207–1211. doi: 10.1097/00005768-200207000-00024
Ehrsson, H. H., Fagergren, A., Jonsson, T., Westling, G., Johansson, R. S., and Forssberg, H. (2000). Cortical activity in precision-versus power-grip tasks: an fMRI study. J. Neurophysiol. 83, 528–536.
Eickhoff, S. B., Heim, S., Zilles, K., and Amunts, K. (2006). Testing anatomically specified hypotheses in functional imaging using cytoarchitectonic maps. Neuroimage 32, 570–582. doi: 10.1016/j.neuroimage.2006.04.204
Eickhoff, S. B., Paus, T., Caspers, S., Grosbras, M. H., Evans, A. C., Zilles, K., et al. (2007). Assignment of functional activations to probabilistic cytoarchitectonic areas revisited. Neuroimage 36, 511–521. doi: 10.1016/j.neuroimage.2007.03.060
Eickhoff, S. B., Stephan, K. E., Mohlberg, H., Grefkes, C., Fink, G. R., Amunts, K., et al. (2005). A new SPM toolbox for combining probabilistic cytoarchitectonic maps and functional imaging data. Neuroimage 25, 1325–1335. doi: 10.1016/j.neuroimage.2004.12.034
Evarts, E. V. (1968). Relation of pyramidal tract activity to force exerted during voluntary movement. J. Neurophysiol. 31, 14–27.
Fang, Y., Siemionow, V., Sahgal, V., Xiong, F., and Yue, G. H. (2001). Greater movement-related cortical potential during human eccentric versus concentric muscle contractions. J. Neurophysiol. 86, 1764–1772.
Fang, Y., Siemionow, V., Sahgal, V., Xiong, F., and Yue, G. H. (2004). Distinct brain activation patterns for human maximal voluntary eccentric and concentric muscle actions. Brain Res. 1023, 200–212. doi: 10.1016/j.brainres.2004.07.035
Gagnon, L., Cooper, R. J., Yücel, M. A., Perdue, K. L., Greve, D. N., and Boas, D. A. (2012). Short separation channel location impacts the performance of short channel regression in NIRS. Neuroimage 59, 2518–2528. doi: 10.1016/j.neuroimage.2011.08.095
Gagnon, L., Perdue, K., Greve, D. N., Goldenholz, D., Kaskhedikar, G., and Boas, D. A. (2011). Improved recovery of the hemodynamic response in diffuse optical imaging using short optode separations and state-space modeling. Neuroimage 56, 1362–1371. doi: 10.1016/j.neuroimage.2011.03.001
Georgopoulos, A. P., Kalaska, J. F., Caminiti, R., and Massey, J. T. (1982). On the relations between the direction of two-dimensional arm movements and cell discharge in primate motor cortex. J. Neurosci. 2, 1527–1537.
Giller, C. A., Giller, A. M., Cooper, C. R., and Hatab, M. R. (2000). Evaluation of the cerebral hemodynamic response to rhythmic handgrip. J. Appl. Physiol. 88, 2205–2213.
Harper, A. M. (1966). Autoregulation of cerebral blood flow: influence of the arterial blood pressure on the blood flow through the cerebral cortex. J. Neurol. Neurosurg. Psychiatry 29, 398–403. doi: 10.1136/jnnp.29.5.398
Haslinger, B., Erhard, P., Weilke, F., Ceballos-Baumann, A. O., Bartenstein, P., Grêfin von Einsiedel, H., et al. (2002). The role of lateral premotor-cerebellar-parietal circuits in motor sequence control: a parametric fMRI study. Cogn. Brain Res. 13, 159–168. doi: 10.1016/s0926-6410(01)00104-5
Helmich, I., Rein, R., Niermann, N., and Lausberg, H. (2013). Hemispheric differences of motor execution: a near-infrared spectroscopy study. Adv. Exp. Med. Biol. 789, 59–64. doi: 10.1007/978-1-4614-7411-1_9
Hoshi, Y., Kobayashi, N., and Tamura, M. (2001). Interpretation of near-infrared spectroscopy signals: a study with a newly developed perfused rat brain model. J. Appl. Physiol. 90, 1657–1662.
Huppert, T. J., Diamond, S. G., Franceschini, M. A., and Boas, D. A. (2009). HomER: a review of time-series analysis methods for near-infrared spectroscopy of the brain. Appl. Opt. 48, D280–D298. doi: 10.1364/ao.48.00d280
Ide, K., Pott, F., Van Lieshout, J. J., and Secher, N. H. (1998). Middle cerebral artery blood velocity depends on cardiac output during exercise with a large muscle mass. Acta Physiol. Scand. 162, 13–20. doi: 10.1046/j.1365-201x.1998.0280f.x
Jurcak, V., Tsuzuki, D., and Dan, I. (2007). 10/20, 10/10 and 10/5 systems revisited: their validity as relative head-surface-based positioning systems. Neuroimage 34, 1600–1611. doi: 10.1016/j.neuroimage.2006.09.024
Kawaguchi, H., Okui, N., Sakaguchi, K., and Okada, E. (2008). Theoretical analysis of crosstalk between oxygenated and deoxygenated hemeoglobin in focal brain-activation measurements by near-infrared topography. Optoelectron. Rev. 16, 404–412. doi: 10.2478/s11772-008-0032-1
Kuhtz-Buschbeck, J. P., Gilster, R., Wolff, S., Ulmer, S., Siebner, H., and Jansen, O. (2008). Brain activity is similar during precision and power gripping with light force: an fMRI study. Neuroimage 40, 1469–1481. doi: 10.1016/j.neuroimage.2008.01.037
Lancaster, J. L., Woldorff, M. G., Parsons, L. M., Liotti, M., Freitas, C. S., Rainey, L., et al. (2000). Automated Talairach atlas labels for functional brain mapping. Hum. Brain Mapp. 10, 120–131. doi: 10.1002/1097-0193(200007)10:3;120::AID-HBM30>3.0.CO;2-8
Madsen, P., Lyck, F., Pedersen, M., Olesen, H. L., Nielsen, H., and Secher, N. H. (1995). Brain and muscle oxygen saturation during head-up-tilt-induced central hypovolaemia in humans. Clin. Physiol. 15, 523–533. doi: 10.1111/j.1475-097x.1995.tb00541.x
Maki, A., Yamashita, Y., Watanabe, E., and Koizumi, H. (1996). Visualizing human motor activity by using non-invasive optical topography. Front. Med. Biol. Eng. 7, 285–297.
Mima, T., Simpkins, N., Oluwatimilehin, T., and Hallett, M. (1999). Force level modulates human cortical oscillatory activities. Neurosci. Lett. 275, 77–80. doi: 10.1016/s0304-3940(99)00734-x
Minati, L., Jones, C. L., Gray, M. A., Medford, N., Harrison, N. A., and Critchley, H. D. (2009). Emotional modulation of visual cortex activity: a functional near-infrared spectroscopy study. Neuroreport 20, 1344–1350. doi: 10.1097/WNR.0b013e328330c751
Minati, L., Kress, I. U., Visani, E., Medford, N., and Critchley, H. D. (2011). Intra- and extra-cranial effects of transient blood pressure changes on brain near-infrared spectroscopy (NIRS) measurements. J. Neurosci. Methods 197, 283–288. doi: 10.1016/j.jneumeth.2011.02.029
Miyai, I., Tanabe, H. C., Sase, I., Eda, H., Oda, I., Konishi, I., et al. (2001). Cortical mapping of gait in humans: a near-infrared spectroscopic topography study. Neuroimage 14, 1186–1192. doi: 10.1006/nimg.2001.0905
Noble, J. W., Eng, J. J., Kokotilo, K. J., and Boyd, L. A. (2011). Aging effects on the control of grip force magnitude: an fMRI study. Exp. Gerontol. 46, 453–461. doi: 10.1016/j.exger.2011.01.004
Obrig, H., Hirth, C., Junge-Hülsing, J. G., Döge, C., Wolf, T., Dirnagl, U., et al. (1996). Cerebral oxygenation changes in response to motor stimulation. J. Appl. Physiol. 81, 1174–1183.
Obrig, H., and Villringer, A. (2003). Beyond the visible—imaging the human brain with light. J. Cereb. Blood Flow Metab. 23, 1–18. doi: 10.1097/01.WCB.0000043472.45775.29
Okui, N., and Okada, E. (2005). Wavelength dependance of crosstalk in dual-wavelength measurement of oxy- and deoxy-hemoglobin. J. Biomed. Opt. 10:11015. doi: 10.1117/1.1846076
Piper, S. K., Krueger, A., Koch, S. P., Mehnert, J., Habermehl, C., Steinbrink, J., et al. (2014). A wearable multi-channel fNIRS system for brain imaging in freely moving subjects. Neuroimage 85, 64–71. doi: 10.1016/j.neuroimage.2013.06.062
Plichta, M. M., Herrmann, M. J., Ehlis, A. C., Baehne, C. G., Richter, M. M., and Fallgatter, A. J. (2006). Event-related visual versus blocked motor task: detection of specific cortical activation patterns with functional near-infrared spectroscopy. Neuropsychobiology 53, 77–82. doi: 10.1159/000091723
Rasmussen, P., Dawson, E. A., Nybo, L., van Lieshout, J. J., Secher, N. H., and Gjedde, A. (2007). Capillary-oxygenation-level-dependent near-infrared spectrometry in frontal lobe of humans. J. Cereb. Blood Flow Metab. 27, 1082–1093. doi: 10.1038/sj.jcbfm.9600416
Rupp, T., and Perrey, S. (2009). Effect of severe hypoxia on prefrontal cortex and muscle oxygenation responses at rest and during exhaustive exercise. Adv. Exp. Med. Biol. 645, 329–334. doi: 10.1007/978-0-387-85998-9_49
Sato, H., Kiguchi, M., Kawaguchi, F., and Maki, A. (2004). Practicality of wavelength selection to improve signal-to-noise ratio in near-infrared spectroscopy. Neuroimage 21, 1554–1562. doi: 10.1016/j.neuroimage.2003.12.017
Sato, T., Ito, M., Suto, T., Kameyama, M., Suda, M., Yamagishi, Y., et al. (2007). Time courses of brain activation and their implications for function: a multichannel near-infrared spectroscopy study during finger tapping. Neurosci. Res. 58, 297–304. doi: 10.1016/j.neures.2007.03.014
Schmitz, C. H., Klemer, D. P., Hardin, R., Katz, M. S., Pei, Y., Graber, H. L., et al. (2005). Design and implementation of dynamic near-infrared optical tomographic imaging instrumentation for simultaneous dual-breast measurements. Appl. Opt. 44, 2140–2153. doi: 10.1364/ao.44.002140
Schneider, P., Piper, S., Schmitz, C. H., Schreiter, N. F., Volkwein, N., Lüdemann, L., et al. (2011). Fast 3D Near-infrared breast imaging using indocyanine green for detection and characterization of breast lesions. Röfo 183, 956–963. doi: 10.1055/s-0031-1281726
Scholkmann, F., Kleiser, S., Metz, A. J., Zimmermann, R., Mata Pavia, J., Wolf, U., et al. (2014). A review on continuous wave functional near-infrared spectroscopy and imaging instrumentation and methodology. Neuroimage 85, 6–27. doi: 10.1016/j.neuroimage.2013.05.004
Schroeter, M. L., Zysset, S., Kupka, T., Kruggel, F., and Yves von Cramon, D. (2002). Near-infrared spectroscopy can detect brain activity during a color-word matching Stroop task in an event-related design. Hum. Brain Mapp. 17, 61–71. doi: 10.1002/hbm.10052
Sehm, B., Perez, M. A., Xu, B., Hidler, J., and Cohen, L. G. (2010). Functional neuroanatomy of mirroring during a unimanual force generation task. Cereb. Cortex 20, 34–45. doi: 10.1093/cercor/bhp075
Shibusawa, M., Takeda, T., Nakajima, K., Ishigami, K., and Sakatani, K. (2009). Functional near-infrared spectroscopy study on primary motor and sensory cortex response to clenching. Neurosci. Lett. 449, 98–102. doi: 10.1016/j.neulet.2008.10.073
Shibuya, K., Kuboyama, N., and Tanaka, J. (2014). Changes in ipsilateral motor cortex activity during a unilateral isometric finger task are dependent on the muscle contraction force. Physiol. Meas. 35, 417–428. doi: 10.1088/0967-3334/35/3/417
Shibuya, K., Sadamoto, T., Sato, K., Moriyama, M., and Iwadate, M. (2008). Quantification of delayed oxygenation in ipsilateral primary motor cortex compared with contralateral side during a unimanual dominant-hand motor task using near-infrared spectroscopy. Brain Res. 1210, 142–147. doi: 10.1016/j.brainres.2008.03.009
Shibuya, K., Tanaka, J., Kuboyama, N., Murai, S., and Ogaki, T. (2004). Cerebral cortex activity during supramaximal exhaustive exercise. J. Sports Med. Phys. Fitness 44, 215–219. doi: 10.1093/cercor/bhh166
Siemionow, V., Yue, G. H., Ranganathan, V. K., Liu, J. Z., and Sahgal, V. (2000). Relationship between motor activity-related cortical potential and voluntary muscle activation. Exp. Brain Res. 133, 303–311. doi: 10.1007/s002210000382
Slobounov, S., Johnston, J., Chiang, H., and Ray, W. (2002). Movement-related EEG potentials are force or end-effector dependent: evidence from a multi-finger experiment. Clin. Neurophysiol. 113, 1125–1135. doi: 10.1016/s1388-2457(02)00123-2
Smielewski, P., Kirkpatrick, P., Minhas, P., Pickard, J. D., and Czosnyka, M. (1995). Can cerebrovascular reactivity be measured with near-infrared spectroscopy? Stroke 26, 2285–2292. doi: 10.1161/01.STR.26.12.2285
Spraker, M. B., Corcos, D. M., Kurani, A. S., Prodoehl, J., Swinnen, S. P., and Vaillancourt, D. E. (2012). Specific cerebellar regions are related to force amplitude and rate of force development. Neuroimage 59, 1647–1656. doi: 10.1016/j.neuroimage.2011.09.019
Strangman, G., Culver, J. P., Thompson, J. H., and Boas, D. A. (2002). A quantitative comparison of simultaneous BOLD fMRI and NIRS recordings during functional brain activation. Neuroimage 17, 719–731. doi: 10.1016/s1053-8119(02)91227-9
Strangman, G., Franceschini, M. A., and Boas, D. A. (2003). Factors affecting the accuracy of near-infrared spectroscopy concentration calculations for focal changes in oxygenation parameters. Neuroimage 18, 865–879. doi: 10.1016/s1053-8119(03)00021-1
Suzuki, M., Miyai, I., Ono, T., Oda, I., Konishi, I., Kochiyama, T., et al. (2004). Prefrontal and premotor cortices are involved in adapting walking and running speed on the treadmill: an optical imaging study. Neuroimage 23, 1020–1026. doi: 10.1016/j.neuroimage.2004.07.002
Tachtsidis, I., and Scholkmann, F. (2016). False positives and false negatives in functional near-infrared spectroscopy: issues, challenges, and the way forward. Neurophotonics 3:031405. doi: 10.1117/1.NPh.3.3.030401
Takasawa, M., Oku, N., Osaki, Y., Kinoshita, H., Imaizumi, M., Yoshikawa, T., et al. (2003). Cerebral and cerebellar activation in power and precision grip movements: an H2 15O positron emission tomography study. J. Cereb. Blood Flow Metab. 23, 1378–1382. doi: 10.1097/01.wcb.0000091258.83091.c2
Talelli, P., Ewas, A., Waddingham, W., Rothwell, J. C., and Ward, N. S. (2008). Neural correlates of age-related changes in cortical neurophysiology. Neuroimage 40, 1772–1781. doi: 10.1016/j.neuroimage.2008.01.039
Thickbroom, G. W., Phillips, B. A., Morris, I., Byrnes, M. L., and Mastaglia, F. L. (1998). Isometric force-related activity in sensorimotor cortex measured with functional MRI. Exp. Brain Res. 121, 59–64. doi: 10.1007/s002210050437
Tian, F., Niu, H., Khan, B., Alexandrakis, G., Behbehani, K., and Liu, H. (2011). Enhanced functional brain imaging by using adaptive filtering and a depth compensation algorithm in diffuse optical tomography. IEEE Trans. Med. Imaging 30, 1239–1251. doi: 10.1109/TMI.2011.2111459
Uludag, K., Steinbrink, J., Villringer, A., and Obrig, H. (2004). Separability and cross talk: optimizing dual wavelength combinations for near-infrared spectroscopy of the adult head. Neuroimage 22, 583–589. doi: 10.1016/j.neuroimage.2004.02.023
van Duinen, H., Renken, R., Maurits, N. M., and Zijdewind, I. (2008). Relation between muscle and brain activity during isometric contractions of the first dorsal interosseus muscle. Hum. Brain Mapp. 29, 281–299. doi: 10.1002/hbm.20388
van Lieshout, J. J., Pott, F., Madsen, P. L., van Goudoever, J., and Secher, N. H. (2001). Muscle tensing during standing: effects on cerebral tissue oxygenation and cerebral artery blood velocity. Stroke 32, 1546–1551. doi: 10.1161/01.str.32.7.1546
Wang, Y., Yan, J., Wen, J., Yu, T., and Li, X. (2016). An intracranial electroencephalography (iEEG) brain function mapping tool with an application to epilepsy surgery evaluation. Front. Neuroinform. 10:15. doi: 10.3389/fninf.2016.00015
Ward, N. S., and Frackowiak, R. S. (2003). Age-related changes in the neural correlates of motor performance. Brain 126, 873–888. doi: 10.1093/brain/awg071
Ward, N. S., Swayne, O. B., and Newton, J. M. (2008). Age-dependent changes in the neural correlates of force modulation: an fMRI study. Neurobiol. Aging 29, 1434–1446. doi: 10.1016/j.neurobiolaging.2007.04.017
Watanabe, E., Yamashita, Y., Maki, A., Ito, Y., and Koizumi, H. (1996). Non-invasive functional mapping with multi-channel near infra-red spectroscopic topography in humans. Neurosci. Lett. 205, 41–44. doi: 10.1016/0304-3940(96)12376-4
Yamashita, Y., Maki, A., and Koizumi, H. (2001). Wavelength dependance of the precision of noninvasive optical measurement of oxy-, deoxy-, and total-hemoglobin concentration. Med. Phys. 28, 1108–1114. doi: 10.1118/1.1373401
Yao, W. X., Li, J., Jiang, Z., Gao, J. H., Franklin, C. G., Huang, Y., et al. (2014). Aging interferes central control mechanism for eccentric muscle contraction. Front. Aging Neurosci. 6:86. doi: 10.3389/fnagi.2014.00086
Yücel, M. A., Selb, J., Aasted, C. M., Petkov, M. P., Becerra, L., Borsook, D., et al. (2015). Short separation regression improves statistical significance and better localizes the hemodynamic response obtained by near-infrared spectroscopy for tasks with differing autonomic responses. Neurophotonics 2:035005. doi: 10.1117/1.NPh.2.3.035005
Ye, J. C., Tak, S., Jang, K. E., Jung, J., and Jang, J. (2009). NIRS-SPM: statistical parametric mapping for near-infrared spectroscopy. Neuroimage 44, 428–447. doi: 10.1016/j.neuroimage.2008.08.036
Keywords: functional near-infrared spectroscopy (fNIRS), compound movement, motor cortex, hemodynamic response alterations, neuroplasticity
Citation: Kenville R, Maudrich T, Carius D and Ragert P (2017) Hemodynamic Response Alterations in Sensorimotor Areas as a Function of Barbell Load Levels during Squatting: An fNIRS Study. Front. Hum. Neurosci. 11:241. doi: 10.3389/fnhum.2017.00241
Received: 03 February 2017; Accepted: 25 April 2017;
Published: 15 May 2017.
Edited by:
Mikhail Lebedev, Duke University, USAReviewed by:
Noman Naseer, Air University, PakistanStephane Perrey, Université de Montpellier, France
Sean Kevin Meehan, University of Michigan, USA
Hasan Ayaz, Drexel University, USA
Copyright © 2017 Kenville, Maudrich, Carius and Ragert. This is an open-access article distributed under the terms of the Creative Commons Attribution License (CC BY). The use, distribution or reproduction in other forums is permitted, provided the original author(s) or licensor are credited and that the original publication in this journal is cited, in accordance with accepted academic practice. No use, distribution or reproduction is permitted which does not comply with these terms.
*Correspondence: Patrick Ragert, cGF0cmljay5yYWdlcnRAdW5pLWxlaXB6aWcuZGU=