 Xia-an Bi
 Qian Xu1
- 1College of Information Science and Engineering, Hunan Normal University, Changsha, China
- 2College of Mathematics and Statistics, Hunan Normal University, Changsha, China
Alzheimer’s disease (AD) could be described into following four stages: healthy control (HC), early mild cognitive impairment (EMCI), late MCI (LMCI) and AD dementia. The discriminations between different stages of AD are considerably important issues for future pre-dementia treatment. However, it is still challenging to identify LMCI from EMCI because of the subtle changes in imaging which are not noticeable. In addition, there were relatively few studies to make inferences about the brain dynamic changes in the cognitive progression from EMCI to LMCI to AD. Inspired by the above problems, we proposed an advanced approach of evolutionary weighted random support vector machine cluster (EWRSVMC). Where the predictions of numerous weighted SVM classifiers are aggregated for improving the generalization performance. We validated our method in multiple binary classifications using Alzheimer’s Disease Neuroimaging Initiative dataset. As a result, the encouraging accuracy of 90% for EMCI/LMCI and 88.89% for LMCI/AD were achieved respectively, demonstrating the excellent discriminating ability. Furthermore, disease-related brain regions underlying the AD progression could be found out on the basis of the amount of discriminative information. The findings of this study provide considerable insight into the neurophysiological mechanisms in AD development.
Introduction
Alzheimer’s disease (AD) is a devastating neuro-cognitive disorder of the human brain (Keren-Shaul et al., 2017; Kodis et al., 2018), which is characterized by the progressive loss of cognition and memory in elderly adults (Roy et al., 2016). Along with the aging of global population, the number of individuals suffering from AD will increase (Novak et al., 2017). It is predicted that there will be more than 100 million elderly people worldwide affected by AD by 2050 (Cortes-Canteli et al., 2015; Branca and Oddo, 2017). Therefore, the identification of AD and particularly its transitional phase, namely mild cognitive impairment (MCI), have received increasingly growing attentions in recent years (Cui et al., 2018). The individuals diagnosed with MCI could be further subdivided into the early MCI (EMCI) and late MCI (LMCI) (Lee et al., 2017) and the distinguishing criterions for EMCI and LMCI have been previously depicted in Alzheimer’s Disease Neuroimaging Initiative (ADNI) cohort (Nuttall et al., 2016). At present, there is still no therapy to prevent or reverse the AD pathological process (Forster et al., 2017). It is hence important to develop a new approach that could identify different stages of AD to enhance the understanding of AD pathophysiological progression, which is helpful to the preclinical AD studies.
A great deal of neuroimaging techniques could be utilized to image human brain function and structure, e.g., diffusion tensor imaging (DTI), magnetic resonance spectroscopy (MRS), electroencephalogram (EEG), functional magnetic resonance imaging (fMRI), and so on (Busato et al., 2016; Thanh Vu et al., 2017). Due to the advantages of high temporal and spatial resolutions, fMRI especially resting-state fMRI have gained increasingly growing popularities in the investigation of the whole-brain neural connectivity recently (Goense et al., 2016). As an advanced brain imaging technology, resting-state fMRI has shown a great potential in providing comprehensive information to achieve a high level of identification of the neurological diseases (Phillips, 2012; Rosa et al., 2015). Accordingly, the application of non-invasive resting-state fMRI is highly advantageous to unfold the complexity of brain connectivity network and examine the brain dynamic changes from EMCI to LMCI to AD.
Machine learning (ML) technologies were extensively used in automatic pattern recognition based on imaging data (dos Santos Siqueira et al., 2014; Moradi et al., 2015; Wang et al., 2018; Zeng et al., 2018). In existing literature, there has been a widespread interest to utilize ML methods to classify different stages of AD. Nozadi et al. (2018) employed a random forest (RF) algorithm based on the whole-brain approach to achieve the accuracies of 72.5 and 81.7% for 164 EMCI versus 189 LMCI and 189 LMCI versus 99 AD respectively. Goryawala et al. (2015) reported the accuracies of 73.6 and 90.1% for 114 EMCI versus 91 LMCI and 91 LMCI versus 55 AD using the linear discriminant analysis (LDA). Jie et al. (2018) utilized the multi-kernel SVM and displayed a high accuracy of 78.8% classifying 56 EMCI from 43 LMCI. It is noteworthy that the discrimination between EMCI and LMCI is more challenging in comparison to LMCI and AD.
In order to improve the classification performances especially of EMCI and LMCI, and enhance the understanding of neuropathology in the AD progression, a new method of evolutionary weighted random SVM cluster (EWRSVMC) was presented in this paper to diagnose different stages of AD. The EWRSVMC combined multiple weighted SVM classifiers to make the final decision, which was believed to be considerably stable and robust compared to other individual classifiers such as artificial neural network and decision tree. In addition, the EWRSVMC employed a method of evolution to guide feature selection to explore the optimal feature set for better classification performance. We performed the experiment 1 for EMCI/LMCI classification and the experiment 2 for LMCI/AD classification, yielding high accuracies of 90 and 88.89% respectively using this new framework. Furthermore, the disease-related brain regions were ranked according to the corresponding optimal features’ frequencies and the top-ranked brain regions could be found out. On the one hand, several high-frequency brain regions [e.g., superior temporal gyrus (STG.R), insula (INS.L) and middle temporal gyrus (MTG.L)] are presented in the two groups of experiments at the same time, which suggested that these brain regions play crucial roles in the progression of AD. On the other hand, some brain areas displayed high frequencies only in one group of experiment [e.g., superior frontal gyrus (SFGmed.L) and olfactory cortex (OLF.R) in the experiment 1, and parahippocampal gyrus (PHG.L) and posterior cingulate gyrus (PCG.L) in the experiment 2], which facilitated to understand differences in disease progression. These findings are in agreement with the claims of the previous studies on AD (Douaud et al., 2013; Xiang et al., 2013; Zhu et al., 2014) and provide a novel perspective to AD progression’s neurophysiological mechanisms.
Materials and Methods
Subjects
The neuroimaging data we utilized in this study came from the ADNI cohort1 (Morris et al., 2014). We collected the resting-state fMRI data of 105 participants, which contained 42 EMCI patients (18 male, average age 72.34 years), 38 LMCI patients (23 male, average age 72.99 years) and 25 AD subjects (12 male, average age 74.59 years). Every participant had clinical dementia rating (CDR) scores and mini-mental state examination (MMSE) scores to ensure that the data was homologous. Chi-squared test was utilized for gender comparisons and two-sample t-test was utilized for age, MMSE and CDR comparisons. The detailed demographic information for the patient cohorts was listed in Table 1.
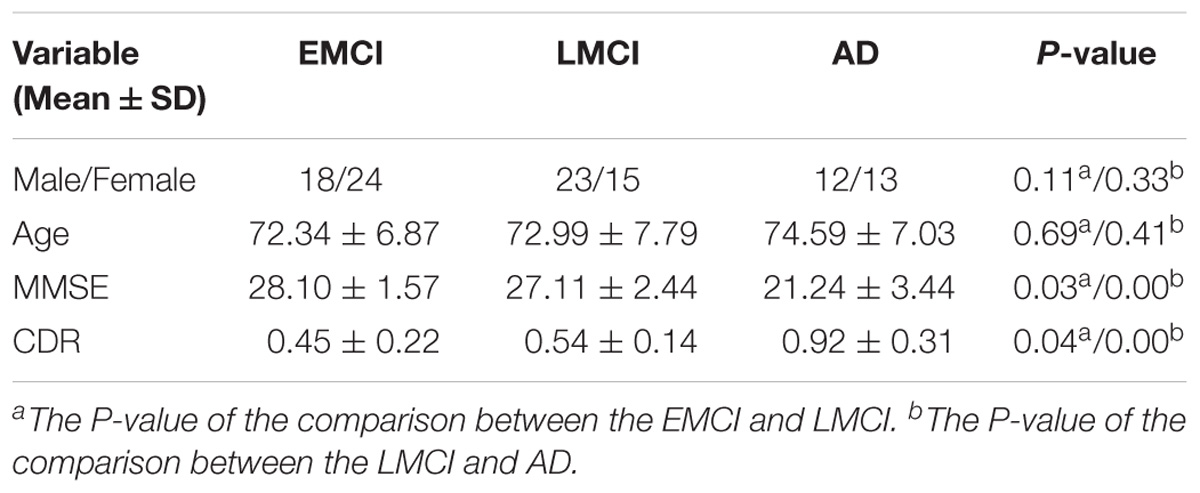
TABLE 1. Demographic information.
All participants were asked to lie still in a Siemens TRIO 3 Tesla machine using the same scanning parameters as follows: 64 × 64 acquisition matrix; flip angle = 80°; echo time (TE) / repetition time (TR) = 30/3000 ms; pixel spacing Y/pixel spacing X = 3.3/3.3mm; 140 image volumes; 48 axial slices; 3.313 mm slice thickness with no gap. During the scan, all participants should close eyes but keep awake with thinking of nothings (Liu et al., 2018).
Data Preprocessing
The same image preprocessing for EMCI, LMCI and AD patients was performed by utilizing the Data Processing Assistant for Resting State fMRI (DPARSF) toolbox (Dan et al., 2017). Briefly, the data was preprocessed in nine steps: converting the data into NIFTI format; exclusion of the first 10 volumes; slice-timing correction; realignment for head movement compensation; normalization; smoothing (utilizing a Gaussian kernel); removing linear trend; temporal band-pass filtering; 9) regressing out the nuisance signals.
Functional Connectivity Features
The brain is a dynamic system constructed by large-scale complex networks comprised of the connections between different brain regions (Braun et al., 2015). In this paper, we employ a popular automated anatomical labeling template (Rolls et al., 2015) to divide the cerebrum into 90 brain areas (45 for left and right hemisphere respectively). A representative resting-state fMRI signal for each brain region is generated by averaging the time series of voxels within each of 90 brain regions. The Pearson correlation coefficient between the representative signals of each pair of the brain regions is computed and treated as a proxy of functional connectivity (FC) (Noble et al., 2017). As a result, a total of 4005 (80 × 90/2) FCs are obtained for each subject and served as predictor features for the proposed EWRSVMC algorithm, which is considered to be a promising approach.
The Evolutionary Weighted Random SVM Cluster
EWRSVMC Design
Machine learning techniques are widely used for pattern recognition (Zeng et al., 2017), among which the SVM model has received increasing popularities in the analysis of neurological disease based on the high-dimensional imaging data recently. Nevertheless, utilizing the single SVM classifier is too challenging to achieve excellent diagnostic performance due to the noise of brain imaging data. Bi et al. (2018) put forward a random SVM cluster (RSVMC) in which multiple SVM classifiers are combined for a final decision-making, which outperforms an individual SVM classifier. But, it could not be ignored that the diagnostic power of each individual classifier in the ensemble classifier may be greatly differential from others. The previous method of RSVMC ignores the fact that the individual SVM classifier with relatively high training error is likely to perform wrong voting on the new samples, which is likely to degrade the discriminative ability. Accordingly, there still remains room for the improvement with respect to the RSVMC method.
This paper presents a novel algorithm of EWRSVMC with two successive steps, i.e., the construction and evolution of weighted ensemble of SVMs respectively. First, in order to reduce the influence of the weak classifiers on the voting, the classification accuracy of each SVM classifier is calculated using the validation set, which is regarded as a proxy of weight of every SVM classifier. The output of EWRSVMC is a weighted average of the outputs of multiple SVMs, which could further reduce classification error rate. Second, in order to select out the most discriminative features from a large-scale feature vector, the method of evolution is introduced to dynamically eliminate the redundant features for further improving final classification performance. The idea of our proposed architecture is showed in Figure 1, where each row and column corresponds to a subject and feature respectively in the left data matrixes.
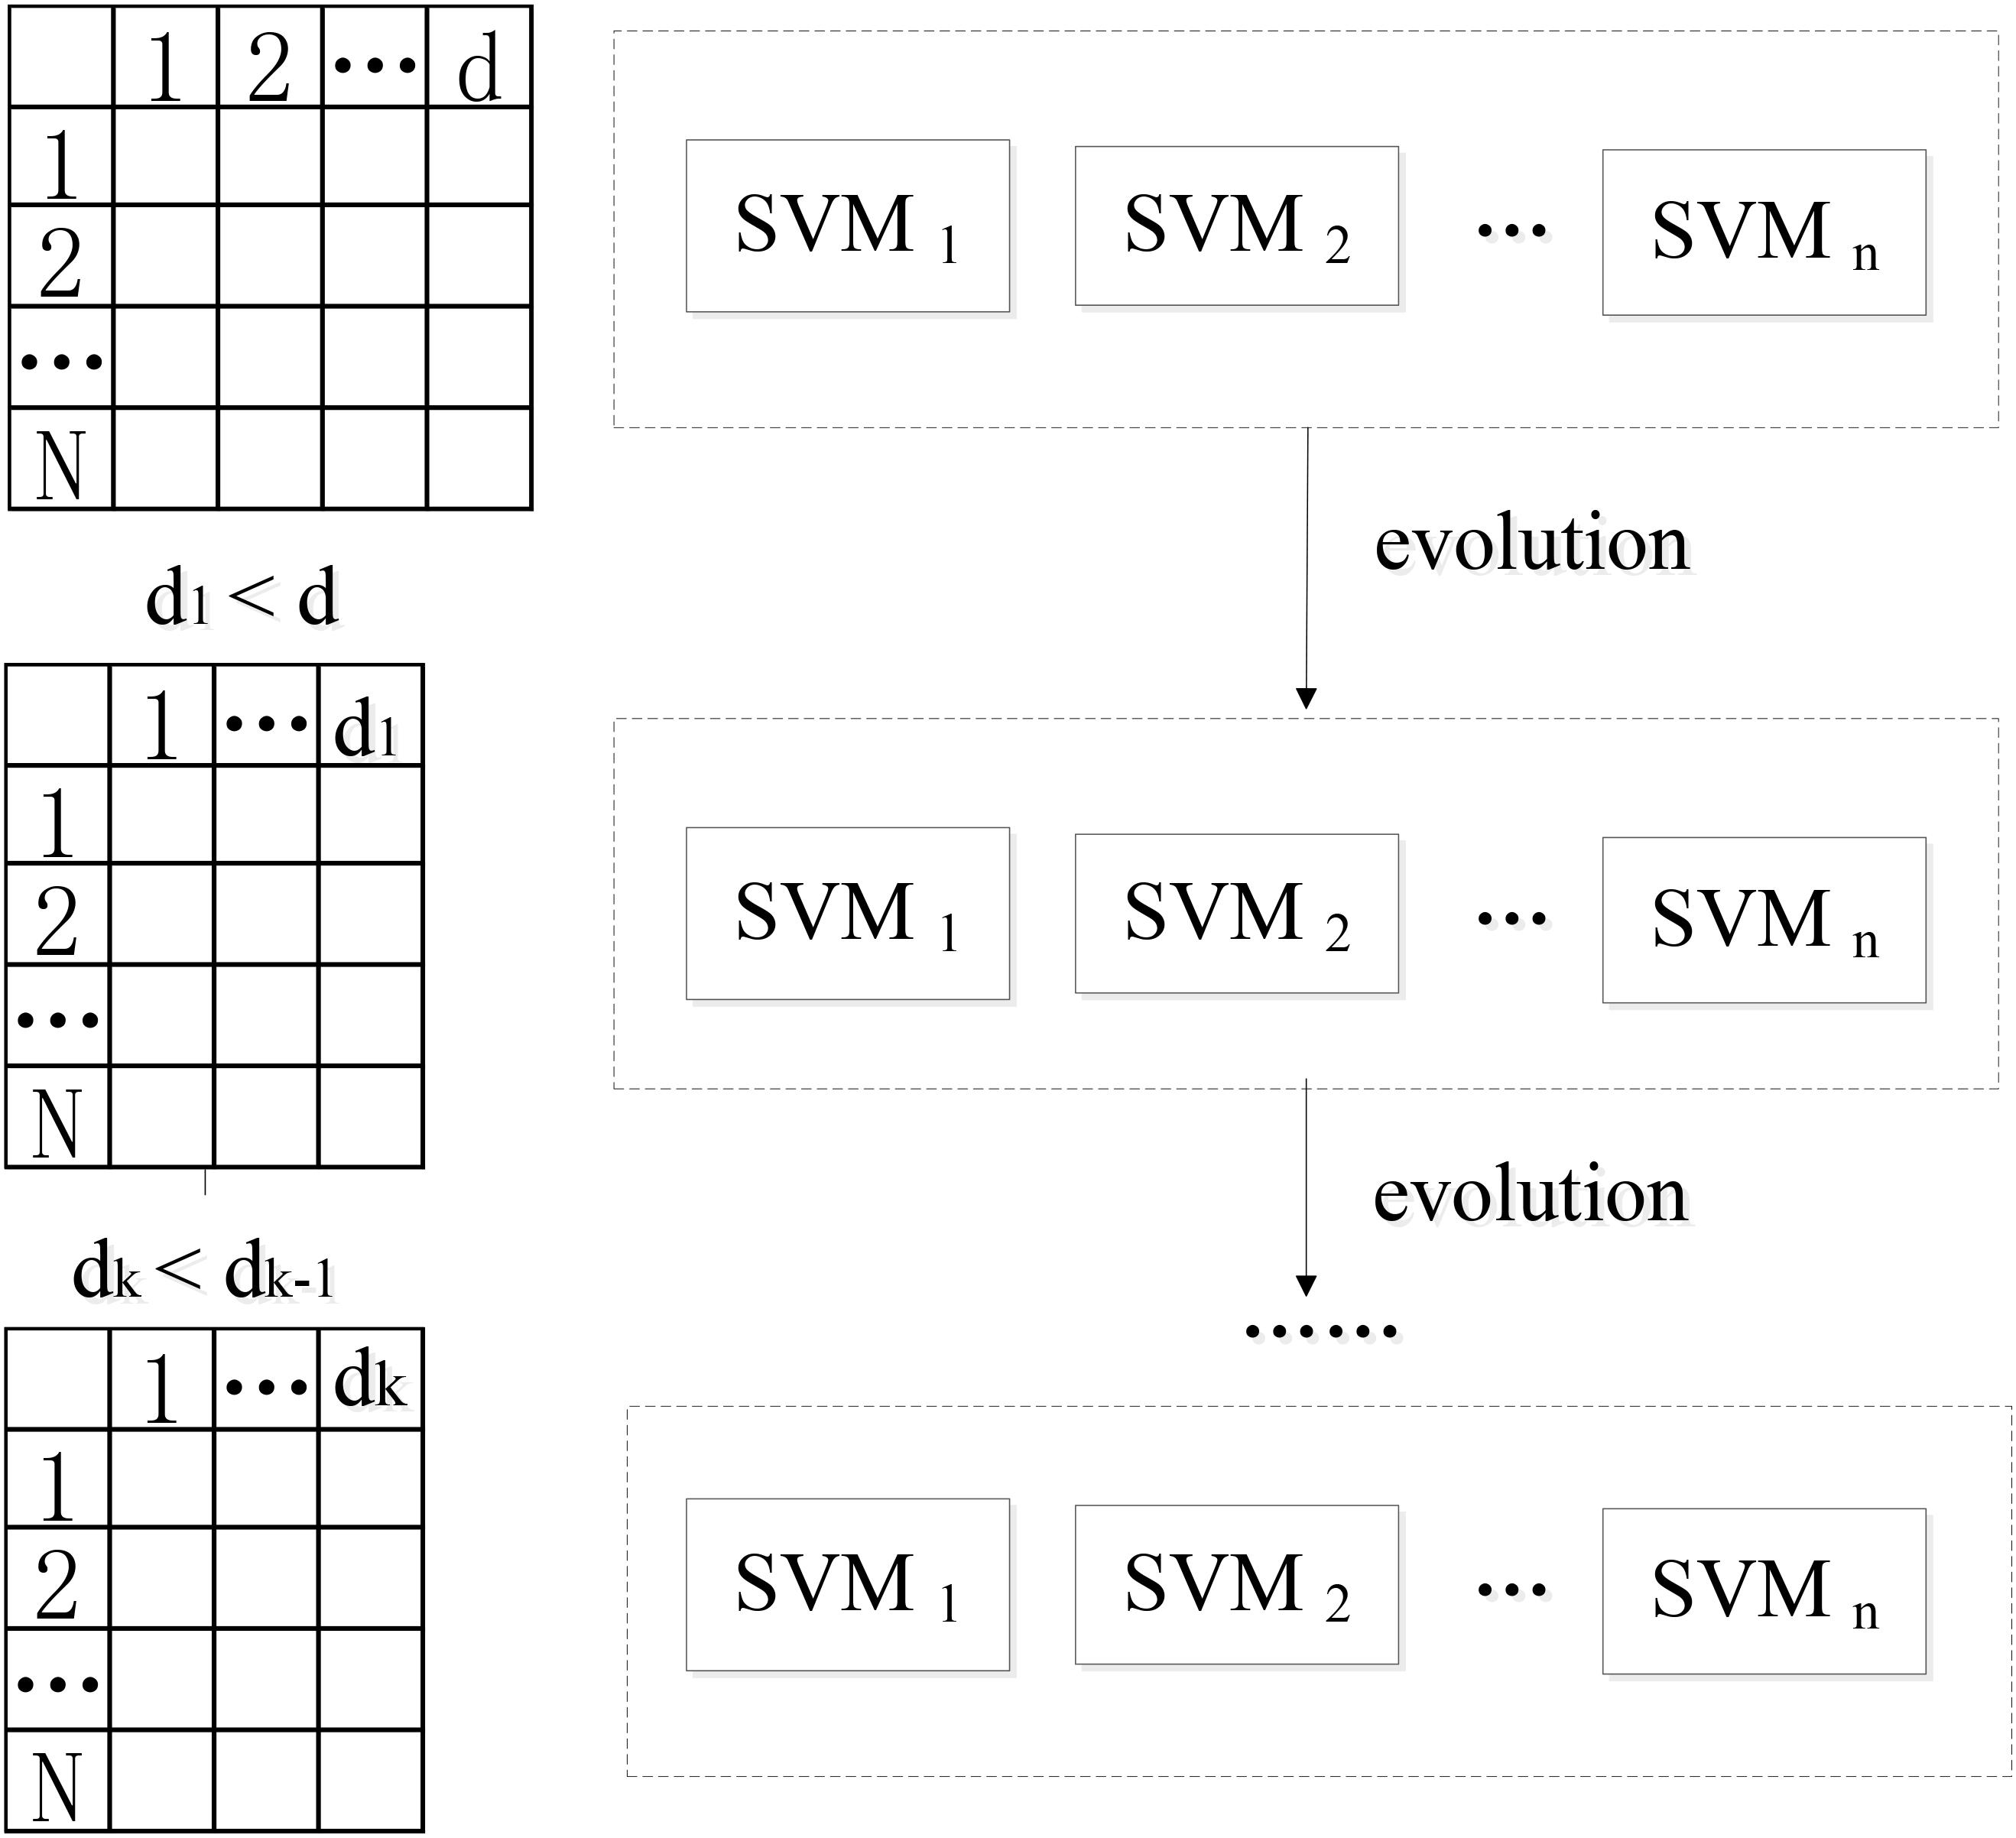
FIGURE 1. The idea of our proposed EWRSVMC.
We suppose X = {x1,...xk,...xn} ∈ RN × d as the connectivity features vectors where N and d are the numbers of all subjects and features. yi ∈ {+1, −1} is the response class label representing two different states (e.g., EMCL or LMCI). The construction of the weighted random SVM cluster is performed using the following steps:
(1) Step1: The available dataset X is divided into two data subset, i.e., a “training and validation” set and a test set respectively.
(2) Step2: Then, the training subset and feature subset are respectively obtained by randomly selecting partial samples from above “training and validation” set and partial features from total features to build an individual SVM model.
(3) Step3: The remaining validation subset is utilized for the estimation of diagnostic accuracy Wl of l-th SVM, which is considered as a proxy of weight of the SVM.
where denotes the number of validation samples correctly classified by l-th SVM classifier, TL represents the number of validation samples.
(4) Step4: The step 2 to step 4 are repeated for n times to build a weighted ensemble of n SVM classifiers.
Following the above steps, a weighted ensemble of multiple SVM classifiers could be constructed and then an approach of evolution is applied to the ensemble classifier to guide feature selection.
Specifically, the SVM classifiers whose classification accuracies are lower than 0.5 are first picked out from the weighted random SVM cluster and considered as weak classifiers. Similarly, the remaining SVM classifiers are regarded as strong classifiers due to the good performance. Then the features selected by these weak classifiers are found out and the weights corresponding to the common features are accumulated. The total weight of each feature in weak classifiers is denoted as Twj:
where p is the number of weak classifiers; wl,j represents the weight of the j-th feature corresponding to l-th weak classifier.
Next, we remove the features whose total weight Twj exceeds a certain threshold q, because these features play crucial roles in the weak classifiers and are likely to make few contributions to the excellent performance of the overall system. As a result, we obtain the remaining features with lower total weights in the weak classifiers and all the features determined by the strong classifiers as an evolutionary feature set, leading to the reduced dimensionality of total feature space. Finally, the above-obtained evolutionary feature set is employed to rebuild a weighted random SVM cluster for the further reduction of feature dimensionality. This procedure is repeated iteratively until it reaches the times of evolutions we set. The optimal EWRSVMC with the highest accuracy during the evolution process could be found out and the features determined by this optimal EWRSVMC are considered as the optimal feature set. The feature selection procedure of the EWRSVMC is exhibited in Figure 2.
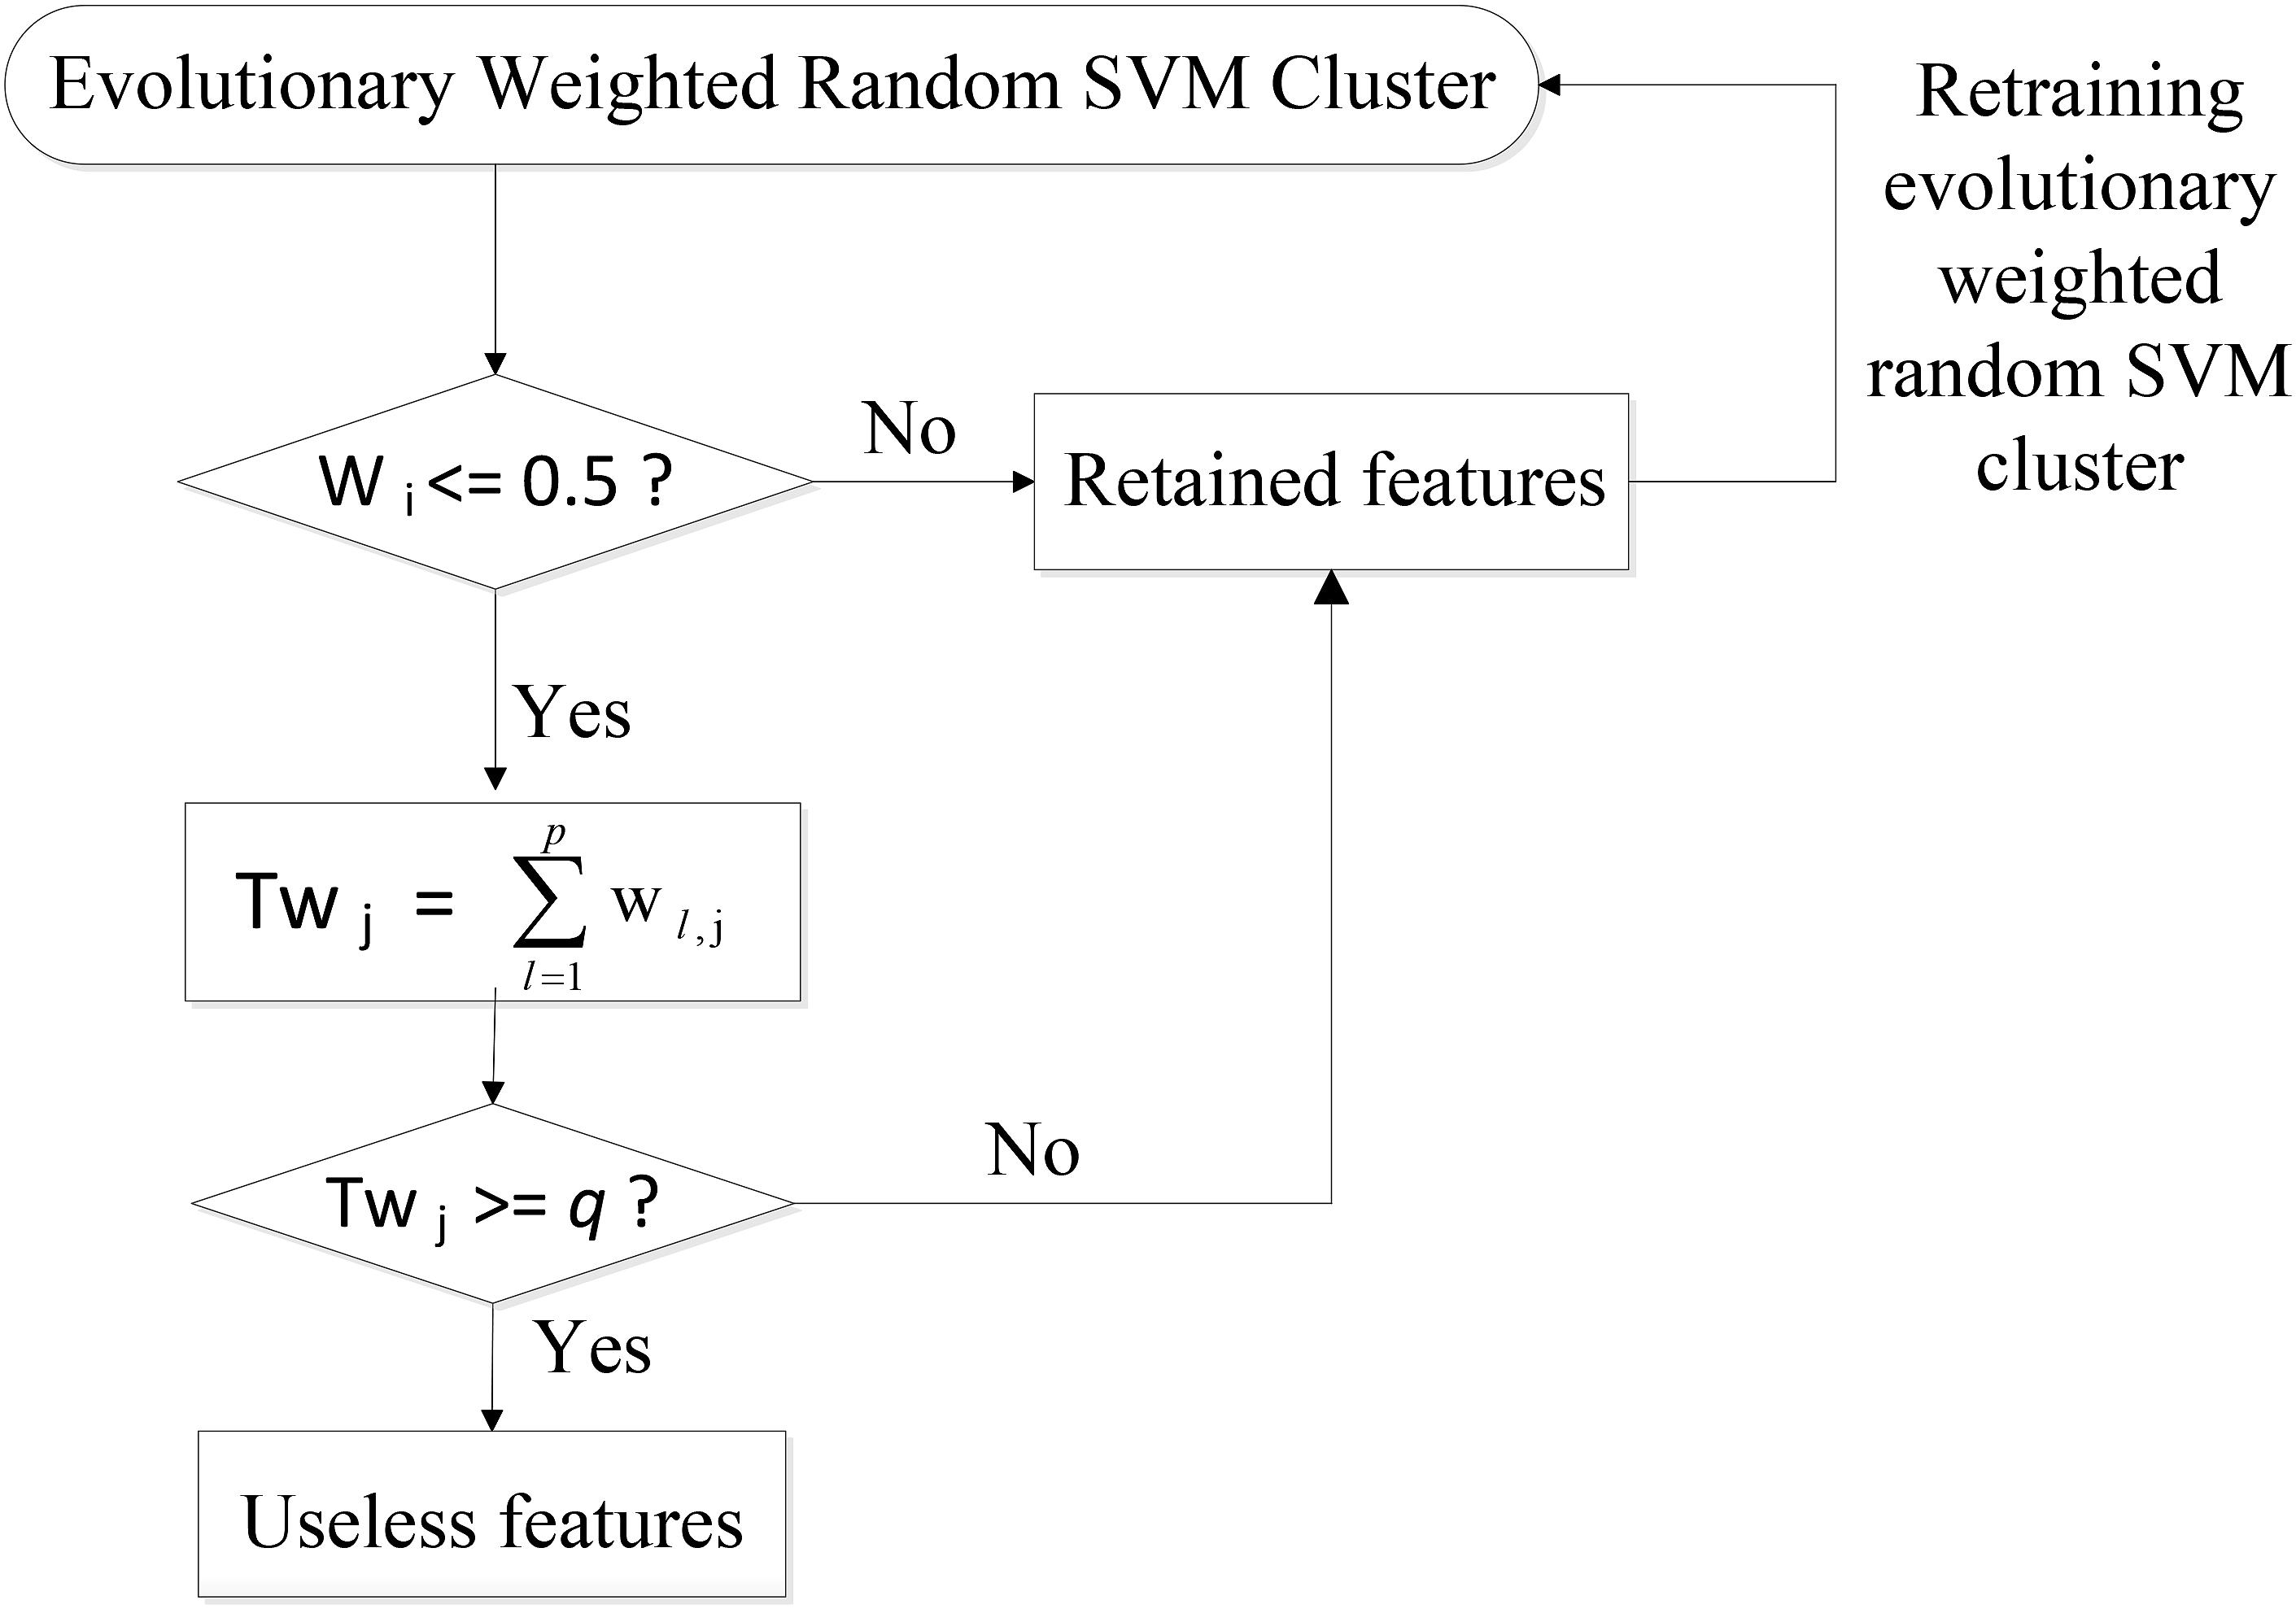
FIGURE 2. Feature selection procedure of the EWRSVMC.
The Evaluation of the EWRSVMC
The EWRSVMC perform a weighted average of the outputs of multiple SVM classifiers, which could predict the class label of each new testing sample. To be specific, a new sample is firstly input into a EWRSVMC system and each individual SVM classifier performs a weighted vote in accordance with its accuracy dealing with the validation samples. Then the weighted voting values belonging to the same predicted label are added up. Lastly, the label having the highest voting value represents new sample’s final predicted label.
In this paper, we employ the three metrics, i.e., accuracy, sensitivity and specificity to estimate our proposed EWRSVMC’s final performances. The diagnostic accuracy Ac stands for a fraction of correctly identified samples (Schröder et al., 2015):
where TP, FP, FN, and TN respectively represents the number of true positives, false positives, false negatives and true negatives.
Sensitivity (Sn) stands for a proportion of actual positive samples which are correctly identified (Mondal and Pai, 2014):
Specificity (Sp) stands for a proportion of actual negative samples which are correctly identified (Kumar and Helenprabha, 2017):
The Application of the EWRSVMC
In the current study, we conducted multiple binary classifications, including EMCI vs. LMCI and LMCI vs. AD to confirm the performance of our proposed EWRSVMC using 4005 FCs as the raw features. In addition to optimizing the classification accuracy as with most existing studies, we also paid great attentions to exploring and analyzing the alterations of the brain in patients with different cognitive stages of AD. Accordingly, another sub-procedure for the exploration of the disease-related brain regions using the optimal features set was carried out. First, we detected the brain regions which are relevant to the optimal features in the EWRSVMC with the highest classification accuracy. Then, disease-related brain regions were sorted in a descending mode, which is consistent with their occurrence frequencies. The higher the frequencies are, the greater the abnormal degrees of the brain regions are.
Experiment Design
In this paper, we conducted the experiment 1 for EMCI vs. LMCI classification and the experiment 2 for LMCI vs. AD classification. Each group of experiment could be mainly divided into four parts:
(1) Division of data sets. A 3:1 ratio is set to divide entire resting-state data set into the “training and validation” set for training the EWRSVMC and the test set for examining the generalization ability of the overall system. Furthermore, a 2:1 ratio is set to subdivide the “training and validation” set into the training set for training the SVM classifier and the validation set for obtaining the weight corresponding to the SVM classifier.
(2) Building an ERWSVMC. Firstly, we randomly select ≈ 62 features from all 4005 features based on the training set to build a radial basis function (RBF) kernel SVM classifier. The kernel bandwidth σ and penalty parameter C for each SVM model are primarily set as 3 and Inf respectively. The number of initial base classifiers is set to 500 to get the weighted ensemble of SVMs. Then, we make the ensemble classifier evolves for 50 times. In each evolution, we find out the features selected by the weak classifiers and remove the features whose total weight Twj exceeding the certain threshold q = 7. As a result, the EWRSVMCs with different evolution times are obtained.
(3) Finding out the optimal subset of features. We compute the diagnostic accuracies of the EWRSVMCs with different evolution times. The features selected by the optimal EWRSVMC having the lowest diagnostic error rate form the optimal features subset.
(4) Exploring the abnormal brain regions. We seek out the features with high discriminative ability in the optimal EWRSVMC, and then investigate the corresponding disease-related brain regions associated with these features.
Results
The Experiment 1
We investigated the performance of classification between EMCI and LMCI in the experiment 1. According to Section “Experiment Design,” we conducted 50 evolutions for the EWRSVMC. Consequently, the EWRSVMC yielded a maximum accuracy of 90% in the 32nd evolution (as shown in Figure 3), which suggested that 32 was the optimal times of evolutions. Meanwhile, a sensitivity of 90.9% and a specificity of 88.89% were achieved based on the optimal feature set. The experiment results showed that the novel framework could significantly enhance diagnostic performance for EMCI/LMCI classification in compared with some other existing algorithms.
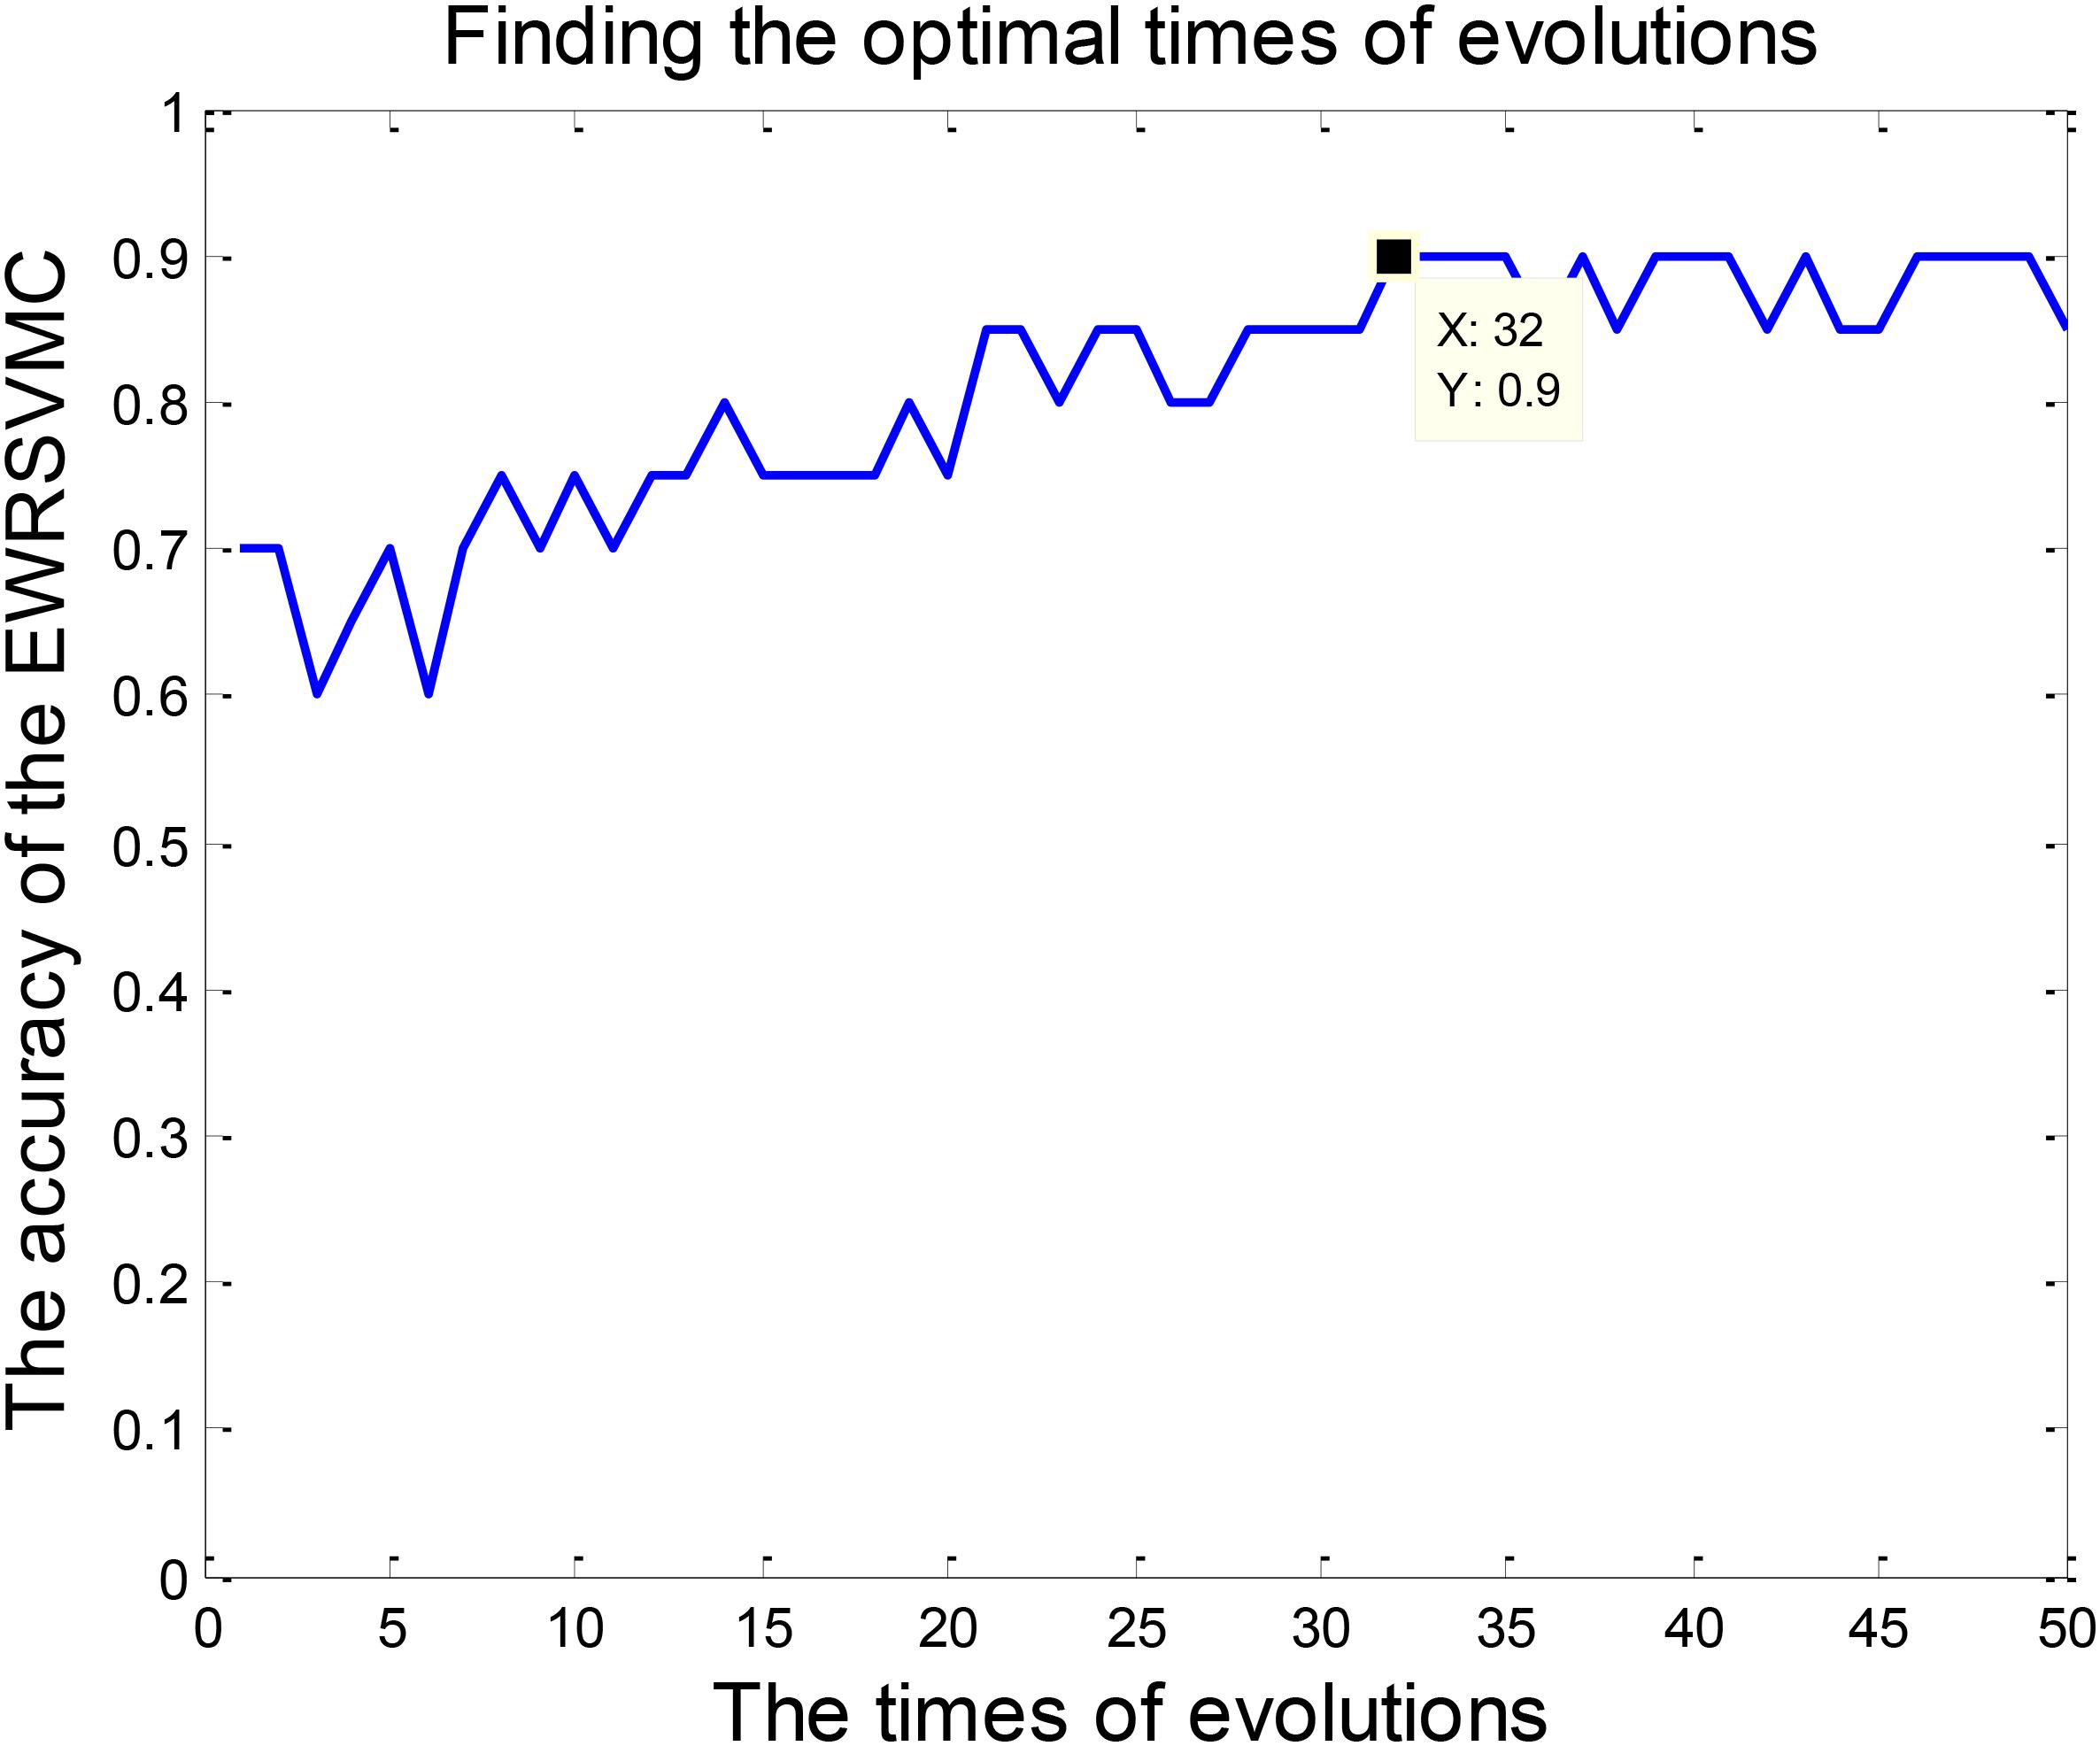
FIGURE 3. Finding the optimal times of evolutions in the experiment 1.
Feature selection was a crucial stage in our EWRSVMC algorithm classifying LMCI from EMCI and the process was shown in Figure 4. On the one hand, the number of removed features increased rapidly and exceeded 100 after two evolutions. Then it became gradually stable and fluctuated around 120. On the other hand, the number of remained features showed a trend of linear decline. There were 248 features left after completing the 32nd evolution, which constituted the optimal feature set and were utilized for subsequent study on the exploration of disease-related brain regions.
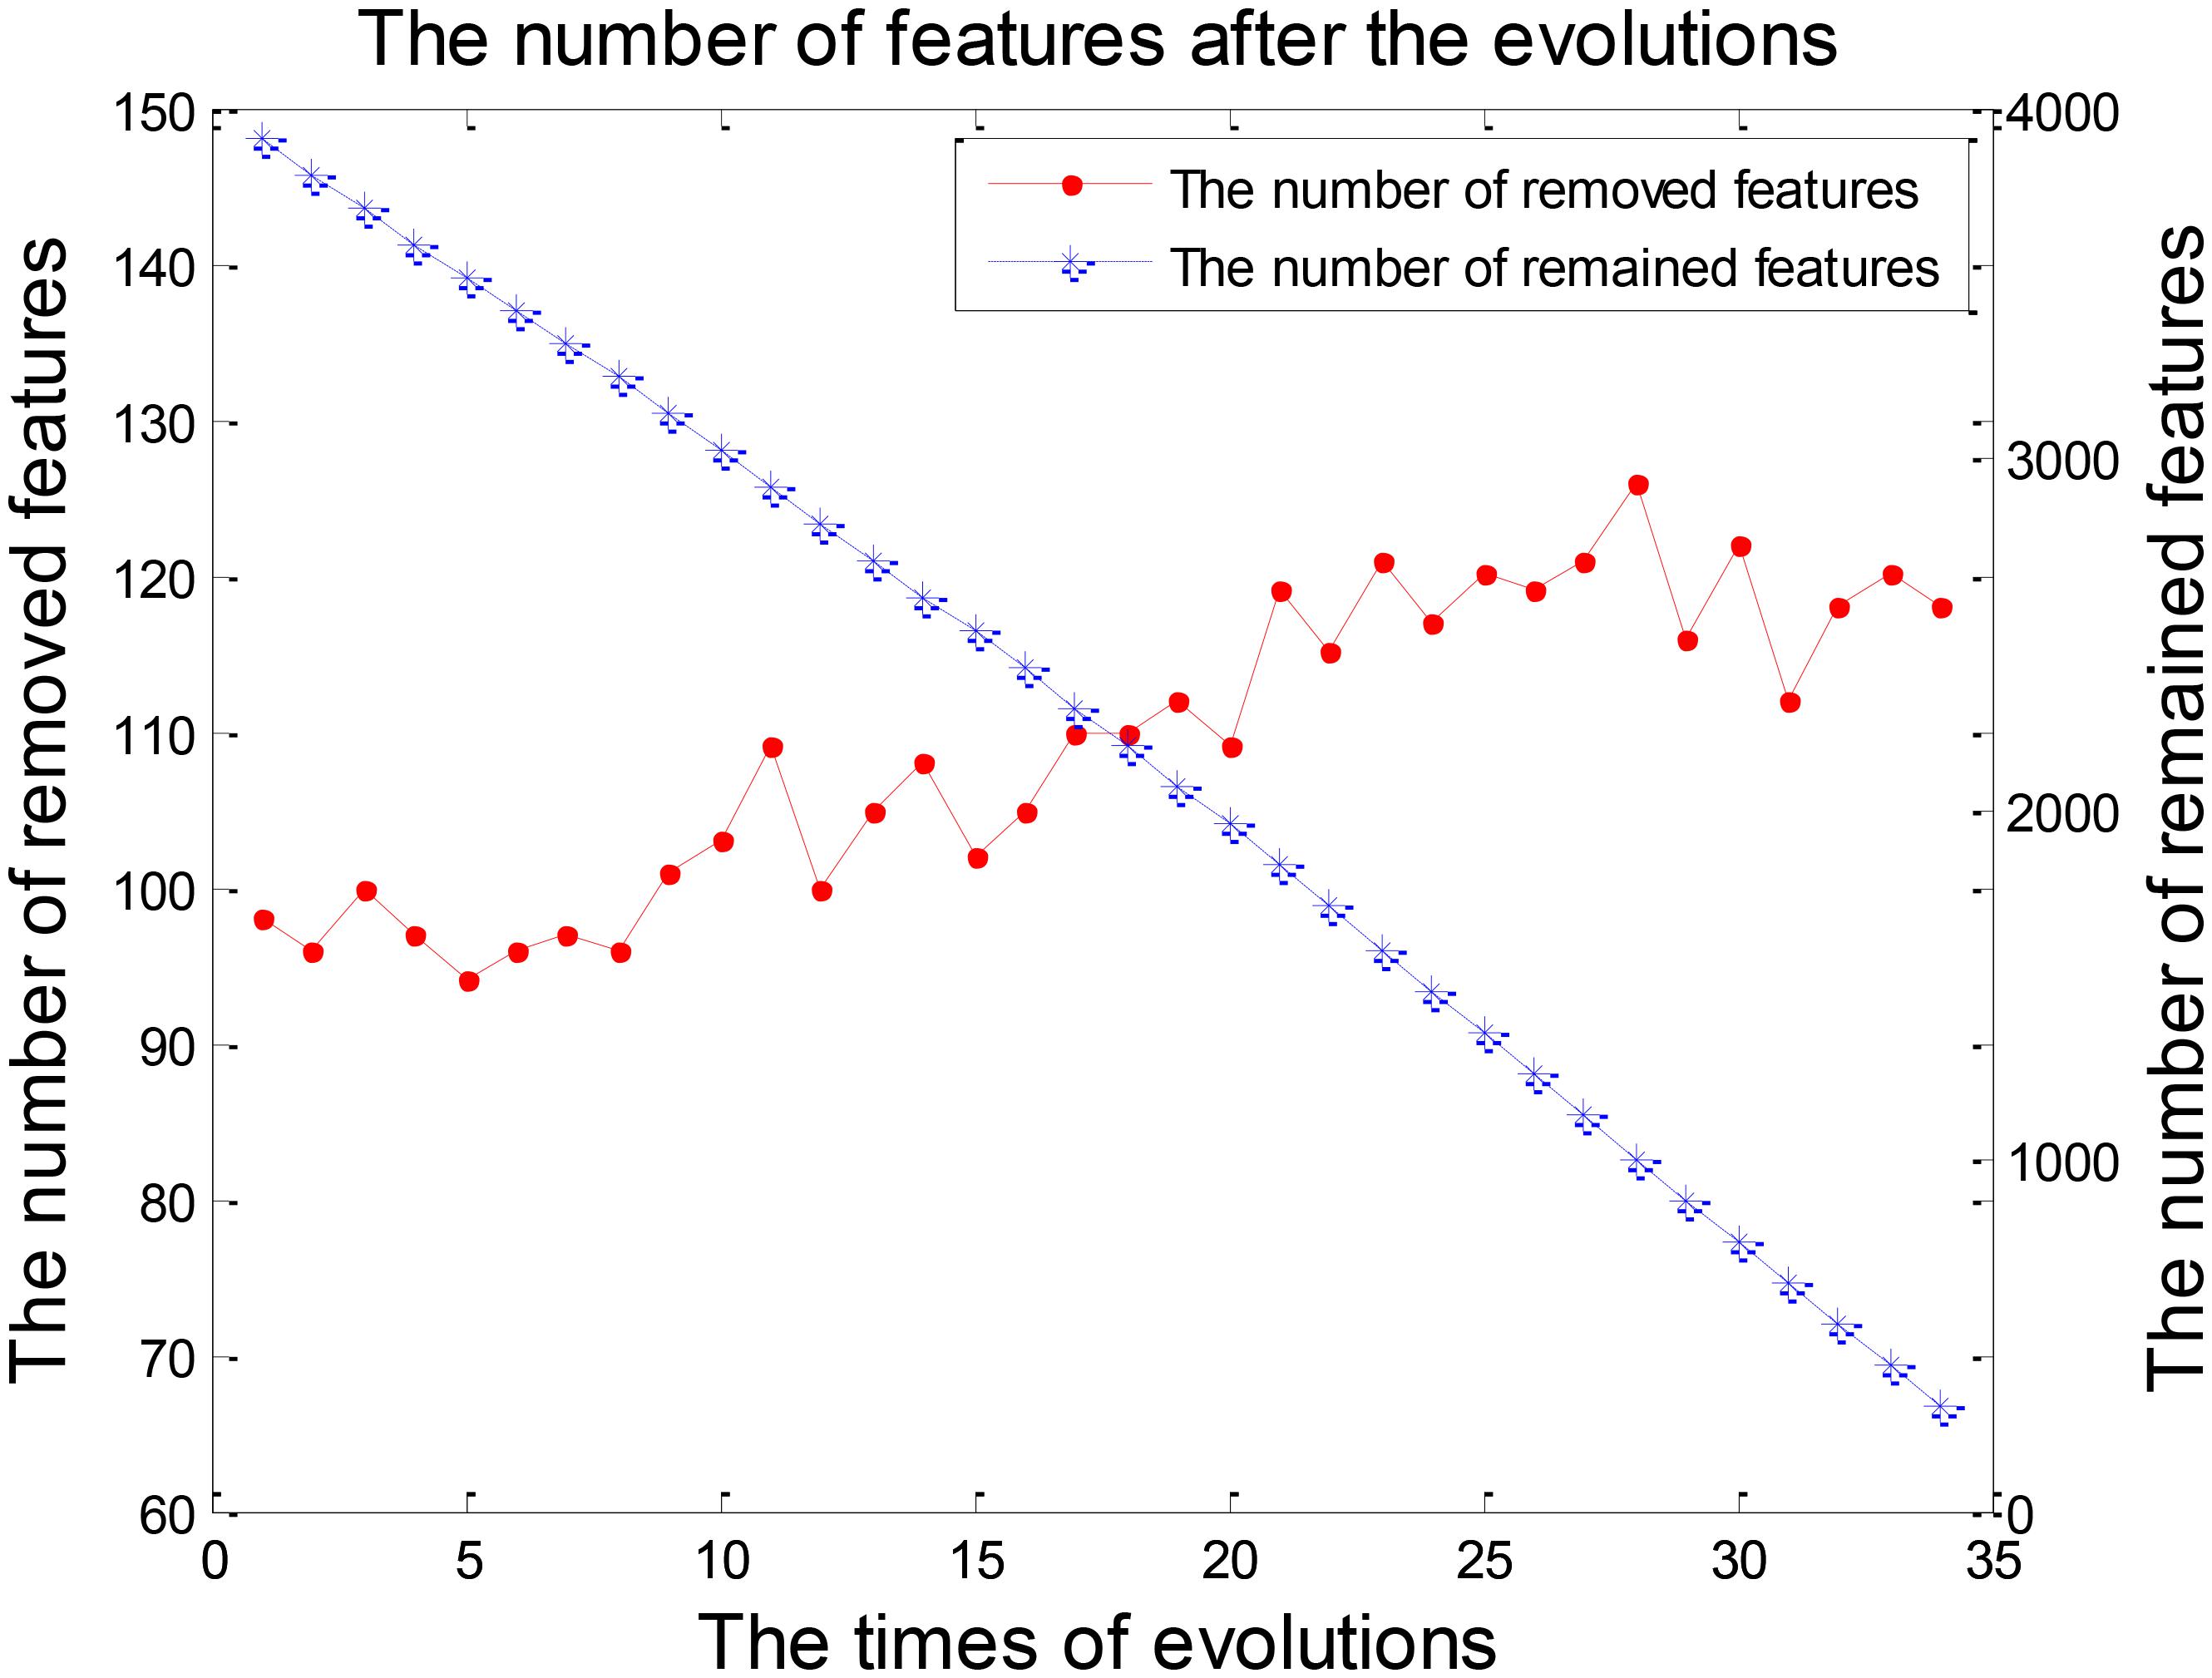
FIGURE 4. The number of features after each evolution in the experiment 1.
By counting the high-frequency FCs, we could detect the most discriminative brain regions which were ranked in the Table 2. The brain regions exceeding the frequency of 10 comprise inferior temporal gyrus (ITG.R), temporal pole: middle temporal gyrus (TPOmid.L), temporal pole: superior temporal gyrus (TPOsup.R), middle temporal gyrus (MTG.L) and insula (INS.L). As seen from Table 2, some sub-regions of the temporal lobe showed higher frequencies compared to other regions, indicating the temporal lobe made an essential contribution to the evolution from EMCI to LMCI. The locations of brain regions were mapped in Figure 5 and the size of the red node represented the degree of abnormality of the corresponding brain regions.
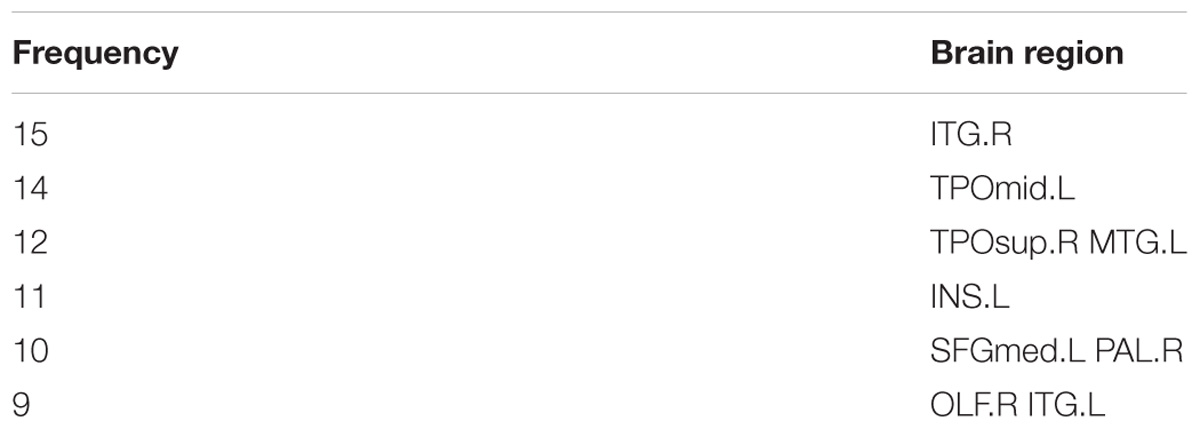
TABLE 2. The frequencies of the most discriminative brain regions in the experiment 1.
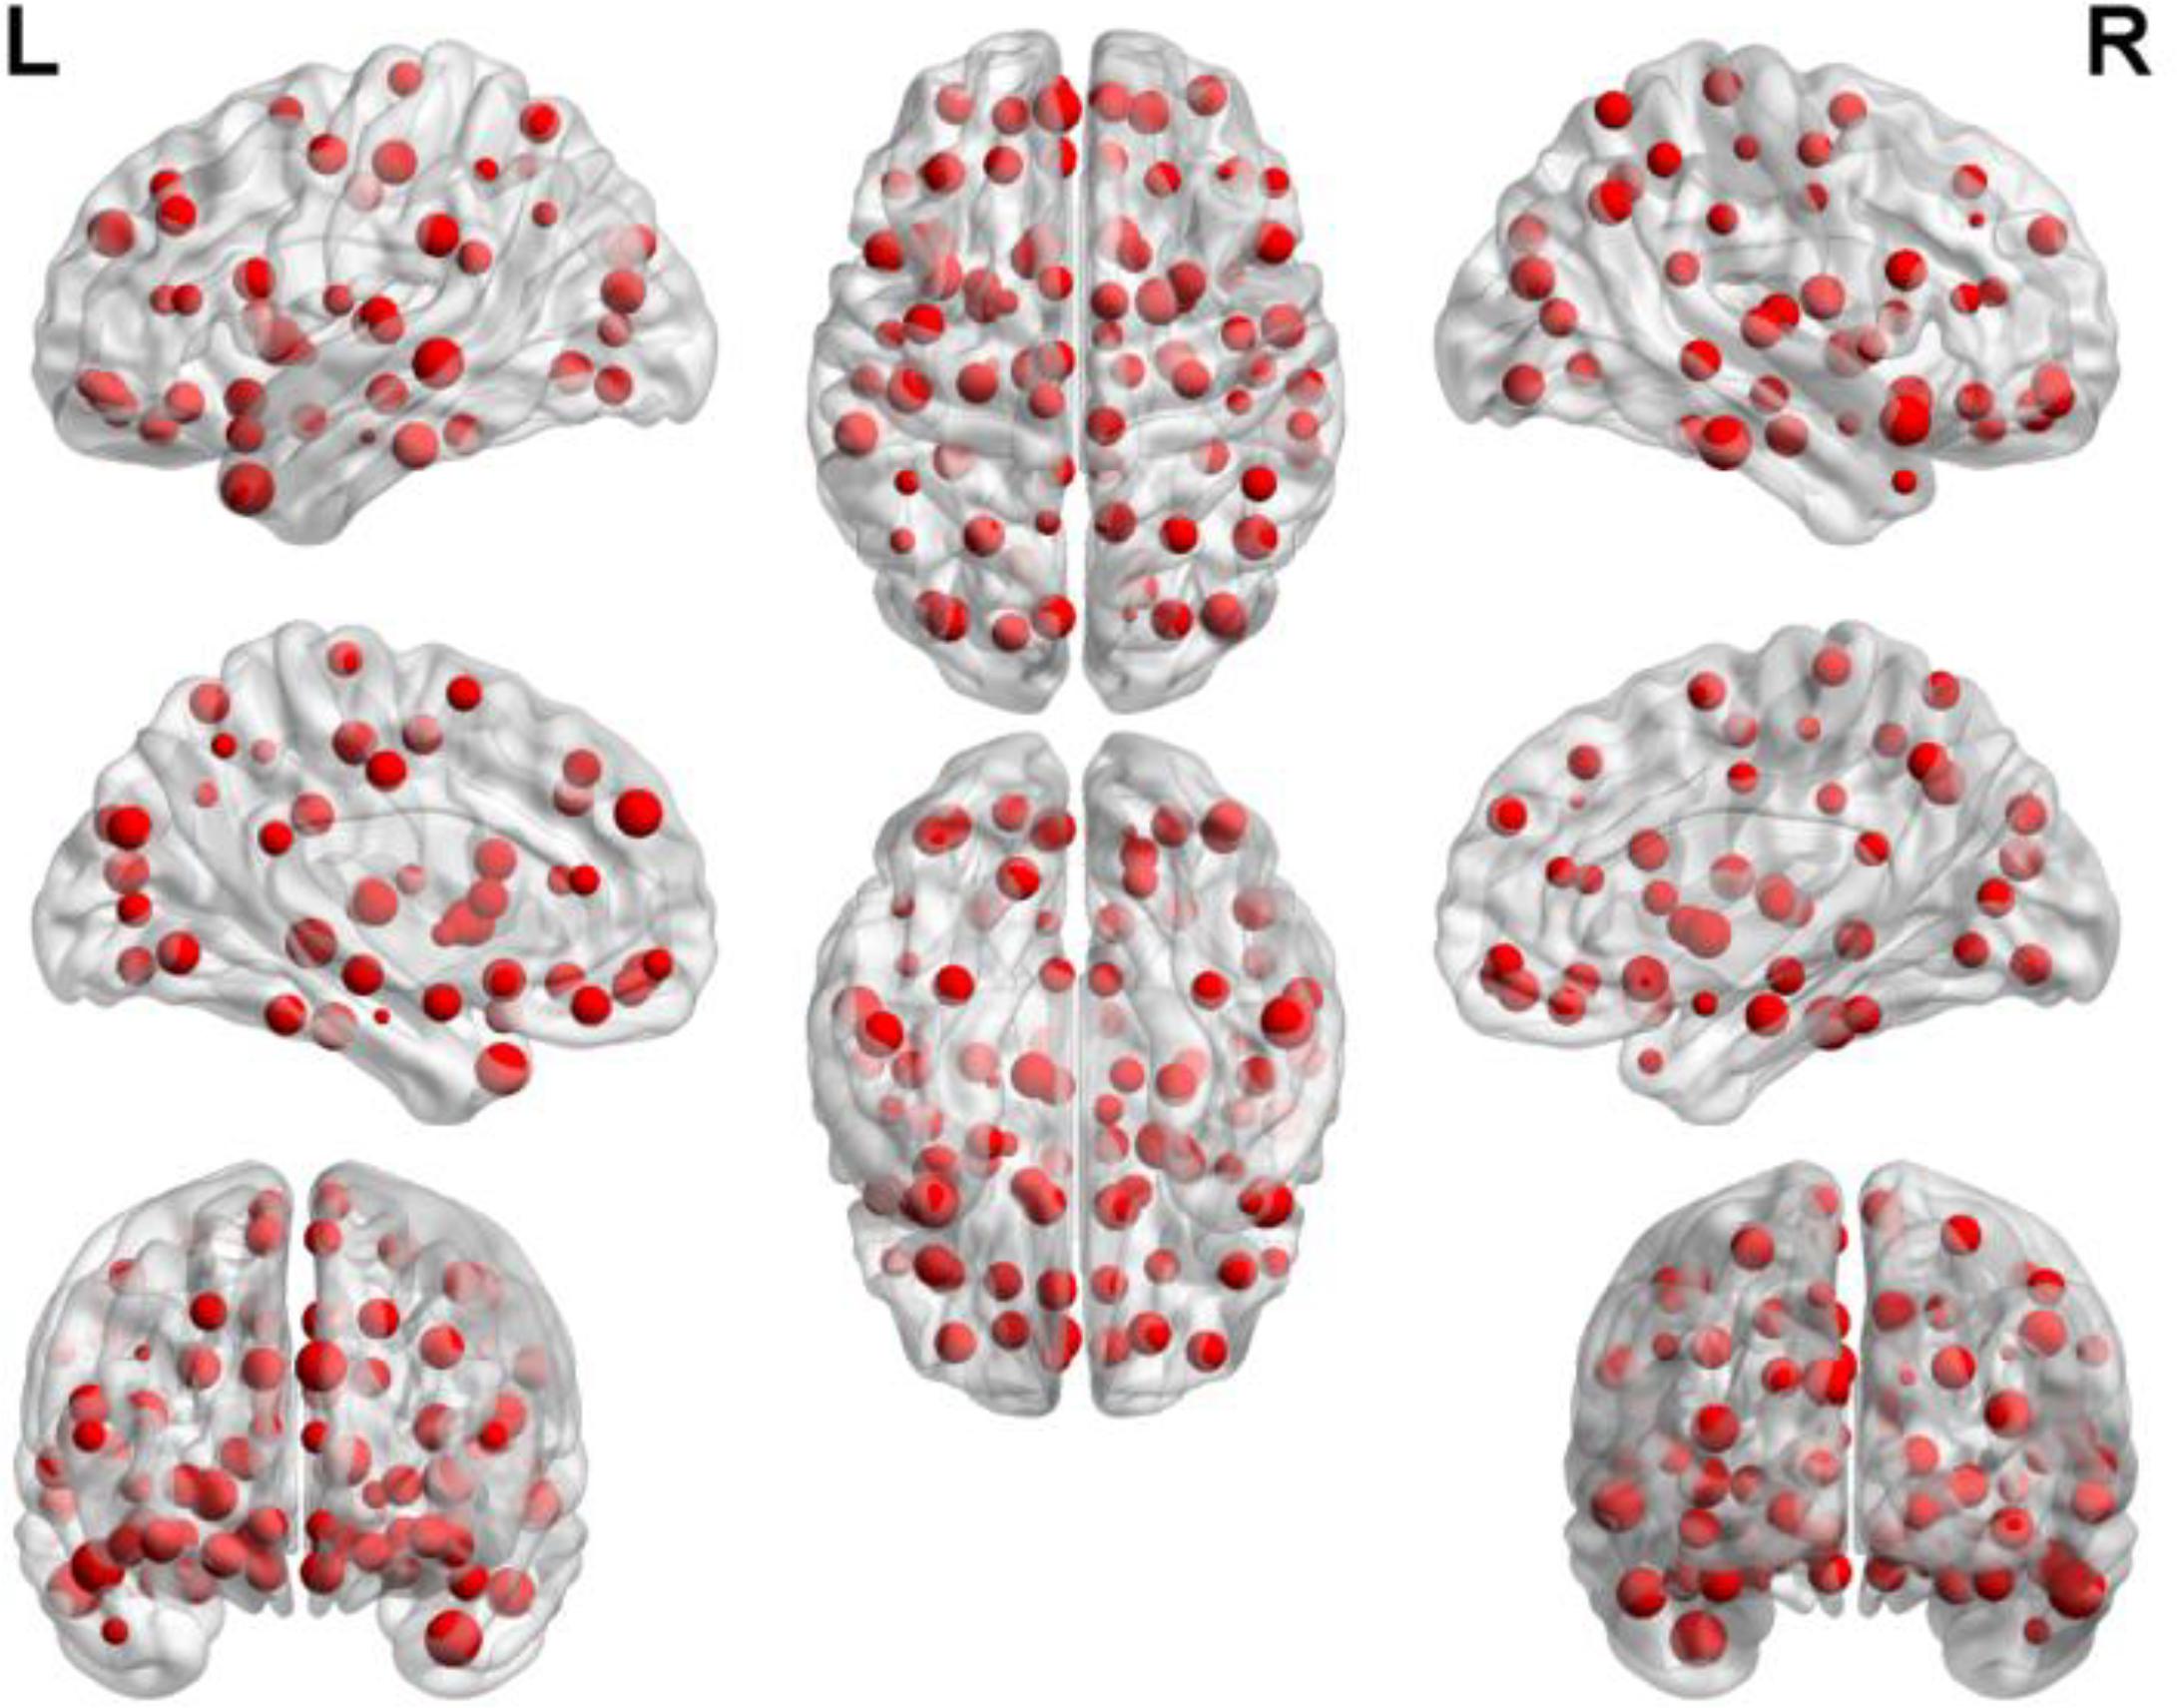
FIGURE 5. The locations of abnormal brain regions in the experiment 1.
The Experiment 2
The classification of patients with LMCI and AD was carried out in the experiment 2. Similarly, 50 evolutions were performed and the EWRSVMC reported the highest accuracy of 88.89% in the 34nd evolution (please see Figure 6), which indicated that 34 was the optimal times of evolutions in LMCI/AD classification. At the same time, the optimal EWRSVMC achieved 85.71% sensitivity and 90.9% specificity. The encouraging performances demonstrated the potential of our new framework for the diagnosis of AD dementia.
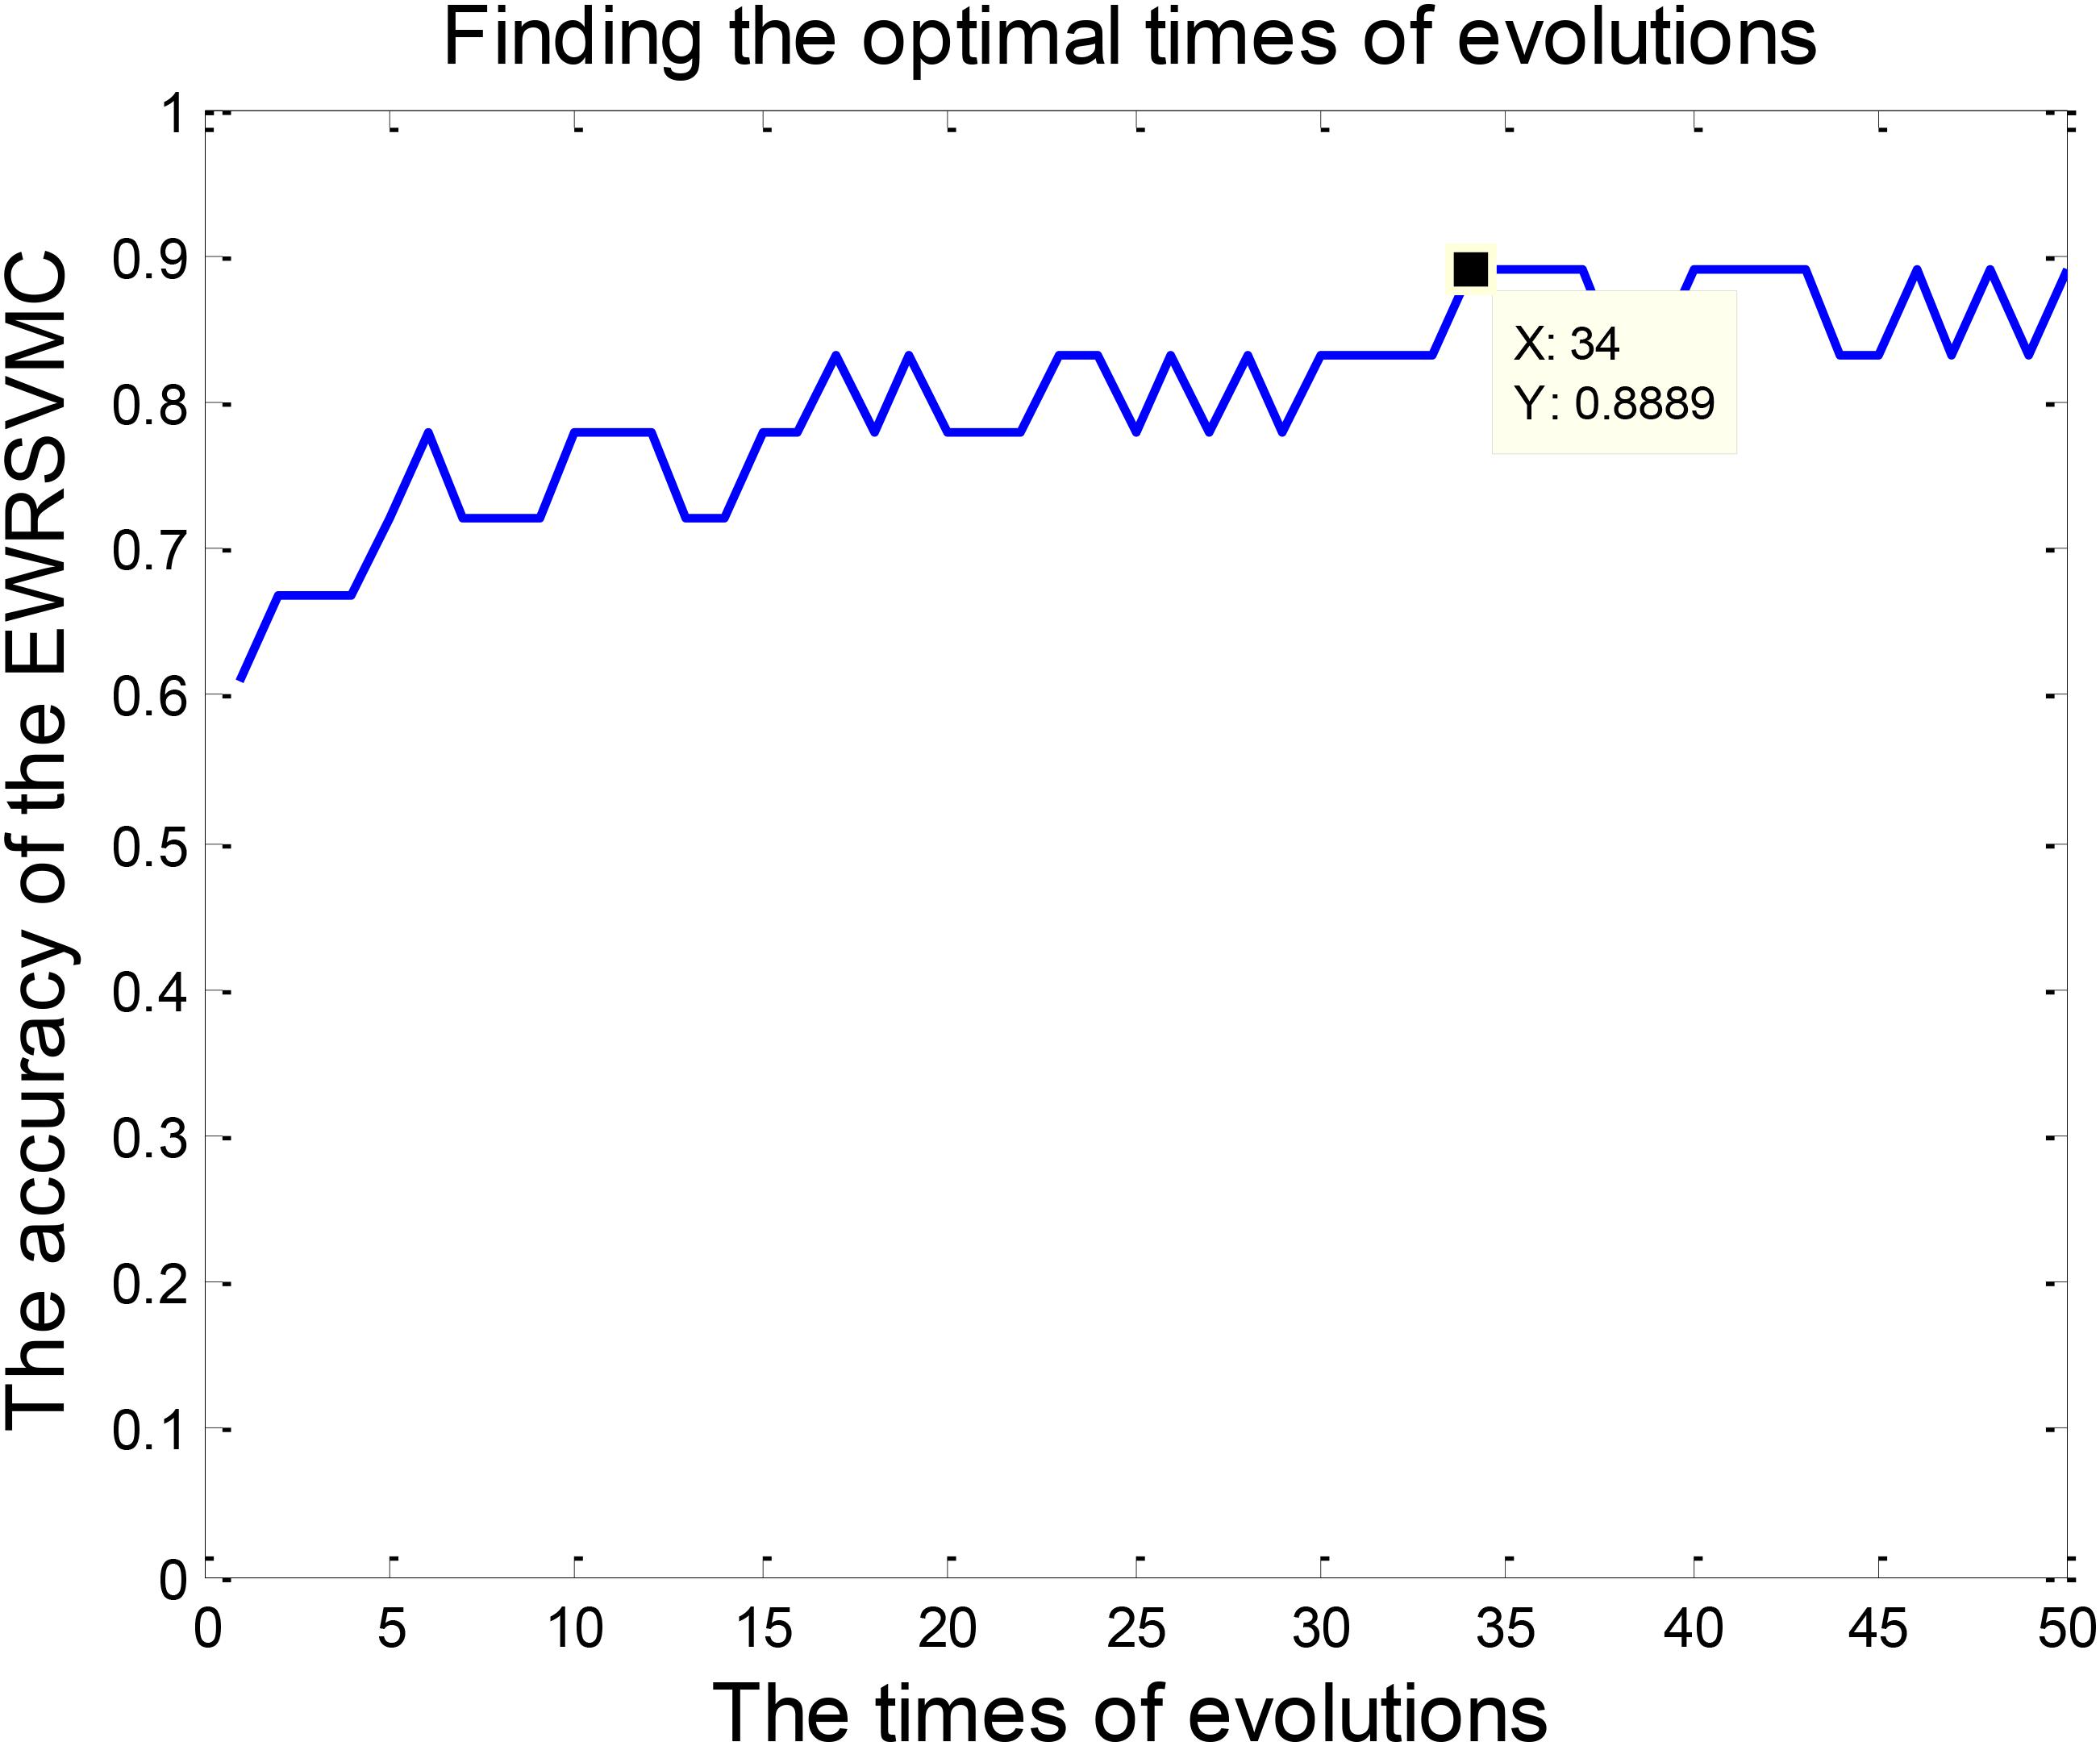
FIGURE 6. Finding the optimal times of evolutions in the experiment 2.
The process of feature selection in LMCI/AD classification was plotted in Figure 7. The number of removed features showed an overall upward trend, while the number of remained features exhibited a trend of linear decline. There were 293 features left after finishing the 34th evolution, which formed the optimal feature set for the further analysis of progression from LMCI to AD.
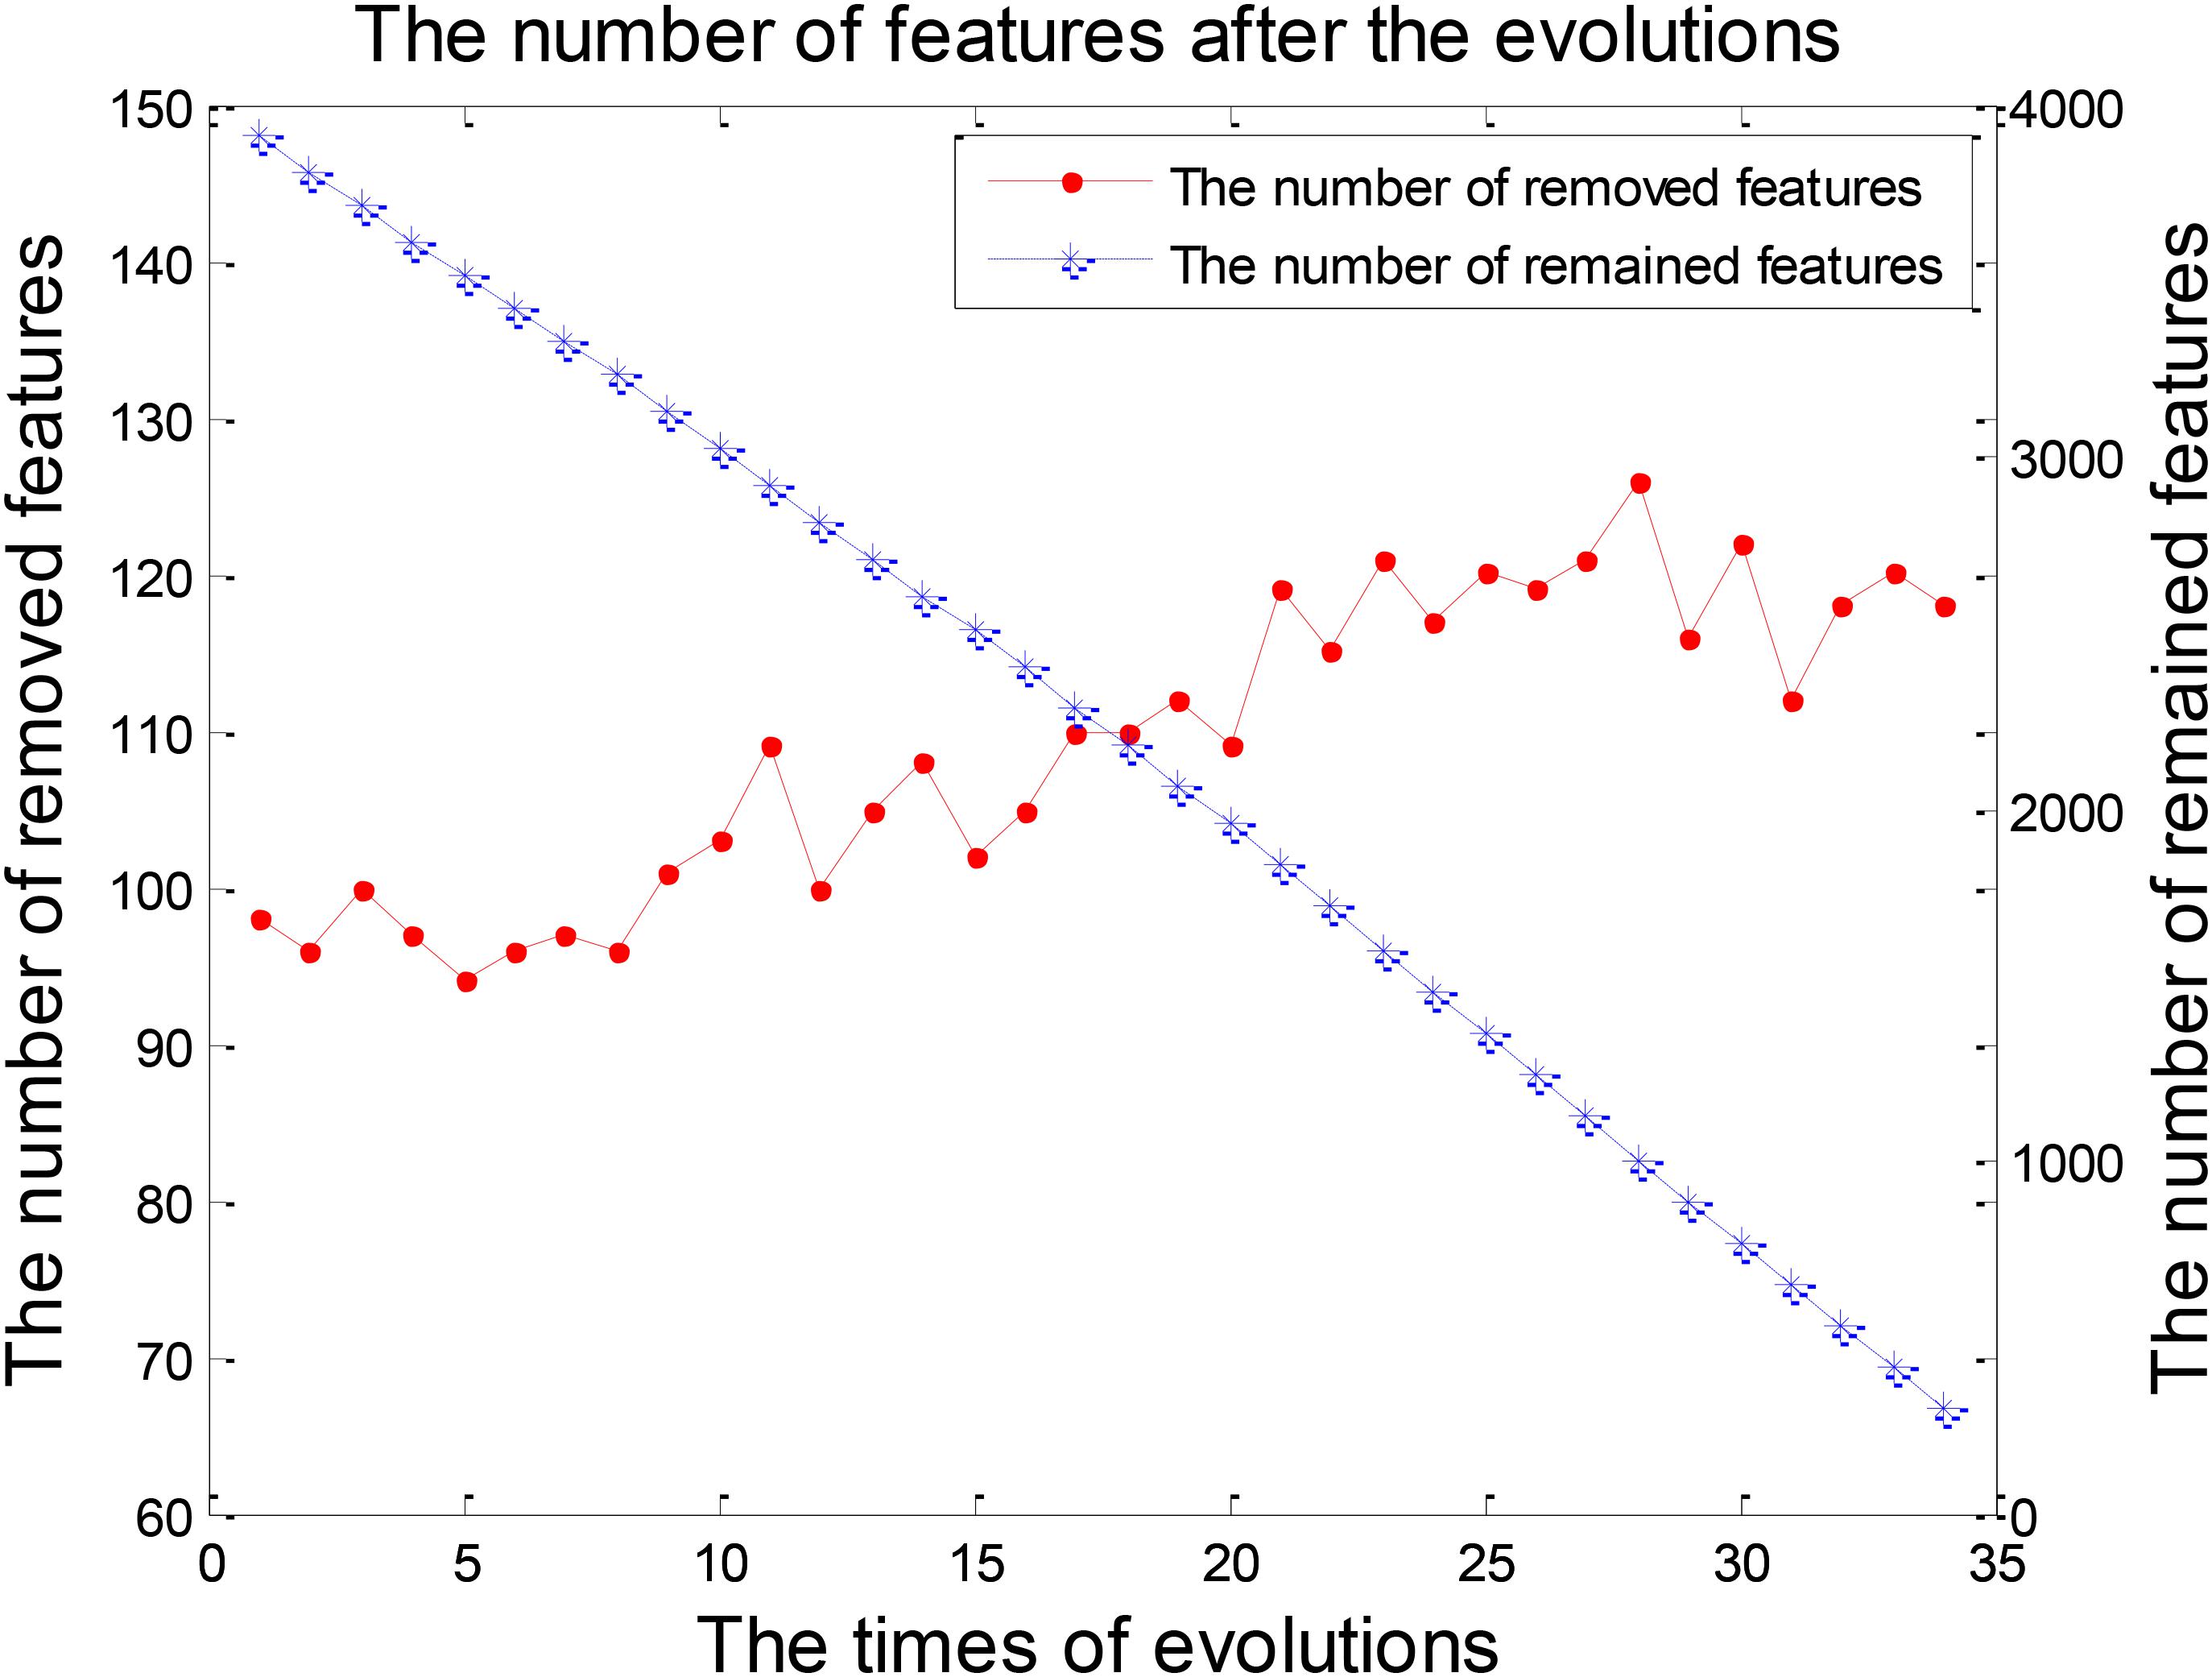
FIGURE 7. The numbers of features after each evolution in the experiment 2.
We were able to explore the most discriminative brain regions by counting the high-frequency FCs. The disease-related brain regions in LMCI/AD classification were ranked in the Table 3 and the ones exceeding the frequency of 10 were listed as follows: superior temporal gyrus (STG.R), parahippocampal gyrus (PHG.L), middle frontal gyrus, orbital part (ORBmid.R), calcarine fissure and surrounding cortex (CAL.R), insula (INS.L), temporal pole: middle temporal gyrus (TPOmid.R), and posterior cingulate gyrus (PCG.L). Similarly, some subregions of the temporal lobe and insula showed higher frequencies than other brain regions, suggesting the temporal lobe and insula made greater contributions to the evolution of AD. Figure 8 described the locations of brain regions.
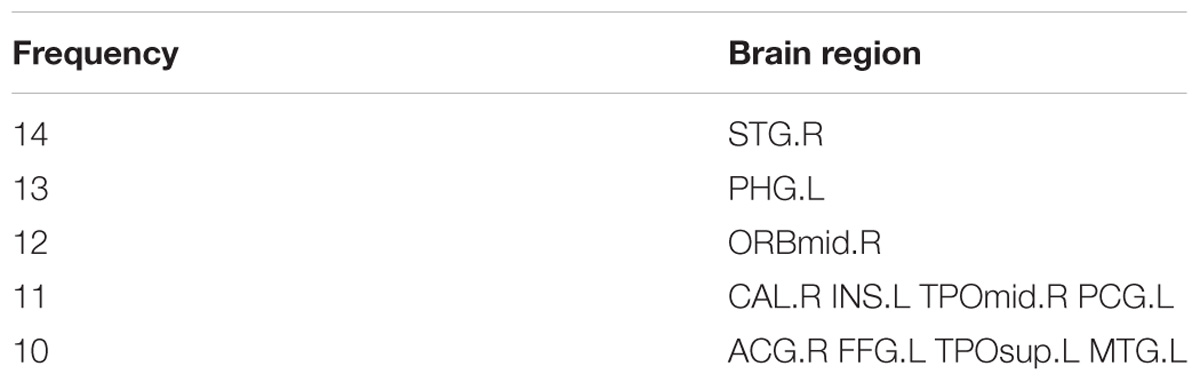
TABLE 3. The frequencies of the most discriminative brain regions in the experiment 2.
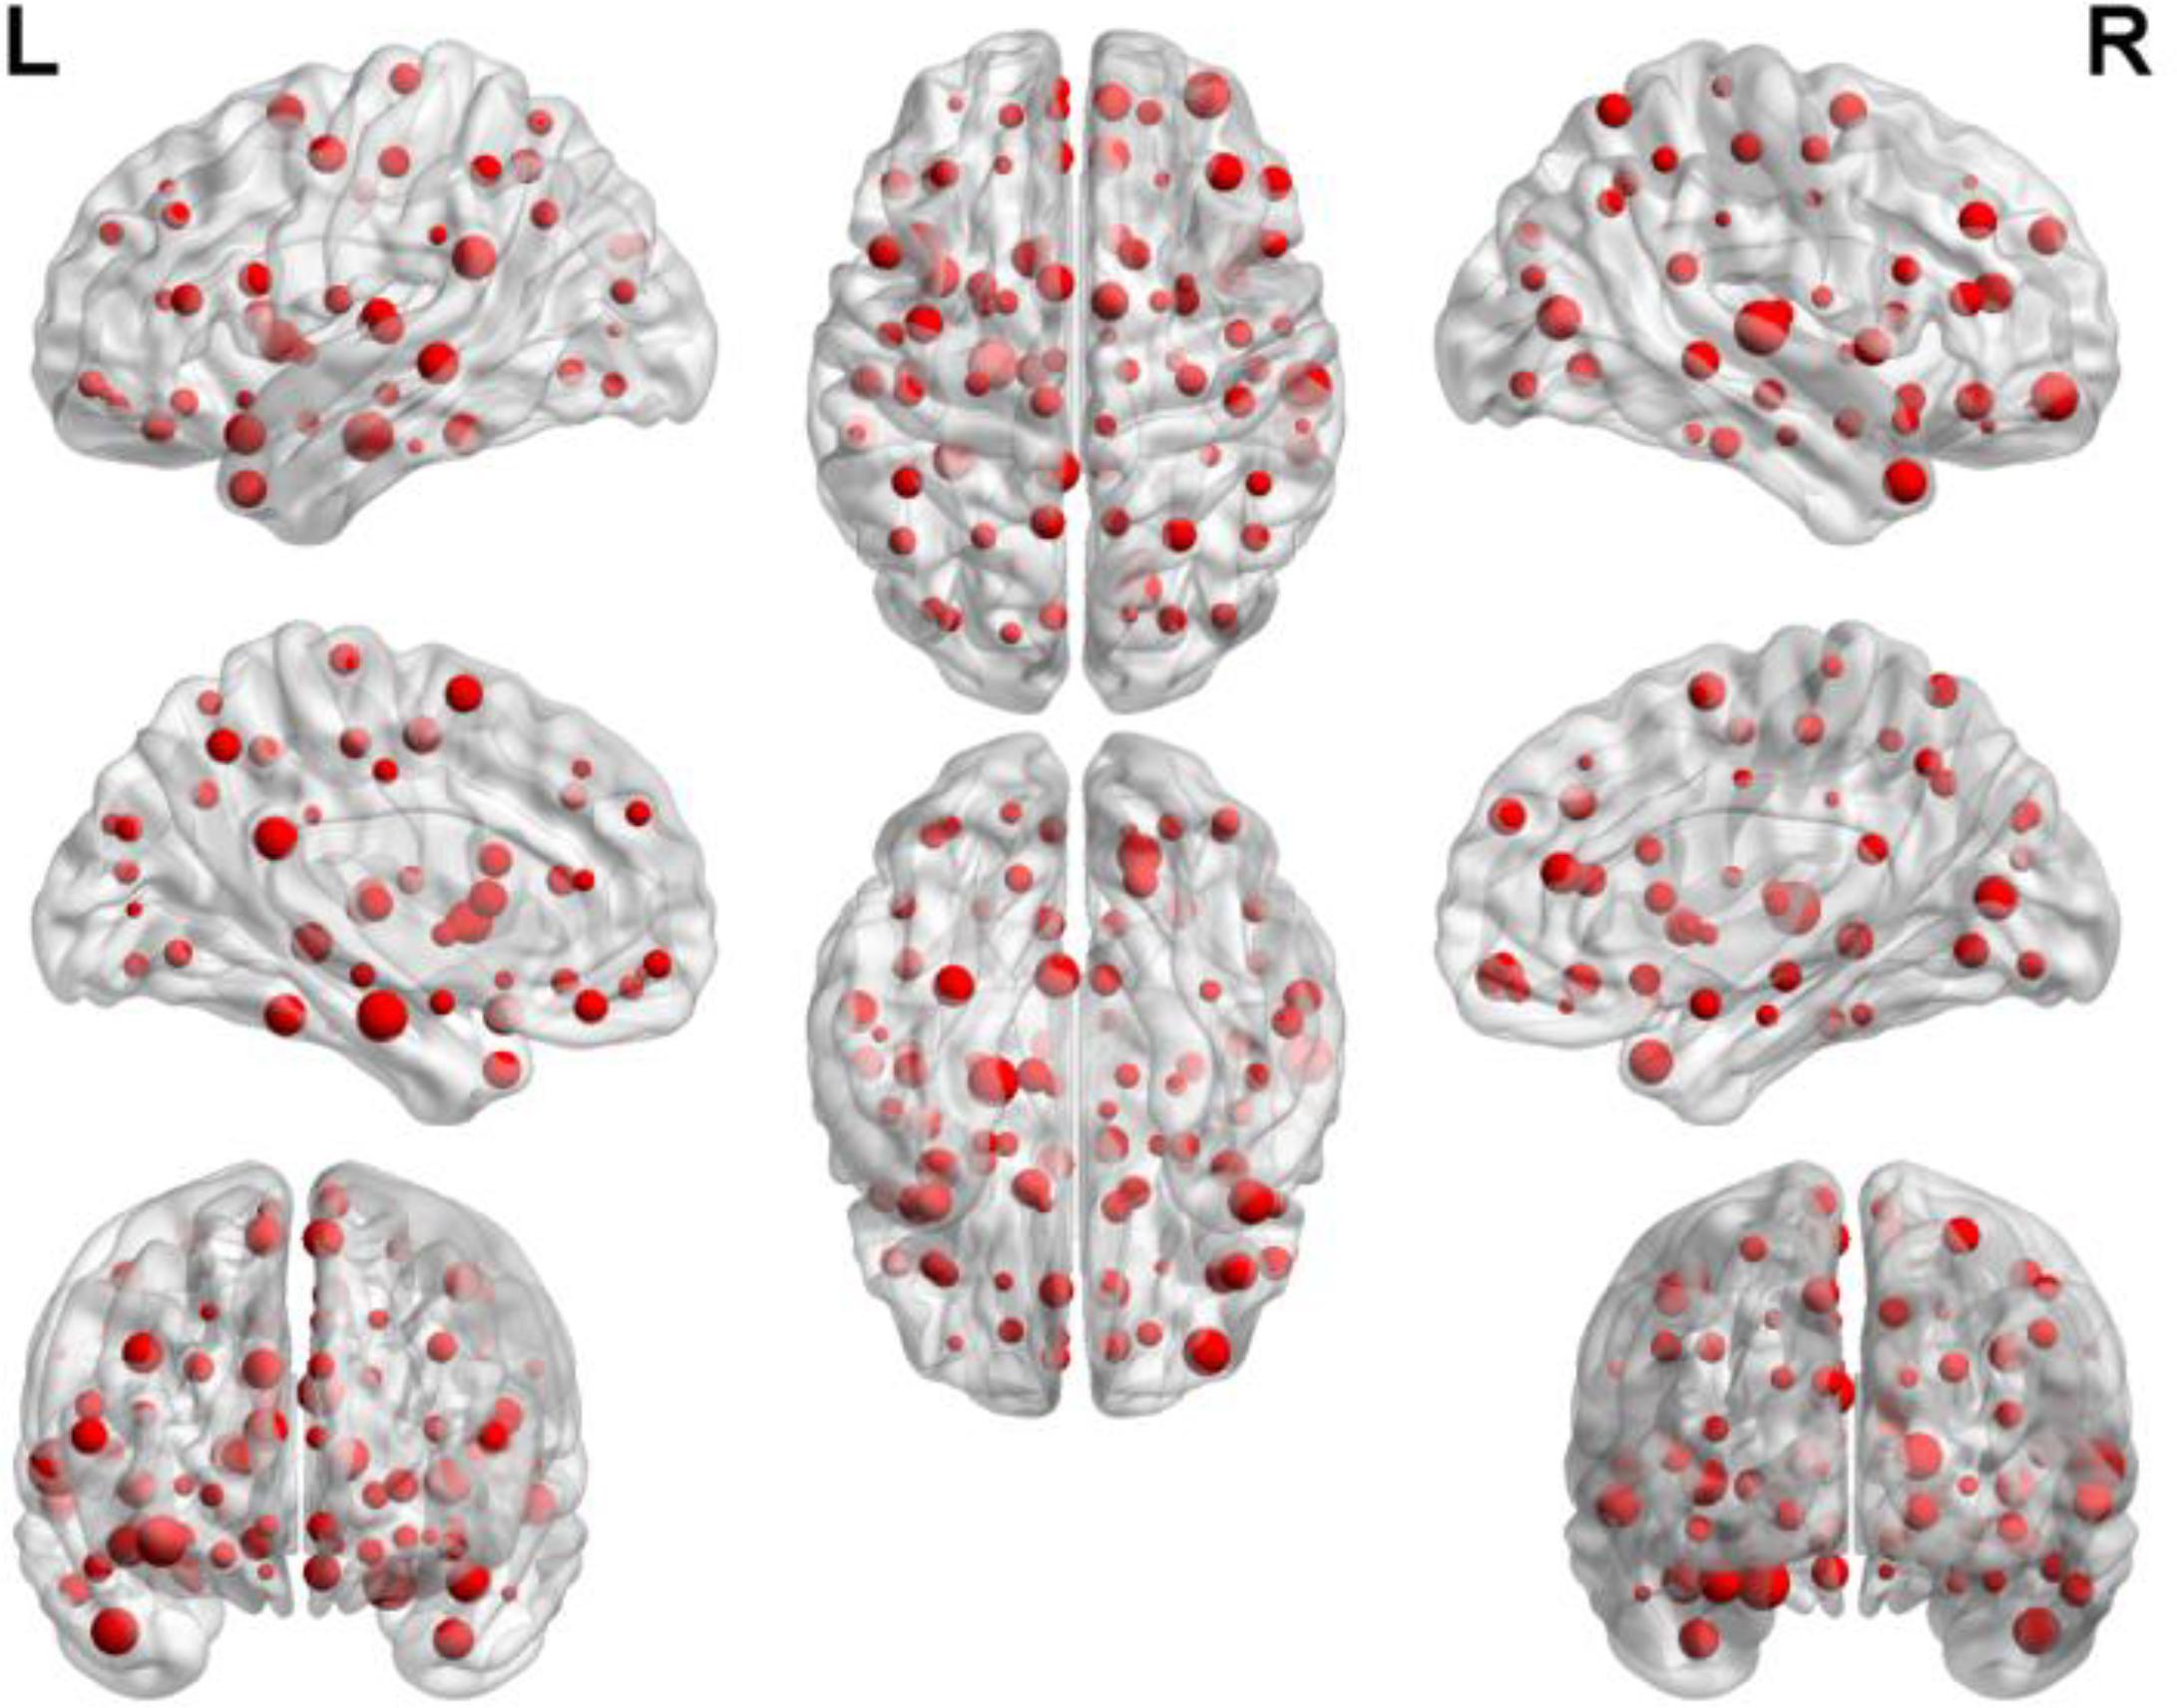
FIGURE 8. The locations of brain regions in the experiment 2.
Discussion
Classification Effect
In this paper, we propose an advanced framework of EWRSVMC based on resting-state fMRI data to accurately classify different stages of AD. Resting-state fMRI is an effective tool for exploring the dynamical changes in human brain because of the high temporal and spatial resolutions (Lee M.H. et al., 2016). In addition, to the best of our knowledge, no investigation is available about the EWRSVMC in AD studies using brain imaging data. The EWRSVMC is able to efficiently perform EMCI/LMCI and LMCI/AD classifications with the high accuracies of 90 and 88.89%, sensitivities of 90.9 and 85.71%, specificities of 88.89 and 90.9% respectively. The results of two groups of experiments demonstrate the availability of novel EWRSVMC algorithm for early detection of AD and the potential of resting-state fMRI for identification of the transition from EMCI to LMCI to AD.
The ML techniques have received increasingly growing attentions recently in imaging data (Zeng et al., 2014; Wang et al., 2017), and have been shown to be a reliable method to diagnose different cognitive stages of AD using neuroimaging data. Jiang et al. (2014) achieved a high accuracy around 80% for 56 EMCI versus 44 LMCI combining a sparse learning with the SVM classifier. Prasad et al. (2015) reported the accuracy of 63.4% for 74 EMCI vs. 38 LMCI using the SVM classifier with the feature set of the fiber network measures (FIN) and the flow network measures (FLN). Mahjoub et al. (2018) combined the proposed deep similarity network architectures with the single SVM classifier utilizing the cross-validation method to classify 41 AD from 36 LMCI with a classification accuracy peaking at 77.92%.
The majority of ML methods had the slightly lower classification performances especially classifying EMCI from LMCI because of image noise and small-sample size of data. In addition, a great deal of studies have paid more attention to the classification but rarely explored disease-related brain regions underlying the AD evolution. To address these issues, a new framework of EWRSVMC using the FCs as the raw features was presented in this paper. The output of EWRSVMC is a weighted average of the outputs of SVMs, which could further reduce classification error rate compared to some previous methodologies. Additionally, Due to the high dimensionality of feature space, the complexity of the algorithm is likely to be increased and the performance of model estimation is degraded. Accordingly, a method of evolution is employed to dynamically eliminate the redundant features and the features in the optimal EWRSVMC are regarded as the optimal features. Moreover, disease-related brain regions could be found out by identifying these features with high discriminative ability, which provides new insights in the pathology of AD.
The issue of overfitting is a major concern in the training process of our EWRSMC algorithm and more details about it are discussed here. In order to building an individual SVM classifier in EWRSVMC, the training set was randomly chosen out from the all experimental dataset and 62 FCs was randomly chosen out from total 4005 FCs as input features. Because of the randomness of samples and features, each SVM base classifier is greatly different from others, which could reduce the effects of overfitting. Furthermore, the EWRSVMC shows a good classification performance in the test set, suggesting a low risk of overfitting phenomenon.
In our proposed EWRSVMC, two hyperparameters, namely the penalty parameter C and the kernel bandwidth σ, need to be determined. Initially, we set parameter C and σ to Inf and 3 to train the individual RBF-SVM classifier. For comparison, we tested different values for C and σ and found no considerable changes in terms of the classification performances of the EWRSVMC, suggesting that the proposed EWRSVMC is considerably robust and universal.
Analysis of Higher-Frequency Brain Regions
In this part, we mainly discussed about four abnormal brain regions, i.e., temporal lobe, insula, superior frontal gyrus, and parahippocampal gyrus respectively.
The Temporal Lobe
Some subregions of the temporal lobe had relatively greater frequencies in both EMCI/LMCI and LMCI/AD classifications, indicating that the temporal lobe is likely to play a crucial role in AD progression. The temporal lobe is situated beneath the lateral sulcus on both hemispheres of the human cerebrum (Kiernan, 2012), which is known to be associated with visual memory, language comprehension, emotion association and executive function (Riley et al., 2010; Bell et al., 2011).
Several previous studies have reported the abnormal temporal lobe in AD progression. Younes et al. (2014) found that the volume of medial temporal lobe structures were relevant to time of progress from MCI to AD. Davatzikos et al. (2011) observed the positive baseline Spatial Pattern of Abnormalities for Recognition of Early AD in temporal lobe in patients with MCI who progressed to AD dementia. Stein et al. (2010) observed the temporal lobe volume differences in brain MRI scans of AD patients, MCI patients and healthy elderly participants. Douaud et al. (2013) found that the cerebral atrophy in medial temporal lobe was vulnerable to the AD progression. Blasko et al. (2008) reported the changes of medial temporal lobe atrophy (MTA) through the evolution from cognitive health to MCI and to AD in a prospective cohort of subjects aged 75 years. The discovery of abnormal temporal lobe may help to improve the understanding of AD progression.
The Insula
The insula had a relatively higher frequency than other brain regions in both EMCI/LMCI and LMCI/AD classifications as well, indicating that the insula may make a great contribution in the progression of AD. The insula is a crucial hub of the human brain networks and is folded deep in the floor of lateral sulcus (Cauda et al., 2011). It is reported that the human insula is involved in perception, motor control, general cognition and self-awareness (Kang et al., 2011; Chang et al., 2013).
The insula abnormality was reported in numerous previous literatures in AD pathology. Xie et al. (2012) found out the altered functional integration of the insula networks in AD development. Zhu et al. (2014) observed the significantly greater gray matter volume loss in the bilateral insula in the progression of conversion from HC to MCI to AD with a linear trend. Sojkova et al. (2008) reported the longitudinal alterations in regional cerebral blood flow which involved insula and superior temporal regions in AD progression. Hafkemeijer et al. (2012) mentioned that the patients diagnosed with AD exhibited extensive decreases in gray matter volume in insula and temporal lobe. Patel et al. (2013) reported that the default mode network (DMN) regions, e.g., insula and superior temporal gyrus, were significantly affected by AD pathology. The discovery of the insula abnormality may help to illuminate the underlying neuromechanism of AD disorder.
The Superior Frontal Gyrus
The superior frontal gyrus possessed a relatively higher frequency compared to other brain regions in the EMCI/LMCI classification, suggesting that the superior frontal gyrus made an important contribution to the evolution from EMCI to LMCI. The superior frontal gyrus (SFG) is situated at the frontal lobe’ superior part and makes up about one third of the prefrontal cortex of the human brain (Li et al., 2013). It has been reported that the superior frontal gyrus is associated with motor functions and cognitive control especially execution within working memory (Chiao et al., 2009; Van den Stock et al., 2011).
We have reviewed a great deal of previous literature about EMCI and LMCI, and found that there were relatively few studies to make inferences about the brain dynamic differences in the cognitive process from EMCI to LMCI. Accordingly, the discovery of abnormal superior frontal gyrus could be clinically helpful for early detection of AD evolution at MCI stage. Lee E.S. et al. (2016) showed the decreased FC in the right superior frontal gurus in patients with LMCI compared with EMCI, which was agreement with our finding.
The Parahippocampal Gyrus
The parahippocampal gyrus obtained a higher frequency in 90 brain regions in the LMCI/AD classification, indicating that the parahippocampal gyrus acted a crucial part in the evolution from LMCI to AD. The parahippocampal gyrus is a part of the limbic system (Enatsu et al., 2015; Arnone et al., 2016), which is involved in the memory encoding and retrieval (Puri et al., 2012; Monti et al., 2018).
Several previous studies have reported the parahippocampal gyrus abnormality in AD pathology. Liang et al. (2014) found out the altered amplitude of low-frequency fluctuations in right parahippocampal gyrus from LMCI and AD. Xiang et al. (2013) reported that AD patients showed less activity than MCI patients in the right parahippocampal gyrus during a visual memory task. Yetkin et al. (2006) mentioned that the AD group had less activation in bilateral parahippocampal gyri than the MCI group in a memory-encoding task. Echávarri et al. (2011) found out the significant differences of volumes of the parahippocampal gyrus between the groups with the following order: AD < aMCI < healthy. The discovery of parahippocampal gyrus abnormality may provide assistant for clinical diagnosis of early AD.
Limitations
The current study is limited by the following two factors. Firstly, we utilized one modality, i.e., RS-fMRI for multiple binary classifications. Nevertheless, there exist other modalities [e.g., cerebrospinal fluid (CSF) and positron emission tomography (PET)] which may also contain commentary information for better classification performance. Secondly, it is crucial to visualize the learned decision process for better understanding the classification approach and gaining clinicalinsights. However, as with most previous AD classification algorithms, the visualization of the learned decision process in our proposed EWRSVMC is not informative, which is still a limitation which is expected to be addressed in the future.
Ethics Statement
This study was carried out in accordance with the recommendations of National Institute of Aging-Alzheimer’s Association (NIA-AA) workgroup guidelines, Institutional Review Board (IRB). The study was approved by IRB of each participating site, including the Banner Alzheimer’s Institute, and was conducted in accordance with Federal Regulations, the Internal Conference on Harmonization (ICH), and Good Clinical Practices (GCP).
Author Contributions
X-aB proposed the design of the work and revised it critically for important intellectual content. QX and QS carried out the experiment for the work and drafted part of the work. XL and ZW collected, interpreted the data, and drafted part of the work. All the authors approved the final version to be published and agreed to be accountable for all aspects of the work in ensuring that questions related to the accuracy or integrity of any part of the work are appropriately investigated and resolved.
Funding
This work was supported by the National Natural Science Foundation of China (No. 61502167).
Conflict of Interest Statement
The authors declare that the research was conducted in the absence of any commercial or financial relationships that could be construed as a potential conflict of interest.
Footnotes
References
Arnone, D., Job, D., Selvaraj, S., Abe, O., Amico, F., Cheng, Y., et al. (2016). Computational meta-analysis of statistical parametric maps in major depression. Hum. Brain Mapp. 37, 1393–1404. doi: 10.1002/hbm.23108
Bell, B., Lin, J. J., Seidenberg, M., and Hermann, B. (2011). The neurobiology of cognitive disorders in temporal lobe epilepsy. Nat. Rev. Neurol. 7, 154–164. doi: 10.1038/nrneurol.2011.3
Bi, X.-A., Wang, Y., Shu, Q., Sun, Q., and Xu, Q. (2018). Classification of autism spectrum disorder using random support vector machine cluster. Front. Genet. 9:18. doi: 10.3389/fgene.2018.00018
Blasko, I., Jellinger, K., Kemmler, G., Krampla, W., Jungwirth, S., Wichart, I., et al. (2008). Conversion from cognitive health to mild cognitive impairment and Alzheimer’s disease: prediction by plasma amyloid beta 42, medial temporal lobe atrophy and homocysteine. Neurobiol. Aging 29, 1–11. doi: 10.1016/j.neurobiolaging.2006.09.002
Branca, C., and Oddo, S. (2017). Paving the way for new clinical trials for Alzheimer’s Disease. Biol. Psychiatry 81, 88–89. doi: 10.1016/j.biopsych.2016.10.016
Braun, U., Schäfer, A., Walter, H., Erk, S., Romanczuk-Seiferth, N., Haddad, L., et al. (2015). Dynamic reconfiguration of frontal brain networks during executive cognition in humans. Proc. Natl. Acad. Sci. U.S.A. 112, 11678–11683. doi: 10.1073/pnas.1422487112
Busato, A., Feruglio, P. F., Parnigotto, P. P., Marzola, P., and Sbarbati, A. (2016). In Vivo imaging techniques: a new era for histochemical analysis. Eur. J. Histochem. 60:2725. doi: 10.4081/ejh.2016.2725
Cauda, F., D’Agata, F., Sacco, K., Duca, S., Geminiani, G., and Vercelli, A. (2011). Functional connectivity of the insula in the resting brain. Neuroimage 55, 8–23. doi: 10.1016/j.neuroimage.2010.11.049
Chang, L. J., Yarkoni, T., Khaw, M. W., and Sanfey, A. G. (2013). Decoding the role of the insula in human cognition: functional parcellation and large-scale reverse inference. Cereb. Cortex 23, 739–749. doi: 10.1093/cercor/bhs065
Chiao, J. Y., Harada, T., Komeda, H., Li, Z., Mano, Y., Saito D., et al. (2009). Neural basis of individualistic and collectivistic views of self. Hum. Brain Mapp. 30, 2813–2820. doi: 10.1002/hbm.20707
Cortes-Canteli, M., Mattei, L., Richards, A. T., Norris, E. H., and Strickland, S. (2015). Fibrin deposited in the Alzheimer’s disease brain promotes neuronal degeneration. Neurobiol. Aging 36, 608–617. doi: 10.1016/j.neurobiolaging.2014.10.030
Cui, X., Xiang, J., Guo, H., Yin, G., Zhang, H., Lan, F., et al. (2018). Classification of Alzheimer’s Disease, mild cognitive impairment, and normal controls with subnetwork selection and graph kernel principal component analysis based on minimum spanning tree brain functional network. Front. Computat. Neurosci. 12:31. doi: 10.3389/fncom.2018.00031
Dan, L., Peiyu, H., Yufeng, Z., Yuting, L., Zhidong, C., Quanquan, G., et al. (2017). Abnormal baseline brain activity in Parkinson’s disease with and without REM sleep behavior disorder: a resting-state functional MRI study. J. Magn. Reson. Imaging 46, 697–703. doi: 10.1002/jmri.25571
Davatzikos, C., Bhatt, P., Shaw, L. M., Batmanghelich, K. N., and Trojanowski, J. Q. (2011). Prediction of MCI to AD conversion, via MRI, CSF biomarkers, and pattern classification. Neurobiol. Aging 32, 2322.e19–2322.e27. doi: 10.1016/j.neurobiolaging.2010.05.023
dos Santos Siqueira, A., Biazoli Junior, C. E., Comfort, W. E., Rohde, L. A., and Sato, J. R. (2014). Abnormal functional resting-state networks in ADHD: graph theory and pattern recognition analysis of fMRI data. BioMed Res. Int. 2014:380531. doi: 10.1155/2014/380531
Douaud, G., Refsum, H., de Jager, C. A., Jacoby, R. E., Nichols, T., Smith, S. M., et al. (2013). Preventing Alzheimer’s disease-related gray matter atrophy by B-vitamin treatment. Proc. Natl. Acad. Sci. U.S.A. 110, 9523–9528. doi: 10.1073/pnas.1301816110
Echávarri, C., Aalten, P., Uylings, H. B., Jacobs, H. I., Visser, P. J., Gronenschild, E. H., et al. (2011). Atrophy in the parahippocampal gyrus as an early biomarker of Alzheimer’s disease. Brain Struct. Funct. 215, 265–271. doi: 10.1007/s00429-010-0283-8
Enatsu, R., Gonzalez-Martinez, J., Bulacio, J., Kubota, Y., Mosher, J., Burgess, R. C., et al. (2015). Connections of the limbic network: a corticocortical evoked potentials study. Cortex 62, 20–33. doi: 10.1016/j.cortex.2014.06.018
Forster, A. B., Abeywickrema, P., Bunda, J., Cox, C. D., Cabalu, T. D., Egbertson, M., et al. (2017). The identification of a novel lead class for phosphodiesterase 2 inhibition by fragment-based drug design. Bioorgan. Med. Chem. Lett. 27, 5167–5171. doi: 10.1016/j.bmcl.2017.10.054
Goense, J., Bohraus, Y., and Logothetis, N. K. (2016). fMRI at high spatial resolution: implications for BOLD-Models. Front. Computat. Neurosci. 10:66. doi: 10.3389/fncom.2016.00066
Goryawala, M., Zhou, Q., Barker, W., Loewenstein, D. A., Duara, R., and Adjouadi, M. (2015). Inclusion of neuropsychological scores in atrophy models improves diagnostic classification of Alzheimer’s disease and Mild Cognitive Impairment. Intell. Neurosci. 2015:865265. doi: 10.1155/2015/865265
Hafkemeijer, A., van der Grond, J., and Rombouts, S. A. R. B. (2012). Imaging the default mode network in aging and dementia. Biochimica Biophysica Acta 1822, 431–441. doi: 10.1016/j.bbadis.2011.07.008
Jiang, X., Zhang, X., and Zhu, D. (2014). Intrinsic functional component analysis via sparse representation on Alzheimer’s disease neuroimaging initiative database. Brain Connect. 4, 575–586. doi: 10.1089/brain.2013.0221
Jie, B., Liu, M., and Shen, D. (2018). Integration of temporal and spatial properties of dynamic connectivity networks for automatic diagnosis of brain disease. Med. Image Anal. 47, 81–94. doi: 10.1016/j.media.2018.03.013
Kang, Y., Williams, L. E., Clark, M. S., Gray, J. R., and Bargh, J. A. (2011). Physical temperature effects on trust behavior: the role of insula. Soc. Cogn. Affect. Neurosci. 6, 507–515. doi: 10.1093/scan/nsq077
Keren-Shaul, H., Spinrad, A., Weiner, A., Matcovitch-Natan, O., Dvir-Szternfeld, R., Ulland, T. K., et al. (2017). A unique microglia type associated with restricting development of Alzheimer’s Disease. Cell 169, 1276.e17–1290.e17. doi: 10.1016/j.cell.2017.05.018
Kiernan, J. A. (2012). Anatomy of the temporal lobe. Epilepsy Res. Treat. 2012:176157. doi: 10.1155/2012/176157
Kodis, E. J., Choi, S., Swanson, E., Ferreira, G., and Bloom, G. S. (2018). N-methyl-D-aspartate receptor–mediated calcium influx connects amyloid-β oligomers to ectopic neuronal cell cycle reentry in Alzheimer’s disease. Alzheimers Dement. (in press). doi: 10.1016/j.jalz.2018.05.017
Kumar, T. S., and Helenprabha, K. (2017). Top-Hat transform based retinal nerve fiber layer thickness measurement for Alzheimer detection using OCT images. J. Computat. Theor. Nanosci. 14, 1499–1505. doi: 10.1166/jctn.2017.6434
Lee, E. S., Yoo, K., Lee, Y.-B., Chung, J., Lim, J.-E., Yoon, B., et al. (2016). Default mode network functional connectivity in early and late mild cognitive impairment: results from the Alzheimer’s Disease neuroimaging initiative. Alzheimer Dis. Assoc. Disord. 30, 289–296. doi: 10.1097/wad.0000000000000143
Lee, M. H., Miller-Thomas, M. M., Benzinger, T. L., Marcus, D. S., Hacker, C. D., Leuthardt, E. C., et al. (2016). Clinical resting-state fMRI in the preoperative setting: are we ready for prime time? Top. Magn. Reson. Imaging 25, 11–18. doi: 10.1097/RMR.0000000000000075
Lee, P., Ryoo, H., Park, J., and Jeong, Y. (2017). Morphological and microstructural changes of the hippocampus in early MCI: a study utilizing the Alzheimer’s Disease neuroimaging initiative database. J. Clin. Neurol. 13, 144–154. doi: 10.3988/jcn.2017.13.2.144
Li, W., Qin, W., Liu, H., Fan, L., Wang, J., Jiang, T., et al. (2013). Subregions of the human superior frontal gyrus and their connections. Neuroimage 78, 46–58. doi: 10.1016/j.neuroimage.2013.04.011
Liang, P., Xiang, J., Liang, H., Qi, Z., Li, K., and Alzheimer’s Disease NeuroImaging, Initiative. (2014). Altered amplitude of low-frequency fluctuations in early and late mild cognitive impairment and Alzheimer’s disease. Curr. Alzheimer Res. 11, 389–398. doi: 10.2174/1567205011666140331225335
Liu, L., Chen, S., Zeng, D., Li, H., Shi, C., and Zhang, L. (2018). Cerebral activation effects of acupuncture at Yanglinquan(GB34) point acquired using resting-state fMRI. Comput. Med. Imaging Graph. 67, 55–58. doi: 10.1016/j.compmedimag.2018.04.004
Mahjoub, I., Mahjoub, M. A., and Rekik, I. (2018). Brain multiplexes reveal morphological connectional biomarkers fingerprinting late brain dementia states. Sci. Rep. 8:4103. doi: 10.1038/s41598-018-21568-7
Mondal, S., and Pai, P. P. (2014). Chou×s pseudo amino acid composition improves sequence-based antifreeze protein prediction. J. Theor. Biol. 356, 30–35. doi: 10.1016/j.jtbi.2014.04.006
Monti, D. A., Tobia, A., Stoner, M., Wintering, N., Matthews, M., Conklin, C. J., et al. (2018). Changes in cerebellar functional connectivity and autonomic regulation in cancer patients treated with the neuro emotional technique for traumatic stress symptoms. J. Cancer Survivorsh. 12, 145–153. doi: 10.1007/s11764-017-0653-9
Moradi, E., Pepe, A., Gaser, C., Huttunen, H., and Tohka, J. (2015). Machine learning framework for early MRI-based Alzheimer’s conversion prediction in MCI subjects. Neuroimage 104, 398–412. doi: 10.1016/j.neuroimage.2014.10.002
Morris, J. K., Vidoni, E. D., Honea, R. A., and Burns, J. M. (2014). Impaired glycemia increases disease progression in mild cognitive impairment. Neurobiol. Aging 35, 585–589. doi: 10.1016/j.neurobiolaging.2013.09.033
Noble, S., Scheinost, D., Finn, E. S., Shen, X., Papademetris, X., McEwen, S. C., et al. (2017). Multisite reliability of MR-based functional connectivity. Neuroimage 146, 959–970. doi: 10.1016/j.neuroimage.2016.10.020
Novak, P., Schmidt, R., Kontsekova, E., Zilka, N., Kovacech, B., Skrabana, R., et al. (2017). Safety and immunogenicity of the tau vaccine AADvac1 in patients with Alzheimer’s disease: a randomised, double-blind, placebo-controlled, phase 1 trial. Lancet Neurol. 16, 123–134. doi: 10.1016/S1474-4422(16)30331-3
Nozadi, S. H., Kadoury, S., and The Alzheimer’s Disease Neuroimaging Initiative (2018). Classification of Alzheimer’s and MCI patients from semantically parcelled PET Images: a comparison between AV45 and FDG-PET. Int. J. Biomed. Imaging 2018:1247430. doi: 10.1155/2018/1247430
Nuttall, R., Pasquini, L., Scherr, M., and Sorg, C. (2016). Degradation in intrinsic connectivity networks across the Alzheimer’s disease spectrum. Alzheimer’s Dementia 5, 35–42. doi: 10.1016/j.dadm.2016.11.006
Patel, K. T., Stevens, M. C., Pearlson, G. D., Winkler, A. M., Hawkins, K. A., Skudlarski, P., et al. (2013). Default mode network activity and white matter integrity in healthy middle-aged ApoE4 carriers. Brain Imaging Behav. 7, 60–67. doi: 10.1007/s11682-012-9187-y
Phillips, M. L. (2012). Neuroimaging in psychiatry: bringing neuroscience into clinical practice. Br. J. Psychiatry 201, 1–3. doi: 10.1192/bjp.bp.112.109587
Prasad, G., Joshi, S. H., Nir, T. M., Toga, A. W., and Thompson, P. M. (2015). Brain connectivity and novel network measures for Alzheimer’s disease classification. Neurobiol. Aging 36, S121–S131. doi: 10.1016/j.neurobiolaging.2014.04.037
Puri, B. K., Jakeman, P. M., Agour, M., Gunatilake, K. D. R., Fernando, K. A. C., Gurusinghe, A. I., et al. (2012). Regional grey and white matter volumetric changes in myalgic encephalomyelitis (chronic fatigue syndrome): a voxel-based morphometry 3 T MRI study. Br. J. Radiol. 85, e270–e273. doi: 10.1259/bjr/93889091
Riley, J. D., Franklin, D. L., and Choi, V. (2010). Altered white matter integrity in temporal lobe epilepsy: association with cognitive and clinical profiles. Epilepsia 51, 536–545. doi: 10.1111/j.1528-1167.2009.02508.x
Rolls, E. T., Joliot, M., and Tzourio-Mazoyer, N. (2015). Implementation of a new parcellation of the orbitofrontal cortex in the automated anatomical labeling atlas. Neuroimage 122, 1–5. doi: 10.1016/j.neuroimage.2015.07.075
Rosa, M. J., Portugal, L., Hahn, T., Fallgatter, A. J., Garrido, M. I., Shawe-Taylor, J., et al. (2015). Sparse network-based models for patient classification using fMRI. Neuroimage 105, 493–506. doi: 10.1016/j.neuroimage.2014.11.021
Roy, D. S., Arons, A., Mitchell, T. I., Pignatelli, M., Ryan, T. J., and Tonegawa, S. (2016). Memory retrieval by activating engram cells in mouse models of early Alzheimer’s disease. Nature 531, 508–512. doi: 10.1038/nature17172
Schröder, J., Girirajan, S., Papenfuss, A. T., and Medvedev, P. (2015). Improving the power of structural variation detection by augmenting the reference. PLoS One 10:e0136771. doi: 10.1371/journal.pone.0136771
Sojkova, J., Beason-Held, L., Zhou, Y., An, Y., Kraut, M. A., Ye, W., et al. (2008). Longitudinal cerebral blood flow and amyloid deposition: an emerging pattern? J. Nuclear Med. 49, 1465–1471. doi: 10.2967/jnumed.108.051946
Stein, J. L., Hua, X., Morra, J. H., Lee, S., Hibar, D. P., Ho, A. J., et al. (2010). Genome-wide analysis reveals novel genes influencing temporal lobe structure with relevance to neurodegeneration in Alzheimer’s disease. Neuroimage 51, 542–554. doi: 10.1016/j.neuroimage.2010.02.068
Thanh Vu, A., Jamison, K., Glasser, M. F., Smith, S. M., Coalson, T., Moeller, S., et al. (2017). Tradeoffs in pushing the spatial resolution of fMRI for the 7T human connectome project. Neuroimage 154, 23–32. doi: 10.1016/j.neuroimage.2016.11.049
Van den Stock, J., Tamietto, M., Sorger, B., Pichon, S., Grézes, J., and de Gelder, B. (2011). Cortico-subcortical visual, somatosensory, and motor activations for perceiving dynamic whole-body emotional expressions with and without striate cortex (V1). Proc. Natl. Acad. Sci. U.S.A. 108, 16188–16193. doi: 10.1073/pnas.1107214108
Wang, T., Bhuiyan, M. Z. A., Wang, G., Rahman, M. A., Wu, J., and Cao, J. (2018). Big data reduction for a smart city’s critical infrastructural health monitoring. IEEE Commun. Mag. 56, 128–133. doi: 10.1109/MCOM.2018.1700303
Wang, T., Zeng, J., Lai, Y., Cai, Y., Tian, H., Chen, Y., et al. (2017). Data collection from WSNs to the cloud based on mobile Fog elements. Fut. Gen. Comput. Syst. (in press). doi: 10.1016/j.future.2017.07.031
Xiang, J., Guo, H., Cao, R., Liang, H., and Chen, J. (2013). An abnormal resting-state functional brain network indicates progression towards Alzheimer’s disease. Neural Regen. Res. 8, 2789–2799. doi: 10.3969/j.issn.1673-5374.2013.30.001
Xie, C., Bai, F., Yu, H., Shi, Y., Yuan, Y., Chen, G., et al. (2012). Abnormal insula functional network is associated with episodic memory decline in amnestic mild cognitive impairment. Neuroimage 63, 320–327. doi: 10.1016/j.neuroimage.2012.06.062
Yetkin, F. Z., Rosenberg, R. N., Weiner, M. F., Purdy, P. D., and Cullum, C. M. (2006). FMRI of working memory in patients with mild cognitive impairment and probable Alzheimer’s disease. Eur. Radiol. 16, 193–206. doi: 10.1007/s00330-005-2794-x
Younes, L., Albert, M., and Miller, M. I. (2014). Inferring changepoint times of medial temporal lobe morphometric change in preclinical Alzheimer’s disease. Neuroimage 5, 178–187. doi: 10.1016/j.nicl.2014.04.009
Zeng, N., Wang, Z., Zineddin, B., Li, Y., Du, M., Xiao, L., et al. (2014). Image-Based quantitative analysis of gold immunochromatographic strip via cellular neural network approach. IEEE Trans. Med. Imaging 33, 1129–1136. doi: 10.1109/TMI.2014.2305394
Zeng, N., Zhang, H., Li, Y., Liang, J., and Dobaie, A. M. (2017). Denoising and deblurring gold immunochromatographic strip images via gradient projection algorithms. Neurocomputing 247, 165–172. doi: 10.1016/j.neucom.2017.03.056
Zeng, N., Zhang, H., Song, B., Liu, W., Li, Y., and Dobaie, A. M. (2018). Facial expression recognition via learning deep sparse autoencoders. Neurocomputing 273, 643–649. doi: 10.1016/j.neucom.2017.08.043
Keywords: Alzheimer’s disease progression, functional connectivity, classification, disease-related brain regions, evolutionary weighted random support vector machine cluster
Citation: Bi X-a, Xu Q, Luo X, Sun Q and Wang Z (2018) Analysis of Progression Toward Alzheimer’s Disease Based on Evolutionary Weighted Random Support Vector Machine Cluster. Front. Neurosci. 12:716. doi: 10.3389/fnins.2018.00716
Received: 10 August 2018; Accepted: 19 September 2018;
Published: 08 October 2018.
Edited by:
Nianyin Zeng, Xiamen University, ChinaReviewed by:
Tian Wang, Huaqiao University, ChinaLi Xiao Yan, The Sixth Affiliated Hospital of Sun Yat-sen University, China
Copyright © 2018 Bi, Xu, Luo, Sun and Wang. This is an open-access article distributed under the terms of the Creative Commons Attribution License (CC BY). The use, distribution or reproduction in other forums is permitted, provided the original author(s) and the copyright owner(s) are credited and that the original publication in this journal is cited, in accordance with accepted academic practice. No use, distribution or reproduction is permitted which does not comply with these terms.
*Correspondence: Xia-an Bi, bixiaan@hnu.edu.cn