 Tobias Eckrich1
 Kerstin Blum
 Ivan Milenkovic
 Jutta Engel
- 1Department of Biophysics, Center for Integrative Physiology and Molecular Medicine (CIPMM), Saarland University, School of Medicine, Homburg, Germany
- 2Carl-Ludwig-Institute for Physiology, Faculty of Medicine, University of Leipzig, Leipzig, Germany
Before the onset of hearing, which occurs around postnatal day 12 (P12) in mice, inner hair cells (IHCs) of the immature cochlea generate sound-independent Ca2+ action potentials (APs), which stimulate the auditory pathway and guide maturation of neuronal circuits. During these early postnatal days, intercellular propagating Ca2+ waves elicited by ATP-induced ATP release are found in inner supporting cells (ISCs). It is debated whether IHCs are able to fire Ca2+ APs independently or require a trigger by an ISC Ca2+ wave. To identify the Ca2+ transients of IHCs underlying Ca2+ APs and to analyze their dependence on ISC Ca2+ waves, we performed fast Ca2+ imaging of Fluo-8 AM-loaded organs of Corti at P4/P5. Fast Ca2+ transients (fCaTs) generated by IHCs were simultaneously imaged with Ca2+ waves in ISCs. ISC Ca2+ waves frequently evoked bursts consisting of >5 fCaTs in multiple adjacent IHCs. Although Ca2+ elevations of small amplitude appeared to be triggered by ISC Ca2+ waves in IHCs of Cav1.3 knockout mice we never observed fCaTs, indicating their requirement for Ca2+ influx through Cav1.3 channels. The Ca2+ wave-triggered Ca2+ upstroke in wildtype IHCs occurred 0.52 ± 0.27 s later than the rise of the Ca2+ signal in the adjacent ISCs. In comparison, superfusion of 1 μM ATP elicited bursts of fCaTs in IHCs starting 0.99 ± 0.34 s prior to Ca2+ elevations in adjacent ISCs. PPADS irreversibly abolished Ca2+ waves in ISCs and reversibly reduced fCaTs in IHCs indicating differential involvement of P2 receptors. IHC and ISC Ca2+ signals were however unaltered in P2X2R/P2X3R double knockout or in P2X7R knockout mice. Together, our data revealed a fairly similar occurrence of fCaTs within a burst (56.5%) compared with 43.5% as isolated single fCaTs or in groups of 2–5 fCaTs (minibursts). We provide evidence that IHCs autonomously generate single fCaTs and minibursts whereas bursts synchronized between neighboring IHCs were mostly triggered by ISC Ca2+ waves. Neonatal IHCs thus spontaneously generate electrical and Ca2+ activity, which is enhanced and largely synchronized by activity of ISCs of Kölliker’s organ indicating two sources of spontaneous activity in the developing auditory system.
Introduction
Inner Hair Cells (IHCs) generate Ca2+ action potentials (APs) in the absence of sound before the onset of hearing, which in mice occurs around postnatal day 12 (P12). These APs translate into release of glutamate (Kros et al., 1998; Brandt et al., 2003, 2007; Marcotti et al., 2003b; Johnson et al., 2007, 2011, 2013; Sendin et al., 2014), initiate excitatory postsynaptic potentials and APs in spiral ganglion neurons (Glowatzki and Fuchs, 2002) and activate the afferent auditory pathway (Tritsch et al., 2010; Clause et al., 2014). Experience-independent structured electrical activity is a common phenomenon in developing sensory systems, thought to contribute to maturation of synapses, ion channel expression and refinement of neuronal networks (Shatz, 1996; Stellwagen and Shatz, 2002; Moody and Bosma, 2005; Blankenship and Feller, 2010; Leighton and Lohmann, 2016).
It is debated whether IHCs generate Ca2+ APs autonomously (Kros et al., 1998; Brandt et al., 2003, 2007; Marcotti et al., 2003b; Johnson et al., 2007, 2011, 2013, 2017; Sendin et al., 2014) or require Ca2+ waves of inner supporting cells (ISCs) as a trigger (Tritsch et al., 2007, 2010; Tritsch and Bergles, 2010; Wang et al., 2015). The immature cochlea contains Kölliker’s organ, which harbors tall cylindrical cells that spontaneously generate intercellular Ca2+ waves (Tritsch et al., 2007; Anselmi et al., 2008; Majumder et al., 2010; Mammano and Bortolozzi, 2018). Wave propagation is sustained by ATP-dependent ATP release: extracellular ATP releases intracellular Ca2+ through a P2Y receptor-IP3-dependent mechanism. In turn, the rise in [Ca2+]i increases the open probability of connexin hemichannels for ATP, which are located at the endolymphatic surface of the ISCs (Tritsch et al., 2007; Anselmi et al., 2008; Majumder et al., 2010; Mammano and Bortolozzi, 2018). IP3 may also contribute to wave propagation by diffusing through gap junctions to ISC neighbors (Anselmi et al., 2008; Majumder et al., 2010; Ceriani et al., 2016b).
ISC Ca2+ waves may trigger Ca2+ APs in IHCs by two potential mechanisms: (i) ATP-induced depolarization to the threshold for regenerative APs (Tritsch et al., 2007; Johnson et al., 2011) mediated by P2X2R, P2X3R and P2X7R (Brändle et al., 1999; Nikolic et al., 2003; Housley et al., 2006; Huang et al., 2010) or (ii) [Ca2+]i-dependent activation of TMEM-16A channels in ISCs that allow Cl− efflux followed by efflux of K+ and water (Wang et al., 2015). The resulting increase in extracellular K+ may sufficiently depolarize IHCs to evoke Ca2+ APs. Accordingly, a Ca2+ wave in the ISC compartment would elicit synchronized bursts of Ca2+ APs in neighboring IHCs (Wang et al., 2015).
Although IHC Ca2+ APs, which are based on regenerative opening of Cav1.3 Ca2+ channels, Kv and SK2 K+ channels, have been analyzed in depth by patch-clamp recordings (Brandt et al., 2003; Marcotti et al., 2003b; Johnson et al., 2007, 2011, 2013, 2017; Sendin et al., 2014) the accompanying Ca2+ transients in IHCs have not been studied so far. Moreover, we still lack simultaneous imaging data resolving the temporal and spatial correlation between fast Ca2+ transients in IHCs and Ca2+ waves in ISCs. We therefore conducted Ca2+ imaging in the immature mouse organ of Corti to determine whether Ca2+ transients in IHCs occur independent of ISC Ca2+ waves.
Materials and Methods
Animals
All experimental procedures were conducted in agreement with the European Communities Council Directive (2010/63/EU) in accordance with the German law on the use of laboratory animals and were approved by the Saxonian District Government, Leipzig (TVV59/16 and T34/16), and the regional board for scientific animal experiments of the Saarland. Prehearing mice (P4–P6) of either sex were studied. NMRI mice (Charles River, Sulzfeld, Germany and bred in-house; 64 animals) were used unless stated otherwise and are designated as controls. Cav1.3−/− mice (Platzer et al., 2000), which were bred to either C57BL6/N (seven animals) or NMRI background (13 animals) for >10 generations, mice deficient for the purinergic receptor P2X7 (P2X7R−/− mice; The Jackson Laboratories, Bar Harbor, ME, USA; 21 animals) and P2X2R/P2X3R double knockout mice (P2X2R−/−/P2X3R−/−; 20 animals; Cockayne et al., 2005) both on C57BL6/N background were used. Every experimental observation was confirmed in at least three experiments using different animals.
Tissue Preparation
Neonatal mice were sacrificed by decapitation. Cochleae were immediately dissected in ice-cold physiological solution mimicking perilymph (in mM): 143 NaCl, 5.8 KCl, 1.3 CaCl2, 0.9 MgCl2, 5.6 glucose, 10 HEPES and 0.9 NaH2PO4, 305 mOsm/l, pH 7.35. The organ of Corti was dissected out of the cochlea with great care to preserve the integrity of the tissue. The apical turn was cut and placed in a recording chamber underneath a soft thread of a nylon mesh, which was attached to a steel ring (Figure 1). Nylon threads had an average distance to the recording window of 253 ± 47 μm (determined for 26 recordings). After cautiously removing the tectorial membrane, the specimen was incubated in the perilymph-like solution containing 10 μM of the cell-permeable Ca2+ indicator Fluo-8® AM (AAT Bioquest Inc., Sunnyvale, CA, USA) that had been dissolved in a Pluronic-DMSO mixture (100 mg/ml; Thermo Fisher Scientific Inc., Waltham, MA, USA). To allow for uptake of Fluo-8 AM and hydrolysis, the recording chamber with the tissue was kept in a dark, humid plastic box for 40 min at room temperature. The chamber was mounted on the stage of the upright laser scanning microscope LSM 710 (Zeiss Microscopy GmbH, Göttingen, Germany) and perfused with perilymph-like solution for at least 7 min to remove any Fluo-8 AM prior to the experiment. Only healthy looking epithelia with smooth surfaces, absence of vacuoles and low background fluorescence in both IHCs and ISCs were used for imaging (Figure 2A). IHCs were recorded within a fractional distance of 10–25% from the apex, which corresponds to a frequency range of about 7–10 kHz in the adult animal (Müller et al., 2005). Agonists and antagonists (ATP; 1 or 10 μM; PPADS; 100 μM; both Sigma-Aldrich, St. Louis, MO, USA) were diluted in perilymph-like solution (see above) and applied by a gravity-driven custom-made application system with a multi-barreled pipette (Figure 1), which led to a change of the solution above ISCs and IHCs within 3–6 s. Unless stated otherwise, the specimen was constantly superfused with either perilymph-like solution, the same solution containing the respective agonist/antagonist, or with Ca2+-free solution, respectively, via the application system at 0.29 ml/min. To avoid movement artifacts caused by changes in fluid pressure, the switch between two solutions was performed by simultaneously closing respectively opening the valves of the respective reservoirs. The Ca2+-free solution containing the following (in mM): 143 NaCl, 5.8 KCl, 2.2 MgCl2, 5.6 glucose, 10 HEPES, 0.9 NaH2PO4 and 0.5 EGTA acid, 305 mOsm/l, pH 7.35. The distance between the scan field and the lateral edges of the tissue combined with the application of perilymph-like solution without/with agonist/antagonists from the pillar side prevented spillover of ATP from potentially damaged cells and ISCs. The delay in solution flow from reaching the IHCs to reaching the ISCs was estimated to be <20 ms.
Figure 1. Configuration for imaging inner supporting cell (ISC) Ca2+ waves and inner hair cell (IHC) Ca2+ transients in the immature cochlea of the mouse. Transmitted light image of an acutely dissected whole-mount preparation of the apical turn from a P4 control mouse organ of Corti. The focus is set on the hair cell region (HC) with three rows of outer hair cells and one row of IHCs and the great epithelial ridge with the ISCs. Because of the upward slope of the epithelium towards the modiolus the outer sulcus region (OS) and interdental cells (IDCs) are out of focus. The outlet of a gravity-fed application system made from tapered PVC tubing with an inner diameter of 400 μm was placed at the outer sulcus (pillar) side for gentle application of solutions with blockers or agonists. The tissue was held by two soft nylon threads (one is visible as the rightmost black shadow) fixed to a stainless steel ring that fit into a recording chamber. Care was taken that only the outermost edges of the tissue were held down to the glass bottom of the chamber. One to two recordings were made per apical cochlear turn. Recording frames are depicted by the rectangles labeled 1 and 2. The distance from the thread to the recording site was >200 μm. Scale bar, 50 μm.
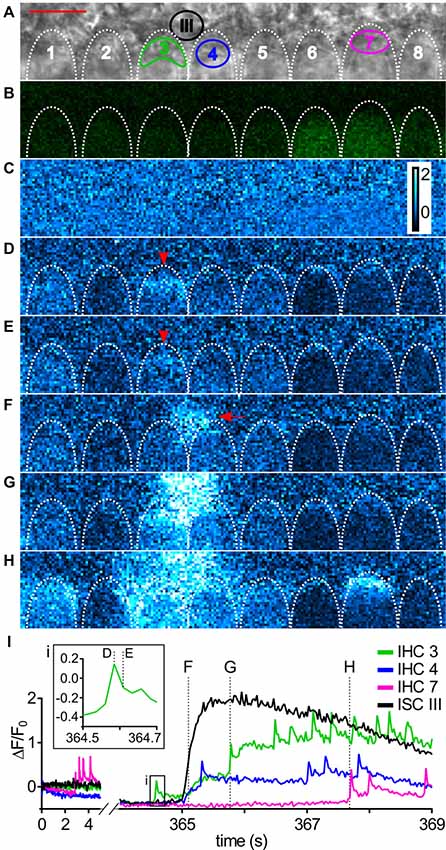
Figure 2. Imaging Ca2+ waves and transients in ISCs and IHCs in the immature cochlea of the mouse. (A) Transmitted light image of the scan field in the organ of Corti of a control mouse (P5) including basolateral IHC poles and adjacent ISCs at high resolution (pixel size 41.6 nm × 41.6 nm). Scale bar, 10 μm. Shapes of basolateral poles of IHCs are outlined by white dotted lines; regions of interest (ROIs) in IHCs 3, 4 and 7 and in ISC III close to IHCs 3 and 4 are indicated by colors. (B) Raw fluorescence of the Fluo-8 AM-loaded specimen (green) at t = 0 s with IHCs 6–8 showing slightly elevated [Ca2+]i at t = 0 s. To allow for faster scanning, pixel size was increased to 416 nm × 416 nm compared with (A). (C–H) Color-coded relative fluorescence changes ΔF/F0 = (F(t) − F0)/F0 with F0 being the average of the first 10 images starting at t = 0 s; color scale bar indicates a range of 0–2 (C). ΔF/F0 images are shown at 0 s and in (D–H) at the time points indicated by dashed lines in (I). (D,E) The basal pole of IHC 3 showed an isolated fast transient (arrowhead) that was not triggered by an ISC Ca2+ wave. (F–H) ISC III close to IHC 3 and IHC 4 displayed a localized Ca2+ transient (F, arrow) that spread as a Ca2+ wave towards the IHCs (G,H). (H) 2.6 s after start of the Ca2+ wave (see F), IHCs 1, 3, 4, 5, 7 showed elevated Ca2+, whereas IHCs 2, 6 and 8 did not. (I) Intracellular Ca2+ changes as ΔF/F0 in ROIs of IHCs 3, 4 and 7 (colored) and ISC III (black). Time = 0 s corresponds to image (C); time points of images (D–H) are indicated by dotted lines, with time points of (D,E) shown in the inset (i). IHCs displayed Ca2+ transients with a faster upstroke than ISCs shown for ISC III. Scale bar: 10 μm. Data file 20150114_036, frame rate = 41 Hz (scan time of single frame = 24.4 ms), 20×/1.0 NA objective.
Ca2+ Imaging, Analysis and Data Handling
Data were recorded using a LSM 710 based on an upright AxioExaminer microscope with 40×/1.0 NA or 20×/1.0 NA Plan Apochromat water immersion objectives and Zen-2012 SP1 (Black edition) software (all Zeiss). Fluo-8 fluorescence was excited with the 488 nm line of an argon laser. Laser intensity was set to very low levels to allow for long continuous recordings (>10 min, up to 30 min) while avoiding photobleaching and strong phototoxicity. We opened up the pinhole to maximal seven airy units accepting a reduced spatial resolution in favor of increased fluorescence intensity at the chosen low laser power and a higher scan speed. Recordings were performed at room temperature (21°C ± 1°C). Because Fluo-8 based on Fluo-4 (Gee et al., 2000) is a non-ratiometric Ca2+ indicator with a high quantum yield and a Kd of 389 nM we determined the relative fluorescence changes corresponding to [Ca2+]i changes in ISCs and IHCs off-line:
where F(t) is the fluorescence intensity of a pixel at a given time t and F0 the fluorescence of this pixel averaged over the first 10 images without obvious Ca2+ changes.
For imaging the spread of ISC Ca2+ waves in Kölliker’s organ, scan fields of about 200 μm × 100 μm were chosen resulting in frame rates of ≤5 Hz (scan times >200 ms). To resolve the much faster fCaTs in IHCs, we increased the frame rate by: (i) imaging smaller scan fields; and (ii) increasing the pixel size to 0.4 μm × 0.4 μm (up to 0.6 μm × 0.6 μm). Scan fields were 140 μm ± 21 μm in width (axis parallel to the IHCs) and 27 μm ± 5 μm in height (Figures 1, 2A) and comprised the basolateral poles of 7–9 (up to 23) IHCs with a stripe of ISCs extending up to 36 μm in the modiolar direction. This led to frame rates of >31 Hz and to corresponding shorter scan times of ≤32 ms (except Figure 6, 36.2 ms), which allowed simultaneous imaging of Ca2+ waves in ISCs and fCaTs in IHCs. For achieving an even better temporal resolution of fCaTs, a subset of control IHCs was imaged at 175 Hz (scan time of a single frame: 5.73 ms). With these settings, photobleaching amounted to 0.5 ΔF/F0 at maximum during periods of ≥6 min. Offline analysis and graphical representation was performed using FIJI (Schindelin et al., 2012), IGOR 6.12 (Wavemetrics, Inc., Lake Oswego, OR, USA) and Inkscape™ 0.91. Regions of interest (ROIs) in a time series (t-series) of fluorescence images were defined by activity patterns within IHCs and ISCs and were validated using a high-resolution transmitted light image acquired prior to the t-series with a 100-fold smaller pixel area. Transmitted light images were also taken after a t-series to check for a potential tissue drift. Data are reported as mean ± standard deviation (SD) except data in Figure 10B, where mean ± SEM is given.
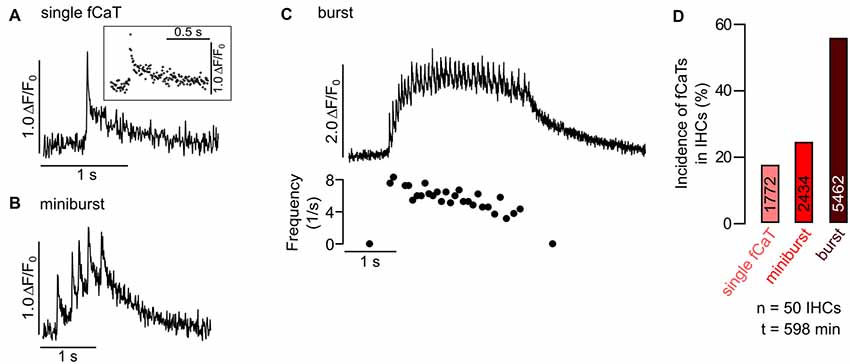
Figure 3. Classification of IHC fast Ca2+ transients (fCaTs) at high temporal resolution. (A–C) Types of fCaTs as ΔF/F0 of an IHC at 175 Hz acquisition rate. (A) A single fCaT of an IHC with the inset depicting individual data points. (B) A miniburst with five fCaTs of the same IHC. (C) A burst (>5 fCaTs, top) and the corresponding interspike intervals (bottom). Data file: 20140614_031, frame rate = 175 Hz (scan time of single frame = 5.73 ms), 40×/1.0 NA objective. (D) Relative incidence of different types of fCaTs—single events, fCaTs occurring in minibursts or in bursts recorded in 50 IHCs from four mice at standard scan rate (~30 Hz). Total numbers of fCaTs analyzed for the different types of IHC activity are given in the bars.
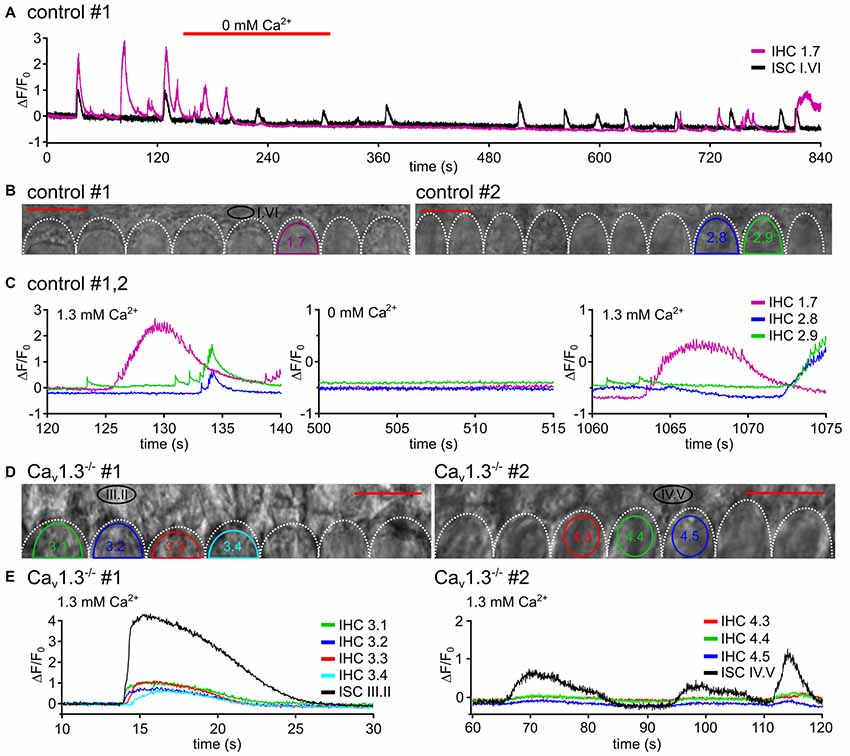
Figure 4. Fast Ca2+ transients require influx of extracellular Ca2+ through Cav1.3 channels. (A) In a P5 control specimen (#1), the effects of superfusion with nominally Ca2+-free solution on [Ca2+]i changes are shown for the ROIs of one IHC (IHC 1.7) and one ROI of adjacent ISCs (A; for transmitted light image see B, left). Red bars above the trace indicate superfusion with Ca2+-free solution. Here, the application pipette was oriented from the lateral side of the organ of Corti (different from the position in Figure 1) to allow for flow of the 0 mM Ca2+ solution underneath the reticular lamina to the IHCs’ basolateral poles. The solution needed 3–6 s for overcoming the dead space in the tubing plus about 50 s to reach the IHCs at the recording site. IHC [Ca2+]i elevations were inhibited or strongly suppressed, whereas Ca2+ transients of the ROI ISC I.VI were still present (black trace). (B) Transmitted light images of the scan fields of two organs of Corti (control #1 and control #2) of 5 day-old control mice including the basolateral poles of IHC and adjacent ISCs at high resolution (pixel size 41.6 nm × 41.6 nm), respectively. Frame rate 31.2 Hz (single frame = 32 ms). (C) ΔF/F0 of IHC 1.7 (from A,B, left) from specimen control #1 and of IHCs 2.8 and 2.9 from control #2 (B, right), which was treated in the same way, at larger time resolution showed single or burst-like fCaTs, partially on top of elevated [Ca2+]i, in perilymph-like (1.3 mM Ca2+) solution (left). Nominally Ca2+-free solution abolished fCaTs (middle). After switching back to 1.3 mM Ca2+, single or burst-like fCaTs re-appeared. (D) Transmitted light images of the scan fields of two organs of Corti of 4-day-old Cav1.3−/− mice (#1, #2) including the basolateral poles of IHCs and adjacent ISCs at high resolution (pixel size 41.6 nm × 41.6 nm), respectively. (E) Despite Ca2+ waves reaching the IHC region, fCaTs were absent from IHCs of 4-day-old Cav1.3−/− mice at normal extracellular Ca2+ (1.3 mM). Whereas ISC Ca2+ waves frequently elicited long-lasting small increases in ΔF/F0 in IHCs that resembled the down-scaled ISC Ca2+ increase and lacked any fCaT (left, animal #1, ISC III.II, black trace; IHC 1–IHC 4, colored traces), on rare occasions waves did not elicit any response in IHCs of Cav1.3−/− mice (right, animal #2). Scale bars, 10 μm, frame rates 32.2 Hz (single frame = 31.1 ms).
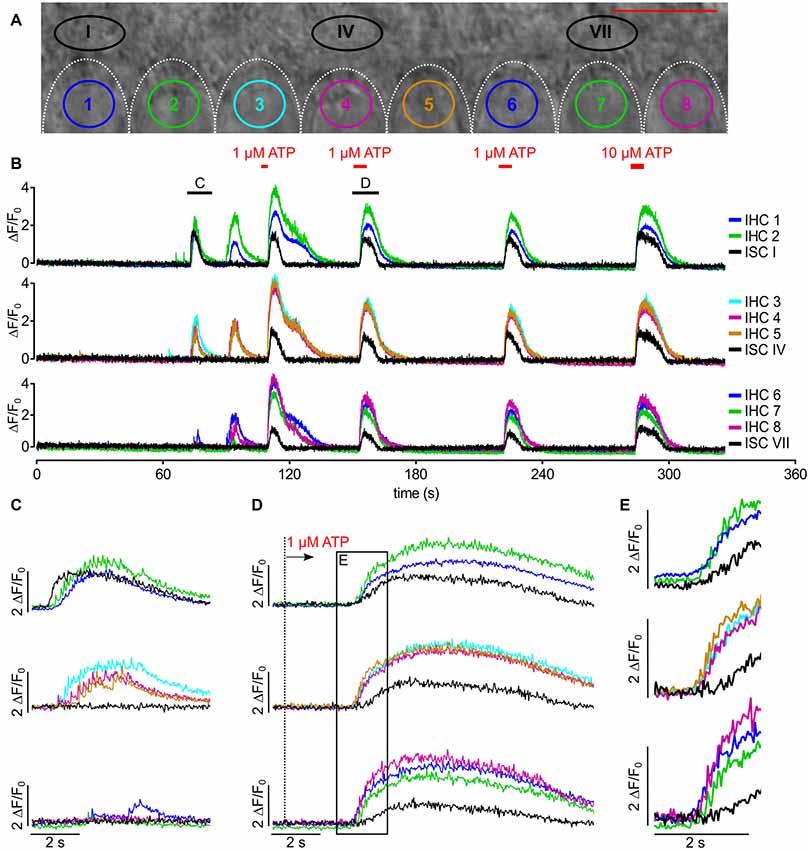
Figure 5. Synchronized [Ca2+]i bursts of adjacent IHCs are mediated by invading ISC Ca2+ waves or by superfusion of ATP. (A) Transmitted light image of the scan field in the organ of Corti of a control mouse (P5) including basolateral poles of IHC and adjacent ISCs at high resolution (pixel size 41.6 nm × 41.6 nm). Scale bar, 10 μm. (B) Overview of spontaneous and ATP-evoked changes in ΔF/F0 in ROIs of all IHCs and three ROIs of their adjacent modiolar ISCs during 5 min 30 s recording time. Black bars on top of panel (B) indicate intervals that are displayed with enhanced temporal resolution in (C,D); superfusion with 1 or 10 μM ATP is indicated at the top. (C) Spontaneous activity without external application of ATP. A Ca2+ transient in ISC I induced a Ca2+ wave that triggered fCaTs in IHCs, which appeared to be synchronized between IHC 1 to IHC 5. IHCs 6 and 7 responded with a delay of >1 s and only with one and four fCaTs, respectively. (D) One micromolar ATP superfused from the pillar side induced Ca2+ elevations in all IHCs and all ISCs. The dotted line depicts the switch from control solution to extracellular solution containing 1 μM ATP. (E) Enlargement of the box in (D) shows that the increase in ΔF/F0 of IHCs preceded that of the ISCs. Data file 20150807_041, sampling frequency = 31.9 Hz (single frame = 31.3 ms), 20×/1.0 NA objective.
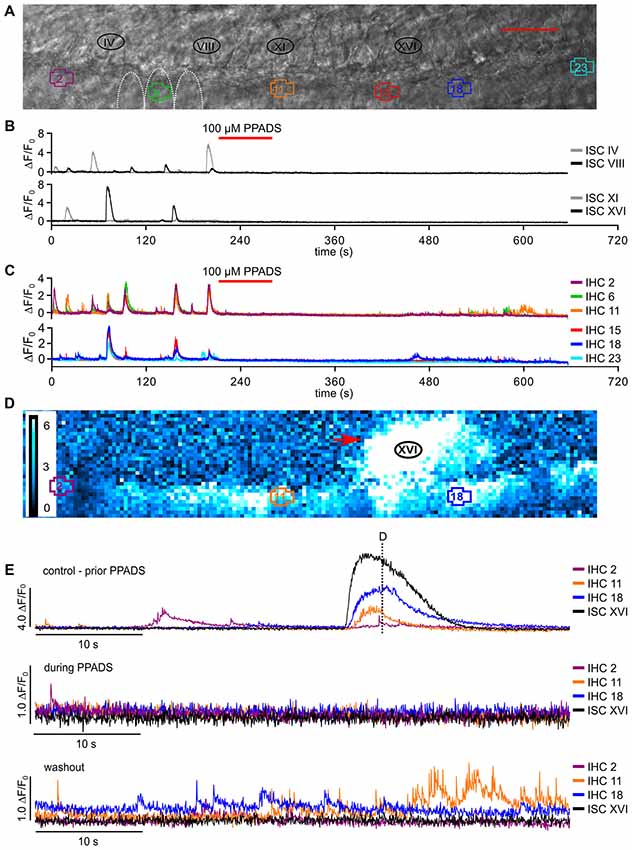
Figure 6. Block of P2 receptors by PPADS irreversibly abolishes Ca2+ waves and transients in ISCs and reversibly reduces fast Ca2+ transients in IHCs. (A) Transmitted light image of the scan field in the organ of Corti of a P5 control mouse including basolateral IHC poles and adjacent ISCs at high resolution (pixel size: 65 nm × 65 nm). ROIs of IHCs are numbered 1 to 23, and four ROIs of adjacent ISCs are indicated (IV, VIII, XI and XVI, which are close to the IHCs with the Arabic number counterpart). For clarity only three IHCs (5–7) are outlined by white dotted lines; scale bar = 20 μm. (B,C) Overview of ΔF/F0 in six selected IHCs (C) and selected adjacent ISCs (B) during 11 min recording time. The red bar on top of panels (B,C) indicates perfusion of 100 μM PPADS-containing solution (red). (D) Color-coded relative fluorescence changes ΔF/F0 at t = 72.5 s; a typical Ca2+ wave (red arrow) prior to PPADS application is shown at approximately maximum spread. (E) ΔF/F0 for selected IHCs and for ISC XVI (adjacent to IHC 16, black trace) at larger time resolution before superfusion with PPADS (top, control condition, dashed line refers to the time point shown in D). Middle panel: 100 μM PPADS blocked slow Ca2+ elevations in all ISCs, shown for ISC XVI, and in IHCs. In few IHCs, sparse fCaTs were still present (IHC 2, green trace). Whereas washout of PPADS for ≥5 min restored fCaTs in many IHCs, this was not the case for Ca2+ elevations in ISCs, shown for ISC XVI (bottom). Data file 2015021_013, frame rate = 27.6 Hz (single frame = 36.2 ms), 20×/1.0 NA objective.
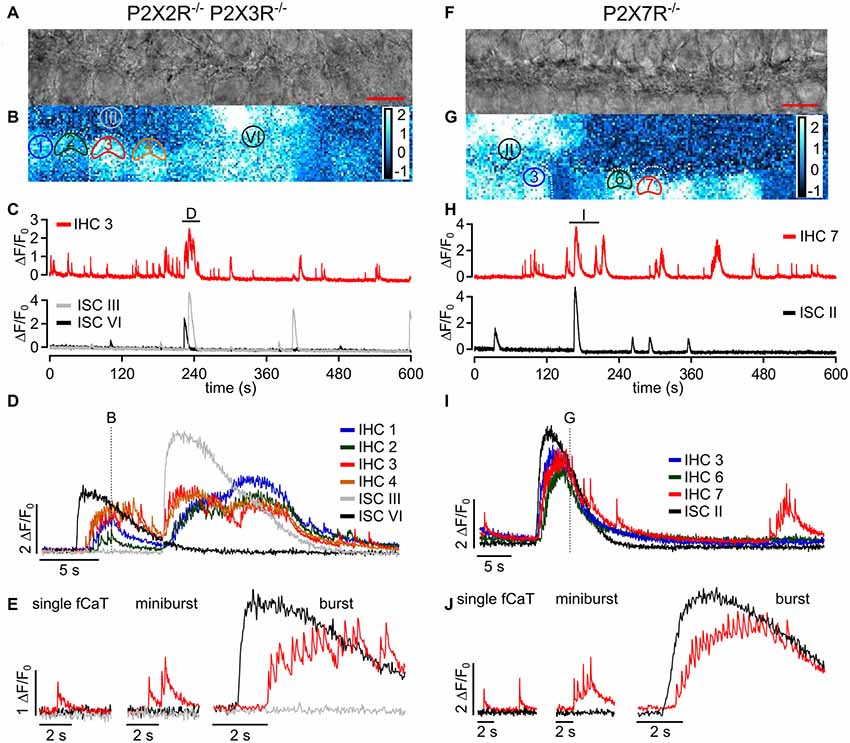
Figure 7. ISC Ca2+ waves and IHC fCaTs are present in epithelia of P2X2R−/−/P2X3R−/− and P2X7R−/− mice. (A) Transmitted light image of the scan field in the organ of Corti of a P2X2R−/−/P2X3R−/− mouse aged P4 including basolateral IHC poles and adjacent ISCs at high resolution (pixel size 51 nm × 51 nm; scale bar = 10 μm). (B) A typical Ca2+ wave, which originated in ISC VI, is shown as color-coded relative fluorescence changes ΔF/F0 at approximately maximum spread. Note that almost all IHCs showed elevated Ca2+ levels. ROIs of selected IHCs (1 to 4) and two ROIs of ISCs (III and VI) are indicated. For clarity only two IHCs are outlined by white dotted lines. (C) Overview of changes in ΔF/F0 in IHC 3 (top) and ISCs III and VI (bottom). IHC 3 showed both autonomous activity and events induced by ISC Ca2+ waves. The label (D) indicates an episode where IHC 3 generated bursts and ISC III and VI showed Ca2+ waves, which is shown at larger temporal resolution in panel (D). (D) ΔF/F0 for selected IHCs 1 to 4 and for ISC III and VI at larger time resolution. Like in control mice, IHCs of P2X2R−/−/P2X3R−/− mice responded to ISC Ca2+ waves with synchronized burst-like behavior. The dotted line indicates the time point at which the image shown in (B) was taken. (E) IHC three generated single autonomous fCaTs (left), minibursts (≤5 fCaTs; middle) and bursts (>5 fCaTs; right). Data file: 20160824_029, sampling frequency = 32 Hz (single frame = 31.4 ms), 20×/1.0 NA objective. (F) Transmitted light image of the scan field in the organ of Corti of a P2X7R−/− mouse aged P5 including basolateral IHC poles and adjacent ISCs at high resolution (pixel size 60 nm × 60 nm; scale bar = 10 μm). (G) Color-coded relative fluorescence changes ΔF/F0 show an exemplary Ca2+ wave and increased activity in most IHCs. ROIs of selected IHCs 3, 6 and 7 and one ROI of ISCs (II) are indicated. For clarity only few IHCs are outlined by white dotted lines. (H) Overview of changes in ΔF/F0 in IHC 7 (top) and ISC II (bottom). IHC 7 showed both autonomous activity and ISC Ca2+ wave-induced events. The label (I) indicates an episode where IHC 7 generated bursts and ISC II was part of a Ca2+ wave, which is shown at larger temporal resolution in panel (I). (I) ΔF/F0 for IHCs 3, 6 and 7 and for ISC II at larger time resolution. The IHCs responded to the ISC Ca2+ wave with synchronized burst-like behavior. The dotted line indicates the time point of the image shown in (G). (J) The three types of IHC Ca2+ signals were present in P2X7R−/− mice—single autonomous fCaTs (left), minibursts (≤5 fCaTs; middle) and bursts (>5 fCaTs; right). Data file: 20170128_014, sampling frequency = 32 Hz (single frame = 31.6 ms), 20×/1.0 NA objective.
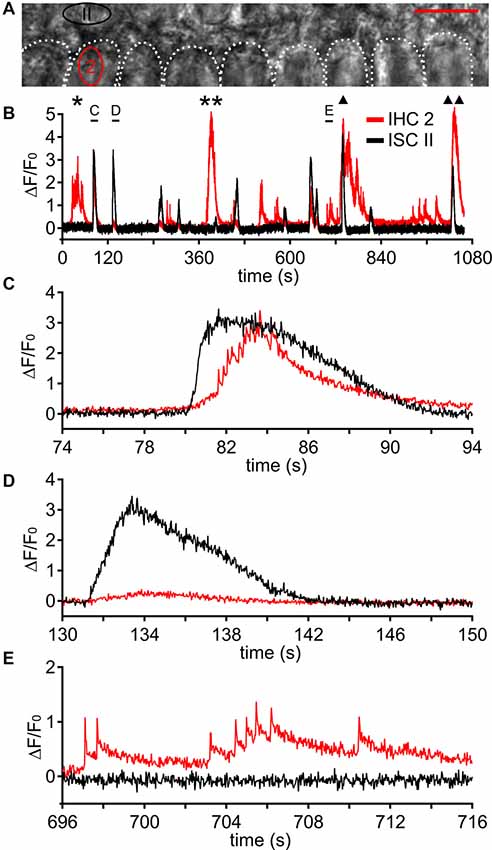
Figure 8. Fast Ca2+ transients can occur independently from ISC Ca2+ waves. (A) Transmitted light image of two rows of ISCs and the basolateral poles of nine IHCs, which are outlined by white dotted shapes; two ROIs are labeled in red (IHC 2) and black (ISC II). Scale bar = 10 μm. (B) Changes in [Ca2+]i as ΔF/F0 in ROI “IHC 2” and in ROI “ISC II” comprising three ISCs adjacent to IHC 2 during a period of 17 min 38 s. ROI “ISC II” was invaded by several Ca2+ waves (black trace) whereas IHC 2 (red trace) showed bursts independent of Ca2+ waves from ISC II (labeled by * and **), bursts triggered by Ca2+ waves from ISC II (labeled by (C) and triangles), minibursts and single fCaTs. Three events indicated by black bars are shown at larger temporal resolution in (C–E). (C) A Ca2+ wave caused a large [Ca2+]i elevation in ISC II, which preceded the burst activity of IHC 2. (D) Another Ca2+ wave caused a [Ca2+]i elevation in ROI “ISC II” whereas IHC 2 remained inactive. (E) IHC 2 showed minibursts and single fCaTs whereas the adjacent ISC II did not show any activity. Data file 20141127_002, frame rate = 34 Hz (single frame = 29.4 ms), 40×/1.0 NA objective.
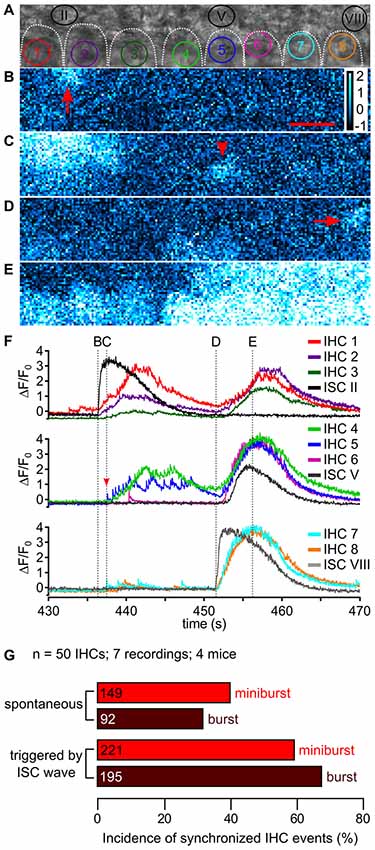
Figure 9. ISC activity and synchronicity of fast Ca2+ transients between neighboring IHCs. (A) Transmitted light image of the scan field in the organ of Corti of a P5 control mouse including basolateral IHC poles outlined by white dotted lines and adjacent ISCs at high resolution (pixel size: 43.2 nm × 43.2 nm). ROIs of IHCs are numbered 1 to 8; three ROIs of adjacent ISCs are indicated (II, V and VIII), with II and VIII depicting regions of wave origin, respectively. (B–E) Color-coded relative fluorescence changes ΔF/F0 at time points indicated in (F). (B) Ca2+ wave one originated in ISC II (arrow). Scale bar = 10 μm. (C) A single isolated fCaT was generated by IHC 5 (arrowhead). (D) A second Ca2+ wave originated adjacent to IHC 8 in ISC VIII (arrow), while IHCs 4 and 5 showed elevated Ca2+ after burst firing. (E) When the ISC Ca2+ wave reached its maximum spread reaching out from ISC VIII to IHC 4, every IHC showed moderate (IHCs 1–3) to strong Ca2+ elevations (IHCs 4–8). (F) ΔF/F0 for ROIs of IHCs 1–3 (colored) and the ISC origin of wave 1 (ISC II, black, top panel); of IHCs 4–6 (colored) and ISC V adjacent to IHC 5 (dark gray, middle panel), and of IHC 7 and IHC 8 (colored) and the ISC origin of wave 2 (ISC VIII, gray, bottom). Wave 1 originating from ISC II appeared to synchronize IHCs 1–5 whereas wave 2 originating from ISC VIII synchronized all IHCs in the scan field. The Ca2+ increase of ISC V (middle panel, dark gray) was delayed compared with the bursts in adjacent IHCs 4–6. Vertical dotted lines and labels (B–E) in the top row refer to the time points at which images (B–E) were captured. Data file 20150114_006, frame rate = 32 Hz (single frame = 31.1 ms), 20×/1.0 NA objective. (G) Summary of the incidence of synchronized IHC activity occurring simultaneously in at least two adjacent IHCs as minibursts and bursts, respectively, without (top, “spontaneous”) or with an invading ISC Ca2+ wave as trigger (bottom). Absolute number of synchronized IHC events is given in the bars.
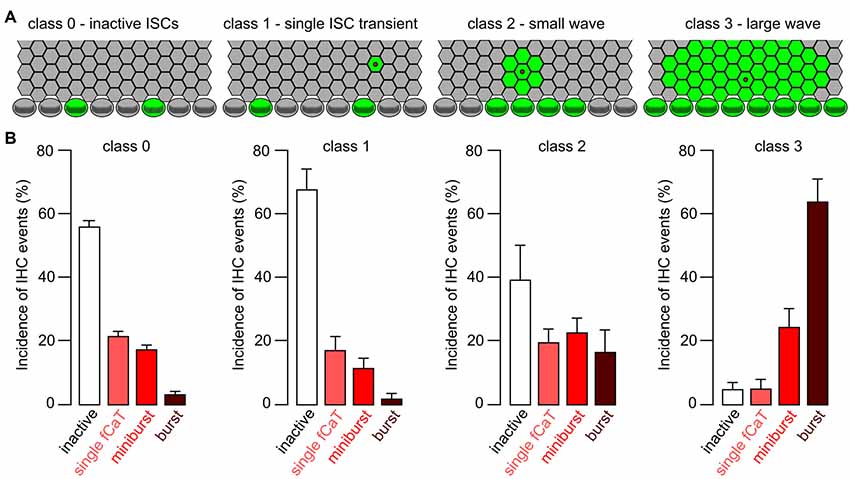
Figure 10. Efficacy of different classes of ISC Ca2+ waves in triggering fCaT activity in IHCs. (A) Sketch to illustrate classification of ISC activity, with a stripe of four rows of ISCs and one row of IHCs. Green color indicates elevated [Ca2+]i; wave origin is depicted by a red dot. Class 0: no ISC activity, but autonomous IHC activity; class 1: a non-propagating Ca2+ transient restricted to a single ISC; class 2: a small ISC Ca2+ wave that traveled to maximally two ISCs radially; class 3: a large ISC Ca2+ wave traveling >2 cells from its origin. (B) Average incidence ± SEM of IHC Ca2+ events during a defined period of time as a function of the ISC wave class. For each wave class, only the highest rank of the activity of an individual IHC was considered, in the order burst > miniburst > fCaT > inactive IHC (see “Results” section).
Results
Using Fluo-8 AM-incubated explants of the apical organ of Corti, which were dissected with greatest care, we observed spontaneously occurring Ca2+ waves and corresponding waves of light refraction (crenation waves) in the region of ISCs. This is consistent with previous studies of ISCs of Kölliker’s organ in the immature organ of Corti (Tritsch et al., 2007; Anselmi et al., 2008; Dayaratne et al., 2015; Wang et al., 2015). ISCs generated diverse Ca2+ phenomena ranging from Ca2+ elevations confined to a single ISC (Ca2+ transients) to Ca2+ waves extending over various distances. Small Ca2+ waves propagated radially to maximum two neighboring ISC circles comprising about 200–600 μm2, whereas large waves covered areas from 600 μm2 upto >2200 μm2 within Kölliker’s organ involving about 75 ISCs. Sources and directions of the waves were random, indicating that the tissue had not been impaled in or near the field of view and that ATP potentially leaking out from injured or dying cells at the outermost edges of the tissue piece did not affect ISCs and IHCs in the field of view.
Simultaneous Imaging of Ca2+ Waves in ISCs and Fast Ca2+ Transients in IHCs
Figure 2 shows a typical recording of concomitant ISC and IHC Ca2+ signals. Two rows of ISCs and the basolateral poles of eight IHCs are visible in the transmitted light image with the focus set at the maximum width of IHC nuclei (Figure 2A). IHCs are enwrapped by specialized ISCs, the inner phalangeal cells, which stay throughout maturity. We do not differentiate here between transient ISCs of Kölliker’s organ and inner phalangeal cells because they cannot be unambiguously discriminated in DIC images. IHCs numbered 6–8 within the Fluo-8 AM-loaded specimen showed a slightly elevated initial raw fluorescence at t = 0 s (green; Figure 2B). Usually care was taken to eliminate frames in which IHCs showed transient fluorescence elevations for determining the baseline (the first 10 frames) to avoid ΔF/F0 values <0 at later time points. Here, we show such an example on purpose to demonstrate that the calculation of relative fluorescence changes (ΔF/F0) eliminates different raw fluorescence values (Figures 2B,C). Figures 2C–H depict relative changes in fluorescence intensity, ΔF/F0 (see Eq. 1 in “Materials and Methods” section) starting at t = 0 s (Figure 2C) and at subsequent time points. The basolateral pole of IHC 3 showed elevated ΔF/F0 (Figures 2D,E, arrowheads) reflecting an autonomous single fCaT. About 1 s later, a Ca2+ wave originating from ISC III (Figure 2F, arrow) spread in all directions, reaching the IHCs (Figures 2G,H). fCaTs occurred in IHCs 1, 3, 4, 5, 7. Averaging ΔF/F0 in ROIs indicated in Figure 2A as a function of time (Figure 2I) revealed fCaTs in IHCs 3, 4 and 7, and a large and long-lasting Ca2+ transient in ISC III triggering the ISC Ca2+ wave seen at maximum spread in Figure 2H. IHC 3 was active before its adjacent ISC III generated a Ca2+ wave (Figure 2I, inset i), whereas the fCaTs in IHCs 4 and 7 started after Ca2+ had risen in the nearby ISC III. While IHC 7 produced 4 fCaTs shown at the onset of the recording, no elevation in Ca2+ could be observed in ISCs (Figure 2I, left).
Properties and Incidence of Fast Ca2+ Transients in IHCs
To study the temporal properties of fCaTs in detail, IHCs were imaged at 175 Hz (scan time of a single frame: 5.73 ms), which required a smaller scan field not allowing for simultaneous imaging of ISCs. During a 573 s-long recording of eight IHCs, seven of them generated fCaTs. Single fCaTs, which were not generated within a burst of activity, had an average half-width of 32.5 ± 9.8 ms (n = 18) and decayed to baseline after 895.9 ± 381.2 ms (n = 17; Figure 3A). Time to peak, measured from 10% of the peak amplitude to the maximum fluorescence, amounted to 16.3 ± 5.5 ms (n = 19). Decay time defined as time from peak back to 10% above baseline was 879.7 ± 379.1 ms (n = 17), thus revealing a much slower decay in fluorescence compared to the rise (Figure 3A, Table 1). Besides single isolated fCaTs, IHCs generated fCaTs within events we designate as minibursts (2–5 fCaTs in close sequence, Figure 3B) and within bursts with more than five consecutive fCaTs (Figure 3C, top). The mean frequency of fCaTs was 0.32 ± 0.11 Hz, but they were not evenly distributed. Within bursts, frequencies varied from 4 Hz to 10 Hz (Figure 3C, bottom) similar to previously reported frequencies in bursts of IHC Ca2+ APs (Johnson et al., 2011, 2017; Sendin et al., 2014). A total of 49 bursts and 54 minibursts were generated in the seven active IHCs during 573 s recording time. Of those, 42 bursts and 18 minibursts occurred simultaneously in adjacent IHCs with at least two IHCs involved (mean number of simultaneously active IHCs: 4.62 ± 1.85). Notably, ΔF/F0 continuously exceeded values of 1.5 only within bursts of fCaTs (Figure 3C, top).
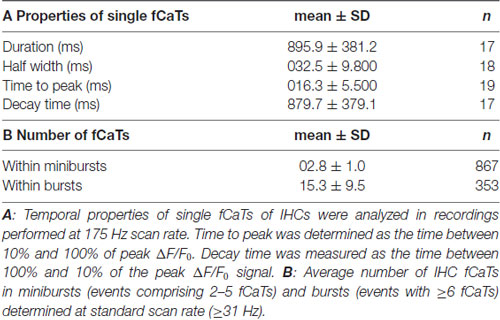
Table 1. Temporal properties of inner hair cell (IHC) fast Ca2+ transients (fCaTs) and average number of IHC fCaTs in minibursts and bursts.
To study the incidence of the three types of IHC fCaTs (single events, minibursts and bursts) perfusion was switched off in a set of experiments to exclude the possibility that the bath flow may have caused an interaction between ISCs and IHCs. Fifty IHCs from four control mice were monitored in seven recordings lasting between 544 s and 1120 s. The incidence of fCaTs was analyzed during a total observation time of 598 min (total number of IHCs multiplied by the length of respective recordings), irrespective of Ca2+ elevations in ISCs. IHCs generated 9668 fCaTs with 18.3% being single fCaTs, 25.2% occurring within minibursts of 2–5 fCaTs and 56.5% occurring within bursts of 6–67 fCaTs (Figure 3D). A detailed analysis showed that bursts consisted on average of 15.3 ± 9.5 fCaTs (n = 353) whereas minibursts contained an average number of 2.8 ± 1.0 fCaTs (n = 867; Table 1). During bursts of fCaTs, ΔF/F0 generally increased to >2 with maximal values <4 and declined slowly within 10 s. In contrast, ΔF/F0 reached the baseline within 1–2 s in events with ≤5 fCaTs (see Figures 3B,C). These data indicate that although the majority of fCaTs (56.5%) were embedded in a burst, a comparable number (43.5%) appeared outside of bursts as single fCaTs or as part of a miniburst (Figure 3D).
fCaTs of IHCs Depended on External Ca2+ and on the Expression of Voltage-Gated Cav1.3 Channels
In order to test the Ca2+ dependance of fCaTs, nominally Ca2+-free solution was applied. To achieve perfusion of the cell bodies under the reticular lamina, the application pipette here was positioned at a lateral edge of the epithelium, in contrast to the setting shown in Figure 1. When IHCs were bathed in Ca2+-free solution for >1 min, single fCaTs, minibursts and bursts were reversibly abolished (Figures 4A–C), indicating that influx of extracellular Ca2+ is required to generate fCaTs. Ca2+ signals of ISCs, however, did not vanish in 0 mM Ca2+ (Figure 4A, black trace). The decrease in the baseline of ΔF/F0 in both IHCs and ISCs was likely caused by a reduction in the intracellular Ca2+ concentration in the Ca2+-free solution.
Because Ca2+ APs of IHCs crucially depend on Cav1.3 channels (Brandt et al., 2003), which account for more than 90% of voltage-gated Ca2+ currents in neonatal IHCs (Platzer et al., 2000), Ca2+ measurements were conducted in IHCs and ISCs of Cav1.3−/− mice in standard (1.3 mM) extracellular Ca2+ concentration (Figures 4D,E). In 103 IHCs from three Cav1.3−/− mice we did not observe a single fCaT (Figure 4E) during a total recording time of 787 min (recording length multiplied by number of IHCs). However, those IHCs contacted by an ISC Ca2+ wave typically showed slowly rising Ca2+ elevations of small amplitude (ΔF/F0 <1) temporally matching the Ca2+ signals of the ISC (Figure 4E, left). This slow IHC signal may have resulted from: (i) potential bleedthrough of the fluorescence signal of the ISCs; (ii) Ca2+ influx through P2X receptors; or (iii) Ca2+ influx through the small percentage of Ca2+ channels other than Cav1.3 (mostly Cav1.2 and some Cav2.3-mediated currents; Brandt et al., 2003). We never saw this kind of small slow Ca2+ elevation in IHCs in the absence of an invading ISC Ca2+ wave. On rare occasions, IHCs of Cav1.3−/− mice did not respond to an invading Ca2+ wave with small and long-lasting Ca2+ elevations (Figure 4E, left). Summarizing the results from control mice in 0 mM Ca2+ solution and those from Cav1.3−/− mice in 1.3 mM extracellular Ca2+ we conclude that fCaTs in IHCs reflect the Ca2+ increases mediated by Cav1.3 channels.
Synchronized Bursts of fCaTs in Adjacent IHCs Were Triggered by ISC Ca2+ Waves or by Extracellular ATP
IHCs were able to generate fCaTs autonomously without being triggered by ISC Ca2+ waves (see Figure 3 and below). However, when an ISC Ca2+ wave approached the IHC region it typically evoked bursts of fCaTs in a number of adjacent IHCs (Figures 5A–C). The spontaneous Ca2+ wave involving ISC I (at t ~70 s) triggered bursts in IHCs 1 and 2, and although ISC IV was silent, IHCs 3–5 were active at the same time. The Ca2+ elevation of ISC I preceded that of the IHCs (Figure 5C). Analyzing 12 waves causing burst events in IHCs from a larger data set, the Ca2+ wave-evoked fluorescence elevation in ISCs lining the IHC row preceded the onset of fCaTs within bursts in the closest IHC by 0.52 ± 0.27 s (mean ± SD). Though less frequent, synchronized IHC bursts were also observed without any ISC activity within the recording frame as e.g., in IHCs 1, 2, 4, 5, 6, 8 at t ~90 s (Figure 5B and see below).
To validate previous results showing ATP-induced inward currents in neonatal IHCs (Tritsch and Bergles, 2010) in our preparation, we tested the effect of ATP on IHC fCaTs. Application of 1 μM ATP for 5 s or 10 s from the pillar side (Figure 5B) strongly increased ΔF/F0 in all cells of the sensory epithelium (cells of the inner and outer sulcus, interdental cells (IDCs), spiral ganglion tissue and IHCs), indicating an overall expression of purinergic receptors at the age of P4/P5. The ATP-evoked increase in ΔF/F0 in ISCs resembled that induced by a spontaneous Ca2+ wave, lasting for 10–15 s (Figure 5B; black traces). In IHCs, ATP-evoked bursts of fCaTs strongly increased ΔF/F0 up to 4. Repetitive ATP stimulation (five times at intervals >30 s) did not deplete the burst responses in IHCs (see Figure 5B). However, fCaTs within ATP-induced bursts were smaller in amplitude compared with fCaTs triggered by a Ca2+ wave and were challenging to detect (Figure 5D). Together, these experiments corroborate earlier studies showing that ATP generates Ca2+ waves in ISCs (Tritsch et al., 2007, 2010). To test the hypothesis if ATP can activate IHCs independently of ISC Ca2+ elevations, the ATP had been applied from the pillar side (Figures 5B,D,E). Such a direct stimulation of purinergic receptors on IHCs evoked bursts of fCaTs that preceded Ca2+ elevations in ISCs by 0.99 ± 0.34 s (n = 23 recordings). When taking into account that the solution flow reached the IHCs ~20 ms earlier than the ISCs, these results still indicate that ATP can elicit bursts in IHCs independent of ISC Ca2+ elevations.
Block of P2 Receptors by PPADS Irreversibly Suppressed Ca2+ Waves in ISCs and Reversibly Reduced Fast Ca2+ Transients in IHCs
To further analyze the importance of purinergic signaling on fCaTs, we tested the effect of 100 μM PPADS, a broad spectrum blocker of P2Y and P2X receptors (Abbracchio et al., 2006; Coddou et al., 2011). Before PPADS application, control measurements were conducted for 180 s in order to simultaneously record Ca2+ waves in ISCs and single fCaTs, minibursts and bursts in IHCs (Figures 6B–D). PPADS superfusion (100 μM) completely abolished fCaTs in 33 of 44 IHCs. The remaining 11 IHCs still generated single fCaTs, but neither minibursts nor bursts. Single fCaTs, minibursts or bursts were recorded after washout in 27 IHCs, albeit with strongly reduced amplitude (Figures 6C,E). Notably, blocking P2 receptors had an even stronger effect on ISCs (Figures 6B,E): the incidence of ISC Ca2+ waves was reduced from 5.4 waves/100 s (35 waves in 645 s total recording time, three control mice) to 1.0 waves/100 s (five waves during 509 s in total). After removal of PPADS, the ability of ISCs to generate Ca2+ waves was very weak, as only three Ca2+ waves occurred during 1910 s washout (0.2 Ca2+ waves/100 s; Figures 6B–E).
IHC fCaTs and ISC Ca2+ Waves Were Not Affected by the Lack of P2X2R/P2X3R or P2X7R
Because: (i) ATP strongly promoted generation of IHC bursts (Figure 5); (ii) IHCs express P2X2, P2X3 and P2X7 receptors (Brändle et al., 1999; Nikolic et al., 2003; Huang et al., 2005; Housley et al., 2006); and (iii) P2X2 and P2X3 receptors were proposed to mediate an increase in Ca2+ AP activity (Tritsch et al., 2007; Johnson et al., 2011), we tested the generation of fCaTs and their interplay with spontaneous ISC Ca2+ waves in P2X2R/P2X3R double knockout (P2X2R−/−/P2X3R−/−) and P2X7R knockout (P2X7R−/−) mice. Both, ISC waves and IHC fCaTs were unaffected in P2X2R−/−/P2X3R−/− mice (Figures 7A–E). As in control mice, burst-like activity of IHCs was mostly triggered by Ca2+ waves and was synchronized between adjacent IHCs (Figures 7C,D). Overall, 30 IHCs from five recordings obtained from three animals, each lasting 628 s, regularly generated fCaTs. Of the 4526 fCaTs during the 314 min recording time, 665 (14.7%) were single fCaTs, 721 (15.9%) occurred in minibursts and 69.4% fCaTs were found in bursts (n = 3140). Examples of IHC Ca2+ signals from P2X2R−/−/P2X3R−/− mice are shown in Figure 7E. Experiments in P2X7R−/− mice involving 48 IHCs (five recordings, four animals) revealed similar IHCs fCaTs and ISC Ca2+ waves as in control mice (Figures 7F–J). Burst-like activity of neighboring IHCs in P2X7R−/− mice was mostly triggered and synchronized by Ca2+ wave activity in close vicinity (Figures 7H,I). Of the 4648 fCaTs recorded during the total of 503 min, 1135 (24.4%) were single fCaTs, 1122 (24.1%) occurred in minibursts and 2389 (51.4%) fCaTs in bursts. Examples of IHC Ca2+ signals from P2X7R−/− mice are shown in Figure 7J. In summary, neither P2X2, P2X3 nor P2X7 receptors were essential for the generation of IHC fCaTs nor the coupling of IHC bursts to ISC Ca2+ waves.
Fast Ca2+ Transients Can Occur Independently of ISC Ca2+ Waves
It has been suggested previously that IHCs can generate Ca2+ APs independently of Ca2+ wave activity in adjacent ISCs (Johnson et al., 2011, 2017; Sendin et al., 2014). These studies are based on electrical recordings where patch pipettes could have potentially liberated ATP from injured cells at the recording site, making the interpretation of “spontaneous activity” challenging. Performing imaging only, we were able to simultaneously observe IHC fCaTs and ISC Ca2+ waves and their potential coupling (Figure 8). Though autonomously generated fCaTs were mostly solitary fCaTs or minibursts, spontaneous bursts were observed, too. An example is shown in Figures 8A,B where bursts of fCaTs appeared in IHC 2 without Ca2+ elevation in any ISC as indicated by asterisks referring to the IHC 2-trace in red. Yet, bursts with >5 fCaTs were more frequently triggered by a Ca2+ wave reaching the IHC region (Figure 8B, indicated by triangles, and Figure 8C) with an overall delay of 0.52 ± 0.27 s (n = 12 waves from four animals, see above). However, not every ISC Ca2+ wave elicited burst-like activity in the adjacent IHC 2 (Figure 8D). This lack of activity of IHC 2 was transient because it autonomously generated bursts (Figure 8B**) or single fCaTs and minibursts (Figure 8E) as well as ISC-evoked activity (Figure 8B, single and double triangle) thereafter. Together, our data support the hypothesis that isolated fCaTs and minibursts, but also bursts can be generated in IHCs irrespective of ISC Ca2+ waves.
Simultaneous Bursts in Neighboring IHCs Were Mostly Triggered by ISC Ca2+ Waves
Due to their spatial spread, most Ca2+ waves that invaded the IHC area evoked bursts of fCaTs in more than one IHC, causing synchronous Ca2+ activity in two to eight IHCs. The upper number may be larger, but was limited by the size of the scan field. An example in Figure 9 shows the spatiotemporal coupling of a wave starting from ISC II, which elicited bursts in IHCs 1, 2, 3, 4 (Figures 9A–C,F). Notably, IHCs also generated simultaneous bursts without being triggered by an ISC Ca2+ wave. IHCs 4–8 responded with bursts to a wave starting in ISC VIII (Figure 9D), but IHCs 1–3 at 10–30 μm distance from the ISC Ca2+ signal also responded with bursts (Figures 9E,F) suggesting direct coupling of activity between IHCs. This means that simultaneous Ca2+ activity in adjacent IHCs can occur without a Ca2+ elevation in the ISCs contacting these IHCs or their direct IHC neighbors.
We analyzed burst activity synchronized between IHCs in periods of 15 s, the approximate duration of a large Ca2+ wave at a given ISC ROI, for data from four control mice (seven recordings comprising a total of 50 IHCs). The relative incidence of synchronous miniburst activity in at least two adjacent IHCs without being triggered by an ISC Ca2+ was 40.3% (149 cases) compared with 59.7% (221 cases) with a Ca2+ wave as trigger (Figure 9G). Spontaneous synchronous bursts in at least two adjacent IHCs had a relative incidence of 32.1% (92 cases), which increased to 67.9% (195 cases) when triggered by a Ca2+ wave (Figure 9G). A possible explanation for the coupling of Ca2+ activities between IHCs in the absence of Ca2+ waves might be an activity-driven K+ efflux from IHCs through their voltage-gated K+ channels. If an increase in the extracellular K+ concentration around IHCs was not effectively prevented by inner phalangeal cells/ISCs, neighboring IHCs would become depolarized, which in turn would trigger Ca2+ APs and hence fCaTs. A similar K+ accumulation-based activation of IHCs was proposed as coupling mechanism between Ca2+ waves and IHC activity, although the latter originates from K+ efflux of ISCs including inner phalangeal cells (Wang et al., 2015).
Efficacy of ISC Ca2+ Waves in Triggering fCaTs in IHCs
To quantify the efficacy of a Ca2+ wave invading the IHC area in generating fCaTs, ISC Ca2+ signals were classified into four groups (Figure 10A). Wave class 0 reflects the lack of ISC activity during a 15 s period, which is the approximate duration of a large ISC Ca2+ wave. Class 1 defines a non-propagating Ca2+ transient restricted to a single ISC characterized by a mean duration of 8.5 ± 3.7 s (n = 12 Ca2+ transients). Class 2 denotes a small ISC Ca2+ wave that radially propagated ≤2 cells from its origin (mean duration of 10.1 ± 1.9 s, n = 9 waves), whereas class 3 defines a large ISC Ca2+ wave propagating >2 cells from its origin (mean duration of 12.5 s ± 2.0 s, n = 19 waves; Figure 10A). Small and large Ca2+ waves were only included into the analysis if they originated within the scan field. A rank order of IHC activities was defined as follows: burst > miniburst > single fCaT > inactive IHC. For a given wave class, the IHC event type with the highest rank was determined for each IHC in the scan field during the respective time window. These event numbers were added, normalized to the total number of IHCs in the scan field and averaged between recordings, yielding the relative incidence of IHC events for the respective wave class (Figure 10B).
Relating the class of ISC activity to the highest rank of the simultaneous IHC activity revealed striking differences (Figure 10B): bursts were extremely rare when ISCs were silent (4% ± 0.8%; mean ± SEM, n = 196 time windows without ISC activity during 15 s) or showed class 1 events (2% ± 1.5%, n = 13 non-propagating ISC transients). However, bursts predominated when IHCs were activated by class 3 waves. When ISCs were silent (class 0), the incidence of inactive IHCs was 57% ± 1.8% (n = 196) and most of the autonomous activity observed were single fCaTs (22% ± 1.4%) or minibursts (18% ± 1.3%). During a non-propagating Ca2+ transient of a single ISC (class 1), a similar picture emerged as with silent ISCs (Figure 10B). However, during class 2 Ca2+ waves (n = 11) the incidence of bursts increased to 17% ± 6.8% and of minibursts to 23% ± 4.5%, whereas the proportion of inactive IHCs was reduced to 40% ± 10.8%. In the presence of class 3 waves (n = 19), the fraction of bursts increased to 64% ± 7% and that of minibursts to 25% ± 5.7%. In contrast, the incidence of single fCaTs or inactive IHCs was reduced to 5% ± 2.8% and 5% ± 2%, respectively. These data indicate that most bursts of fCaTs reflecting burst-like action potentials of IHCs require ISC Ca2+ waves. On the other hand, IHCs can generate single fCaTs and minibursts without wave activity of ISCs.
Discussion
Spontaneous activity is a hallmark of developing sensory systems including the auditory system (Blankenship and Feller, 2010; Leighton and Lohmann, 2016). Spontaneously occurring Ca2+ signals in IHC and their dependance on ISC Ca2+ waves was presently studied with Fluo-8 AM Ca2+ imaging on freshly dissected explants of organs of Corti. Since ATP can trigger Ca2+ waves in Kölliker’s organ of the immature organ of Corti (Tritsch et al., 2007; Anselmi et al., 2008; Majumder et al., 2010) and also Ca2+ APs in IHCs (Tritsch et al., 2007; Tritsch and Bergles, 2010; Johnson et al., 2011) it was necessary to avoid unintended release of ATP and putative ATP-dependent signaling. Great care was taken to keep the epithelium as intact as possible. Moreover, the recordings were performed from free-running tissue in the middle of the explant far from the lateral edges. By using small scan fields and a pixel size of ~0.17 μm2 it was possible to temporally resolve fCaTs in IHCs and classify them into single fCaTs, mini-bursts (2–5 fCaTs) and bursts of fCaTs. Our ΔF/F0 values of fCaTs in Fluo-8 AM-loaded IHCs varied from 0.5 up to 5 (in bursts), providing a much higher amplitude resolution than previously reported using Fluo-4 AM (Ceriani et al., 2016a).
IHC fCaTs Are Consistent With Ca2+ APs
In the first postnatal week, mouse and rat IHCs generate Ca2+ APs that vanish shortly before the onset of hearing (Kros et al., 1998; Brandt et al., 2003, 2007; Marcotti et al., 2003b; Johnson et al., 2005, 2007, 2011, 2012, 2013; Sendin et al., 2014; Iosub et al., 2015). Ca2+ APs appear as single events, but more often in bursts of 10–20 single APs. They are reversibly abolished in nominally Ca2+-free solution (Marcotti et al., 2003b) and missing in Cav1.3−/− mice (Brandt et al., 2003). Similarly, the IHC fCaTs recorded in this study were reversibly suppressed in nominally Ca2+-free solution and absent from IHCs of Cav1.3−/− mice. Time-to-peak of fCaTs measured at the highest scan rate was 16 ms, which is in the range of the half-width of 15 ms for a Ca2+ AP at room temperature (Marcotti et al., 2003b). It is not surprising that a single fCaT lasts longer than the electrical AP because (i) Ca2+ influx into an IHC extends to the repolarizing phase of the AP due to the large driving force for Ca2+ and (ii) AP repolarization by delayed rectifier K+ and SK2 channels (Marcotti et al., 2003a; Mammano and Bortolozzi, 2018) is, particularly in minibursts and bursts, faster than clearance of Ca2+ from the cytosol by Ca2+ ATPases (Grati et al., 2006) or by uptake into intracellular stores and mitochondria (Kennedy, 2002), see Figure 3C. Ca2+-induced Ca2+ release from ryanodine-sensitive stores (Iosub et al., 2015) may additionally increase and prolong the Ca2+ signal in IHCs. Further, Fluo-8 acts as a Ca2+ buffer itself and could slow the Ca2+ decay kinetics. The dissociation time constant of the chemically related Fluo-3 is ~5 ms (Eberhard and Erne, 1989), much faster than the average decay time of fCaTs of 880 ms. Further, our fCaTs resemble the events measured with simultaneous imaging of Fluo-4FF-filled IHCs and Ca2+ APs recordings in current clamp (Iosub et al., 2015). Taken together, IHC fCaTs imaged under our conditions reflect the Ca2+ signals resulting from IHC APs.
It might be argued that due to the limited z-resolution of a confocal LSM compared with its resolution in x and y, we recorded signals from inner phalangeal cells rather than from IHCs, especially when IHCs were oriented steeply within the organ of Corti. However, Ca2+ signals of ROIs taken well inside those IHCs that had a shallow position clearly showed a different temporal pattern including fCaTs compared with adjacent ROIs likely involving inner phalangeal cells, which always lacked fCaTs (e.g., Figures 2A,I, ISC III). However, some bleed-through of fluorescence from inner phalangeal cell signals to IHCs in the z-direction cannot be excluded.
ATP Independently Triggers Ca2+ Elevations in Both ISCs and IHCs
Applying 1 μM ATP from the pillar side towards the modiolus elicited bursts of fCaTs that were highly synchronized between neighboring IHCs and appeared before Ca2+ had risen in adjacent ISCs (Figure 5). This indicates that ATP can trigger IHC Ca2+ APs independently of ISC Ca2+ waves. Moreover, the large reduction of Ca2+ wave-independent IHC fCaTs under the broad spectrum P2R blocker PPADS (Figure 6) favors a role of P2 receptors in increasing the IHC’s susceptibility to generate Ca2+ APs. These results are consistent with ATP-induced inward currents through P2X receptors in IHCs (Tritsch and Bergles, 2010), which according to mRNA/protein expression data or PPADS sensitivity suggests contribution of P2X2, P2X3, P2X4, P2X7 before the onset of hearing (Nikolic et al., 2003; Huang et al., 2005; Coddou et al., 2011), yet contribution of P2Y receptors cannot be ruled out (Abbracchio et al., 2006; Huang et al., 2010). Regarding PPADS-sensitive ATP-mediated Ca2+ signals in ISCs, P2Y receptors such as P2Y1, P2Y2, P2Y4 and P2Y6 may be involved (Abbracchio et al., 2006; Huang et al., 2010) but P2X receptors may additionally contribute (Tritsch et al., 2007; Coddou et al., 2011).
Electrical recordings of IHC Ca2+ APs, which require access of the patch pipette to the body of the IHC, inevitably cause tissue damage and release of ATP, either during “cleaning” of an IHC from ISCs at one side before establishing the pipette seal, or when approaching the IHC under pressure similar as in a tissue slice. Due to local ATP release in patch-clamp experiments, the interpretation of IHC AP activity as spontaneously occurring should be taken with caution. Release of ATP also occurs when recording from ISCs (Tritsch et al., 2007; Wang et al., 2015), which makes the interpretation of the players in the interaction between Ca2+ waves and IHC Ca2+ APs and a differentiation of putative roles of ATP rather challenging. Our free-running whole-mount preparation has the advantage that the epithelium was left intact within a region much larger than the field of view, which allowed imaging the interaction of ISC Ca2+ waves and IHC fCaTs without local tissue damage and contamination with ATP. The fact that ISC Ca2+ waves did not repeatedly originate from the same foci suggests that the tissue in the field of view was not injured.
Electrical Properties of IHCs Sustain Autonomous Ca2+ AP Activity
Frequently, single fCaTs and minibursts but sometimes also bursts were observed in IHCs in the absence of Ca2+ waves in adjacent ISCs (Figures 5, 8, 9; summarized in Figure 10), which were termed here spontaneous or autonomous IHC events. These events reflecting Ca2+ APs were therefore neither the consequence of extracellular K+ accumulation through K+ efflux nor of ATP release from the ISCs (see below). It is rather likely that sizes and properties of IHC currents, such as Cav1.3 currents, various K+ currents including SK2, transducer currents at rest, purinergic currents, cholinergic currents (Brandt et al., 2003; Marcotti et al., 2004; Housley et al., 2006; Johnson et al., 2007, 2012) favor to the ability of the IHC to produce regenerative Ca2+ APs.
Coupling of ISC Ca2+ Waves to IHC Ca2+ Signals
When an ISC Ca2+ wave invaded the IHC region it typically elicited bursts of fCaTs in IHCs. The sizes of ISC Ca2+ waves correlated with the number of activated IHCs; large waves activated more IHCs that responded by synchronously generating bursts with an average delay of 0.52 s (Figure 10). The mechanism of coupling between ISCs and IHC APs is not entirely clear. One proposed mechanism is the regenerative efflux of ATP through connexin hemichannels into the endolymph and activation of P2X2 and P2X3 receptors (perhaps also P2X7) at the IHC (Anselmi et al., 2008; Majumder et al., 2010; Johnson et al., 2011; Mammano and Bortolozzi, 2018). As the ATP superfused from the pillar side evoked bursts in IHCs before eliciting Ca2+ transients in the ISCs (Figures 5D,E), a direct ATP activation of IHCs could possibly occur in vivo. However, the fact that IHC fCaT activity was unaffected in P2X2R−/−/P2X3R−/− and in P2X7−/− mice indicates that neither of the receptors was essential for activating IHCs by incoming Ca2+ waves. Because IHCs from P2X4R−/− mice produced normal Ca2+ APs (Sendin et al., 2014), an essential role of P2X4 receptors for IHC Ca2+ AP activity can be excluded, too. Recently, an alternative, ATP-independent mechanism of IHC activation has been proposed, in which the Ca2+ elevation in ISCs opens Ca2+-dependent Cl− channels resulting in a coupled efflux of Cl−, K+ and water (Wang et al., 2015). The accumulation of K+ ions around the IHCs in turn depolarizes the IHC over the threshold of AP generation (Wang et al., 2015).
Does AP-Induced Extracellular K+ Accumulation Synchronize Neighboring IHCs?
We repeatedly observed that neighboring IHCs synchronously generated Ca2+ signals (from single fCaTs to bursts) in the absence of ISC Ca2+ waves (Figure 5A,B, 9E). Because AP activity of an IHC itself causes efflux of K+ ions (Marcotti et al., 2003a, 2004), a sizeable amount of K+ ions may have been able to depolarize neighboring IHCs over the threshold for generating Ca2+ APs. The basolateral part of an IHC is surrounded by specialized ISCs, the inner phalangeal cells, leaving a small extracellular volume in which K+ efflux from the IHC may lead to a substantial increase in the extracellular K+ concentration. Inner phalangeal cells around the IHCs normally remove K+ ions by means of Kir4.1 channels (Eckhard et al., 2012), but their uptake rate might be insufficient at times, leading to a series of fCaTs in an IHC and its neighbors.
Spontaneous Activity in the Immature Cochlea
The limited number of fCaTs in a burst (mean: 15.3 ± 9.5) and its limited duration suggest that a rising Ca2+ level probably activated SK2 channels, which in turn hyperpolarized the membrane potential of the IHCs and prevented further Ca2+ APs (Johnson et al., 2007), shaping a temporally structured pattern of Ca2+ APs (Johnson et al., 2011; Sendin et al., 2014). In vivo, AP patterning in the central auditory system is additionally shaped by inhibition of IHC Ca2+ AP activity through efferent cholinergic fibers acting via α9/α10 acetylcholine receptors coupling to SK2 channels (Glowatzki and Fuchs, 2000; Clause et al., 2014). Our data support the existence of two independent types of spontaneous activity in the developing auditory system, autonomous generation of Ca2+ APs in IHCs independent of ISC Ca2+ waves and the stochastic generation of Ca2+ transients in ISCs that elicit Ca2+ waves inducing synchronized bursts of IHC Ca2+ APs. The role of these different types of spontaneous activity for the firing patterns of spiral ganglion neurons with a functioning inhibitory efferent system in vivo needs to be established.
Author Contributions
JE and TE designed the study. TE and KB acquired Ca2+ imaging data. TE, KB and IM analyzed the data. TE, KB, IM and JE prepared the manuscript.
Funding
This work was supported by Deutsche Forschungsgemeinschaft (DFG) SFB 1027 (A4, JE), SFB 894 (A8, JE) and Saarland University.
Conflict of Interest Statement
The authors declare that the research was conducted in the absence of any commercial or financial relationships that could be construed as a potential conflict of interest.
The reviewer RL and handling Editor declared their shared affiliation at the time of review.
Acknowledgments
We thank Jennifer Ihl, Kerstin Fischer and Angela Di Turi for excellent technical assistance and Stefan Münkner for help with data analysis and discussion. This work is dedicated to the memory of Alfons Rüsch.
References
Abbracchio, M. P., Burnstock, G., Boeynaems, J. M., Barnard, E. A., Boyer, J. L., Kennedy, C., et al. (2006). International union of pharmacology LVIII: update on the P2Y G protein-coupled nucleotide receptors: from molecular mechanisms and pathophysiology to therapy. Pharmacol. Rev. 58, 281–341. doi: 10.1124/pr.58.3.3
Anselmi, F., Hernandez, V. H., Crispino, G., Seydel, A., Ortolano, S., Roper, S. D., et al. (2008). ATP release through connexin hemichannels and gap junction transfer of second messengers propagate Ca2+ signals across the inner ear. Proc. Natl. Acad. Sci. U S A 105, 18770–18775. doi: 10.1073/pnas.0800793105
Blankenship, A. G., and Feller, M. B. (2010). Mechanisms underlying spontaneous patterned activity in developing neural circuits. Nat. Rev. Neurosci. 11, 18–29. doi: 10.1038/nrn2759
Brändle, U., Zenner, H.-P., and Ruppersberg, J. P. (1999). Gene expression of P2X-receptors in the developing inner ear of the rat. Neurosci. Lett. 273, 105–108. doi: 10.1016/s0304-3940(99)00648-5
Brandt, N., Kuhn, S., Münkner, S., Braig, C., Winter, H., Blin, N., et al. (2007). Thyroid hormone deficiency affects postnatal spiking activity and expression of Ca2+ and K+ channels in rodent inner hair cells. J. Neurosci. 27, 3174–3186. doi: 10.1523/JNEUROSCI.3965-06.2007
Brandt, A., Striessnig, J., and Moser, T. (2003). CaV1.3 channels are essential for development and presynaptic activity of cochlear inner hair cells. J. Neurosci. 23, 10832–10840. doi: 10.1523/JNEUROSCI.23-34-10832.2003
Ceriani, F., Ciubotaru, C. D., Bortolozzi, M., and Mammano, F. (2016a). “Design and construction of a cost-effective spinning disk system for live imaging of inner ear tissue,” in Auditory and Vestibular Research, ed. B. Sokolowski (New York, NY: Springer New York), 223–241.
Ceriani, F., Pozzan, T., and Mammano, F. (2016b). Critical role of ATP-induced ATP release for Ca2+ signaling in nonsensory cell networks of the developing cochlea. Proc. Natl. Acad. Sci. U S A 113, E7194–E7201. doi: 10.1073/pnas.1616061113
Clause, A., Kim, G., Sonntag, M., Weisz, C. J. C., Vetter, D. E., Rbsamen, R., et al. (2014). The precise temporal pattern of prehearing spontaneous activity is necessary for tonotopic map refinement. Neuron 82, 822–835. doi: 10.1016/j.neuron.2014.04.001
Cockayne, D. A., Dunn, P. M., Zhong, Y., Rong, W., Hamilton, S. G., Knight, G. E., et al. (2005). P2X2 knockout mice and P2X2/P2X3 double knockout mice reveal a role for the P2X2 receptor subunit in mediating multiple sensory effects of ATP. J. Physiol. 567, 621–639. doi: 10.1113/jphysiol.2005.088435
Coddou, C., Yan, Z., Obsil, T., Huidobro-Toro, J. P., and Stojilkovic, S. S. (2011). activation and regulation of purinergic P2X receptor channels. Pharmacol. Rev. 63, 641–683. doi: 10.1124/pr.110.003129
Dayaratne, M. W. N., Vlajkovic, S. M., Lipski, J., and Thorne, P. R. (2015). Putative role of border cells in generating spontaneous morphological activity within Kölliker’s organ. Hear. Res. 330, 90–97. doi: 10.1016/j.heares.2015.06.017
Eberhard, M., and Erne, P. (1989). Kinetics of calcium binding to fluo-3 determined by stopped-flow fluorescence. Biochem. Biophys. Res. Commun. 163, 309–314. doi: 10.1016/0006-291x(89)92136-0
Eckhard, A., Gleiser, C., Rask-Andersen, H., Arnold, H., Liu, W., Mack, A., et al. (2012). Co-localisation of Kir4.1 and AQP4 in rat and human cochleae reveals a gap in water channel expression at the transduction sites of endocochlear K+ recycling routes. Cell Tissue Res. 350, 27–43. doi: 10.1007/s00441-012-1456-y
Gee, K. R., Brown, K. A., Chen, W. N., Bishop-Stewart, J., Gray, D., and Johnson, I. (2000). Chemical and physiological characterization of fluo-4 Ca2+-indicator dyes. Cell Calcium 27, 97–106. doi: 10.1054/ceca.1999.0095
Glowatzki, E., and Fuchs, P. A. (2000). Cholinergic synaptic inhibition of inner hair cells in the neonatal mammalian cochlea. Science 288, 2366–2368. doi: 10.1126/science.288.5475.2366
Glowatzki, E., and Fuchs, P. A. (2002). Transmitter release at the hair cell ribbon synapse. Nat. Neurosci. 5, 147–154. doi: 10.1038/nn796
Grati, M., Aggarwal, N., Strehler, E. E., and Wenthold, R. J. (2006). Molecular determinants for differential membrane trafficking of PMCA1 and PMCA2 in mammalian hair cells. J. Cell Sci. 119, 2995–3007. doi: 10.1242/jcs.03030
Housley, G. D., Marcotti, W., Navaratnam, D., and Yamoah, E. N. (2006). Hair cells—beyond the transducer. J. Membr. Biol. 209, 89–118. doi: 10.1007/s00232-005-0835-7
Huang, L.-C., Greenwood, D., Thorne, P. R., and Housley, G. D. (2005). Developmental regulation of neuron-specific P2X3 receptor expression in the rat cochlea. J. Comp. Neurol. 484, 133–143. doi: 10.1002/cne.20442
Huang, L.-C., Thorne, P. R., Vlajkovic, S. M., and Housley, G. D. (2010). Differential expression of P2Y receptors in the rat cochlea during development. Purinergic Signal. 6, 231–248. doi: 10.1007/s11302-010-9191-x
Iosub, R., Avitabile, D., Grant, L., Tsaneva-Atanasova, K., and Kennedy, H. J. (2015). Calcium-induced calcium release during action potential firing in developing inner hair cells. Biophys. J. 108, 1003–1012. doi: 10.1016/j.bpj.2014.11.3489
Johnson, S. L., Adelman, J. P., and Marcotti, W. (2007). Genetic deletion of SK2 channels in mouse inner hair cells prevents the developmental linearization in the Ca2+ dependence of exocytosis. J. Physiol. 583, 631–646. doi: 10.1113/jphysiol.2007.136630
Johnson, S. L., Ceriani, F., Houston, O., Polishchuk, R., Polishchuk, E., Crispino, G., et al. (2017). Connexin-mediated signaling in nonsensory cells is crucial for the development of sensory inner hair cells in the mouse cochlea. J. Neurosci. 37, 258–268. doi: 10.1523/JNEUROSCI.2251-16.2016
Johnson, M., Cockayne, A., Williams, P. H., and Morrissey, J. A. (2005). Iron-responsive regulation of biofilm formation in staphylococcus aureus involves fur-dependent and fur-independent mechanisms. J. Bacteriol. 187, 8211–8215. doi: 10.1128/jb.187.23.8211-8215.2005
Johnson, S. L., Eckrich, T., Kuhn, S., Zampini, V., Franz, C., Ranatunga, K. M., et al. (2011). Position-dependent patterning of spontaneous action potentials in immature cochlear inner hair cells. Nat. Neurosci. 14, 711–717. doi: 10.1038/nn.2803
Johnson, S. L., Kennedy, H. J., Holley, M. C., Fettiplace, R., and Marcotti, W. (2012). The resting transducer current drives spontaneous activity in prehearing mammalian cochlear inner hair cells. J. Neurosci. 32, 10479–10483. doi: 10.1523/JNEUROSCI.0803-12.2012
Johnson, S. L., Kuhn, S., Franz, C., Ingham, N., Furness, D. N., Knipper, M., et al. (2013). Presynaptic maturation in auditory hair cells requires a critical period of sensory-independent spiking activity. Proc. Natl. Acad. Sci. U S A 110, 8720–8725. doi: 10.1073/pnas.1219578110
Kennedy, H. J. (2002). Intracellular calcium regulation in inner hair cells from neonatal mice. Cell Calcium 31, 127–136. doi: 10.1054/ceca.2001.0267
Kros, C. J., Ruppersberg, J. P., and Rusch, A. (1998). Expression of a potassium current in inner hair cells during development of hearing in mice. Nature 394, 281–284. doi: 10.1038/28401
Leighton, A. H., and Lohmann, C. (2016). The wiring of developing sensory circuits—from patterned spontaneous activity to synaptic plasticity mechanisms. Front. Neural Circuits 10:71. doi: 10.3389/fncir.2016.00071
Majumder, P., Crispino, G., Rodriguez, L., Ciubotaru, C. D., Anselmi, F., Piazza, V., et al. (2010). ATP-mediated cell-cell signaling in the organ of Corti: the role of connexin channels. Purinergic Signal. 6, 167–187. doi: 10.1007/s11302-010-9192-9
Mammano, F., and Bortolozzi, M. (2018). Ca2+ signaling, apoptosis and autophagy in the developing cochlea: milestones to hearing acquisition. Cell Calcium 70, 117–126. doi: 10.1016/j.ceca.2017.05.006
Marcotti, W., Johnson, S. L., Holley, M. C., and Kros, C. J. (2003a). Developmental changes in the expression of potassium currents of embryonic, neonatal and mature mouse inner hair cells. J. Physiol. 548, 383–400. doi: 10.1111/j.1469-7793.2003.00383.x
Marcotti, W., Johnson, S. L., Rusch, A., and Kros, C. J. (2003b). Sodium and calcium currents shape action potentials in immature mouse inner hair cells. J. Physiol. 552, 743–761. doi: 10.1113/jphysiol.2003.043612
Marcotti, W., Johnson, S. L., and Kros, C. J. (2004). A transiently expressed SK current sustains and modulates action potential activity in immature mouse inner hair cells. J. Physiol. 560, 691–708. doi: 10.1113/jphysiol.2004.072868
Moody, W. J., and Bosma, M. M. (2005). Ion channel development, spontaneous activity, and activity-dependent development in nerve and muscle cells. Physiol. Rev. 85, 883–941. doi: 10.1152/physrev.00017.2004
Müller, M., von Hunerbein, K., Hoidis, S., and Smolders, J. W. (2005). A physiological place-frequency map of the cochlea in the CBA/J mouse. Hear. Res. 202, 63–73. doi: 10.1016/j.heares.2004.08.011
Nikolic, P., Housley, G. D., and Thorne, P. R. (2003). Expression of the P2X7 receptor subunit of the adenosine 5′-triphosphate-gated ion channel in the developing and adult rat cochlea. Audiol. Neurootol. 8, 28–37. doi: 10.1159/000067891
Platzer, J., Engel, J., Schrott-Fischer, A., Stephan, K., Bova, S., Chen, H., et al. (2000). Congenital deafness and sinoatrial node dysfunction in mice lacking class D L-type Ca2+ channels. Cell 102, 89–97. doi: 10.1016/s0092-8674(00)00013-1
Schindelin, J., Arganda-Carreras, I., Frise, E., Kaynig, V., Longair, M., Pietzsch, T., et al. (2012). Fiji: an open-source platform for biological-image analysis. Nat. Methods 9, 676–682. doi: 10.1038/nmeth.2019
Sendin, G., Bourien, J., Rassendren, F., Puel, J.-L., and Nouvian, R. (2014). Spatiotemporal pattern of action potential firing in developing inner hair cells of the mouse cochlea. Proc. Natl. Acad. Sci. U S A 111, 1999–2004. doi: 10.1073/pnas.1319615111
Shatz, C. J. (1996). Emergence of order in visual system development. J. Physiol. Paris 90, 141–150. doi: 10.1016/s0928-4257(97)81413-1
Stellwagen, D., and Shatz, C. J. (2002). An instructive role for retinal waves in the development of retinogeniculate connectivity. Neuron 33, 357–367. doi: 10.1016/s0896-6273(02)00577-9
Tritsch, N. X., and Bergles, D. E. (2010). Developmental regulation of spontaneous activity in the Mammalian cochlea. J. Neurosci. 30, 1539–1550. doi: 10.1523/JNEUROSCI.3875-09.2010
Tritsch, N. X., Rodríguez-Contreras, A., Crins, T. T., Wang, H. C., Borst, J. G., and Bergles, D. E. (2010). Calcium action potentials in hair cells pattern auditory neuron activity before hearing onset. Nat. Neurosci. 13, 1050–1052. doi: 10.1038/nn.2604
Tritsch, N. X., Yi, E., Gale, J. E., Glowatzki, E., and Bergles, D. E. (2007). The origin of spontaneous activity in the developing auditory system. Nature 450, 50–55. doi: 10.1038/nature06233
Keywords: cochlea, spontaneous activity, development, Ca2+ wave, inner hair cell, CaV1.3
Citation: Eckrich T, Blum K, Milenkovic I and Engel J (2018) Fast Ca2+ Transients of Inner Hair Cells Arise Coupled and Uncoupled to Ca2+ Waves of Inner Supporting Cells in the Developing Mouse Cochlea. Front. Mol. Neurosci. 11:264. doi: 10.3389/fnmol.2018.00264
Received: 23 March 2018; Accepted: 12 July 2018;
Published: 30 July 2018.
Edited by:
Gaiti Hasan, National Centre for Biological Sciences, IndiaReviewed by:
Vicente Lumbreras, University of Chicago, United StatesSung Jun Jung, Hanyang University, South Korea
Raj Ladher, National Centre for Biological Sciences, India
Copyright © 2018 Eckrich, Blum, Milenkovic and Engel. This is an open-access article distributed under the terms of the Creative Commons Attribution License (CC BY). The use, distribution or reproduction in other forums is permitted, provided the original author(s) and the copyright owner(s) are credited and that the original publication in this journal is cited, in accordance with accepted academic practice. No use, distribution or reproduction is permitted which does not comply with these terms.
*Correspondence: Jutta Engel, anV0dGEuZW5nZWxAdW5pLXNhYXJsYW5kLmRl