 Kelsey Bicknell
 Peter Regier
 David J. Van Horn
 Kelli L. Feeser
 Ricardo González-Pinzón
- 1Department of Civil, Construction and Environmental Engineering, University of New Mexico, Albuquerque, NM, United States
- 2Department of Biology, University of New Mexico, Albuquerque, NM, United States
In this study, we explored opportunities to optimize food-energy-water (FEW) resources by closing nutrient loops in aridland rivers. We evaluated source and sink behavior of nitrogen as nitrate (NO3-N) in three connected channels associated with an irrigation network, i.e., man-made delivery and drain canals, and the main stem of the Rio Grande river near Albuquerque, New Mexico, USA. All three channels are located downstream of a large wastewater treatment plant that is the main contributor of nutrients to this reach of the Rio Grande. We used a mass balance approach paired with stable isotope analysis to link sources and processing of NO3-N with reaction pathways within the channels over time (a year) and through space (along ~14–53 km reaches). Results indicated that the growing season was an important period of net sink behavior for the delivery channel and the Rio Grande, but the drain channel was a year-round net source. Stable isotope analyses of 15N and 18O found a distinct nitrate signature in the drain associated with biological processing, as well as sites along the Rio Grande impacted by agricultural outflow, but no equivalent signature was present in the delivery channel. Based on our findings, we provide recommendations to help close nutrient loops in our study system and in analogous aridland irrigation networks by (1) minimizing loss during the transfer of nutrients from wastewater facilities to agricultural areas, and (2) minimizing enrichment to downstream aquatic ecosystems by sequestering nutrients that would otherwise escape the nutrient loop.
Introduction
Nitrogen (N) and phosphorus (P) are limiting nutrients for plant growth (Chapin, 1980; Vitousek and Howarth, 1991), and current agricultural practices depend on addition of both N and P via fertilizers for crop production to keep pace with global food consumption (Gruber and Galloway, 2008). The majority of N and P fertilizers produced worldwide rely either on limited resources (i.e., phosphate mining) or energy-intensive, polluting processes (i.e., the Haber-Bosch process) (Erisman et al., 2008; Cordell et al., 2009). As global fertilizer production increases, higher demands on finite resources have motivated efforts to increase nutrient use efficiency through closing nutrient loops (Mortensen et al., 2016).
Holistic approaches to ecosystem management recognize that managing the food-energy-water (FEW) sectors in isolation is unsustainable and this has sparked the call for FEW nexus approaches toward environmental sustainability and resource security (FAO, 2014; NSF, 2014). Within this context, expanding wastewater reuse could help close nutrient loops through nutrient recycling and result in energy savings, including reduced fertilizer production and transportation, improving resource recovery and potentially environmental health (Hanjra et al., 2012). This approach is particularly relevant in arid regions because water is scarce and waste water treatment plant (WWTP) effluents are often the dominant source of bioavailable nutrients to streams and rivers, given that most of the population reside near large arid rivers (Caraco and Cole, 2001; Dumont et al., 2005; Harrison et al., 2005; Mortensen et al., 2016). For example, in the study region described here, 50% of New Mexicans live in the Albuquerque metropolitan area along the Rio Grande valley, and similar cases occur in Idaho along the Snake River, Arizona along the Gila River, multiple states along the Colorado River, Australia, western Spain, Mexico, and muliple countries in Africa along the Nile river.
Recent global estimates suggest that about 10 and 2 g/person/day of N and P, respectively, are available as nutrients in wastewater from human metabolism, representing magnitudes that are comparable to major components of nutrient cycles (Larsen et al., 2016). For example, the N available from the wastewater generated by nine billion people would be on the same order of magnitude as anthropogenic production through the energy-intensive Haber-Bosh fixation process (forecasted as ~35 Mt of reactive N per year). Recent sustainability assessments suggest that an estimated 40% of nitrogen fertilizer is lost back to the environment rather than utilized by crops (Galloway et al., 2004), and increased nutrient recycling from wastewater effluents may provide a source to offset such losses (Childers et al., 2011; Larsen et al., 2016).
Recycling wastewater as a management technique to close nutrient loops relies on identifying nutrient sources and sinks in fluvial networks, particularly in large rivers. In aridlands, irrigation networks contain high densities of regulatory structures (e.g., dams and weirs), infrastructure (e.g., supply canals and drainage ditches), and intermittent flow paths (e.g., flood irrigation of fields) that enhance nutrient retention via increased residence times, uptake in biogeochemically heterogeneous channels, and uptake by channel vegetation and crops (Soana et al., 2011; Bartoli et al., 2012; Lassaletta et al., 2012; Mortensen et al., 2016). In these regions, water is withdrawn from large rivers at diversion dams, routed into canals that bifurcate until they form small channels, and is applied to fields through flood irrigation. This water then percolates through the soil column, enters the shallow alluvial aquifer, and flows via shallow groundwater flowpaths to low-lying agricultural return drains. These drains gather water from numerous subsurface outflows, coalesce to form larger channels, and eventually return to the river at outflow points. This complex system effectively turns the aridland river flood plains into systems that can be highly nutrient retentive (Caraco and Cole, 2001) and provide the potential to close nutrient loops by recycling the nutrients from wastewater effluent back into crops (Mortensen et al., 2016).
While there is a clear need to maximize water and nutrient recycling in aridland fluvial networks and an abundance of conveyance and water control structures exist that could be used to facilitate these goals, little is known about nutrient processing rates in the different compartments of these systems and how management can be structured to optimize nutrient reuse (Mortensen et al., 2016). In this study, we used rapid assessments (i.e., cross-sectional and longitudinal monitoring assessments taken at multiple sites within a day) over a year in three characteristic reaches of an aridland river-irrigation network in the Middle Rio Grande Basin to resolve spatiotemporal patterns of nutrient sources, processing, and reaction pathways. Based on our understanding of the system, we developed recommendations to (1) minimize loss during the transfer of nutrients from wastewater facilities to agricultural areas, and (2) minimize enrichment to downstream aquatic ecosystems by sequestering nutrients that would otherwise escape the nutrient loop.
Methods
Site Description
This study took place in the Middle Rio Grande Basin in New Mexico, USA. This basin is the most agriculturally productive and densely populated area along the 3,000 km length of the Rio Grande river (Figure 1), and encompasses a reach ~300 km long bounded by Cochiti Dam to the north and Elephant Butte Reservoir to the south. The Rio Grande is the main source of water for flood irrigation to over 4,000 km2 of cropland, which consists primarily of alfalfa and pasture grass. The historic river floodplain contains a complex network of adjacent channels, summing to ~2,100 km of delivery canals and acequias (small irrigation ditches) that carry water to croplands and drain ditches that return excess water back to the main river. This irrigation network is managed and maintained by the Middle Rio Grande Conservancy District (MRGCD).
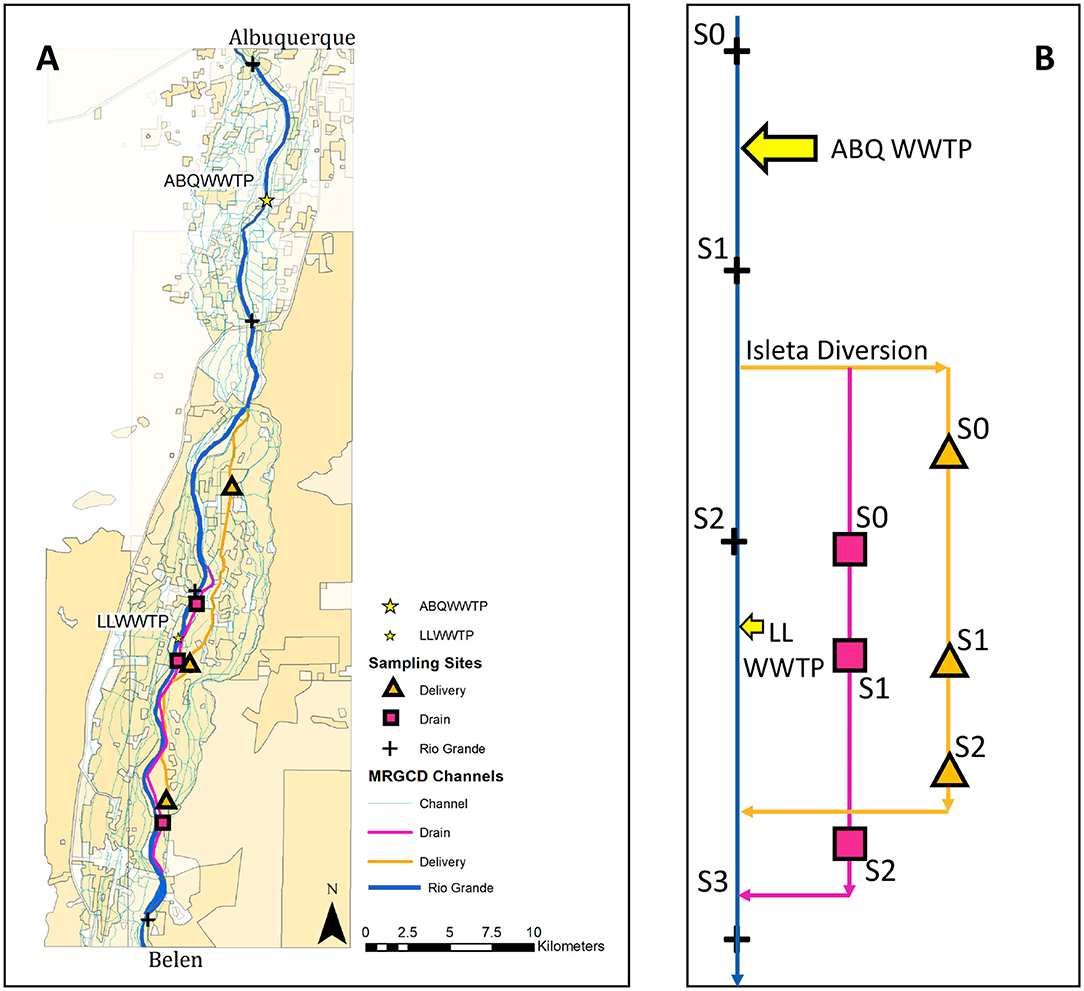
Figure 1. (A) Study reaches: Rio Grande (blue), Drain (pink), and Delivery (orange) channels with sampling sites along each (black markers). The Albuquerque WWTP (ABQ WWTP) and the Los Lunas WWTP (LL WWTP) discharge into the Rio Grande, and are labeled in yellow. (B) Flow schematic using the same color scheme as (A) to show the location of sampling sites in Table 1 in relation to various inputs.
We studied two major characteristic channels of this irrigation network, i.e., a delivery and a drain canal, and the main channel of the Rio Grande, to understand nutrient sources and sinks and the biogeochemical and hydrological processes occurring during the growing (March-October) and non-growing (November-February) seasons. In the area of the study sites, water is diverted from the Rio Grande at Isleta Diversion Dam into delivery canals and acequias (irrigation ditches) that supply agricultural users (Figure 1). At the start and end of the growing season, the delivery canals are flushed with high flows to remove debris from the channel. Return drains, which are dredged below the elevation of the water table, collect excess irrigation water, drainage from the agriculture fields, and lateral groundwater seepage from the river. The water in the drains is returned to the Rio Grande ~50 km downstream of where it was diverted (Bartolino and Cole, 2002). The specific channels that we studied were the Peralta Main Canal and Lower Peralta Riverside Drain, hereafter referred to as the “Delivery” and the “Drain,” respectively (Figure 2). These sites were selected for study based on accessibility and minimal cross connections between conveyance types.
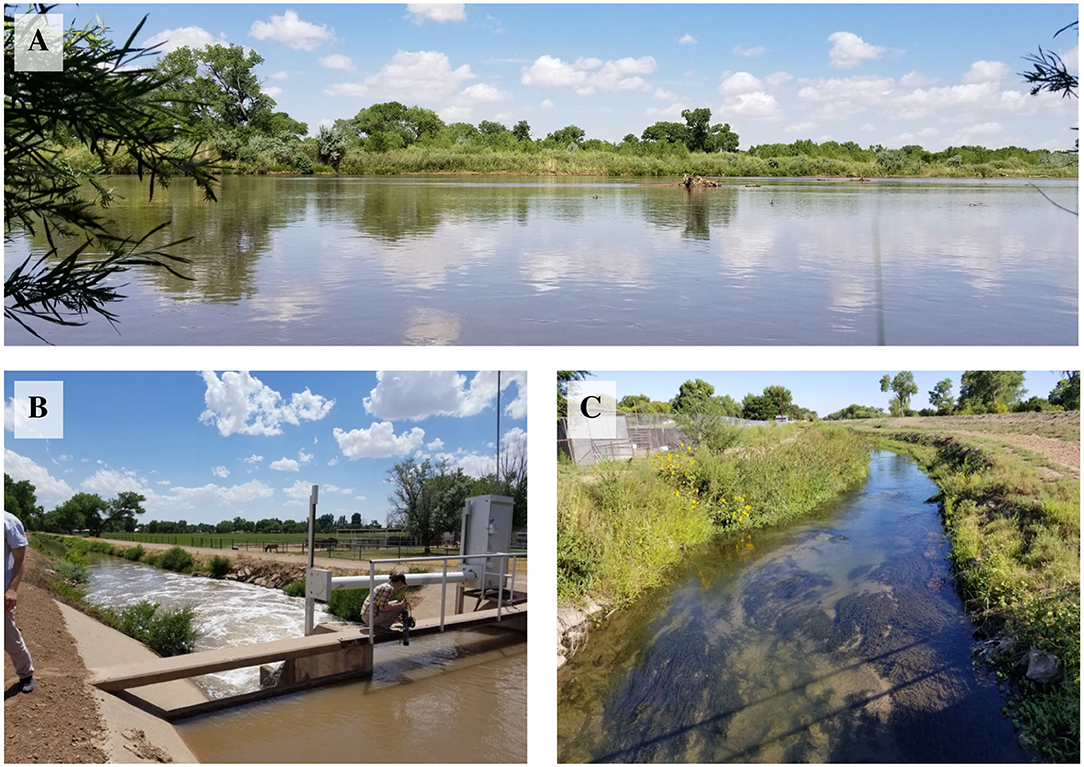
Figure 2. Sampling sites at the (A) Rio Grande (~110 m wide), (B) Delivery Canal (~8 m wide), and (C) Drain (~6 m wide).
Flows within the Delivery canal (~8 m top width) vary between 0.4 and 7 m3/s from the point of diversion to the point of return to the Rio Grande during the growing season (the canal runs dry during the non-growing season). Turbidity (~300 NTU on average, with peaks of up to 5,000 NTU) and sediment texture (~99.8% of sediment particles are <10 mm, and ~4% are <0.1 mm) are similar to that of the Rio Grande (Fluke et al., 2019; Regier et al., 2020), and primary productivity is limited to the edge of the wetted channel and its surrounding banks. The discharge in the Drain (~6 m top width) varies between 0.4 and 2.5 m3/s. Turbidity is low (~20 NTU on average) in this channel, with the bed of the channel covered in filamentous algae and emergent macrophytes. The banks of the Delivery canal and the Drain are lined with Coyote Willow (Salix exigua) and various species of grass (Agrostis gigantea and Sporobolus wrightii).
Within our study reach, the Rio Grande (~110 m top width) receives inputs from the Albuquerque WWTP (ABQ WWTP) and the Los Lunas WWTP (LL WWTP) (Figure 1). The ABQ WWTP releases ~2.5 m3/s of water at concentrations between 3 and 5 mg/L of NO3-N into the Rio Grande upstream of the Isleta Diversion Dam, thus water in the Delivery canal is a mix of water from the Rio Grande and ABQ WWTP effluent. The LL WWTP releases ~0.05 m3/s at concentrations ranging from 4 to 25 mg/L NO3-N downstream of the Isleta Diversion Dam (Van Horn, 2010; Mortensen et al., 2016).
Data Collection
We took water samples every month along the study reaches between October 2017 and October 2018, for a total of 13 sampling campaigns. We identified three to four sampling sites along each reach to track the longitudinal change in NO3-N loads (kg/day) and isotopic signals as water traveled through the system. The length between the first and last monitoring sites in the Delivery, Drain, and Rio Grande reaches were 21, 14, and 53 km, respectively (Figure 1, Table 1). Point sources (i.e., small drains discharging) to each reach were also sampled to calculate nutrient budgets. Sampling sites were chosen due to their proximity to a gauging station operated by either the USGS or MRGCD (Table 1) and point sources were visually identified in reconnaissance campaigns. At sites that were ungauged, discharge was measured using a SonTek FlowTracker handheld ADV (SonTek, San Diego, CA). The Delivery canal was not sampled during the non-growing season as it was dry. Grab samples of water were collected using 60 mL syringes, filtered using 0.45-μm nylon filters, transported to lab on ice in the dark, and stored frozen until analysis (Pfaff, 1996).
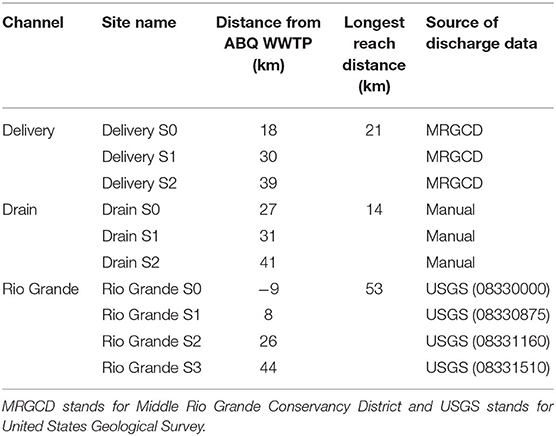
Table 1. Sampling sites and their distance from the Albuquerque WWTP.
Solute Concentrations and Isotopic Analysis
We determined Cl and NO3 concentrations from grab samples using a Dionex ICS-1000 Ion Chromatograph with AS23/AG23 analytical and guard columns. We employed dual nitrogen and oxygen isotopic analysis to determine potential nitrate sources and mechanisms of removal. For this, 20 mL aliquots from the samples collected were analyzed for ambient isotopes at the University of Washington IsoLab using a Gas Bench II coupled with a Finnigan Delta Plus Advantage mass spectrometer. Nitrate isotopes were determined using the denitrifier method (Sigman et al., 2001).
Values for 15N and 18O are reported in units of per-mil (‰), which is defined as the ratio of heavy to light isotope in the sample (Rsample) vs. a standard (Rstandard):
Measured values of 15N and 18O of NO3 are compared to international standards USGS35, USGS34, USGS32, and IAEANO3 and are reported with respect to atmospheric-N2 and the Vienna Standard Meteoric Ocean Water (VSMOW), respectively. Long-term precision for δ15N and δ18O is 0.3 and 0.5, respectively.
To evaluate potential sources of nitrate, we compared the δ15N and δ18O values of NO3 samples collected at the Albuquerque and Los Lunas WWTPs during our sampling campaigns with previous measurements of precipitation and liquid fertilizer collected near the Rio Grande (Sanchez et al., 2017). The previous, geographically similar, measures of precipitation values, which are influenced by complex atmospheric processes including nitrate formation during thunderstorms and various photochemical reactions (Kendall, 1998; Xue et al., 2009), ranged from −4.7 to −2.1 and 36.6 to 44.9‰ for δ15N-NO3 and δ18O-NO3, respectively, during the monsoon season of 2014 (Sanchez et al., 2017). These values are comparable to measured values in precipitation from other areas, where δ15N-NO3 and δ18O-NO3 values ranged from −15 to +15‰ (Kendall, 1998; Jin et al., 2019) and from +25 to +75‰ (Voerkelius and Schmidt, 1990; Durka et al., 1994; Kendall, 1998; Jin et al., 2019), respectively. Additionally, Kendall (1998) reported an average value for δ18O-NO3 in precipitation of 43.6 ± 14.6‰ (n = 232).
Similarly, the previous measurements of fertilizers from this area, which have predictable and distinctive δ15N-NO3 and δ18O-NO3 signatures due to the processes inherent to their formation (Flipse and Bonner, 1985) had values of δ15N-NO3 ranging from −0.7 to 3.1‰ (Sanchez et al., 2017). These results are comparable to compiled values from studies measuring the δ15N-NO3 of ammonium fertilizer (n = 11 studies), nitrate fertilizers (n = 8), and urea (n = 9), finding typical ranges of −6 to +6‰ (10 and 90th percentiles) (Xue et al., 2009). The synthetic nitrate in fertilizers also has a distinctive δ18O signature of +17 to +25‰ because it is primarily derived from atmospheric O2 (Amberger and Schmidt, 1987). These values are also in agreement with those from fertilizers applied locally as documented by Sanchez et al. (2017).
After establishing end-member values, we used a dual 15N and 18O isotope approach to evaluate the potential nitrate sources (i.e., WWTP effluent, precipitation, and synthetic fertilizers) of the samples collected in this study. We performed linear regression among these three end-members to create a mixing model to resolve the relative contributions of each source to nitrate in the reaches sampled. The position of samples along the regression (mixing) line with respect to end-members indicates the relative contribution of each end-member. Considering the associated standard deviations of ±2–3‰, we generalized the estimated relative contributions into bins with a range of 20% to encompass the inherent uncertainty and potential error.
When calculating the average end-member δ15N and δ18O-NO3 values, we excluded WWTP effluent samples that trended toward denitrification. The impact of microbial denitrification was also considered as it attenuates nitrate levels while simultaneously enriching the pool of residual nitrate isotopes (Kendall and Aravena, 2000; Kendall et al., 2007). The denitrification process can be identified by its unique signature of a 1:2 enrichment of δ15N:δ18O-NO3 (Böttcher et al., 1990), and any samples plotting to the right of the mixing line among end-members are considered to be denitrified (Kendall et al., 2007; Sanchez et al., 2017). Thus, we plotted denitrification vectors extending from the mixing line with a slope of 0.5 to estimate nitrate source contributions while disentangling the effects of denitrification. A total of six parallel denitrification vectors were drawn to encompass the estimated contribution bins. Samples were then analyzed with respect to the denitrification vectors to distinguish nitrate source mixing from the timing of the denitrification process, as previously described in Kendall (1998).
Nutrient Budget
We developed a non-dimensional fraction change (F) metric to understand source/sink behaviors along the study reaches based on Zarnetske et al. (2012):
where NO3 − Nup, NO3 − Ndn, and NO3 − Nin represent the upstream, downstream, and lateral (external) loads in a given reach, l is the distance between a known lateral input and the downstream site, which is located a distance L from the upstream point. When F > 1, NO3-N is being added to the system and that reach becomes a source. When F < 1, NO3-N is being removed from the system and the reach becomes a sink.
Statistics
Statistics were calculated in R using a significance threshold of p < 0.05, although actual p-values are presented where possible so that the significance of individual test results can be directly compared. Due to the non-Gaussian distributions of F-values (p < 0.0001 for Shapiro-Wilk tests), we used Wilcoxon tests to compare groups.
Results
Wastewater Influence
The Albuquerque WWTP is a major source of both water and nutrients to the Rio Grande, but its influence on the chemistry of the river depends on the seasonality of flow (Figure 3A). For example, during the period of highest flow in December 2017, the daily average discharge in the Rio Grande was 35.1 m3/s at the Central Bridge USGS gauge (#08330000), and 36.7 m3/s at the I-25 Bridge (#08330875), which are located upstream and downstream of the WWTP outfall, respectively (i.e., ~1.0× or negligible discharge increase). For these same sampling locations, the NO3-N load was 191 kg/day upstream of the WWTP, which contributed 630 kg/day to the Rio Grande, increasing its load downstream to 821 kg/day (i.e., ~4.3 × load increase). Conversely, during September of 2018, the daily average discharge of 6.3 m3/s in the Rio Grande at Central Bridge was at the lowest during the study period, and increased to 8.6 m3/s at I-25 Bridge (i.e., ~1.4× discharge increase), whereas the associated NO3-N load from the WWTP was 1,055 kg/day, increasing the NO3-N load in the Rio Grande from 114 kg/day upstream to 1,169 kg/day downstream (i.e., ~10.2× load increase). Based on the similar trends of both conservative (i.e., chloride) and non-conservative (i.e., nitrate) parameters sourced from the WWTP to the percentage of discharge sourced from the WWTP (Figure 3B), we observe that the ABQ WWTP strongly influences downstream hydrochemistry. Therefore, the dynamic mixing of the Rio Grande with ABQ WWTP effluent directly controls the water and nutrient budgets of the study reach of the Rio Grande as well as the Delivery channel, which receives river water diverted by the Isleta diversion dam (Figure 1B). The Drain channel, which receives water draining croplands (delivered by the Delivery canal) as well as intercepted groundwater, is also likely indirectly influenced by the ABQ WWTP.
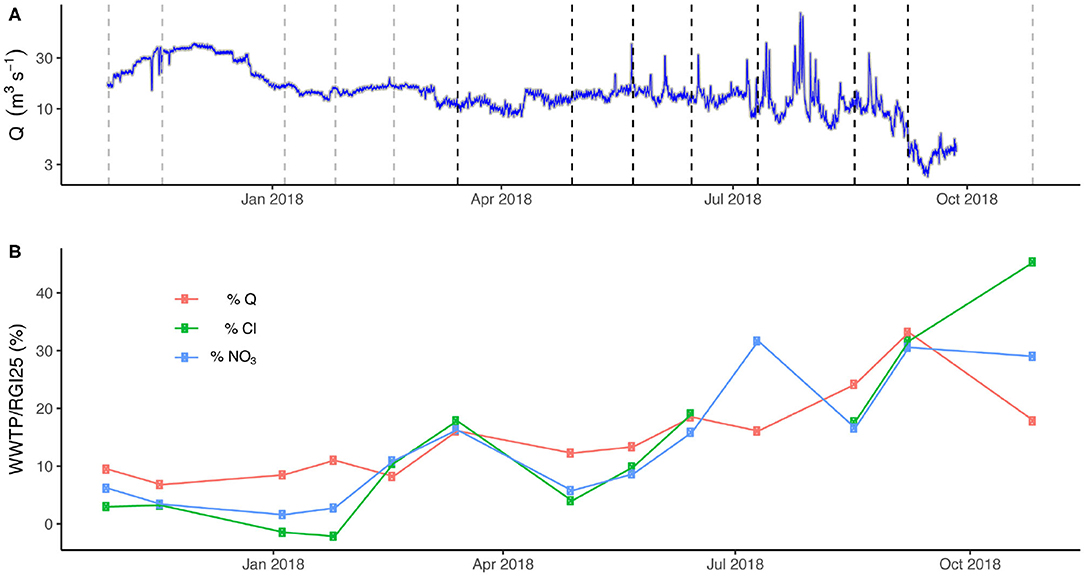
Figure 3. (A) Hydrograph from the Rio Grande at Central Bridge in Albuquerque (Rio Grande S0) during the study period. Dashed lines show sampling dates (growing season in black, non-growing season in gray). (B) Influence of the ABQ WWTP on discharge (Q), Cl, and NO3-N values observed in the Rio Grande at I-25 bridge, which is located ~9 km downstream of WWTP.
General Source/Sink Behavior
Clear differences in nitrate concentrations and source/sink behavior were observed between seasons and between the channels examined for this study (Figure 4). Nitrate concentrations were significantly higher during the growing season (p = 0.0018, Figure 4A) and were associated with lower dilution of WWTP inputs (Figure 3). Such concentrations were also significantly lower in the Drain than either the Rio Grande or the Delivery (p < 0.0001 for both, Figure 4B).
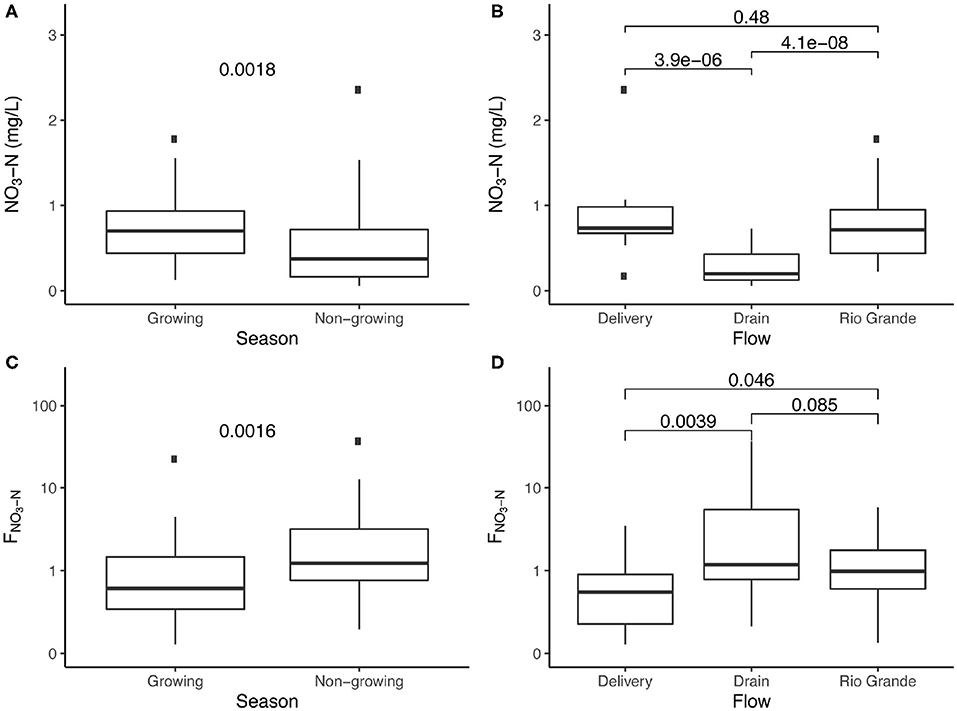
Figure 4. Nitrate concentrations and F-values (FNO3 > 1 and FNO3 < 1 represent source and sink behaviors) divided by season (A,C) and flowpath (B,D). Significance test results are presented as p-values above data.
Median FNO3 values for the growing and non-growing seasons (0.495 and 1.207, respectively) indicate that the entire system functioned as a net sink for the majority of the growing season, but as a net source for the majority of the non-growing season (Figure 4C). This is supported by a strong significant difference in FNO3 values between seasons (p = 0.0016). Median values by channel (Figure 4D) indicate that the Delivery channel primarily acts as a sink, with only 3 of 16 measurements (~19%) indicating source behavior. Rio Grande FNO3 values had a median of 0.948, with a slim majority of measurements (21 of 36, or ~57%) >1, indicating that the Rio Grande is both a sink and a source along the study reach. Drain FNO3 values were significantly higher than Delivery FNO3 values (p = 0.0039), and both a median F-value > 1 (1.176) and a higher percentage of Drain samples with FNO3 values > 1 (16 of 27, or ~59%) indicate source behavior was more common than sink behavior. A significant difference (p = 0.0460) is present between the Rio Grande and Delivery F-values in Figure 4D, though this difference is less significant than the difference between Drain and Delivery F-values (p = 0.0039).
Spatiotemporal Patterns of Source/Sink Dynamics
Figure 5 displays the spatial (x-axis) and temporal (columns) variation in source/sink (y-axis) behavior for each channel (rows). In the Delivery channel, clear sink behavior (FNO3 < 1) is present at S1 for both seasons, and at S2 during the growing season, with the strongest sink behavior (smallest FNO3) of any site at Delivery S2 (Figure 5). In the Drain, both seasons exhibit net source behavior (FNO3 > 1 at S2). During the growing season, an apparent weak sink occurs at the Drain S1 site (Figure 5). During the non-growing season, source behavior increases downstream, with strongest source behavior (largest FNO3) of any site during any season observed at Drain S2 (median FNO3 = 10.2). In the Rio Grande, sink behavior is evident at the lower two sites during the growing season, while apparent source behavior occurs at the most downstream site during the non-growing season. In general, a pattern of stronger sink behavior during the growing season is observed at Delivery S2, Drain S1, and Rio Grande S2 and S3 relative to the non-growing season.
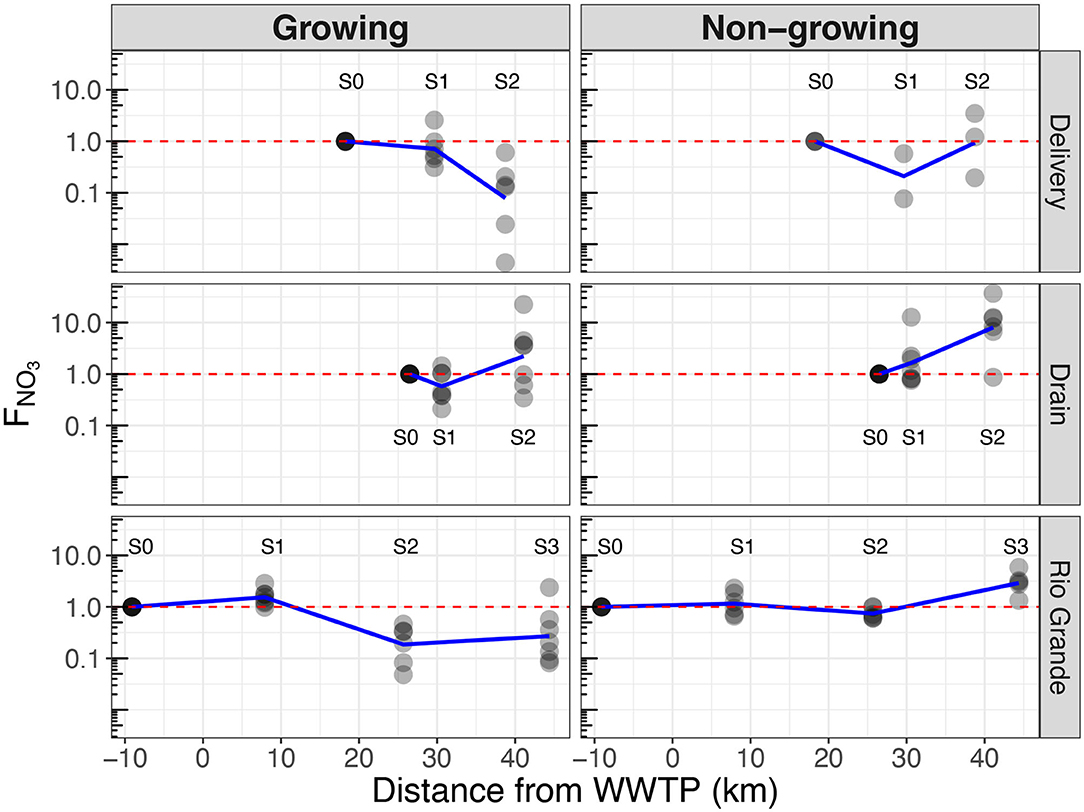
Figure 5. Source (FNO3 > 1) and sink (FNO3 < 1) behavior across channels (rows) through space and season (columns). Blue lines are mean FNO3 for all sampling events.
Isotopes as Fingerprints
We used natural abundance N and O isotope analyses to explore potential NO3-N sources and biological processing. δ15N and δ18O-NO3 values ranged from −4.1 to 20.5‰ and 0 to 36.5‰, respectively (Figure 6A, Supplementary Table 1). Average ± SD isotope values were enriched in the Drain samples (δ15N: 16.1 ± 4.5, δ18O: 4.9 ± 2.7 ‰) compared to the Rio Grande (δ15N: 12.1 ± 3.8, δ18O: −0.1 ± 3.6‰) and Delivery samples (δ15N: 13.5 ± 2.7, δ18O: −0.7 ± 2.9‰) (Table 2). We considered WWTPs, local fertilizers, and precipitation as potential sources of nitrate. Isotopes from WWTP effluent were measured in this study and combined with previously reported liquid fertilizer and precipitation measurements in the Rio Grande from Sanchez et al. (2017) (Figure 6A, Supplementary Tables 1, 3). Of the potential nitrate sources, precipitation was the most depleted in δ15N (average = −3.2 ± 1.3‰) and most enriched in δ18O (40.6 ± 3.0‰), WWTP effluent had the heaviest δ15N values (8.1 ± 2.9‰) and the lightest δ18O (−3.9 ± 1.5‰) (excluding samples that trended toward microbial denitrification), and liquid fertilizers had intermediate values (δ15N: 0.6 ± 1.7, δ18O: 18.3 ± 1.8‰). We performed linear regression among these three end-members (adjusted R2 = 0.82, p < 0.001), creating a basis for a mixing model to resolve the relative contributions of each source to nitrate in the reaches sampled (Figure 6A). Drain and Delivery samples generally plotted between fertilizer and WWTP effluent, suggesting that most of the nitrate in the system is derived from these sources and that precipitation provides a negligible input. Due to this, the mixing model was simplified to the two isotopically distinct end-members (fertilizer and WWTP effluent; Figure 6B).
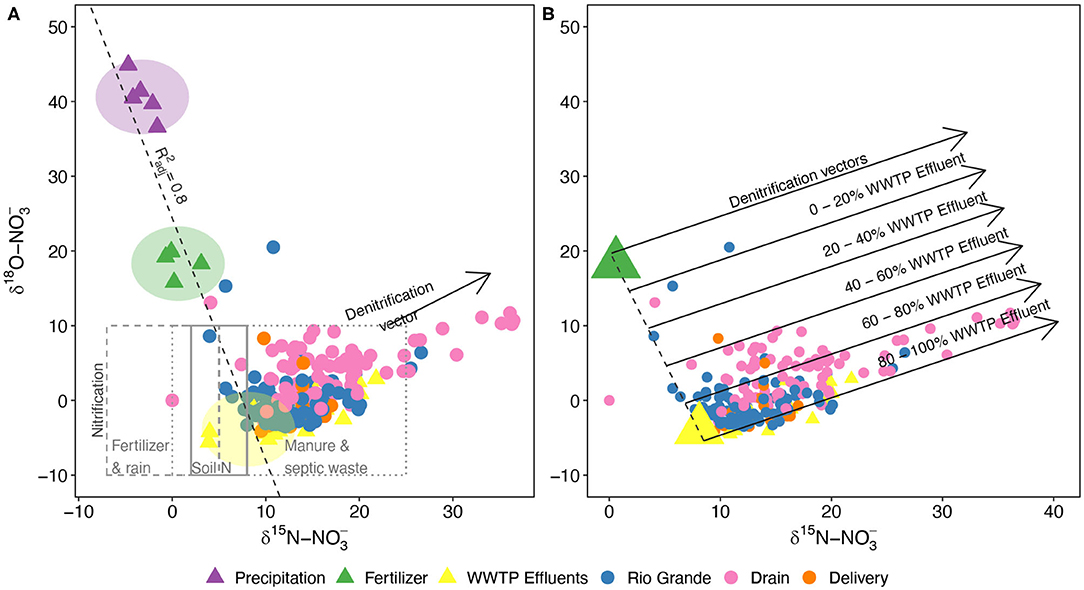
Figure 6. (A) Isotope biplot of δ15N and δ18O of dissolved NO3 within the Middle Rio Grande watershed. Triangles indicate the three main sources of measured NO3: precipitation, liquid fertilizer (Sanchez et al., 2017), and WWTP effluents (this study). Typical ranges of isotope values of nitrate derived from the nitrification of ammonium in fertilizer and rain, soil, and organic waste are shown in the gray boxes [values based off Kendall (1998)]. Colored circles indicate the three main reaches studied. Shifts toward microbial denitrification are signified by the vector. The dotted line represents a linear regression ( = 0.82) performed among the highlighted (in circles) main sources of nitrate, excluding WWTP effluents that trend toward denitrification. None of the samples plot near precipitation, indicating the end-member's negligible contribution to dissolved nitrate. (B) Estimation of the relative contributions of nitrate sources using δ15N and δ18O. Precipitation had minimal influence on the isotopic signature of samples, and therefore a two-endmember mixing model was used to estimate the NO3 contributions of liquid fertilizer and WWTP effluent. Large triangles indicate the averages of the two endmember sources and colored circles denote the watershed samples of the three main reaches of the Rio Grande. The effects of denitrification can be parsed by analyzing the samples with respect to the parallel vectors, e.g., samples that fall between the upper two vectors were derived from 0 to 20% WWTP effluent (and therefore 80–100% fertilizer), regardless of the timing of the denitrification reactions.
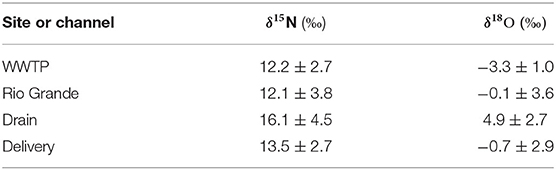
Table 2. Average isotope values for the channels with ± one standard deviation.
The impact of microbial denitrification was considered, as it can lead to significant increases in both δ15N- and δ18O-NO3 values (Kendall, 1998; Kendall et al., 2007). Denitrification processes favor the uptake of lighter isotopes leaving the residual pool of nitrate enriched, typically at a rate of 1:2 (δ15N:δ18O-NO3) (Kendall, 1998; Veale et al., 2019). Therefore, denitrification can be identified by a slope of 0.5 on N and O isotope biplots, and we found that many irrigation samples fell along denitrification vectors (Figure 6B). By analyzing the samples with respect to the parallel vectors, we removed the confounding effects of denitrification and used a two end-member mixing model based on the averages of fertilizer and WWTP effluent. Considering the associated standard deviations of ±2–3‰, we generalized the estimated relative contributions into bins with a range of 20%, finding that the majority of samples were comprised of nitrate derived primarily from WWTP effluent (Figure 6B). Furthermore, while many samples were affected by denitrification, Drain samples were most heavily impacted (Figure 6B).
Discussion
Here, we summarize where nutrient sources and sinks occur throughout this system under the current management practices and make suggestions for optimizing the operation of such systems.
Wastewater Inputs
Our finding that the ABQ WWTP is the primary source of nutrients to the Middle Rio Grande is consistent with results from previous studies in this area (Oelsner et al., 2007; Mortensen et al., 2016). Similarly, in other arid regions, wastewater effluent provides a significant portion of river flow (Villarreal et al., 2012; Cooper et al., 2013), particularly during low-flow periods, accompanied by substantial nutrient loads. Thus, while in mesic regions agricultural inputs are the predominant source of nutrients to aquatic systems (Bouwman et al., 2005; Howarth, 2008), in aridlands urban wastewater inputs appear to be more important contributors (e.g., Regier et al., 2020). These conclusions are supported by the dual N and O isotope results that indicate that the majority (60–100%) of nitrate in the irrigation network is derived from WWTP effluent (Figure 6B) and only negligible amounts were derived from precipitation (Figure 6A). A small number of samples (n = 3) were impacted by local synthetic fertilizers with at least 60% of their nitrate from that source.
Modern wastewater treatment facilities are designed to utilize tertiary (to reduce nutrient loads and disinfect) and quaternary treatment procedures (to remove pharmaceuticals and personal care products) (Sonune and Ghate, 2004; Carey and Migliaccio, 2009; Falk et al., 2013). Given that wastewater is the dominant source of nutrients to the Middle Rio Grande, some modifications could be employed to close nutrient loops and maximize recycling of this limited resource. For example, while within-wastewater treatment plant nutrient removal is typically deemed essential to prevent eutrophication of downstream aquatic environments in many areas, in aridlands, where wastewater-rich river water is diverted for agricultural irrigation, these nutrient removal steps may be energetically expensive (Falk et al., 2013) and deplete valuable nutrient sources for crops. Accordingly, reducing the level of treatment to secondary treatment or excluding nutrient removal steps in tertiary treatment prior to delivery to the agricultural system would provide an opportunity to conserve both energy and nutrient resources. Also, rather than discharging wastewater directly to the river, where nutrients are diluted or lost via in-stream microbial uptake (Caraco and Cole, 2001; Mortensen et al., 2016), we suggest routing effluent through the existing irrigation channel network for direct delivery to crops. While this approach would require overcoming regulatory hurdles and issues of public perception, relevant examples of this approach are abundant. For example, in Sweden, the government set the goal of recovering and reusing 60% of all P in sewage (Cordell et al., 2009); in California, ~61% (0.5 × 10⁹ m3/year) of the reused water is used for irrigation; and on a global scale, ~1.7% (7.7 × 10⁹ m3/year) of the municipal wastewater is reused, mostly in irrigation (Jimenez and Asano, 2015).
Delivery Channels
The next link in the hydrologic network is the delivery channels that move water and effluent into the irrigation systems. Our finding that the delivery channels exhibited the strongest and most consistent sink behavior of the three flow paths suggests distinctive characteristics of this conveyance type that support nitrogen uptake. One of the most likely mechanisms for this uptake is removal in slow flowing areas. While the delivery conveyances are channelized and have high flow velocities along significant portions of their length, which would likely reduce nutrient uptake, there are frequent small dams that serve as control structures to divert water from the main conveyance into smaller irrigation channels. At these junctions, the water velocity is slowed, likely leading to nutrient uptake hotspots due to longer residence times in surface and subsurface flowpaths (Royer et al., 2004; Klocker et al., 2009; Powers et al., 2012).
In other stream systems, nutrient retention is considered to be a valuable ecosystem service and managers implement restoration measures to promote this capacity (Sweeney et al., 2004; Bukaveckas, 2007; Roberts et al., 2007). However, in the case of the delivery channels described in this study, nutrient retention in this portion of the hydrologic network is counterproductive as it decreases the potential to recycle nutrient resources through crop production and close loops, limiting offsets to the energy and financial costs of fertilizer use. Thus, we suggest employing management options that reduce this behavior in delivery channels. Potential options include lining slow flowing portions of the channel with concrete or another impervious layer, and periodically flushing or mechanical removal of deposited sediments from these areas, both of which would serve to limit water-sediment interactions and thus limit hotspots of nutrient removal.
Drains
Following delivery to crops in irrigated fields, excess water and associated nutrients seep into low-lying drains which eventually flow back into the mainstem of the river. The seasonal variations in source/sink behavior of the drains described here (i.e., sink patterns during the growing season but source behavior during non-growing season months) are likely due to the seasonally dynamic interactions between the channel and riparian vegetation, as well as to variations in microbial processing. Both of these interactions are dependent on temperature and light availability, which influence plant and microbial growth and metabolism [e.g., Vymazal et al. (2017)]. Thus, during warm months when riparian production and microbial metabolic rates are high, drains exhibit sink behavior, while during cooler months, nutrient inputs from seepage water appear to overwhelm the processing capacity of the system. Additionally, as our isotopic data indicates, the Drain was the conveyance type where the most denitrification occurred, suggesting that dissimilatory microbial processing may be an important control on nitrate transport in irrigation drain channels (Inwood et al., 2005; Mulholland et al., 2008).
From the perspective of closing nutrient loops, nutrients that reach the drains have effectively escaped the loop, and releasing these constituents to downstream receiving waters has the potential to cause eutrophication (Daniel et al., 1998; Boesch et al., 2001; Withers et al., 2014) and alterations to instream metabolic regimes (Bernhardt et al., 2018). Thus, in contrast to the delivery channels, we suggest that managers should apply approaches in this portion of the irrigation network that maximize nutrient retention and removal. Suggested interventions include traditional restoration techniques such as the addition of meanders to the currently uniformly straight channels, the installation of coarse woody debris, modification of the channel to increase the width-to-depth ratio, and the addition of flow control structures to decrease water velocity (Sweeney et al., 2004; Bukaveckas, 2007; Roberts et al., 2007). Each of these modifications would increase residence times and water-sediment interactions, promoting nutrient removal and retention.
Conclusions
The coupling between human and river systems affects nutrient budgets from reach to regional scales. In arid regions, WWTPs are major sources of both water and nutrients, and their interaction with downstream agricultural systems provides opportunities to close nutrient loops while optimizing FEW resources. Traditionally, reclamation and conservancy district stakeholders operate in isolation, seeking to maximize their agencies' goals (status quo), but our work demonstrates that there are multiple opportunities to coordinate efforts to benefit urban and agricultural societies relying on the river systems where they operate. Specifically, our findings using nutrient budgets and isotopic fingerprinting techniques demonstrate that characteristic river-irrigation systems in arid regions follow dynamic nutrient source/sink patterns controlled by WWTP discharges and agricultural activity. These patterns are predictable in space (i.e., location downstream of WWTP discharge) and time (growing vs. non-growing seasons), and could be used to improve the management of FEW resources.
Although the source/sink nutrient budget could be managed following a variety of strategies (such as those described here), managing FEW resources holistically requires not only the implementation of new infrastructure and approaches but also a shift of paradigms to support the transformation of traditionally “linear” societies, which manage FEW resources in isolation of one another, into “recycling” societies capable of making productive gains (e.g., crop and biofuel production), while closing nutrient loops to minimize environmental pollution and energy consumption. Breaking from the status quo will require collaboration between farmers, municipalities, and state and federal governments to adopt approaches embracing FEW nexus philosophies. In arid human-river systems, the reward of such cooperation could introduce a way to close nutrient loops and reduce energy consumption in wastewater nutrient removal, and in fertilizer production, transportation, and application.
Data Availability Statement
All datasets presented in this study are included in the article/Supplementary Material.
Author Contributions
RG-P and DV secured funding and created the conceptual framework. KB and PR led the field experimental work. KB led the development of the manuscript with support from all authors.
Funding
The National Science Foundation provided funding support through grants CBET-1707042, HRD-1914490, and HRD-1345169.
Conflict of Interest
The authors declare that the research was conducted in the absence of any commercial or financial relationships that could be construed as a potential conflict of interest.
Acknowledgments
The authors want to thank the reviewers, Dr. Megan J. Klaar and Dr. Clare Robinson, as well as the editor, Dr. Dipankar Dwivedi, for providing insightful feedback on an early version of this manuscript.
Supplementary Material
The Supplementary Material for this article can be found online at: https://www.frontiersin.org/articles/10.3389/frwa.2020.00022/full#supplementary-material
References
Amberger, A., and Schmidt, H. L. (1987). Natural isotope contents of nitrate as indicators for its origin. Geochim. Cosmochim. Acta 51, 2699–2705. doi: 10.1016/0016-7037(87)90150-5
Bartoli, M. E., Racchetti, C. A., Delconte, E., Sacchi, E., Soana, A., Laini, D., et al. (2012). Nitrogen balance and fate in a heavily impacted watershed (Oglio River, Northern Italy): in quest of the missing sources and sinks. Biogeosciences 9, 361–373. doi: 10.5194/bg-9-361-2012
Bartolino, J. R., and Cole, J. C. (2002). Ground-water resources of the middle rio grande basin. U.S. Geol. Surv. Circ. 1222, 71–86. doi: 10.3133/cir1222
Bernhardt, E. S., Heffernan, J. B., Grimm, N. B., Stanley, E. H., Harvey, J. W., Arroita, M., et al. (2018). The metabolic regimes of flowing waters. Limnol. Oceanogr. 63, S99–S118. doi: 10.1002/lno.10726
Boesch, D. F., Brinsfield, R. B., and Magnien, R. E. (2001). Chesapeake bay eutrophication. J. Environ. Qual. 30, 303–320. doi: 10.2134/jeq2001.302303x
Böttcher, J., Strebel, O., Voerkelius, S., and Schmidt, H. L. (1990). Using isotope fractionation of nitrate-nitrogen and nitrateoxygen for evaluation of microbial denitrification in a sandy aquifer. J. Hydrol. 114, 413–424. doi: 10.1016/0022-1694(90)90068-9
Bouwman, A. F., Van Drecht, G., Knoop, J. M., Beusen, A. H. W., and Meinardi, C. R. (2005). Exploring changes in river nitrogen export to the world's oceans. Glob. Biogeochem. Cycles 19:1002. doi: 10.1029/2004GB002314
Bukaveckas, P. A. (2007). Effects of channel restoration on water velocity, transient storage, and nutrient uptake in a channelized stream. Environ. Sci. Technol. 41, 1570–1576. doi: 10.1021/es061618x
Caraco, N. F., and Cole, J. J. (2001). Human influence on nitrogen export: a comparison of mesic and xeric catchments. Mar. Freshwater Res. 52, 119–125. doi: 10.1071/MF00083
Carey, R. O., and Migliaccio, K. W. (2009). Contribution of wastewater treatment plant effluents to nutrient dynamics in aquatic systems: a review. Environ. Manag. 44, 205–217. doi: 10.1007/s00267-009-9309-5
Chapin, F. S. (1980). The mineral nutrition of wild plants. Ann. Rev. Ecol. Syst. 11, 233–260. doi: 10.1146/annurev.es.11.110180.001313
Childers, D. L., Corman, J., Edwards, M., and Elser, J. J. (2011). Sustainability challenges of phosphorus and food: solutions from closing the human phosphorus cycle. Bioscience 61, 117–124. doi: 10.1525/bio.2011.61.2.6
Cooper, S. D., Lake, P. S., Sabater, S., Melack, J. M., and Sabo, J. L. (2013). The effects of land use changes on streams and rivers in mediterranean climates. Hydrobiologia 719, 383–425. doi: 10.1007/s10750-012-1333-4
Cordell, D., Drangert, J.-O., and White, S. (2009). The story of phosphorus: global food security and food for thought. Global Environ. Change 19, 292–305. doi: 10.1016/j.gloenvcha.2008.10.009
Daniel, T., Sharpley, A., and Lemunyon, J. (1998). Agricultural phosphorus and eutrophication: a symposium overview. J. Environ. Qual. 27, 251–257. doi: 10.2134/jeq1998.00472425002700020002x
Dumont, E., Harrison, J. A., Kroeze, C., Bakker, E. J., and Seitzinger, S. P. (2005). Global distribution and sources of dissolved inorganic nitrogen export to the coastal zone: results from a spatially explicit, global model. Glob. Biogeochem. Cycles 19. doi: 10.1029/2005GB002488
Durka, W., Schulze, E.-D., Gebauer, G., and Voerkelius, S. (1994). Effects of forest decline on uptake and leaching of deposited nitrate determined from 15N and 18O measurements. Nature 372, 765–767. doi: 10.1038/372765a0
Erisman, J. W., Sutton, M. A., Galloway, J., Klimont, Z., and Winiwarter, W. (2008). How a century of ammonia synthesis changed the world. Nat. Geosci. 1, 636–639. doi: 10.1038/ngeo325
Falk, M. W., Reardon, D. J., Neethling, J., Clark, D. L., and Pramanik, A. (2013). Striking the balance between nutrient removal, greenhouse gas emissions, receiving water quality, and costs. Water Environ. Res. 85, 2307–2316. doi: 10.2175/106143013X13807328848379
FAO (2014). The Water-Energy-Food Nexus: A New Approach in Support of Food Security and Sustainable Agriculture. Rome: The Food and Agriculture Organization of the United Nations.
Flipse, W. J. Jr., and Bonner, F. T. (1985). Nitrogen-isotope ratios of nitrate in ground water under fertilized fields, Long Island, New York. Groundwater 23, 59–67. doi: 10.1111/j.1745-6584.1985.tb02780.x
Fluke, J., González-Pinzón, R., and Thomson, B. (2019). Riverbed sentiments control the spatiotemporal variability of E. coli in a highly managed, arid river. Front. Water 1:4. doi: 10.3389/frwa.2019.00004
Galloway, J. N., Dentener, F. J., Capone, D. G., Boyer, E. W., Howarth, R. W., Seitzinger, S. P. et al. (2004). Nitrogen cycles: past, present, and future. Biogeochemistry 70, 153–226. doi: 10.1007/s10533-004-0370-0
Gruber, N., and Galloway, J. N. (2008). An earth-system perspective of the global nitrogen cycle. Nature 451, 293–296. doi: 10.1038/nature06592
Hanjra, M. A., Blackwell, J., Carr, G., Zhang, F., and Jackson, T. M. (2012). Wastewater irrigation and environmental health: implications for water governance and public policy. Int. J. Hygiene Environ. Health 215, 255–269. doi: 10.1016/j.ijheh.2011.10.003
Harrison, J. A., Seitzinger, S. P., Bouwman, A. F., Caraco, N. F., Beusen, A. H. W., and Vörösmarty, C. J. (2005). Dissolved inorganic phosphorus export to the coastal zone: results from a spatially explicit, global model. Glob. Biogeochem. Cycles 19:GB4S03. doi: 10.1029/2004GB002357
Howarth, R. W. (2008). Coastal nitrogen pollution: a review of sources and trends globally and regionally. Harmful Algae 8, 14–20. doi: 10.1016/j.hal.2008.08.015
Inwood, S. E., Tank, J. L., and Bernot, M. J. (2005). Patterns of denitrification associated with land use in 9 midwestern headwater streams. J. North Am. Benthol. Soc. 24, 227–245. doi: 10.1899/04-032.1
Jimenez, B., and Asano, T. (2015). Water reuse: an international survey of current practice, issues and needs. Water Intell. Online 7:9781780401881. doi: 10.2166/9781780401881
Jin, Z., Cen, J., Hu, Y., Li, L., Shi, Y., Fu, G., et al. (2019). Quantifying nitrate sources in a large reservoir for drinking water by using stable isotopes and a Bayesian isotope mixing model. Environ. Sci. Pollut. Res. 26, 20364–20376. doi: 10.1007/s11356-019-05296-7
Kendall, C. (1998). “Tracing nitrogen sources and cycling in catchments,” in Isotope Tracers in Catchment Hydrology eds C. Kendall and J. McDonnell (New York, NY: Elsevier), 519–576. doi: 10.1016/B978-0-444-81546-0.50023-9
Kendall, C., and Aravena, R. (2000). “Nitrate isotopes in groundwater systems, Chapter 9,” in Environmental Tracers in Subsurface Hydrology, eds P. Cook and A. L. Herczeg (New York, NY: Kluwer Academic Publishers), 261–297. doi: 10.1007/978-1-4615-4557-6_9
Kendall, C., Elliott, E. M., and Wankel, S. D. (2007). “Tracing anthropogenic inputs of nitrogen to ecosystems,” in Stable Isotopes in Ecology and Environmental Science, Vol. 2, eds R. Michener and K. Lajtha (London: John Wiley & Sons Inc.), 375–449. doi: 10.1002/9780470691854.ch12
Klocker, C. A., Kaushal, S. S., Groffman, P. M., Mayer, P. M., and Morgan, R. P. (2009). Nitrogen uptake and denitrification in restored and unrestored streams in urban Maryland, USA. Aquat. Sci. 71, 411–424. doi: 10.1007/s00027-009-0118-y
Larsen, T. A., Hoffmann, S., LÃthi, C., Truffer, B., and Maurer, M. (2016). Emerging solutions to the water challenges of an urbanizing world. Science 352, 928–933. doi: 10.1126/science.aad8641
Lassaletta, L., Romero, E., Billen, G., Garnier, J., García-Gómez, H., and Rovira, J. V. (2012). Spatialized N budgets in a large agricultural Mediterranean watershed: high loading and low transfer. Biogeosciences 9, 57–70. doi: 10.5194/bg-9-57-2012
Mortensen, J. G., GonzÃlez-PinzÃn, R., Dahm, C. N., Wang, J., Zeglin, L. H., and Van Horn, D. J. (2016). Advancing the food-energy–water nexus: closing nutrient loops in arid river corridors. Environ. Sci. Technol. 50, 8485–8496. doi: 10.1021/acs.est.6b01351
Mulholland, P. J., Helton, A. M., Poole, G. C., Hall, R. O., Hamilton, S. K., Peterson, B. J., et al. (2008). Stream denitrification across biomes and its response to anthropogenic nitrate loading. Nature 452, 202–205. doi: 10.1038/nature06686
NSF (2014). Food, Energy, and Water: Transformative Research Opportunities in the Mathematical and Physical Sciences. National Science Foundation.
Oelsner, G. P., Brooks, P. D., and Hogan, J. F. (2007). Nitrogen sources and sinks within the middle Rio grande, New Mexico. J. Am. Water Res. Assoc. 43, 850–863. doi: 10.1111/j.1752-1688.2007.00071.x
Pfaff, J. D. (1996). “Determination of inorganic anions by ion chromatography,” in Methods for the Determination of Metals in Environmental Samples (Westwood, NJ: Elsevier), 388–417. doi: 10.1016/B978-0-8155-1398-8.50022-7
Powers, S. M., Johnson, R. A., and Stanley, E. H. (2012). Nutrient retention and the problem of hydrologic disconnection in streams and wetlands. Ecosystems 15, 435–449. doi: 10.1007/s10021-012-9520-8
Regier, P., González-Pinzón, R., Van Horn, D. J., Reale, J., Nichols, J., and Khandelwal, A. (2020). Water quality impacts of urban and non-urban arid-land runoff on the Rio Grande. Sci. Total Environ. 729:138443. doi: 10.1016/j.scitotenv.2020.138443
Roberts, B. J., Mulholland, P. J., and Houser, J. N. (2007). Effects of upland disturbance and instream restoration on hydrodynamics and ammonium uptake in headwater streams. J. North Am. Benthol. Soc. 26, 38–53. doi: 10.1899/0887-3593(2007)26[38:EOUDAI]2.0.CO;2
Royer, T. V., Tank, J. L., and David, M. B. (2004). Transport and fate of nitrate in headwater agricultural streams in Illinois. J. Environ. Qual. 33, 1296–1304. doi: 10.2134/jeq2004.1296
Sanchez, D. A., Szynkiewicz, A., and Faiia, A. M. (2017). Determining sources of nitrate in the semi-arid Rio Grande using nitrogen and oxygen isotopes. Appl. Geochem. 86, 59–69. doi: 10.1016/j.apgeochem.2017.09.012
Sigman, D. M., Casciotti, K. L., Andreani, M., Barford, C., Galanter, M., and Böhlke, J. (2001). A bacterial method for the nitrogen isotopic analysis of nitrate in seawater and freshwater. Anal. Chem. 73, 4145–4153. doi: 10.1021/ac010088e
Soana, E., Racchetti, E., Laini, A., Bartoli, M., and Viaroli, P. (2011). Soil budget, net export, and potential sinks of nitrogen in the lower oglio river watershed (Northern Italy). Clean Soil Air Water 39, 956–965. doi: 10.1002/clen.201000454
Sonune, A., and Ghate, R. (2004). Developments in wastewater treatment methods. Desalination 167, 55–63. doi: 10.1016/j.desal.2004.06.113
Sweeney, B. W., Bott, T. L., Jackson, J. K., Kaplan, L. A., Newbold, J. D., Standley, L. J., et al. (2004). Riparian deforestation, stream narrowing, and the loss of stream ecosystem services. Proc. Natl. Acad. Sci. U.S.A. 101, 14132–14137. doi: 10.1073/pnas.0405895101
Van Horn, D. (2010). Nutrient Cycling in Impacted Stream Ecosystems: From Microbes to Watersheds. Available online at: https://digitalrepository.unm.edu/biol_etds/119 (accessed August 31, 2020).
Veale, N., Visser, A., Esser, B., Singleton, M. J., and Moran, J. E. (2019). Nitrogen cycle dynamics revealed through δ18O-NO3– analysis in California groundwater. Geosciences 9:95. doi: 10.3390/geosciences9020095
Villarreal, M., Drake, S., Marsh, S., and McCoy, A. (2012). The influence of wastewater subsidy, flood disturbance and neighbouring land use on current and historical patterns of riparian vegetation in a semi-arid watershed. River Res. Appl. 28, 1230–1245. doi: 10.1002/rra.1510
Vitousek, P. M., and Howarth, R. W. (1991). Nitrogen limitation on land and in the sea: how can it occur? Biogeochemistry 13, 87–115. doi: 10.1007/BF00002772
Voerkelius, S., and Schmidt, H.-L. (1990). Natural oxygen and nitrogen isotope abundance of compounds involved in denitrification. Mitteilungen der deut. Bodenkundlichen Gesselschaft 60, 364–366.
Vymazal, J., Brezinová, T. D., KoŽeluh, M., and Kule, L. (2017). Occurrence and removal of pharmaceuticals in four full-scale constructed wetlands in the Czech Republic–the first year of monitoring. Ecol. Eng. 98, 354–364. doi: 10.1016/j.ecoleng.2016.08.010
Withers, P. J., Neal, C., Jarvie, H. P., and Doody, D. G. (2014). Agriculture and eutrophication: where do we go from here? Sustainability 6, 5853–5875. doi: 10.3390/su6095853
Xue, D., Botte, J., De Baets, B., Accoe, F., Nestler, A., Taylor, P., et al. (2009). Present limitations and future prospects of stable isotope methods for nitrate source identification in surface-and groundwater. Water Res. 43, 1159–1170. doi: 10.1016/j.watres.2008.12.048
Keywords: nitrate dynamics, close nutrient loops, arid rivers, water management, hydrobiogeochemical processes, food-energy-water nexus
Citation: Bicknell K, Regier P, Van Horn DJ, Feeser KL and González-Pinzón R (2020) Linking Hydrobiogeochemical Processes and Management Techniques to Close Nutrient Loops in an Arid River. Front. Water 2:22. doi: 10.3389/frwa.2020.00022
Received: 30 March 2020; Accepted: 07 July 2020;
Published: 20 August 2020.
Edited by:
Dipankar Dwivedi, Lawrence Berkeley National Laboratory, United StatesReviewed by:
Clare Robinson, University of Western Ontario, CanadaMegan J. Klaar, University of Leeds, United Kingdom
Copyright © 2020 Bicknell, Regier, Van Horn, Feeser and González-Pinzón. This is an open-access article distributed under the terms of the Creative Commons Attribution License (CC BY). The use, distribution or reproduction in other forums is permitted, provided the original author(s) and the copyright owner(s) are credited and that the original publication in this journal is cited, in accordance with accepted academic practice. No use, distribution or reproduction is permitted which does not comply with these terms.
*Correspondence: Ricardo González-Pinzón, Z29uemFyaWNAdW5tLmVkdQ==
†Present address: Peter Regier, Pacific Northwest National Laboratory, Richland, WA, United States