 Yihang Du
 Wenjing Zhang
 Zizhen Chen
 Xueping Zhu
 Yi Wei
 Yuanhui Hu
- Department of Cardiology, Guang’anmen Hospital, China Academy of Chinese Medical Sciences, Beijing, China
Objective: To investigate and compare the associations of body mass index (BMI), waist circumference (WC), a body shape index (ABSI), weight-adjusted waist index (WWI), and waist-to-height ratio (WHtR) with activities of daily living (ADL) impairment among the middle-aged and elderly population in China.
Methods: In this study, 8,700 participants from 2011 were included in the cross-section analysis. The prospective study used baseline data from 2011 and follow-up data from 2013, 2015, 2018, and 2020, with a total of 5,945 participants included. Binary logistic regression models were employed in the cross-sectional study to calculate odds ratio (OR) with corresponding 95% confidence interval (95% CI). In the prospective study, Cox proportional hazards regression models were utilized to estimate hazard ratio (HR) with 95% CI. Restricted cubic spline curve was used to identify trends, with subgroup analysis performed. Diagnostic performance was quantified through receiver operating characteristic curve analysis, with area under the curve values computed.
Results: In the cross-sectional study, BMI (OR = 0.98, 95% CI: 0.97–1.00) was significantly negatively associated with ADL impairment risk, while ABSI (OR = 1.25, 95% CI: 1.14–1.37), WWI (OR = 1.16, 95% CI: 1.09–1.24) were positively associated with ADL impairment. However, there was no significant association between WC, WHtR and ADL impairment. In the prospective study, WC, WHtR and BMI showed no significant association with ADL impairment, while ABSI (HR = 1.07, 95% CI: 1.01–1.14) and WWI (HR = 1.05, 95% CI: 1.01–1.10) remained positively associated with ADL impairment. Positive linear correlations were observed among ABSI, WWI, and ADL impairment and there was no difference among subgroup variables. The predictive ability of WWI was slightly higher than ABSI, with an AUC value of 0.598.
Conclusion: ABSI and WWI were significantly associated with the risk of ADL impairment among the middle-aged and elderly population in China. ABSI and WWI had the potential to serve as superior obesity indicators for identifying individuals at higher risk for ADL impairment.
1 Introduction
Activities of daily living (ADL) refer to the essential activities necessary for an individual to maintain independent life, such as dressing, eating, bathing, toileting, mobility, and community activities. Assessment of ADL is an important indicator of self-care ability, health status, and quality of life for middle-aged and elderly people (1). The decline in ADL may lead to an increased risk of falls (2), worsening of geriatric syndromes (such as frailty, cognitive decline, depression, etc.) (3), and is associated with higher hospitalization rates and mortality (4). It is projected that by 2060, the number of middle-aged and elderly individuals with ADL limitations or functional decline will increase to 96.2 million, imposing a huge economic burden on individuals, health systems and care resources (5, 6). Therefore, it is essential to regularly assess ADL function and identify potential risk factors that lead to ADL impairment.
Obesity significantly impairs ADL and reduces the ability to live independently and overall quality of life through multiple pathways, such as weakening muscle strength, reducing physical flexibility, and promoting chronic diseases (7). Body Mass Index (BMI) is a commonly used indicator for assessing the degree of obesity. However, BMI ignores the differences in the ratio of muscle to fat and the distribution of fat, which leads to incorrect assessments of muscular individuals (8). Compared to BMI, the assessment of central obesity can more accurately reflect the distribution of body fat, especially the accumulation of abdominal fat, which is more effective in predicting the risk of chronic diseases. Moreover, it is less affected by muscle mass factors and more accurately reflects the individual’s obesity status and health risks (9). Thus, central obesity is prone to trigger chronic diseases and functional decline, which in turn can lead to ADL impairment.
Waist circumference (WC) has been regarded as a more reliable indicator for assessing the risk of central obesity-related diseases. WC can more accurately reflect abdominal fat distribution and visceral obesity. However, WC does not take into account height variations, which may lead to biases in risk assessment for individuals of different heights (10). Therefore, it is not reliable to evaluate obesity risk only by BMI or WC. In recent years, novel anthropometric indices such as the a body shape index (ABSI) (11), weight-adjusted waist index (WWI) (12), and waist-to-height ratio (WHtR) (13) have emerged as valuable indicators in central obesity-related diseases. These comprehensive indicators exhibit superior predictive efficacy compared to conventional parameters, particularly in assessing central obesity-related health status and forecasting disease risks (14). Previous studies were mostly limited to cross-sectional research, and no prospective study has explored the association between central obesity and ADL impairment. Therefore, based on the China Health and Retirement Longitudinal Study (CHARLS), this study aimed to investigate and compare the associations between BMI, WC, ABSI, WWI, WHtR, and ADL impairment, further promote the application of the composite indicators of central obesity in the daily health monitoring of the middle - aged and elderly population.
2 Methods
2.1 Study participants
This study utilized data of CHARLS from 2011 to 2020 to explore the associations between BMI, WC, ABSI, WWI, WHtR, and ADL impairment in middle-aged and older adults aged 45 years and above. The study participants were representative samples from 28 provinces across China, selected using a stratified cluster sampling method (15). Baseline data covered information such as age, gender, height, weight, WC, education level, marital status, residence place, smoking, drinking, hypertension, diabetes mellitus (DM) and dyslipidemia. To ensure data completeness and accuracy, samples with missing data, outliers, or logical errors were excluded. Participants were excluded if they met the following criteria: (1) age below 45; (2) missing ADL data; (3) missing BMI, WC, ABSI, WWI, WHtR data; (4) missing demographic data; (5) WC less than 40 cm. Ultimately, 8,700 subjects from 2011 were included in the cross-section analysis. The prospective study used baseline data from 2011 and follow-up data from 2013, 2015, 2018, and 2020, with a total of 5,945 participants included. This study was approved by the Peking University Medical Ethics Committee (IRB00001052-11015), and all participants signed informed consent to participate in the follow-up surveys.
2.2 ADL impairment assessment
ADL impairment was mainly assessed using the ADL scale. Each item on the scale had four response options: “no difficulty, ““some difficulty but can still complete, ““difficulty and needs help, “and “unable to complete” (16). The scale included six tasks essential for independent living: eating, toileting, bathing, dressing, indoor activities, and continence control, as well as tasks related to community living, including housekeeping, cooking, shopping, medication use, telephone use, and managing finances. ADL impairment was defined as the inability to perform any of the above tasks independently (17).
2.3 Measurement of BMI, WC, ABSI, WWI, and WHtR
In the CHARLS study, measurements of WC, height, and weight were conducted following strict protocols. WC was measured using a calibrated tape measure at the midpoint between the lower edge of the rib cage and the iliac crest, with the subject standing in a natural breathing position and the reading taken at the end of expiration. Height was measured with the participant standing barefoot, with eyes looking straight ahead. For weight measurement, participants were required to remove heavy outer clothing and any accessories that might affect the results, and the value was recorded once stabilized. BMI was calculated using the formula: kg/m2, which is used to assess weight status (18). ABSI was calculated using the formula: (19). WHtR was calculated by dividing WC by height, incorporating body shape into the assessment of central obesity. Finally, the WWI was derived by dividing WC by the square root of weight, reflecting the presence of excessive body fat buildup and the loss of muscular mass (14).
2.4 Covariates
To assess the impact of potential risk factors, demographic and health status variables were collected through a structured questionnaire. These included age (as a continuous variable), gender (male or female), marital status (married or non married), place of residence (urban or rural), education level (illiterate, primary/middle school, high school or above), smoking, and drinking (categorized as no or yes based on current behavior).
2.5 Health status assessment
Hypertension diagnosis was based on blood pressure measurements and physician diagnosis. Dyslipidemia was diagnosed if any of the following criteria were met: total cholesterol ≥6.2 mmol/L, low-density lipoprotein cholesterol ≥4.1 mmol/L, triglycerides ≥2.3 mmol/L, High-density lipoprotein cholesterol <1 mmol/L, or physician diagnosis (20). The diagnosis criteria for DM included any of the following: fasting blood glucose ≥7 mmol/L, random blood glucose ≥11.1 mmol/L, glycated hemoglobin ≥6%, or physician diagnosis (21).
2.6 Statistical strategy
Participants were divided into two groups based on the presence or absence of ADL impairment. Means±standard deviations were used to represent continuous variables, while percentages were used for categorical variables. T-test was used for continuous variables, and a chi-square test was used to assess differences between groups for categorical variables. Binary logistic regression models were employed in the cross-sectional study to calculate odds ratio (OR) with corresponding 95% confidence interval (95% CI). In the prospective study, Cox proportional hazards regression models were utilized to estimate hazard ratio (HR) with 95% CI, complemented by Kaplan–Meier (KM) survival curve visualization. To control for potential confounding factors, adjustments were made: Model 1 was adjusted for age and gender; Model 2 was further adjusted for smoking, alcohol consumption, residence, marital status, and education level; Model 3 was additionally adjusted for hypertension, dyslipidemia, and DM. Subsequently, restricted cubic spline (RCS) curve was used to identify trends, with subgroup analyses performed according to gender, marital status, residence, smoking, drinking, hypertension, dyslipidemia, DM, BMI and age. For enhanced clinical interpretability of OR and HR, ABSI values were standardized by multiplying by 100. Similarly, WHtR values were standardized by multiplying by 10. Diagnostic performance was quantified through receiver operating characteristic (ROC) curve analysis, with area under the curve (AUC) values computed. The statistical significance set at p < 0.05. All statistical analyses were performed using R 4.4.1.
3 Results
3.1 Baseline characteristics of the participants in the cross-sectional study
Table 1 presents the baseline characteristics of the 8,700 participants. Among all participants, 3,603 (41.41%) were male, and 5,097 (58.59%) were female. The results indicated that 1,776 participants suffered from ADL impairment. Compared to those without ADL impairment, participants with ADL impairment were generally older, female, unmarried, living in rural area, no drinking, less educated, and more likely to have hypertension, and DM, lower weight and BMI, while higher ABSI WHtR and WWI. However, no significant difference in WC was observed between the two groups.
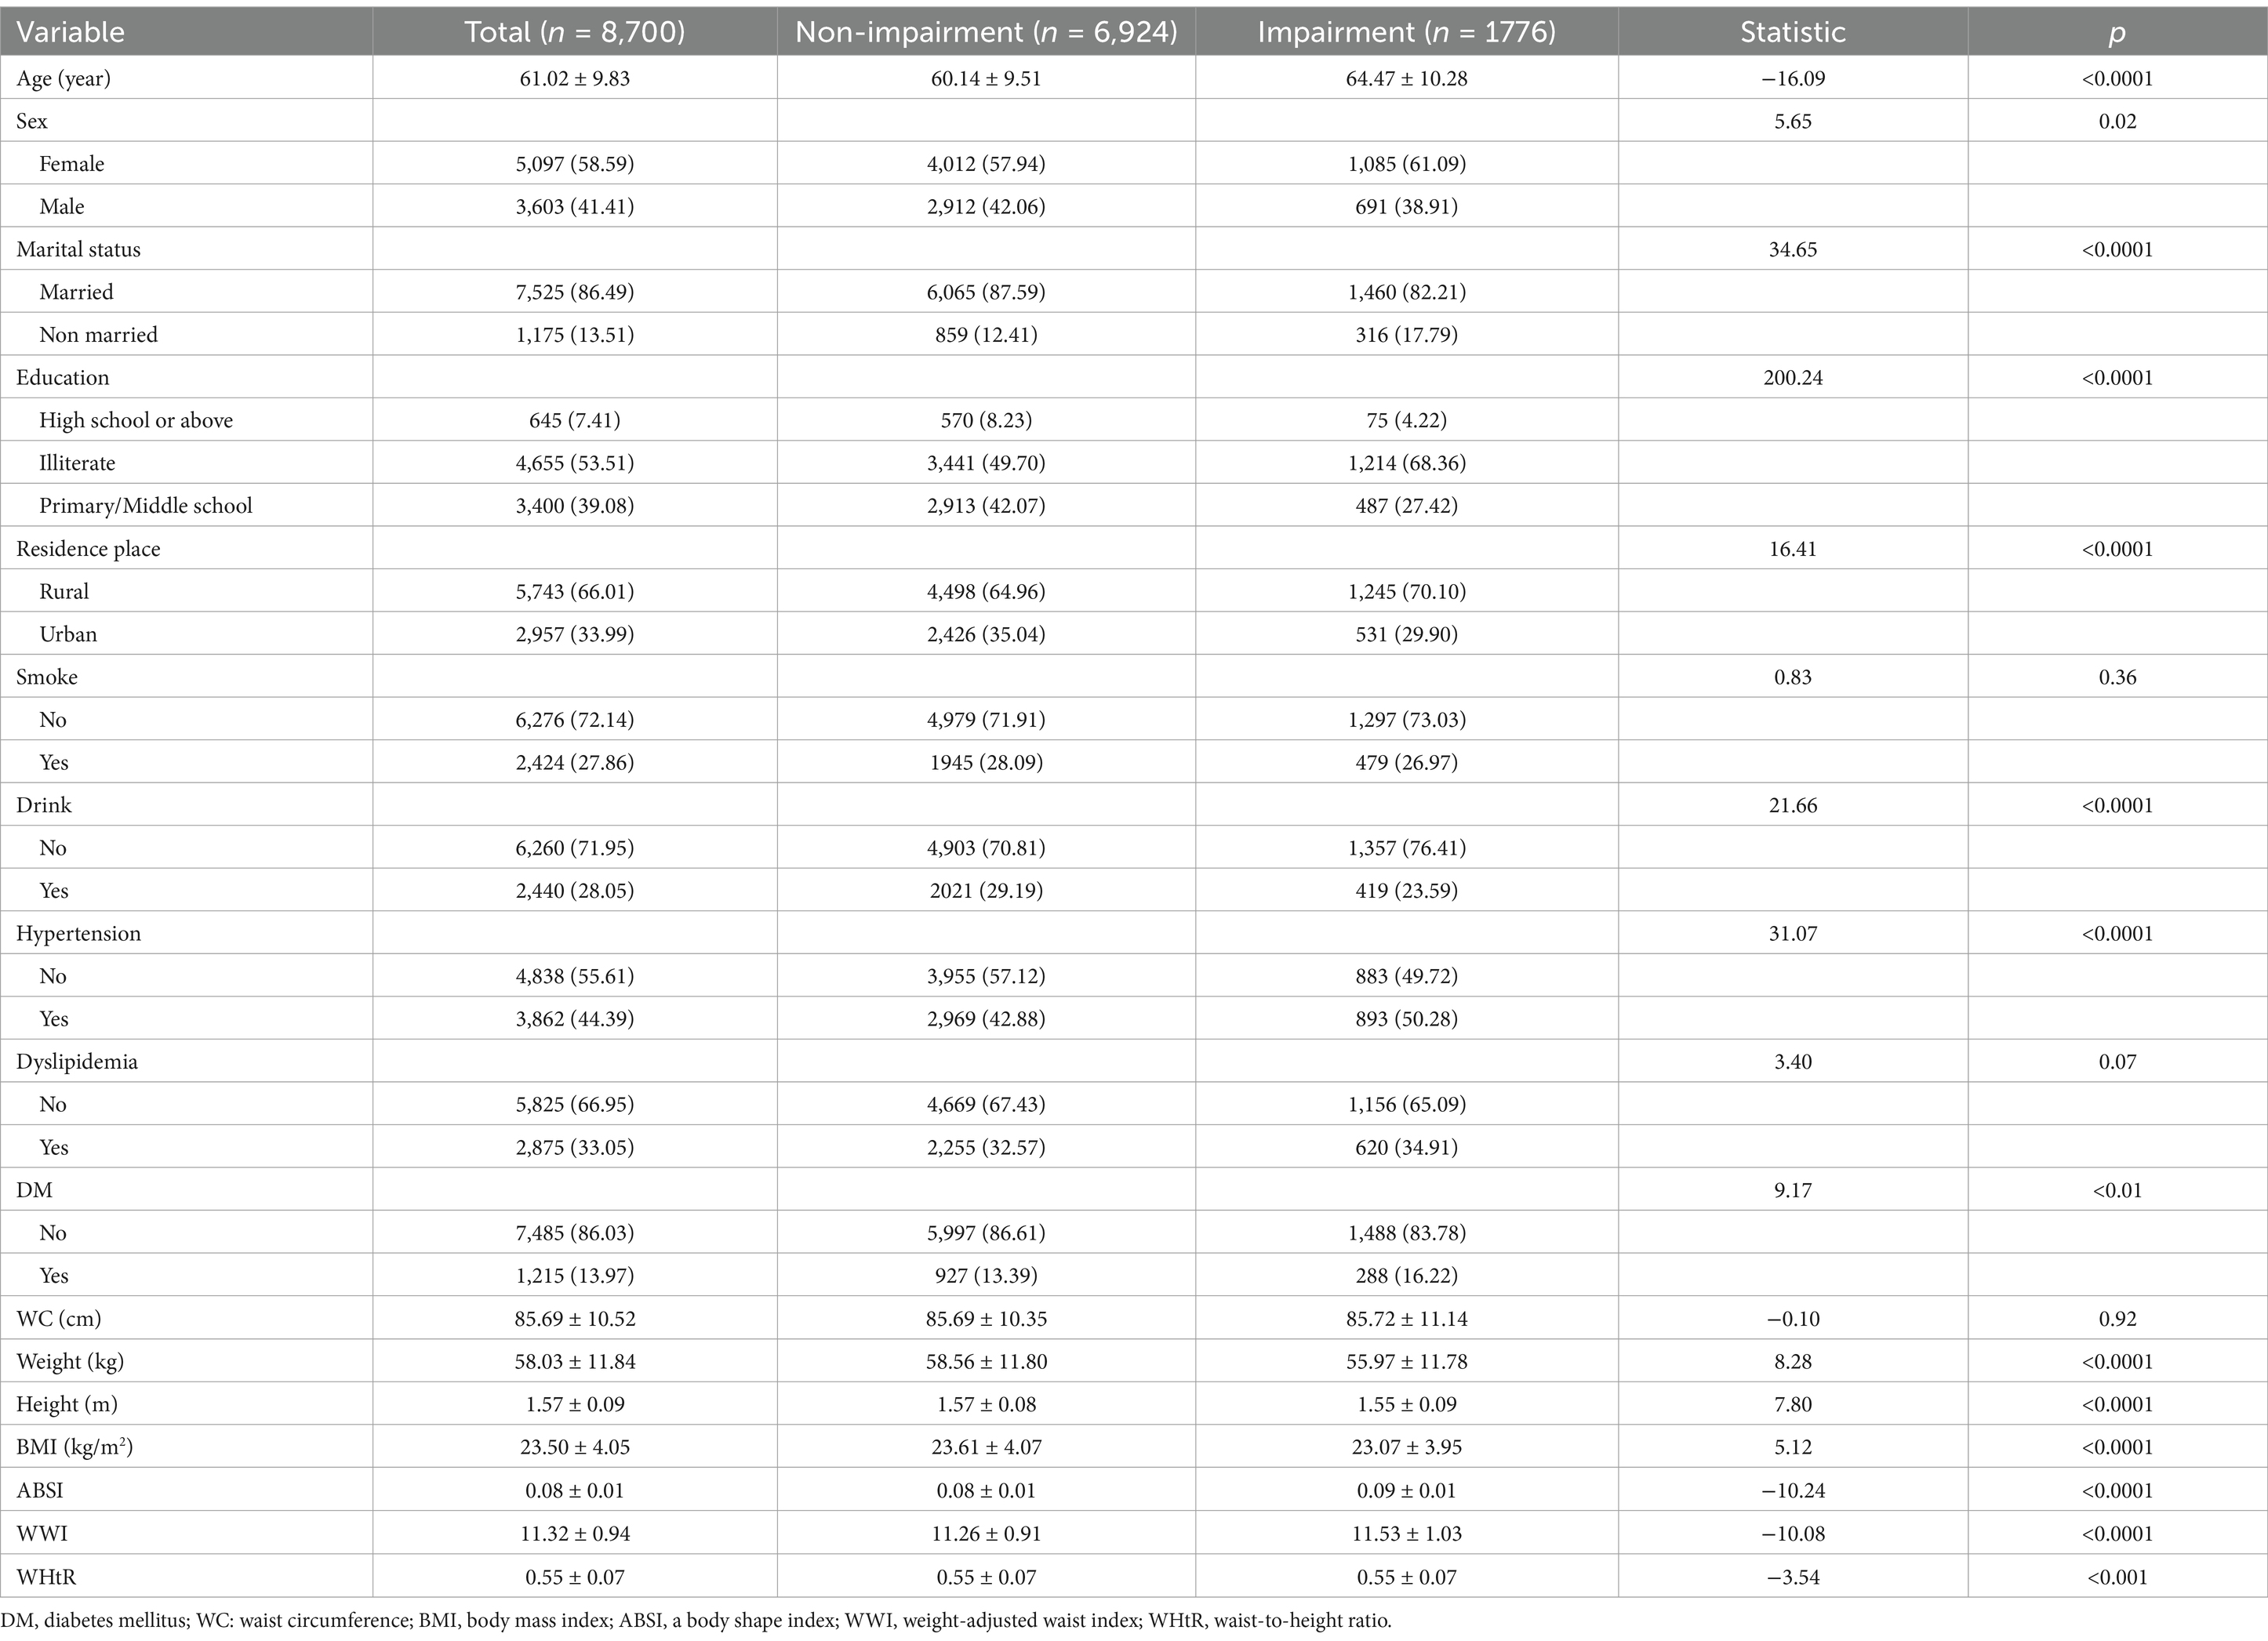
Table 1. Baseline characteristics of participants in cross-sectional study.
3.2 Associations of BMI, ABSI, WWI, and WHtR with ADL impairment in the cross-sectional study
Table 2 shows the associations between BMI, ABSI, WWI, WHtR, and ADL impairment using the binary logistic regression model. After adjusting for age, gender, smoking, drinking, residence place, marital status, education, hypertension, dyslipidemia, and DM, BMI (OR = 0.98, 95% CI: 0.97–1.00) showed negative association with ADL impairment while ABSI (OR = 1.25, 95% CI: 1.14–1.37), WWI (OR = 1.16, 95% CI: 1.09–1.24) were positively associated with ADL impairment.
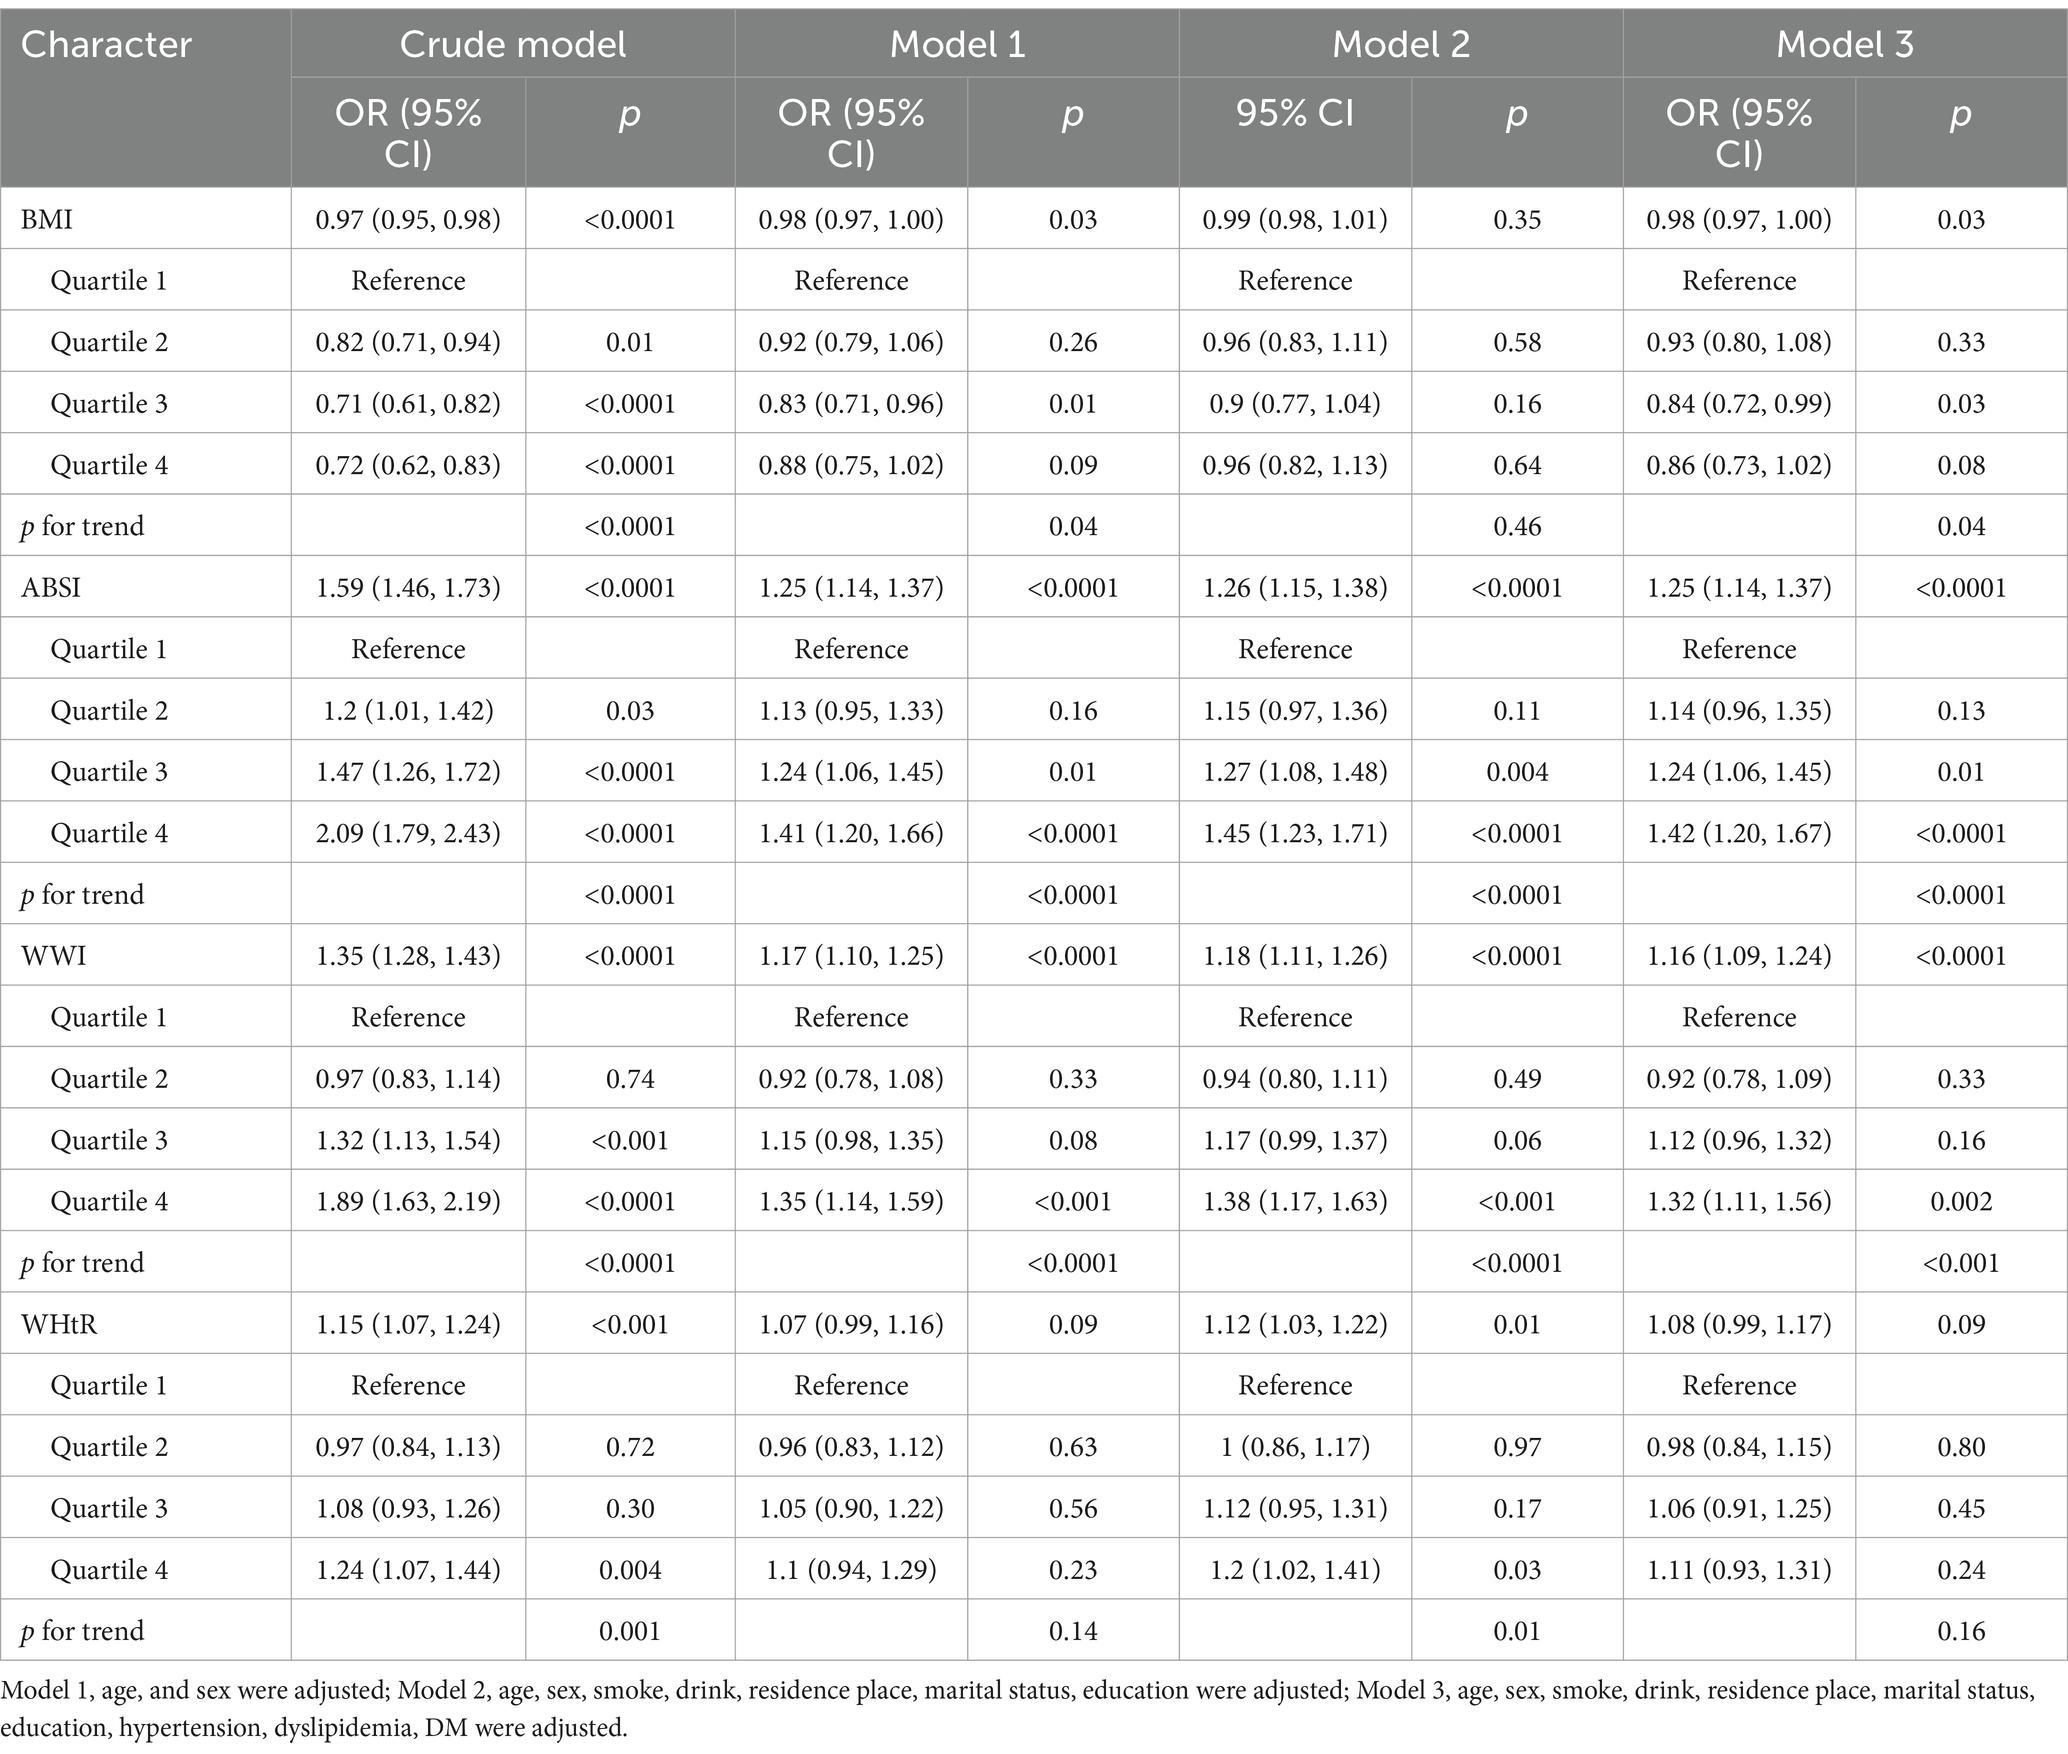
Table 2. Binary logistic regression analysis of BMI, ABSI, WWI and WHtR with ADL impairment in cross-sectional study.
3.3 Baseline characteristics of the participants in the prospective study
The baseline population in 2011 consisted of 5,945 participants. 3,096 participants had experienced ADL impairment during the follow-up period. Among them, 2,392 participants (40.24%) were male, and 3,553 participants (59.76%) were female. Among all participants, 3,202 experienced a complete 9-year follow-up period. The results indicated that participants with ADL impairment tended to be older, female, unmarried, less educated, living in rural areas, non-smoker, non-drinker, and were more likely to have hypertension and DM. Additionally, these participants had lower BMI and higher ABSI, WHtR, WWI compared to those without ADL impairment. However, there was no significant difference of WC between the two groups (Table 3).
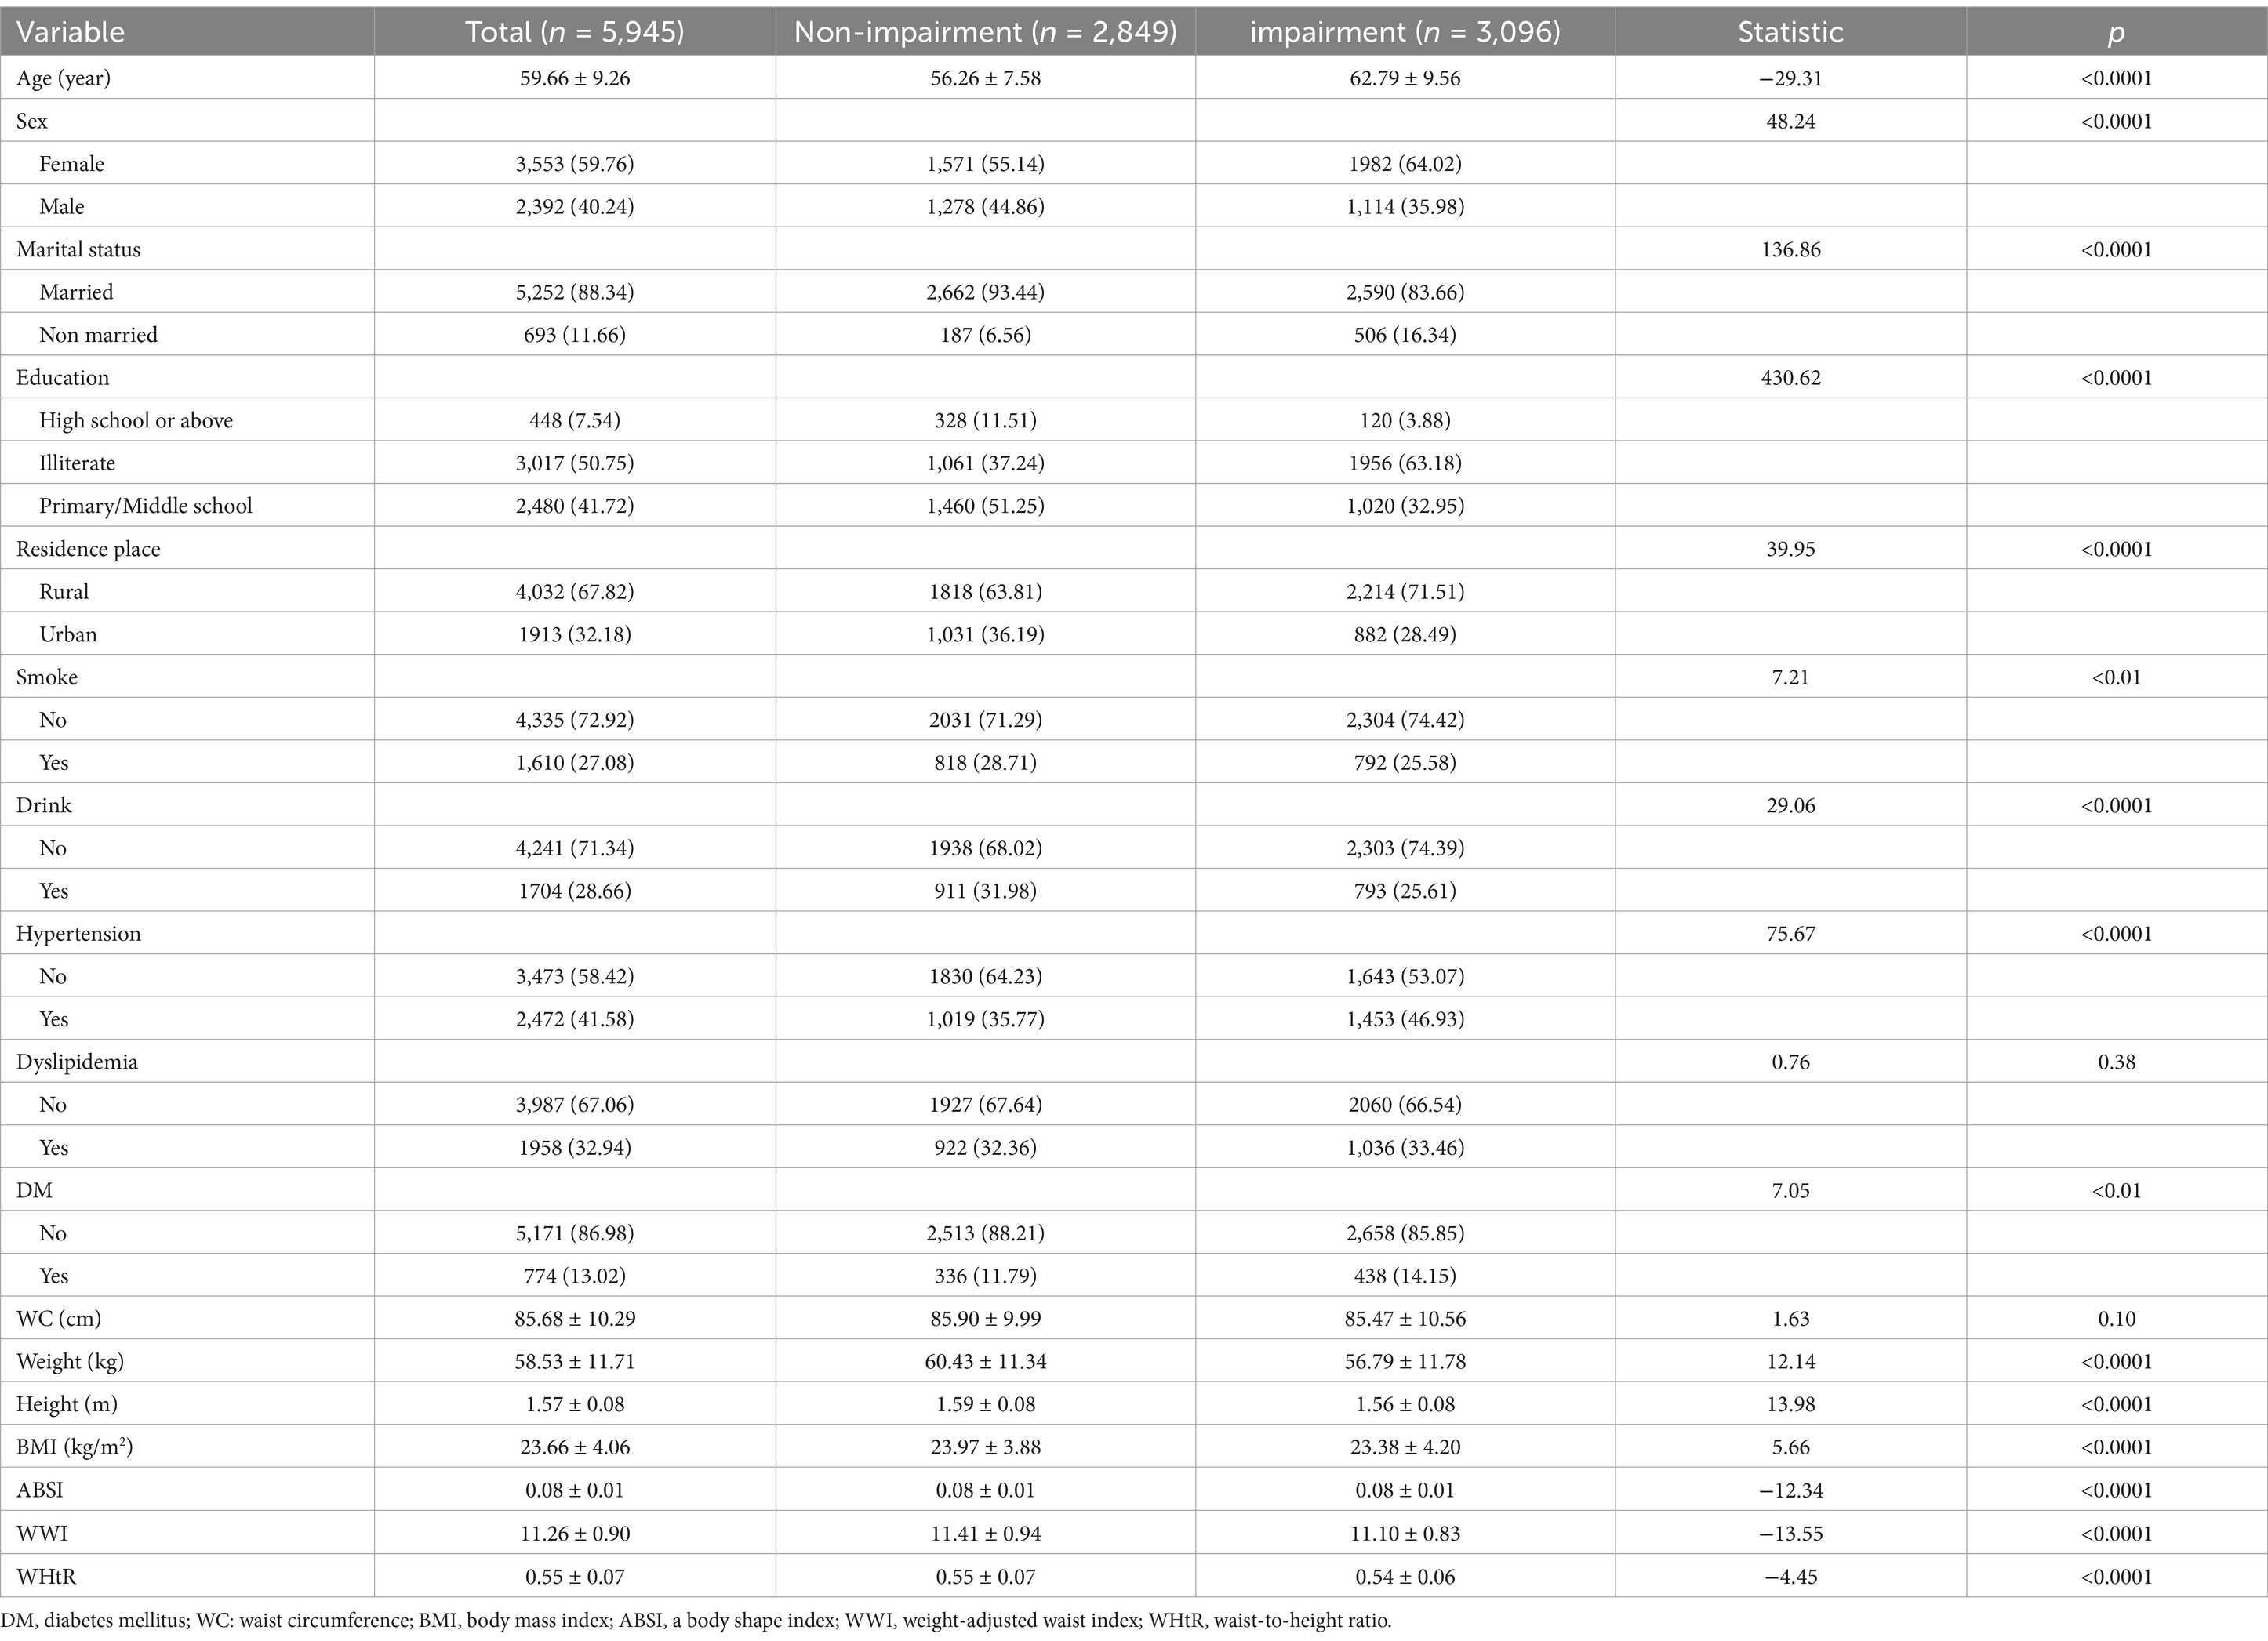
Table 3. Baseline characteristics of participants in the prospective study.
3.4 Associations of BMI, ABSI, WWI, and WHtR with ADL impairment in the prospective study
The prospective associations between BMI, ABSI, WWI, WHtR and ADL impairment are presented in Table 4. After adjusting for confounding factors, both ABSI (HR = 1.07, 95% CI: 1.01–1.14) and WWI (HR = 1.05, 95% CI: 1.01–1.10) retained their significant associations with ADL impairment. The results of quartile analysis indicated that, in comparison with the lowest quartile, the highest quartile of WWI (HR = 1.14, 95% CI: 1.02–1.28) was significantly associated with an elevated risk of ADL impairment.
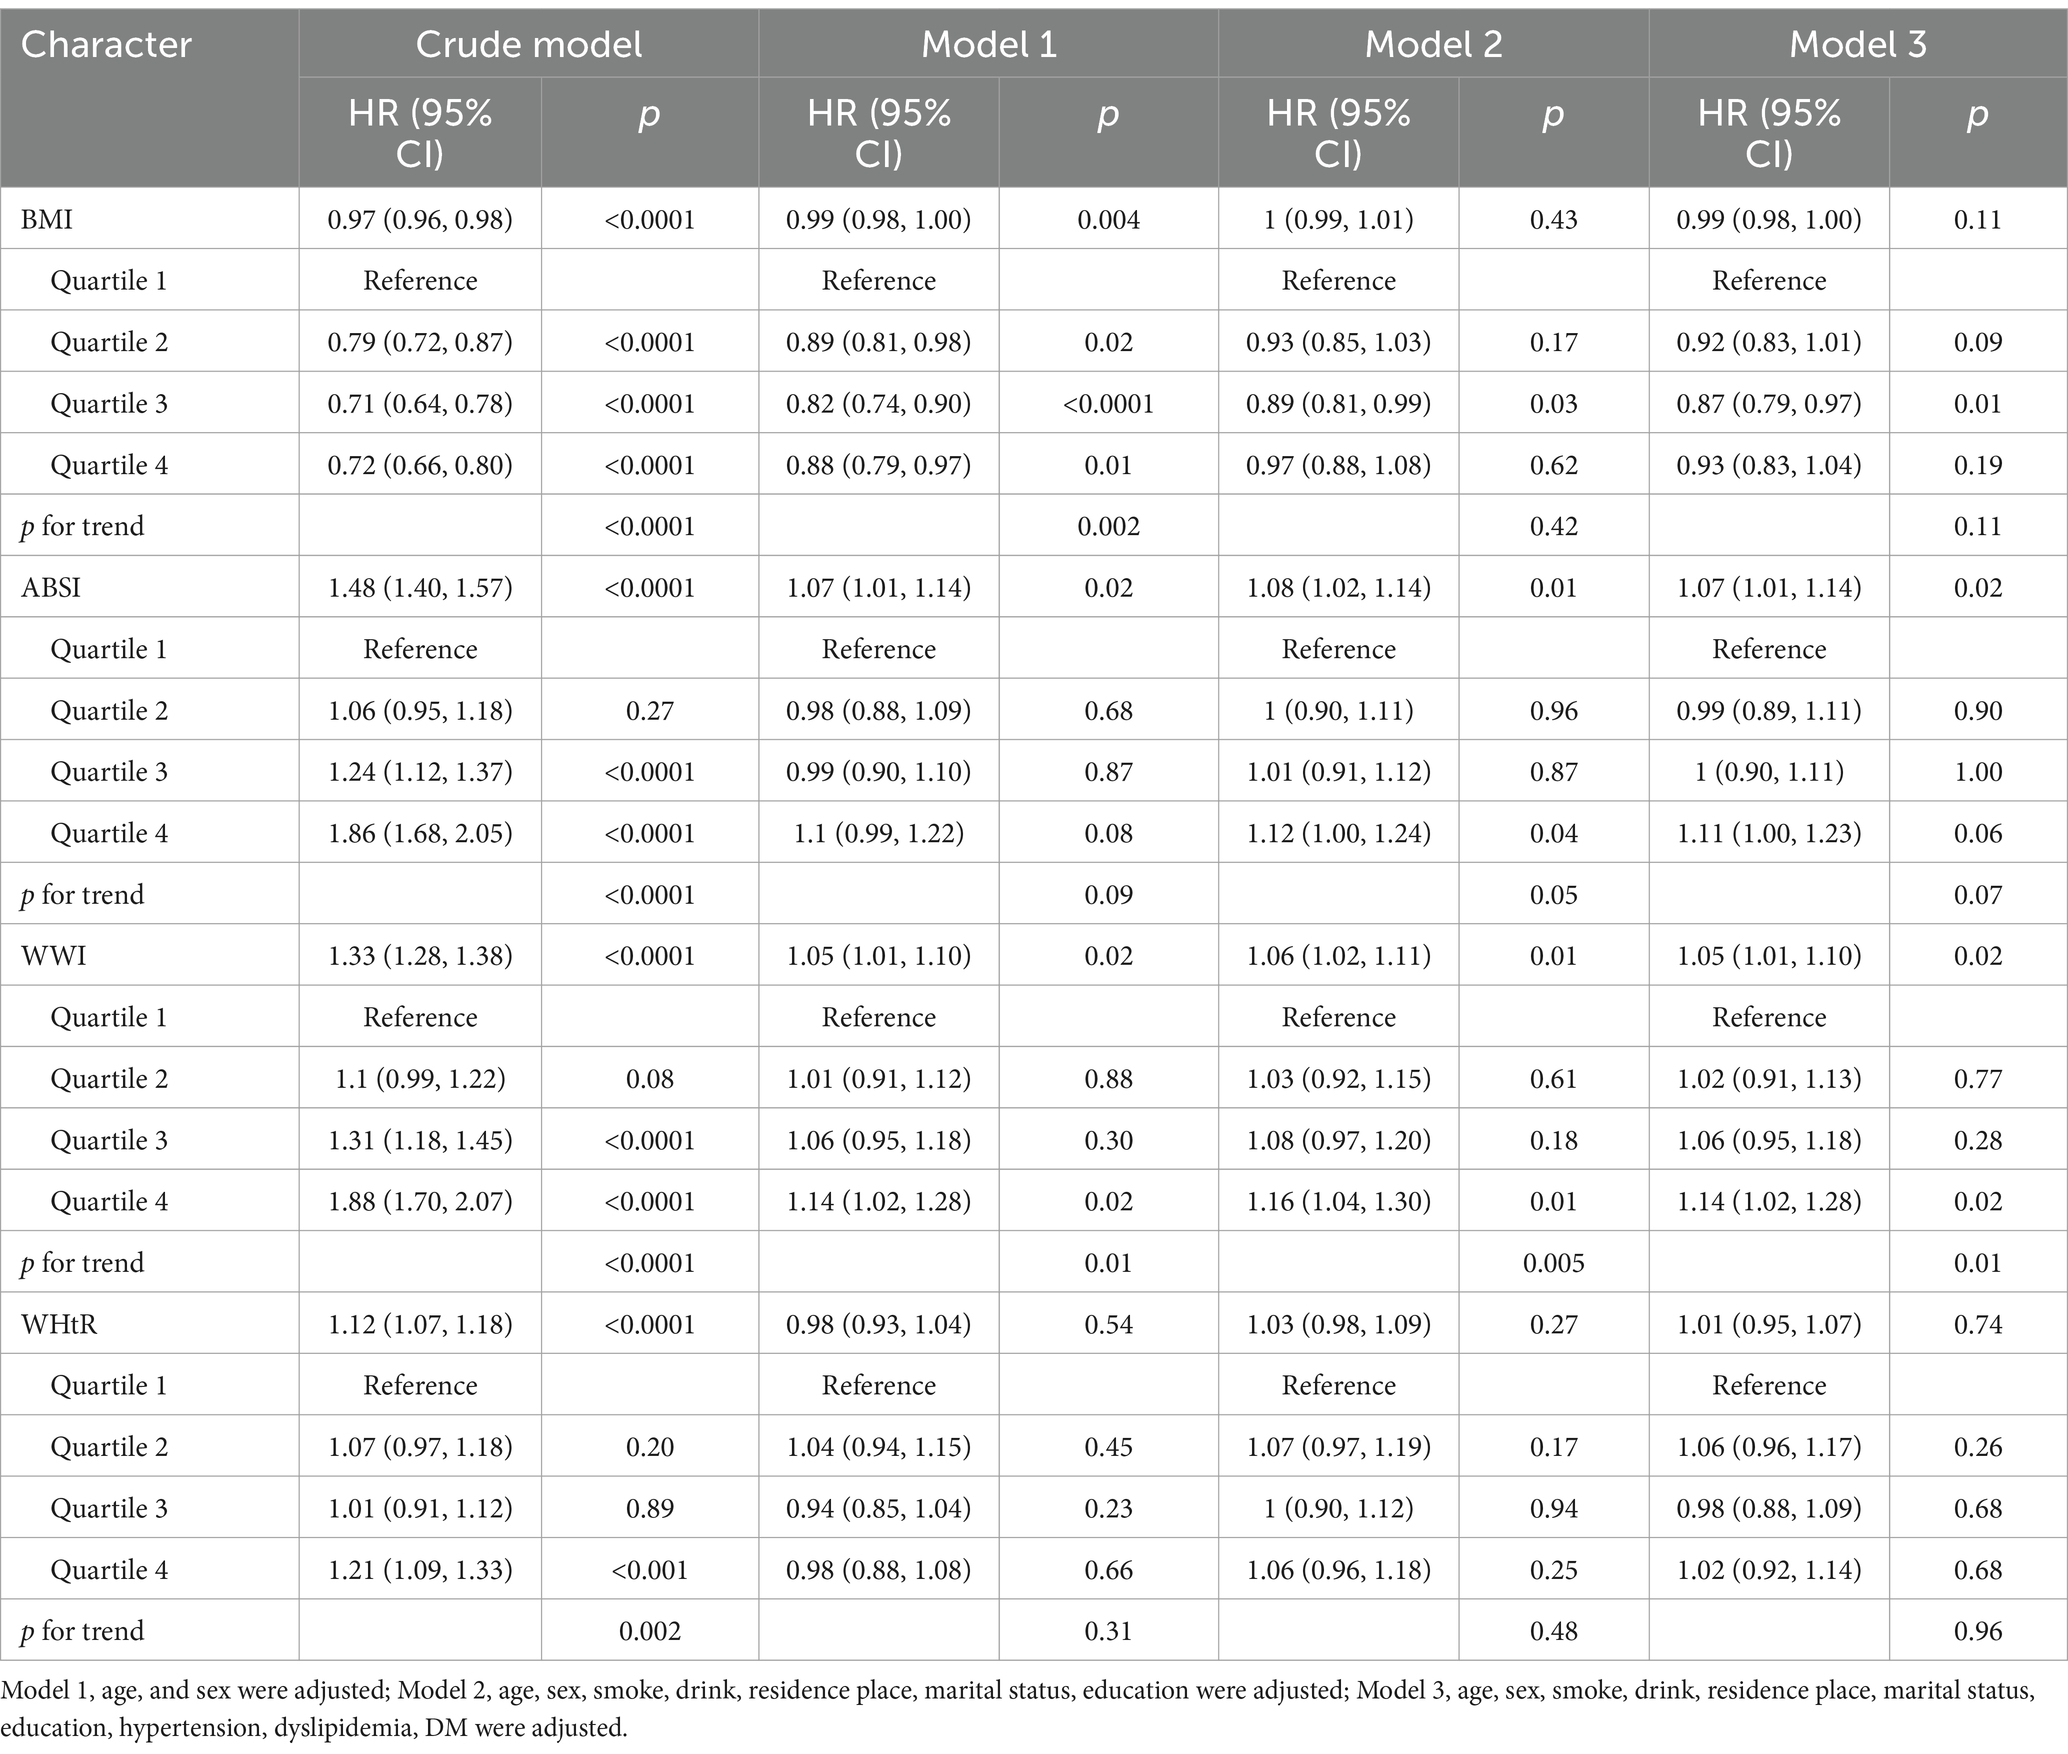
Table 4. Cox regression analysis of BMI, ABSI, WWI, and WHtR with ADL impairment in the prospective study.
Figure 1 illustrates the KM survival curves for ADL impairment across quartile groups of ABSI and WWI. Notably, compared with the lowest quartile group, the risk of ADL impairment in the highest quartile group showed a more significant upward trend. Moreover, the median occurrence time for both ABSI and WWI in the highest quartile group was 7 years, and there was no significant difference between the two indicators.
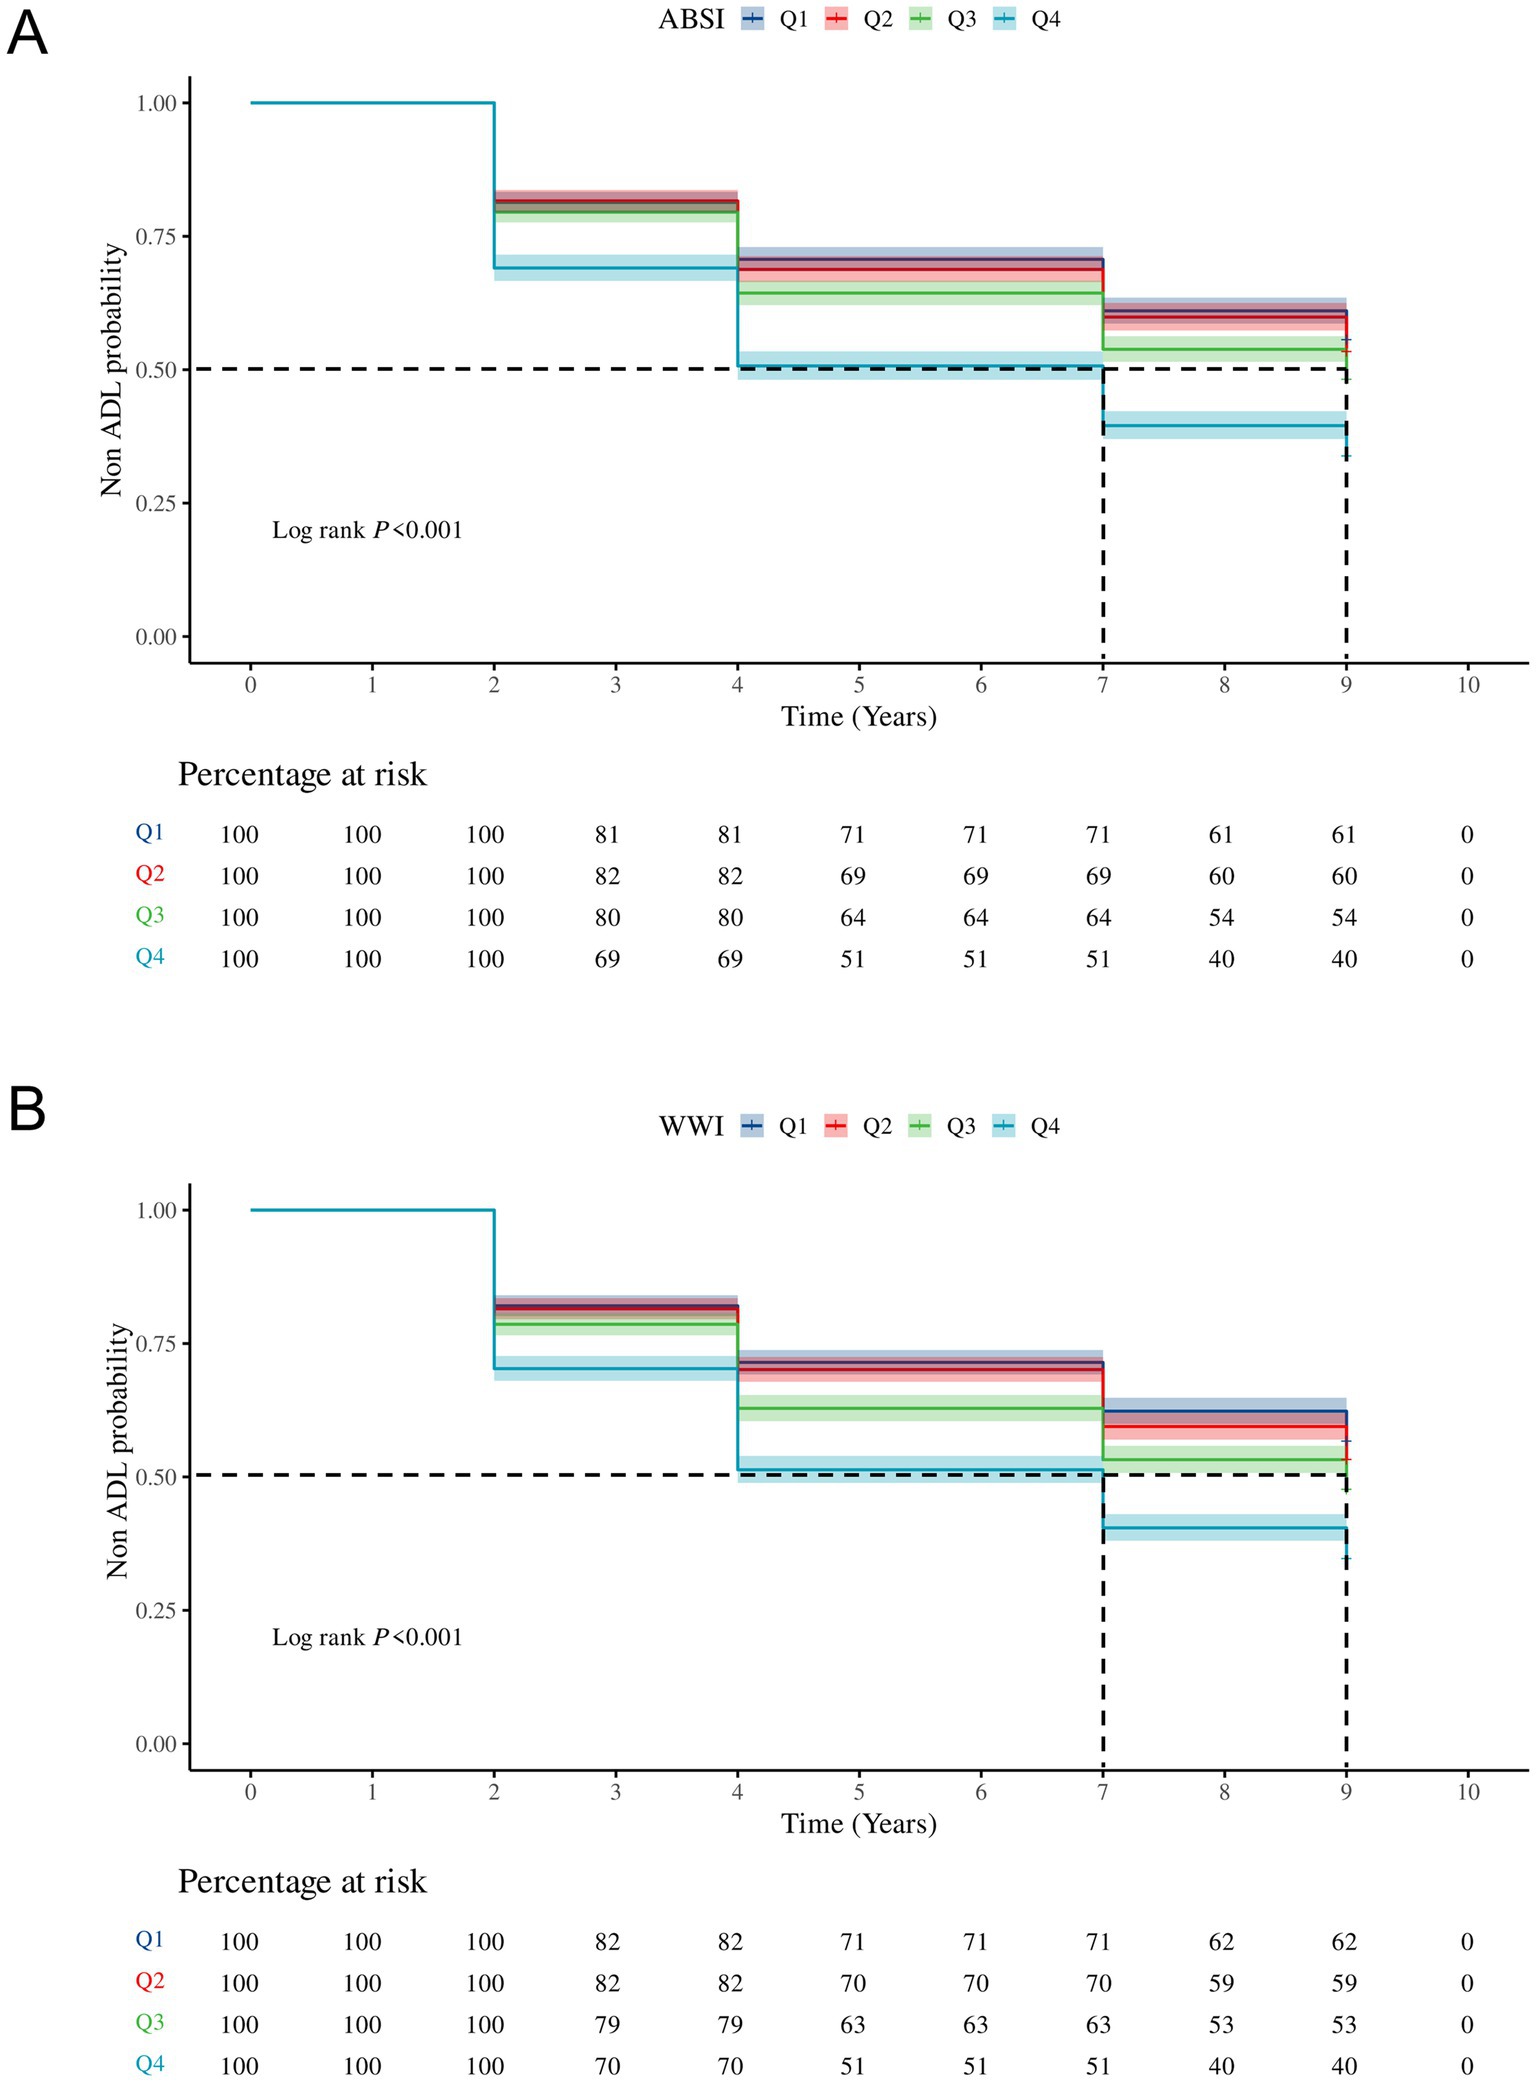
Figure 1. The KM survival curves for ADL impairment across quartile groups of ABSI (A) and WWI (B). Q1, Quartile 1; Q2, Quartile 2; Q3, Quartile 3; Q4, Quartile 4; ADL, Activities of daily living; ABSI, A Body Shape Index; WWI, Weight-adjusted-waist index.
3.5 RCS analysis in the prospective study
Figure 2 presents the results of the RCS analysis among ABSI, WWI, and ADL impairment in the prospective analysis. After adjustment for confounding factors, positive linear correlations were observed among ABSI, WWI, and ADL impairment, suggesting that as ABSI and WWI increase, the risk of ADL impairment occurring rises significantly.
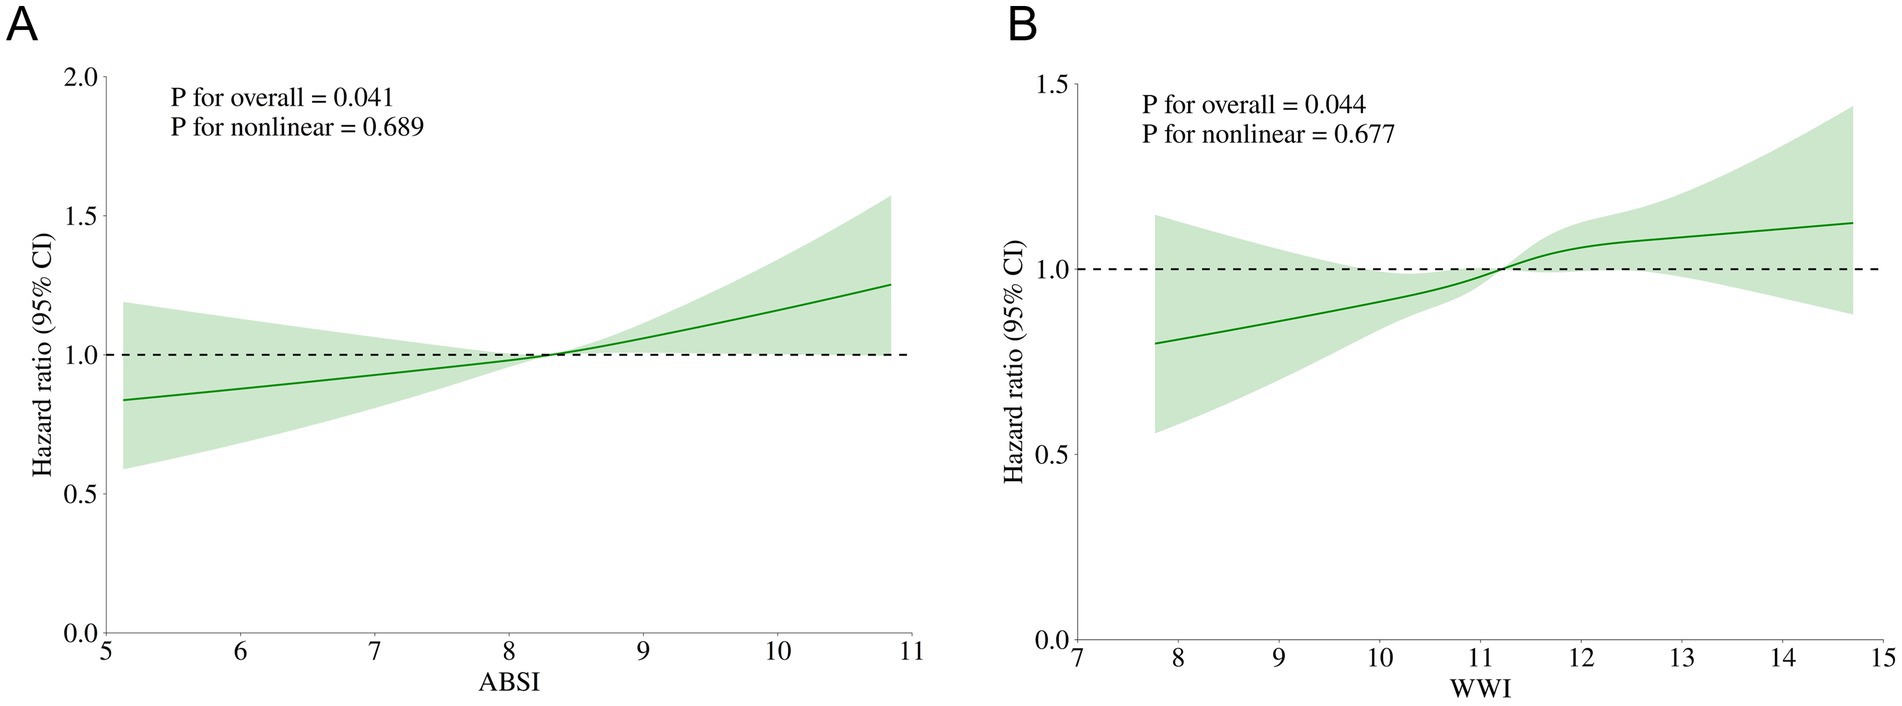
Figure 2. Restricted cubic splines of ABSI, WWI related to ADL impairment after adjusting for confounding factors. (A) RCS curve of ABSI related to ADL impairment; (B) RCS curve of WWI related to ADL impairment.
3.6 Subgroup analysis in the prospective study
The results of the subgroup analysis indicates that there is no difference in the interaction among subgroup variables after adjusting for confounding factors, whether for ABSI or WWI. This implies that the impacts of ABSI and WWI on ADL impairment were generally stable (Figure 3).
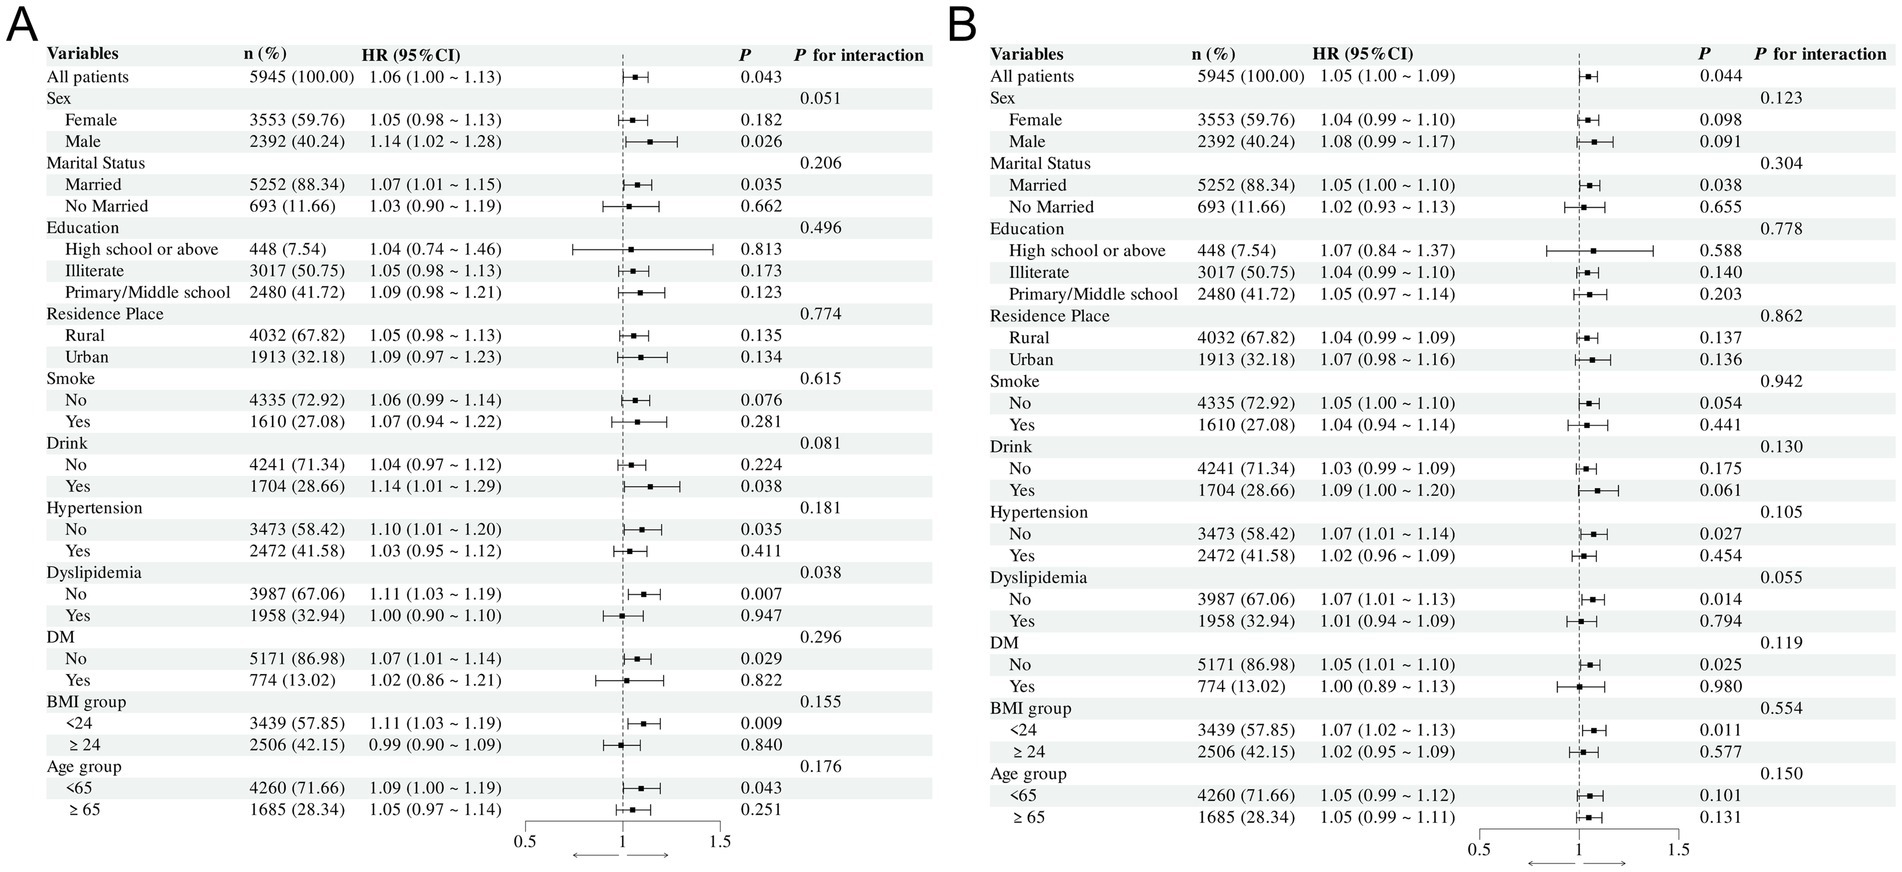
Figure 3. Forest plot of the relationship between ABSI, WWI and ADL impairment after adjusting for confounding factors. (A) Forest plot of the relationship between ABSI and ADL impairment in different subgroups; (B) Forest plot of the relationship between WWI and ADL impairment in different subgroups.
3.7 ROC curve analysis in the prospective study
The ROC curve was employed to evaluate the diagnostic value of ABSI and WWI in predicting ADL impairment. As depicted in Figure 4, the areas under the curves (AUC) of the two composite indices reflecting central obesity were both greater than 0.5. This indicates their potential in identifying the risk of ADL impairment. Notably, the predictive ability of WWI was slightly higher than ABSI, with an AUC value of 0.598.
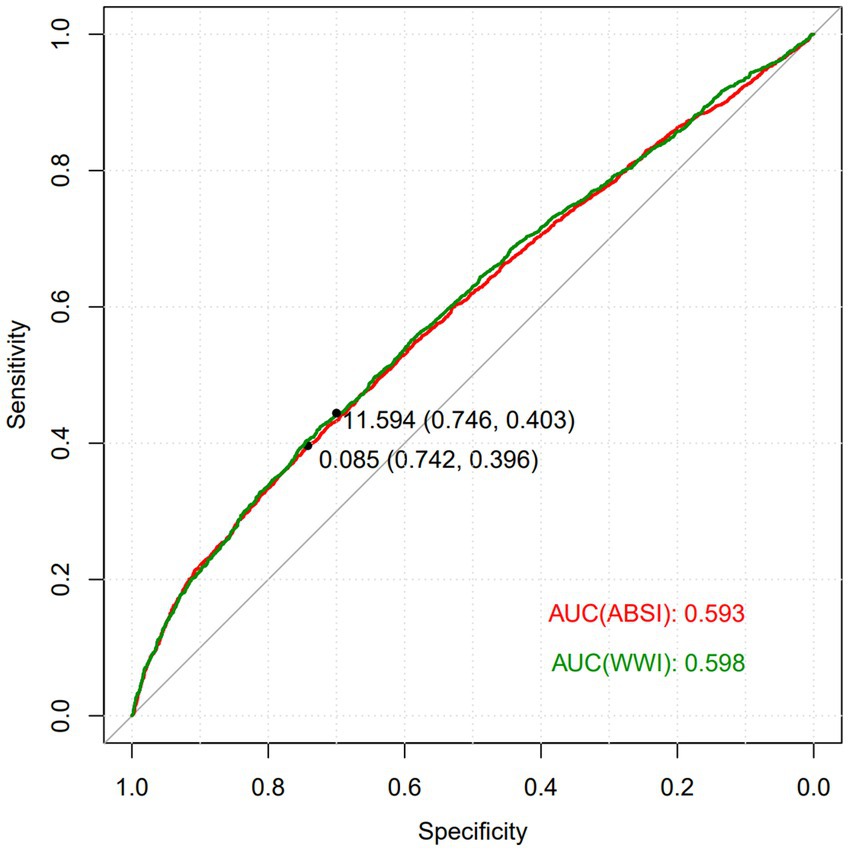
Figure 4. ROC curve of ABSI, WWI on ADL impairment.
4 Discussion
The results of this study indicated that as ABSI and WWI increases, the risk of ADL impairment rises significantly. ABSI and WWI were more effective indicators for predicting ADL impairment risk than BMI or WC.
ADL is typically used to evaluate an individual’s ability to independently perform basic daily tasks. Obesity increases the burden on joints, leading to arthritis and decreased mobility (22). Additionally, obesity is associated with decreased muscle mass, flexibility, and endurance (22, 23), which reduces mobility in elderly adults. It also weakens the individual’s functional independence by causing or aggravating a series of chronic diseases and psychological problems (24, 25). In fact, the use of BMI as a measure of obesity is limited because BMI neither determines the distribution of body fat nor distinguishes between muscle and adipose tissue (26). WC is commonly used to assess the degree of abdominal fat accumulation and central obesity, however, WC does not take into account height variations, which may lead to biases in risk assessment (10). WHtR is the ratio of WC to height, which not only considers the absolute value of waist circumference but also accounts for the influence of height, thereby reducing the biases in obesity assessment due to body shape (13). However, in this study, there was no significant association among BMI, WC, WHtR and ADL impairment. Thus, there is a need to introduce other indicators related to obesity to more sensitively capture health risks in individuals with different body types and ages.
ABSI, a novel body shape index proposed by Nir Krakauer (19), combines WC, height, and weight, with a special focus on abdominal fat distribution, which more accurately reflects central obesity and related health risks (19). ABSI has been found to be more effective than traditional BMI in predicting the risks of visceral fat-related cardiovascular diseases, hypertension, and DM (27–29). WWI is an indicator that integrates weight and WC information, and higher WWI may indicate a higher body fat percentage. WWI enhances the association with WC while weakening the association with weight, thus more comprehensively reflecting fat distribution and muscle mass (12). Changes in fat and muscle mass are closely related to the decline in physical function, with fat content being positively correlated with impairment (30). The decrease in muscle mass is often accompanied by an increase in body fat, especially among middle-aged and elderly population, and the combined changes of these two may more directly reflect the risk of functional impairment (31). A cross-sectional study from the Chinese Longitudinal Healthy Longevity Survey showed that among the elderly population (aged over 65 years), WWI was positively correlated with fat content and negatively correlated with weight, indicating that it is an excellent indicator reflecting the risk of obesity-related ADL impairment (31).
The ABSI and WWI were significantly associated with ADL impairment in this study, possibly because the ABSI and WWI can better track the dynamics of body fat distribution and differences across populations. In contrast, BMI is easily disturbed by short-term weight fluctuations and other factors, and cannot accurately reflect long-term trends. And WC only focuses on the localized situation of the abdomen, which may ignore the impact of the overall shape of the body and fat distribution patterns on ADL impairment (32).
However, this study has several limitations. Firstly, it may not have comprehensively controlled for all potential confounding factors that could influence the impairment of ADL, such as mental health status, social support, and nutritional intake. The incomplete control of these factors is likely to compromise the accuracy of the analysis results and introduce biases to the research conclusions. Secondly, during the research process, the dynamic changes of the ABSI and WWI over time were overlooked. There may be complex associations between ADL impairment and these two indices that change over time. Thirdly, this study collected data through self - reports using the ADL scale instead of objective indicators. The self - reporting method is vulnerable to the accuracy of recall.
Future research can further explore machine learning algorithms (such as random forest and gradient boosting tree) or hierarchical modeling strategies, and improve the prediction accuracy by optimizing feature selection and combination. Furthermore, this study has overlooked the distinct characteristics of the sarcopenic obesity population. In the future, in-depth research on the association between obesity and ADL impairment can be conducted in this specific population.
5 Conclusion
In summary, this study demonstrated that the risk of ADL impairment increased significantly with increasing ABSI and WWI among the middle-aged and elderly population in China, suggesting that ABSI and WWI may be valuable indicators for assessing the association between central obesity and ADL impairment.
Data availability statement
The original contributions presented in the study are included in the article/supplementary material, further inquiries can be directed to the corresponding authors.
Ethics statement
The studies involving humans were approved by Peking University Medical Ethics Committee (IRB00001052-11015). The studies were conducted in accordance with the local legislation and institutional requirements. The participants provided their written informed consent to participate in this study.
Author contributions
YD: Conceptualization, Writing – original draft. WZ: Methodology, Writing – original draft. ZC: Investigation, Writing – original draft. XZ: Investigation, Writing – original draft. ML: Software, Writing – original draft. YW: Data curation, Writing – original draft. YH: Supervision, Writing – review & editing.
Funding
The author(s) declare that financial support was received for the research and/or publication of this article. This work was supported by the National Natural Science Foundation of China (Grant NO. 82074409); High Level Chinese Medical Hospital Promotion Project (NO. HLCMHPP2023082, NO. HLCMHPP2023011) and The Science and Technology Innovation Project of China Academy of Chinese Medical Sciences (NO. CI2023C007YG).
Acknowledgments
We are grateful to all the subjects who participated in the study.
Conflict of interest
The authors declare that the research was conducted in the absence of any commercial or financial relationships that could be construed as a potential conflict of interest.
Generative AI statement
The author(s) declare that no Gen AI was used in the creation of this manuscript.
Publisher’s note
All claims expressed in this article are solely those of the authors and do not necessarily represent those of their affiliated organizations, or those of the publisher, the editors and the reviewers. Any product that may be evaluated in this article, or claim that may be made by its manufacturer, is not guaranteed or endorsed by the publisher.
Abbreviations
ADL, Activities of Daily Living; BMI, Body Mass Index; WC, Waist Circumference; ABSI, A Body Shape Index; WHtR, Waist-to-height ratio; WWI, Weight-adjusted-waist index; HR, Hazard ratio; CHARLS, China Health and Retirement Longitudinal Study; DM, Diabetes mellitus; RCS, Restricted cubic spline; OR, Odds ratio; CI, Confidence interval; ROC, Receiver operating characteristic; AUC, Area under the curve.
References
1. Schmidle, S, Gulde, P, Herdegen, S, Böhme, GE, and Hermsdörfer, J. Kinematic analysis of activities of daily living performance in frail elderly. BMC Geriatr. (2022) 22:244. doi: 10.1186/s12877-022-02902-1
2. Nagarkar, A, and Kulkarni, S. Association between daily activities and fall in older adults: an analysis of longitudinal ageing study in India (2017-18). BMC Geriatr. (2022) 22:203. doi: 10.1186/s12877-022-02879-x
3. van der Vorst, A, Zijlstra, GA, Witte, N, Duppen, D, Stuck, AE, Kempen, GI, et al. Limitations in activities of daily living in community-dwelling people aged 75 and over: a systematic literature review of risk and protective factors. PLoS One. (2016) 11:e0165127. doi: 10.1371/journal.pone.0165127
4. Liu, L, Zheng, Y, Tian, J, Li, L, Ruan, H, Jia, S, et al. Disparities in overall survival by varying duration of disability in activities of daily living in older people: a population-based cohort from Chinese longitudinal healthy longevity survey (CLHLS). J Nutr Health Aging. (2024) 28:100022. doi: 10.1016/j.jnha.2023.100022
5. Ansah, JP, Chiu, CT, Wei-Yan, AC, Min, TLS, and Matchar, DB. Trends in functional disability and cognitive impairment among the older adult in China up to 2060: estimates from a dynamic multi-state population model. BMC Geriatr. (2021);21:380. doi: 10.1186/s12877-021-02309-4
6. Jiang, Y, and Li, L. Projections of functional dependence among the late middle-aged and older population from 2018-2048 in China: a dynamic microsimulation. Glob Health Res Policy. (2024) 9:15. doi: 10.1186/s41256-024-00357-y
7. Fico, BG, Maharaj, A, Pena, GS, and Huang, CJ. The effects of obesity on the inflammatory, cardiovascular, and neurobiological responses to exercise in older adults. Biology. (2023) 12:1–24. doi: 10.3390/biology12060865
8. Moltrer, M, Pala, L, Cosentino, C, Mannucci, E, Rotella, CM, and Cresci, B. Body mass index (BMI), waist circumference (WC), waist-to-height ratio (WHtR) e waist body mass index (wBMI): which is better? Endocrine. (2022) 76:578–83. doi: 10.1007/s12020-022-03030-x
9. Sahakyan, KR, Somers, VK, Rodriguez-Escudero, JP, Hodge, DO, Carter, RE, Sochor, O, et al. Normal-weight central obesity: implications for Total and cardiovascular mortality. Ann Intern Med. (2015) 163:827–35. doi: 10.7326/M14-2525
10. Welborn, TA, and Dhaliwal, SS. Preferred clinical measures of central obesity for predicting mortality. Eur J Clin Nutr. (2007) 61:1373–9. doi: 10.1038/sj.ejcn.1602656
11. Smith, GI, Mittendorfer, B, and Klein, S. Metabolically healthy obesity: facts and fantasies. J Clin Invest. (2019) 129:3978–89. doi: 10.1172/JCI129186
12. Zeng, P, Jiang, C, Cao, J, Li, M, and Lin, F. Longitudinal relationship between weight-adjusted waist index and depressive symptoms in middle-aged and older Chinese adults: a prospective cohort study. J Affect Disord. (2024) 363:381–90. doi: 10.1016/j.jad.2024.07.080
13. Ashwell, M, Cole, TJ, and Dixon, AK. Ratio of waist circumference to height is strong predictor of intra-abdominal fat. BMJ. (1996) 313:559–60. doi: 10.1136/bmj.313.7056.559d
14. Chen, ZT, Wang, XM, Zhong, YS, Zhong, WF, Song, WQ, and Wu, XB. Association of changes in waist circumference, waist-to-height ratio and weight-adjusted-waist index with multimorbidity among older Chinese adults: results from the Chinese longitudinal healthy longevity survey (CLHLS). BMC Public Health. (2024) 24:318. doi: 10.1186/s12889-024-17846-x
15. Zhang, X, Wang, Y, Li, Y, Gui, J, Mei, Y, Yang, X, et al. Four-years change of BMI and waist circumference are associated with metabolic syndrome in middle-aged and elderly Chinese. Sci Rep. (2024) 14:10220. doi: 10.1038/s41598-024-60172-w
16. Gill, TM, Robison, JT, and Tinetti, ME. Difficulty and dependence: two components of the disability continuum among community-living older persons. Ann Intern Med. (1998) 128:96–101. doi: 10.7326/0003-4819-128-2-199801150-00004
17. Katz, S, Ford, AB, Moskowitz, RW, Jackson, BA, and Jaffe, MW. Studies of illness in the aged. The index of ADL: a standardized measure of biological and psychosocial function. JAMA. (1963) 185:914–9. doi: 10.1001/jama.1963.03060120024016
18. Bergman, RN. A better index of body adiposity. Obesity. (2012) 20:1135. doi: 10.1038/oby.2012.99
19. Krakauer, NY, and Krakauer, JC. A new body shape index predicts mortality hazard independently of body mass index. PLoS One. (2012) 7:e39504. doi: 10.1371/journal.pone.0039504
20. Li, JJ, Zhao, SP, Zhao, D, Lu, GP, Peng, DQ, Liu, J, et al. 2023 Chinese guideline for lipid management. Front Pharmacol. (2023) 14:1190934. doi: 10.3389/fphar.2023.1190934
21. Tobias, DK, Merino, J, Ahmad, A, Aiken, C, Benham, JL, Bodhini, D, et al. Second international consensus report on gaps and opportunities for the clinical translation of precision diabetes medicine. Nat Med. (2023) 29:2438–57. doi: 10.1038/s41591-023-02502-5
22. Stenholm, S, Harris, TB, Rantanen, T, Visser, M, Kritchevsky, SB, and Ferrucci, L. Sarcopenic obesity: definition, cause and consequences. Curr Opin Clin Nutr Metab Care. (2008) 11:693–700. doi: 10.1097/MCO.0b013e328312c37d
23. Bell, JA, Sabia, S, Singh-Manoux, A, Hamer, M, and Kivimäki, M. Healthy obesity and risk of accelerated functional decline and disability. Int J Obes. (2017) 41:866–72. doi: 10.1038/ijo.2017.51
24. Luppino, FS, de Wit, LM, Bouvy, PF, Stijnen, T, Cuijpers, P, Penninx, BW, et al. Overweight, obesity, and depression: a systematic review and meta-analysis of longitudinal studies. Arch Gen Psychiatry. (2010) 67:220–9. doi: 10.1001/archgenpsychiatry.2010.2
25. Liu, H, Ma, Y, Lin, L, Sun, Z, Li, Z, and Jiang, X. Association between activities of daily living and depressive symptoms among older adults in China: evidence from the CHARLS. Front Public Health. (2023) 11:1249208. doi: 10.3389/fpubh.2023.1249208
26. Stevens, J, McClain, JE, and Truesdale, KP. Selection of measures in epidemiologic studies of the consequences of obesity. Int J Obes. (2008) 32:S60–6. doi: 10.1038/ijo.2008.88
27. Kajikawa, M, Maruhashi, T, Kishimoto, S, Yamaji, T, Harada, T, Saito, Y, et al. A Body Shape Index as a Simple Anthropometric Marker of Abdominal Obesity and Risk of Cardiovascular Events. J Clin Endocrinol Metab. (2024) 109:3272–81. doi: 10.1210/clinem/dgae282
28. He, S, and Chen, X. Could the new body shape index predict the new onset of diabetes mellitus in the Chinese population? PLoS One. (2013) 8:e50573. doi: 10.1371/journal.pone.0050573
29. Cheung, YB. “A body shape index” in middle-age and older Indonesian population: scaling exponents and association with incident hypertension. PLoS One. (2014) 9:e85421. doi: 10.1371/journal.pone.0085421
30. Hussain, SM, Urquhart, DM, Wang, Y, Shaw, JE, Magliano, DJ, Wluka, AE, et al. Fat mass and fat distribution are associated with low back pain intensity and disability: results from a cohort study. Arthritis Res Ther. (2017) 19:26. doi: 10.1186/s13075-017-1242-z
31. Sun, J, Lin, J, Shen, W, Ding, P, Yang, W, Huang, L, et al. Associations of body mass index, waist circumference and the weight-adjusted waist index with daily living ability impairment in older Chinese people: a cross-sectional study of the Chinese longitudinal healthy longevity survey. Diabetes Obes Metab. (2024) 26:4069–77. doi: 10.1111/dom.15762
Keywords: a body shape index, weight-adjusted waist index, activities of daily living, central obesity, China Health and Retirement Longitudinal Study
Citation: Du Y, Zhang W, Chen Z, Zhu X, Lyu M, Wei Y and Hu Y (2025) Associations of a body shape index, weight-adjusted waist index with the activities of daily living impairment in the middle-aged and elderly population: results from the China Health and Retirement Longitudinal Study. Front. Med. 12:1519362. doi: 10.3389/fmed.2025.1519362
Edited by:
Evasio Pasini, University of Brescia, ItalyReviewed by:
Guang Chen, The University of Hong Kong, Hong Kong SAR, ChinaXun Luo, Kerry Rehabilitation Medicine Research Institute, China
Esra Çataltepe, Konya Beyhekim State Hospital, Türkiye
Copyright © 2025 Du, Zhang, Chen, Zhu, Lyu, Wei and Hu. This is an open-access article distributed under the terms of the Creative Commons Attribution License (CC BY). The use, distribution or reproduction in other forums is permitted, provided the original author(s) and the copyright owner(s) are credited and that the original publication in this journal is cited, in accordance with accepted academic practice. No use, distribution or reproduction is permitted which does not comply with these terms.
*Correspondence: Yi Wei, dGlhbmRpYW54aWFvd3UzQDE2My5jb20=; Yuanhui Hu, aHVpeXVodWk1NUBzb2h1LmNvbQ==
†These authors have contributed equally to this work