 ChenYang Mei1†Yuanyuan Zhang1†Luting Pan1Bin Dong1Xingwei Chen1Qingyi Gao1Hang Xu1Wenjin Xu1
 Hui Fang1Siyu Liu1
 Colm McAlinden2
 Eleftherios I. Paschalis3,4Qinmei Wang1Mei Yang1*
 Jinhai Huang5,6,7*A-Yong Yu1*
- 1Eye Hospital and School of Ophthalmology and Optometry, Wenzhou Medical University, Wenzhou, China
- 2Department of Ophthalmology, Singleton Hospital, Swansea Bay University Health Board, Swansea, United Kingdom
- 3Harvard Medical School, Boston, MA, United States
- 4Disruptive Technology Laboratory (D.T.L.), Massachusetts Eye and Ear, Department of Ophthalmology, Harvard Medical School, Boston, MA, United States
- 5Eye Institute and Department of Ophthalmology, Eye & ENT Hospital, Fudan University, Shanghai, China
- 6NHC Key Laboratory of Myopia (Fudan University), Key Laboratory of Myopia, Chinese Academy of Medical Sciences, Shanghai, China
- 7Shanghai Research Center of Ophthalmology and Optometry, Shanghai, China
In this study, a one-step electrochemical aptasensor was developed to detect the biomarker vascular endothelial growth factor (VEGF), an important protein in the pathogenesis of many retinal diseases, including age-related macular degeneration, diabetic retinopathy, retinopathy of prematurity, and retinal vein occlusion. The aptamer has a good affinity and can rapidly identify and capture VEGF based on its unique structure. We designed a VEGF aptasensor based on the aptamer recognition and complex metallo nanoenzyme particles as an electron exchange center and bridge between capture DNA and electrode. The aptamers maintained the hairpin structure to avoid nonspecific surface adsorption and expose the capture sequence outwards when the target was inexistent. Conversely, the aptamers opened the hairpin structure to release space to accomplish binding between VEGF and DNA, resulting in increased impedance. The performance of the electrochemical aptasensor is detected by electrochemical impedance spectroscopy (EIS). The limit of detection by EIS was as low as 8.2 pg ml−1, and the linear range was 10 pg ml−1–1 μg ml−1. The electrochemical aptasensor also showed high specificity and reproducibility.
Introduction
Pathological changes due to exudation, bleeding, and hyperplasia caused by ocular neovascularization are a major cause of visual impairment. Vascular endothelial growth factor (VEGF) is key in ocular neovascularization and related to diseases such as retinal vein obstruction, diabetic retinopathy (DR), neovascular glaucoma, age-related macular degeneration (AMD), and retinopathy of prematurity (ROP). VEGF stimulates mitosis and migration of vascular endothelial cells, increasing the permeability of blood vessels (Lange et al., 2016; Zhao and Singh, 2018). Early treatment can significantly reduce complications and subsequent visual impairment caused by neovascularization. The difficulties associated with the treatment are related to early clinical diagnosis. Thus, it is necessary to establish an effective analytical system of VEGF, which is favorable for diagnosis, progression, anti-VEGF therapy dosage, and efficacy evaluation.
To date, several approaches for the detection of VEGF have been reported, including chemiluminescence (Long et al., 2018), fluorescence (Dang et al., 2019), photoelectricity (Da et al., 2018), colorimetry (Zhang et al., 2017), electrochemistry (Bozal-Palabiyik et al., 2019), and enzyme-linked immunosorbent assay (ELISA) (Chattaraj et al., 2016). However, most methods require tedious steps or large-scale equipment with a point of care use. The content of VEGF in the bodily fluid is as low as dozens to hundreds of pg ml−1. Hence, some methods are not sufficiently sensitive for application, while some enzyme-based methods are difficult to store. Among many new techniques, electrochemical sensors have received great attention in the detection of biomarkers owing to their characteristics of rapidness, sensitivity, cost-efficiency, point-of-care, and simple operation, rendering them suitable for clinical application (Ferapontova, 2018; Lima et al., 2018).
In recent years, aptamers that specifically bind to the target analyte are considered traditional substitutes of the antibody and are highly promising biorecognition elements (Jayasena, 1999; Ilgu and Nilsen-Hamilton, 2016). The dissociation constant of the aptamer and the target is 1 × 10–12–1×10⁻⁹ mol L−1. Thus, the affinity of the aptamers is similar to that of the antibodies (Jenison et al., 1994). The molecular weight of the aptamer is small. Therefore, the steric resistance to the target is smaller than that of the antibody to the antigen, which is conducive to the construction of the high-density complex. Aptamers are stable at room temperature and easily modifiable at the 5′ or 3′ end. Currently, aptamer-based electrochemical sensors have become a cutting-edge topic. They have been applied in sensing carcinoembryonic antigens (Gao et al., 2020), aflatoxin M1 (Stepanova et al., 2019), chloramphenicol (Zhu X et al., 2019), and thrombin (Wang et al., 2019).
In order to improve the sensitivity for the detection of biomarkers, substantial materials are used to construct the electrochemical sensors by increasing the specific surface area or accelerating electrical transmission. Enzymes are biological macromolecules with catalytic performance. They have the advantage of high efficiency and strong substrate specificity when applied in catalytic reactions. However, in the actual production process, natural enzymes are difficult to separate and purify, with high cost and poor stability, which brings much inconvenience to storage and use. Therefore, there is an urgent need for good stability and easy preparation of simulated enzymes to meet the needs of practical production and application. Nanoparticle-based catalysts have attracted increasing interest due to their simple synthesis, adjustable catalytic activity, high stability, low cost, and easy treatment (Kumar et al., 2017; Hu et al., 2018; Yao et al., 2018). Zhu et al. reported a CuS nanozyme with a large surface area to provide excellent catalytic activity for detecting dopamine and glucose (Zhu et al., 2019). Platinum (Pt) nanoparticle has been applied in a sensitive electrochemical immunosensor to detect thyroid-stimulating hormone down to 0.3 pg ml−1 (Nandhakumar et al., 2020). Nanozymes are promising alternatives to natural enzymes for electrochemical biosensors (Mahmudunnabi et al., 2020).
In order to develop a novel VEGF detection method for clinical use, we designed a simple, effective, and sensitive VEGF detective sensor based on aptamer recognition and (CME NPs) as an electron exchange center and bridge between capture DNA and electrode. The aptamers maintained the hairpin structure to avoid nonspecific surface adsorption and expose the capture sequence outwards when the target was inexistent. Conversely, the aptamers opened the hairpin structure to release the space to accomplish binding between VEGF and DNA, resulting in increased impedance. Thus, the impedance changes before and after target binding are exploited to realize the rapid and sensitive detection of VEGF (Scheme 1).
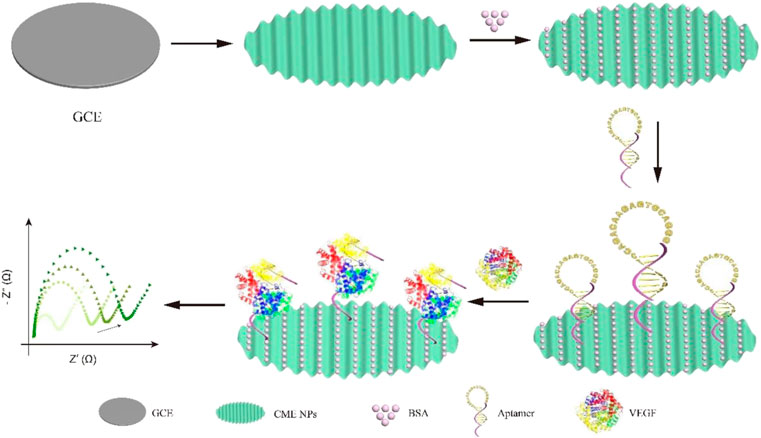
SCHEME 1. Schematic illustration of VEGF aptasensor based on CME NPs.
Experimental Section
Chemicals and Materials
Platinum acetylacetonate (Pt (acac)2, 98%), palladium acetylacetonate (Pd (acac)2, 99%) and bis(acetylacetonato)dioxomolybdenum (MoO2 (acac)2, 97%) were purchased from Shanghai Macklin Biochemical Co., Ltd. (China). Sodium iodide (NaI, AR), dimethyl formamide (DMF, AR), and polyvinyl pyrrolidone (PVP, MW = 30,000, AR) were purchased from Shanghai Aladdin Biochemical Co. Mucin, IL-6, IgG, VEGF A165, functionalized single-stranded DNA (ssDNA) with 5′ carboxylic acid groups, and sequence 5′-AAAAAAAAAACCGTCTTCCAGACAAGAGTGCAGGGAAAAAGAAGACGG-3′ were obtained from Sangon Biological Engineering Technology & Services Co., Ltd. (Shanghai, China). All reagents were of analytical grade and used as received without further purification. Milli-Q water was obtained using a Milli-Q water purification system (18.2 MΩ cm, Millipore, Molsheim, France).
Instruments and Electrodes
The measurements of all electrochemical assays were performed on an AUTOLAB M204 electrochemical workstation (Metrohm Autolab B.V, Netherlands), connected to a computer data analysis system. The electrochemical impedance spectroscopy (EIS) experiments were carried out using a conventional three-electrode system consisting of a 3 mm glassy carbon working electrode (GCE), a platinum counter electrode, and an Ag/AgCl reference electrode. The XRD pattern of the obtained CME NPs was measured using a Smartlab 9 powder diffractometer with Cu K radiation (λ = 1.54 Å). TEM, HRTEM images, SAED pattern, and energy dispersive X-ray spectroscopy (EDX) mapping images were inspected using transmission electron microscopy (JEM2100F, Japan) with an accelerating voltage of 200 kV.
Preparation of CME NPs
In a typical synthesis process (Mu et al., 2019) of CME NPs, 20 mg Pt (acac)2, 16 mg Pd (acac)2, and 16 mg MoO2 (acac)2 were firstly added into 10 ml DMF under stirring until a transparent solution was obtained. Then, 2 ml NaI solution (300 mg) was added. After stirring for 20 min, 160 mg PVP was added, and the mixed solution was stirred for another 20 min. The resulting solution was transferred into a Teflon-lined autoclave and sealed tightly. Then the autoclave was maintained at 150°C for 10 h. Subsequently, the mixture was transferred to a Teflon-lined stainless-steel autoclave and maintained at 150°C for 10 h. After cooling to room temperature naturally, the precipitate was collected and washed with ethanol several times. The final products were dried through lyophilization. As a control, Pt, Pd, and bimetal PtPd nanoparticles were synthesized through a similar process.
Fabrication of Aptasensor
Before modification, a GCE was polished to a mirror using 0.05 μm alumina slurry, followed by thorough rinsing with ethanol and deionized water sequentially, sonication in deionized water for 1 min, drying by blowing N2 gas, and keeping it capped before use. Then, 5 μL CME NPs in chitosan solution was dropped on the GCE, and the electrode was dried in air for 2 h at room temperature. Next, the functionalized hairpin DNA was incubated in 20 mg ml−1 EDC (in 1.0 mM MES, pH 5.5) for 30 min with gentle shaking, followed by adding an equivalent volume of 20 mg ml−1 NHS for 5 min with gentle shaking. A volume of 5 μL mixture was dropped onto the modified GCE and kept capped at 4°C overnight. Then, the modified GCE was washed to remove unbound DNA, followed by incubation with 5% BSA for 1 h at room temperature to prevent nonspecific adsorption. Finally, the resulting GCE was washed with deionized water to remove redundant BSA and maintained at 4°C before use.
Electrochemical Measurements
For the electrochemical immunoassay of the analyte, 5 μL of the standard VEGF solution or a blank sample was dripped onto the surface of the aptasensor to complete binding between the aptasensor and protein, followed by incubation for 1 h at room temperature. After rinsing with 10 mM phosphate-buffered saline (PBS), the EIS was recorded when the frequency range was 0.1–100 kHz, the amplitude of the applied sine wave potential was 10 mV, and at an open-circuit voltage in 0.1 M KCl solution containing 5 mM [Fe(CN)6]3−/4−. Subsequently, cyclic voltammetry (CV) was performed at scan potential −0.2 to −1.1 V at a sweep rate of 50 mV/s in 0.1 M KCl solution containing 5 mM [Fe(CN)6]3−/4−. The catalytic performance was recorded by CV using a potential window of −0.8 to +0.2 V at a sweep rate of 50 mV/s in PBS buffer containing 15 mM H2O2 under the protection of nitrogen.
Results and Discussion
Materials Characterization
The XRD pattern of the synthesized CME NPs was firstly characterized. The results shown in Figure 1A indicate that all diffraction peaks were in good agreement with those of the cubic Pt in the JCPDS file PDF#87-0640, displaying the fcc structure of the CME NPs. No other diffraction peaks appeared in the spectra, indicating that doping of Pd (PDF#46-1043) and Mo (PDF#42-1120) has little effect on the final crystal structure. Similar diffraction peak locations of Pd, Mo, and Pt also played critical roles. All diffraction peaks agreed well with the report (Mu et al., 2019), indicating the successful synthesis of the product. The TEM image displayed in Figure 1C indicated that the obtained sample was composed of uniform cubic nanoparticles with a mean size of about 10 nm, similar to Pd, Pt, and PdPt (Supplementary Figures S2A–S2C). The size of the statistical analysis spectra shown in Figure 1B further confirmed the observation in Figure 1C. Clear lattice fringes with a d-spacing of 0.195 nm for the (200) plane shown in Figure 1D exhibited a perfect crystal structure of the obtained nanoparticles. The corresponding SAED (selected area electronic diffraction) pattern shown in Figure 1E further confirmed the crystal structure of the sample. From TEM EDX mapping (Figures 1F–I), it can be observed that Pt, Pd, and Mo, three elements, covered the sample uniformly, indicating the successful and uniform combination of the three kinds of elements. The energy dispersive X-ray spectrum shown in Supplementary Figure S1 further confirmed the existence of Pt, Pd, and Mo in the sample (C and Cu coming from the grid). The valence state variation of the CME NPs was studied using XPS (Supplementary Figures S2D–S2F). XPS spectra show Pt 4f, Pd 3d, and Mo 3d, the Pt species on the surface of the CME NPs which are mainly in the form of Pt0 4f5/2 (73.941eV), Pt0 4f 7/2 (70.458 eV), Pt2+ 4f 5/2 (74.205eV), Pt2+ 4f 7/2 (70.94eV), the Pd species of Pd0 3d3/2 (340.8 eV), Pd0 3d5/2 (334.5, 334.9, 335.2 eV), Pd2+ 3d5/2 (340 eV), the Mo species of Mo4+ 3d3/2 (234, 235.3 eV), Mo5+ 3d3/2 (235 eV), Mo5+ 3d5/2 (230.7 eV), Mo6+ 3d 3/2 (232 eV).
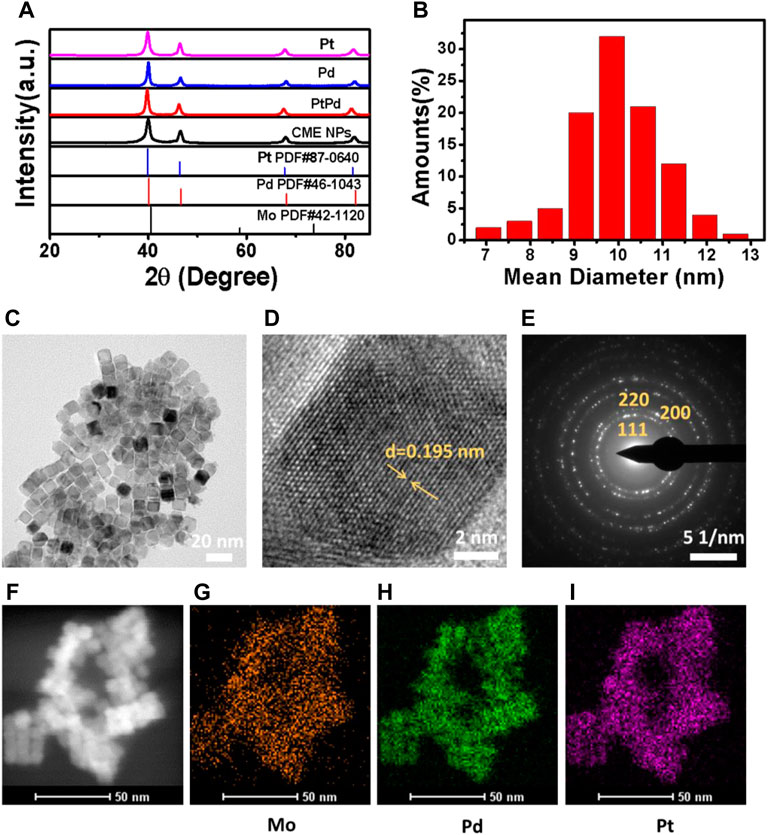
FIGURE 1. XRD (A), size statistical analysis spectra (B), TEM (C), HRTEM (D), SAED (E), and TEM EDX mapping (Figures 1F–I) of the synthesized nanoparticles.
Electrodes Electrochemical Characteristics
In order to monitor aptasensor fabrication, the CV and EIS in 0.1 M PBS (pH 7.4) containing 5 mM [Fe(CN)6]3/4− were recorded. As shown in Figure 2A, the bare GCE exhibits a very low charge transfer resistance according to the equivalent circuit diagram (Figure 2B). The Randles equivalent circuit possesses several parameters, including solution resistance (Rs), constant phase element (CPE), and interfacial electron transfer resistance (Ret), equal to the semicircle diameter of EIS and the Warburg impedance (Zw). When aptamer/CME NPs were modified on the electrode surface, the Ret value increased. This is probably attributed to the electrostatic repulsive force from single-stranded aptamer with negative charges on its phosphate backbone and [Fe(CN)6]3/4− solution. Subsequently, the Ret value of BSA/aptamer/CME NPs further increased a little bit because the formed layer acted as a mass-transfer blocking barrier (Cheng et al., 2012). Finally, a significant increase in Ret was observed when VEGF (10 ng ml−1) was bound to aptamers because the aptasensor was introduced with a mass-transfer blocking barrier from VEGF. The increased Ret indicated that the electrochemical was established successfully. Meanwhile, the EIS of the pure chitosan-modified group did not change significantly when the same concentration of VEGF was added (Supplementary Figure S3). Based on the above experiment, the CME NPs played the role of a bridge between capturing DNA and the electrode and enhanced signal transmission. As shown in Figure 2C, the changes in corresponding CVs of the aptasensor demonstrate a trend that agrees with the EIS experimental results. As shown in Figure 2C, the changes in corresponding CVs of the aptasensor demonstrate a trend that agrees with the EIS experimental results. The peak current decreased clearly after aptamer assembly on the electrode surface, indicating that assembled aptamers hinder the diffusion of ferricyanide toward the electrode surface. Subsequently, when BSA was introduced to block nonspecific adsorption sites on the electrode surface, the peak current decreased further due to the steric hindrance effect of BSA. After incubating the aptasensor in VEGF, a decrease in current was observed, indicating that the aptasensor was successfully assembled. The CME NPs were dropped on a GCE, compared with N2-saturated in the PBS buffer, and the presence of H2O2 in the electrolyte makes a sharp stripping peak in Figure 2D. Meanwhile, bare GCE in H2O2 solution shows a relatively small response (Supplementary Figure S4), indicating that CME NPs possess the catalytic activities for H2O2. As shown in Figure 2D, the bare GCE exhibits an unconspicuous change of peak in PBS (pH 7.4, 10 mM) containing 15 mM H2O2 under the protection of nitrogen. In contrast, when CME NPs were modified on the electrode surface, the current reduction response increased significantly, which shows that CME NPs possess excellent catalytic activity for H2O2. As shown in Supplementary Figure S4, the Pd and Pt modified electrodes both demonstrated relatively small activity. Although the PtPd modified electrodes showed high activity, the multiples of change were not as good as the CME NPs modified electrode. Therefore, the CME NPs have the most potential under the above-mentioned conditions.
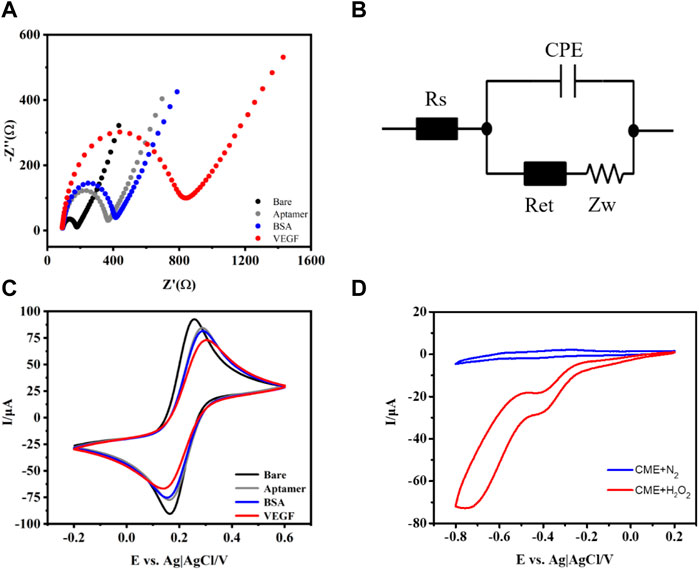
FIGURE 2. Nyquist plots of the EIS (A), equivalent circuit diagram (B), CV for different modified electrodes (C), and in PBS buffer with or without H2O2 (D).
Optimization of the Aptasensor
In order to display the best catalytic performance, as shown in Figures 3A, B, the peak current rapidly increased with the increase in CME NPs from 1.0 mg ml−1 to 3.0 mg ml−1 and slowly increased with the increase in CME NPs from 3.0 mg ml−1 to 5.0 mg ml−1. The above experimental results possibly put down to thick coating blocking the electrons transfer (Zhang et al., 2020). Besides, the electrochemical stability of the aptasensor was reduced with the increase in CME NPs (Supplementary Figure S5). Thus, the optimized modification amount of CME NPs was determined as 3.0 mg ml−1. The parameter of each concentration was measured three times on different electrodes.
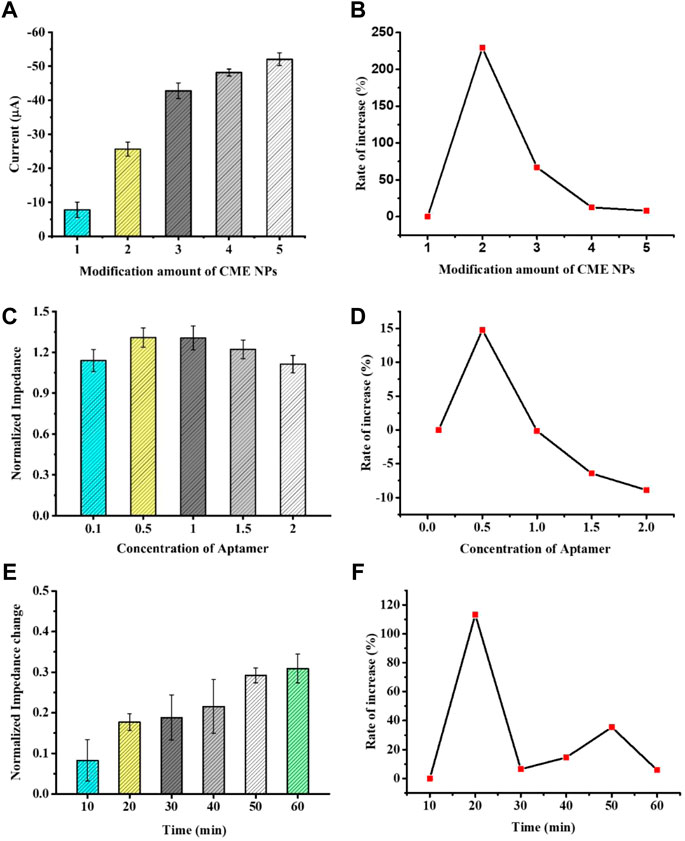
FIGURE 3. The optimization of experimental conditions with modification amount of CME NPs (A), concentration of aptamer (C), and time of hybridization (E). The rate of increase under certain conditions with CME NPs (B), aptamer (D), and time of hybridization (F). Error bars, SD, n = 3.
In order to investigate the effect of the aptamer concentration on sensor performance, the electrode modified with CME NPs was treated with 0.1, 0.5, 1.0, 1.5, and 2.0 M aptamer DNA and the same concentration of VEGF was dropped on it. When the electrode surface modified with the aptamer was used to detect the VEGF, the impedance of the system was increased. The increase in Ret suggests that the binding between the biomarker and the aptamer leads to a decrease in the mass-transfer efficiency and alters the dielectric and conductive properties of the electrode surface (Roushani et al., 2019; Mahmoud et al., 2020). Furthermore, to confirm the effect of the aptamer concentration on sensor performance, the normalized impedance (Ra/Rb, Ra represents the Ret of the electrode after treating with VEGF or control solution and Rb represents the Ret of the electrode before treating with VEGF or control solution) was plotted as the ordinate and the concentration of the aptamer was taken as the abscissa. The normalized impedance allows each electrode to serve as its own internal control and reduces individual differences of electrodes. As seen in Figures 3C, D, as the aptamer concentration increases, the normalized impedance shows a trend of increasing first and then decreasing. This phenomenon could be attributed to a modest increase in the aptamer bringing extra bonding capacity and an excess increase in the aptamer bringing steric hindrance. Thus, 1.0 M was selected in the subsequent experiment. The parameter of each concentration was measured three times on different electrodes.
Incubation time is also an important factor affecting the analysis performance of the aptasensor. To investigate the best incubation time between aptamers and proteins, the modified GCEs were incubated at the same concentration of VEGF at 37°C, and data were collected at different time points. As shown in Figures 3E, F, the normalized impedance increased with an increase in incubation time. When the incubation time reached 60 min, the impedance reached a response plateau, indicating that the immune binding in the reaction was saturated. Therefore, we selected 60 min as the aptasensor analysis incubation time.
Analytical Performance
Under the optimized experimental conditions, the aptasensor was modified to 5 μL 3.0 mg ml−1 CME NPs, and the concentration of the aptamer was 1.0 M. Then, a 5 μL of the diluted, different VEGF concentrations solution was added to the modified electrode surface and incubated for 60 min to ensure that the liquid completely covered the GCE. Subsequently, the unbound proteins were washed with 1 ml of deionized water and characterized by EIS. In the EIS measurements, the Ret signal increased according to the binding of VEGF to the aptamer (Figure 4A). The trend of increased Ret signal slows down upon reaching a certain concentration because the quantitative aptamer has a threshold value to capture VEGF. The working curve revealed that the response range of the sensor is 10 pg ml−1–1 μg ml−1 (VEGF concentration), as suggested by the correlation between Ret and the logarithm of the analyte concentration (Figure 4B) (y = 0.27x + 4.41, R2 = 0.99). The detection of limit (LOD) was acquired from 3SD corresponding to the 10 blank tests and calculated as 8.2 pg ml−1.
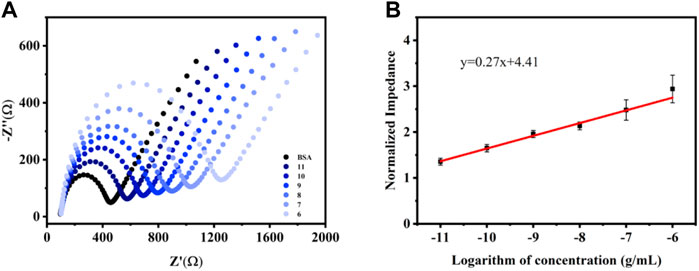
FIGURE 4. EIS responses (A) and the corresponding calibration plot of normalized impedance (B) vs. log VEGF in 0.1 M KCl solution containing 5.0 mM [Fe(CN)6]3−/4−. Error bars, SD, n = 3.
Specificity
In order to explore specificity, the self-assembled aptasensor was incubated in the presence of an interfering protein (negative control), that is, the interfering protein replaced VEGF as the captured target protein by setting the concentration of the interfering protein to be 10-fold of that of VEGF, analyzed by EIS. The normalized impedance change was selected as the standard of judgment. Although the normalized impedance change value of the interfering protein binding to the sensor surface was significantly increased, it was still far from the normalized impedance change value caused by the corresponding concentration of VEGF (Figure 5).
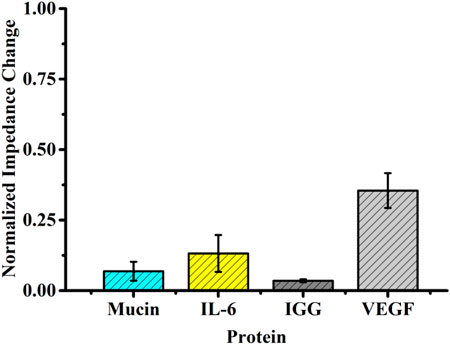
FIGURE 5. Selectivity evaluation of the developed method for detecting VEGF (10 pg ml−1) against other proteins (100 pg ml−1).
Application
In order to evaluate the application prospect of the aptasensor in detecting VEGF, referring to the previously established working graph, we used the aptasensor to detect 100 pg ml−1 VEGF in 1% fetal bovine serum, and its recovery was 106%–115%.
Patients with DR had high levels of VEGF in their tears, which were correlated with the severity of the DR. The concentration of VEGF in DR patients’ tears was 1048.8 ± 194.2 pg ml−1, according to our previous work (Mei et al., 2021). 10 μL of tear samples was collected and diluted 10 times as control to counteract background interference. In the experimental group, exogenous VEGF was added to 100 pg ml−1 in diluted tears. Recovery was calculated between 96% and 112%.
Conclusion
The electrochemical biosensors are mainly divided into aptasensor and immunosensor by recognition (Table 1). This method, based on the aptamer recognition and CME NPs as an electron exchange center and bridge between capture DNA and electrode, which was non-enzyme and without labels, does not involve complex primer design and detection of VEGF and range of 10 pg ml−1–1 μg ml−1. This method is simple, convenient to operate, economical, time-saving, and simple to implement. Moreover, it has a reference value for establishing detection methods for other proteins or target objects, including VEGF.
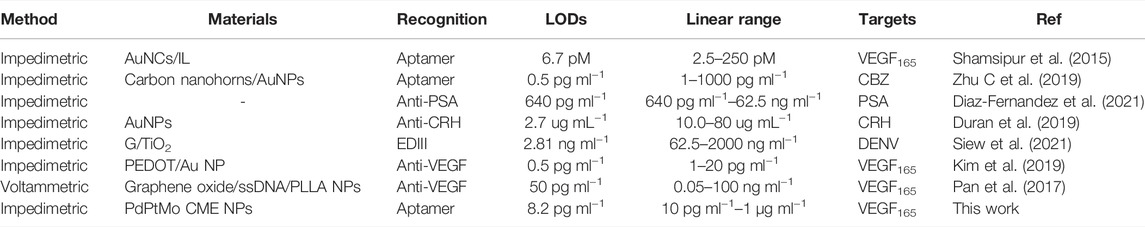
TABLE 1. Comparison of the electrochemical biosensors.
Data Availability Statement
The original contributions presented in the study are included in the article/Supplementary Material. Further inquiries can be directed to the corresponding authors.
Author Contributions
All authors conceptualized the study. CYM: conceptualization, investigation, visualization, and writing—original draft. YZ: investigation, data curation. LP: visualization, formal analysis. BD: data curation. QG: validation. HX: data curation. WX: formal analysis. HF: conceptualization. SL: validation. XC: visualization. CM: writing—review and editing. EP: writing—review and editing. QW: funding acquisition, supervision. MY: methodology, visualization, and writing—original draft. JH: conceptualization, funding acquisition, and supervision. A-YY: conceptualization, funding acquisition, and supervision.
Funding
This work was supported by the Medical and Health Science and Technology Program of Zhejiang Province (2020KY652); Zhejiang Provincial Natural Science Foundation of China under Grant LY21H120003; Zhejiang Provincial & Ministry of Health Research Fund for Medical Sciences (WKJ-ZJ-2134); Project of Shanghai Science and Technology (22S11900200); and EYE & ENT Hospital of Fudan University High-level Talents Program (2021318).
Conflict of Interest
The authors declare that the research was conducted in the absence of any commercial or financial relationships that could be construed as a potential conflict of interest.
Publisher’s Note
All claims expressed in this article are solely those of the authors and do not necessarily represent those of their affiliated organizations or those of the publisher, the editors, and the reviewers. Any product that may be evaluated in this article, or claim that may be made by its manufacturer, is not guaranteed or endorsed by the publisher.
Supplementary Material
The Supplementary Material for this article can be found online at: https://www.frontiersin.org/articles/10.3389/fbioe.2022.850412/full#supplementary-material
References
Bozal‐Palabiyik, B., Lettieri, M., Uslu, B., and Marrazza, G. (2019). Electrochemical Detection of Vascular Endothelial Growth Factor by Molecularly Imprinted Polymer. Electroanalysis 31 (8), 1458–1464. doi:10.1002/elan.201900185
Chattaraj, R., Mohan, P., Livingston, C. M., Besmer, J. D., Kumar, K., and Goodwin, A. P. (2016). Mutually-Reactive, Fluorogenic Hydrocyanine/Quinone Reporter Pairs for In-Solution Biosensing via Nanodroplet Association. ACS Appl. Mater. Inter. 8 (1), 802–808. doi:10.1021/acsami.5b10036
Cheng, W., Ding, S., Li, Q., Yu, T., Yin, Y., Ju, H., et al. (2012). A Simple Electrochemical Aptasensor for Ultrasensitive Protein Detection Using Cyclic Target-Induced Primer Extension. Biosens. Bioelectron. 36 (1), 12–17. doi:10.1016/j.bios.2012.03.032
Da, H., Liu, H., Zheng, Y., Yuan, R., and Chai, Y. (2018). A Highly Sensitive VEGF165 Photoelectrochemical Biosensor Fabricated by Assembly of Aptamer Bridged DNA Networks. Biosens. Bioelectron. 101, 213–218. doi:10.1016/j.bios.2017.10.032
Dang, W., Liu, H., Fan, J., Zhao, C., Long, Y., Tong, C., et al. (2019). Monitoring VEGF mRNA and Imaging in Living Cells In Vitro Using rGO-Based Dual Fluorescent Signal Amplification Platform. Talanta 205, 120092–120099. doi:10.1016/j.talanta.2019.06.092
Díaz-Fernández, A., Miranda-Castro, R., de-los-Santos-Álvarez, N., Lobo-Castañón, M. J., and Estrela, P. (2021). Impedimetric Aptamer-Based Glycan PSA Score for Discrimination of Prostate Cancer from Other Prostate Diseases. Biosens. Bioelectron. 175, 112872. doi:10.1016/j.bios.2020.112872
Duran, B. G., Castañeda, E., and Armijo, F. (2019). Development of an Electrochemical Impedimetric Immunosensor for Corticotropin Releasing Hormone (CRH) Using Half-Antibody Fragments as Elements of Biorecognition. Biosens. Bioelectron. 131, 171–177. doi:10.1016/j.bios.2019.02.017
Ferapontova, E. E. (2018). DNA Electrochemistry and Electrochemical Sensors for Nucleic Acids. Annu. Rev. Anal. Chem. 11 (1), 197–218. doi:10.1146/annurev-anchem-061417-125811
Gao, X., Niu, S., Ge, J., Luan, Q., and Jie, G. (2020). 3D DNA Nanosphere-Based Photoelectrochemical Biosensor Combined with Multiple Enzyme-free Amplification for Ultrasensitive Detection of Cancer Biomarkers. Biosens. Bioelectron. 147, 111778. doi:10.1016/j.bios.2019.111778
Hu, L., Liao, H., Feng, L., Wang, M., and Fu, W. (2018). Accelerating the Peroxidase-like Activity of Gold Nanoclusters at Neutral pH for Colorimetric Detection of Heparin and Heparinase Activity. Anal. Chem. 90 (10), 6247–6252. doi:10.1021/acs.analchem.8b00885
Ilgu, M., and Nilsen-Hamilton, M. (2016). Aptamers in Analytics. Analyst 141 (5), 1551–1568. doi:10.1039/c5an01824b
Jayasena, S. D. (1999). Aptamers: an Emerging Class of Molecules that Rival Antibodies in Diagnostics. Clin. Chem. 45 (9), 1628–1650. doi:10.1093/clinchem/45.9.1628
Jenison, R. D., Gill, S. C., Pardi, A., and Polisky, B. (1994). High-resolution Molecular Discrimination by RNA. Science 263 (5152), 1425–1429. doi:10.1126/science.7510417
Kim, M., Iezzi, R., Shim, B. S., and Martin, D. C. (2019). Impedimetric Biosensors for Detecting Vascular Endothelial Growth Factor (VEGF) Based on Poly(3,4-Ethylene Dioxythiophene) (PEDOT)/Gold Nanoparticle (Au NP) Composites. Front. Chem. 7, 234. doi:10.3389/fchem.2019.00234
Kumar, S., Bhushan, P., and Bhattacharya, S. (2017). Facile Synthesis of Au@Ag-Hemin Decorated Reduced Graphene Oxide Sheets: a Novel Peroxidase Mimetic for Ultrasensitive Colorimetric Detection of Hydrogen Peroxide and Glucose. RSC Adv. 7 (60), 37568–37577. doi:10.1039/C7RA06973A
Lange, C., Storkebaum, E., de Almodóvar, C. R., Dewerchin, M., and Carmeliet, P. (2016). Vascular Endothelial Growth Factor: a Neurovascular Target in Neurological Diseases. Nat. Rev. Neurol. 12 (8), 439–454. doi:10.1038/nrneurol.2016.88
Lima, H. R. S., da Silva, J. S., de Oliveira Farias, E. A., Teixeira, P. R. S., Eiras, C., and Nunes, L. C. C. (2018). Electrochemical Sensors and Biosensors for the Analysis of Antineoplastic Drugs. Biosens. Bioelectron. 108, 27–37. doi:10.1016/j.bios.2018.02.034
Long, X., Zhang, F., He, Y., Hou, S., Zhang, B., and Zou, G. (2018). Promising Anodic Electrochemiluminescence of Nontoxic Core/Shell CuInS2/ZnS Nanocrystals in Aqueous Medium and its Biosensing Potential. Anal. Chem. 90 (5), 3563–3569. doi:10.1021/acs.analchem.8b00006
Mahmoud, A. M., Alkahtani, S. A., Alyami, B. A., and El-Wekil, M. M. (2020). Dual-recognition Molecularly Imprinted Aptasensor Based on Gold Nanoparticles Decorated Carboxylated Carbon Nanotubes for Highly Selective and Sensitive Determination of Histamine in Different Matrices. Analytica Chim. Acta 1133, 58–65. doi:10.1016/j.aca.2020.08.001
Mahmudunnabi, R. G., Farhana, F. Z., Kashaninejad, N., Firoz, S. H., Shim, Y.-B., and Shiddiky, M. J. A. (2020). Nanozyme-based Electrochemical Biosensors for Disease Biomarker Detection. Analyst 145 (13), 4398–4420. doi:10.1039/d0an00558d
Mei, C., Pan, L., Xu, W., Xu, H., Zhang, Y., Li, Z., et al. (2021). An Ultrasensitive Reusable Aptasensor for Noninvasive Diabetic Retinopathy Diagnosis Target on Tear Biomarker. Sensors Actuat. B Chem. 345, 130398. doi:10.1016/j.snb.2021.130398
Mu, X., Wang, J., Li, Y., Xu, F., Long, W., Ouyang, L., et al. (2019). Redox Trimetallic Nanozyme with Neutral Environment Preference for Brain Injury. ACS Nano 13 (2), 1870–1884. doi:10.1021/acsnano.8b08045
Nandhakumar, P., Kim, G., Park, S., Kim, S., Kim, S., Park, J. K., et al. (2020). Metal Nanozyme with Ester Hydrolysis Activity in the Presence of Ammonia‐Borane and its Use in a Sensitive Immunosensor. Angew. Chem. Int. Ed. 59, 22419–22422. doi:10.1002/anie.202009737
Pan, L.-H., Kuo, S.-H., Lin, T.-Y., Lin, C.-W., Fang, P.-Y., and Yang, H.-W. (2017). An Electrochemical Biosensor to Simultaneously Detect VEGF and PSA for Early Prostate Cancer Diagnosis Based on Graphene oxide/ssDNA/PLLA Nanoparticles. Biosens. Bioelectron. 89 (Pt 1), 598–605. doi:10.1016/j.bios.2016.01.077
Roushani, M., Sarabaegi, M., and Pourahmad, F. (2019). Impedimetric Aptasensor for Pseudomonas aeruginosa by Using a Glassy Carbon Electrode Modified with Silver Nanoparticles. Microchim Acta 186 (11), 725. doi:10.1007/s00604-019-3858-y
Shamsipur, M., Farzin, L., Amouzadeh Tabrizi, M., and Molaabasi, F. (2015). Highly Sensitive Label Free Electrochemical Detection of VGEF165 Tumor Marker Based on "signal off" and "signal on" Strategies Using an Anti-vegf165 Aptamer Immobilized BSA-Gold Nanoclusters/ionic Liquid/glassy Carbon Electrode. Biosens. Bioelectron. 74, 369–375. doi:10.1016/j.bios.2015.06.079
Siew, Q. Y., Pang, E. L., Loh, H.-S., and Tan, M. T. T. (2021). Highly Sensitive and Specific graphene/TiO2 Impedimetric Immunosensor Based on Plant-Derived Tetravalent Envelope Glycoprotein Domain III (EDIII) Probe Antigen for Dengue Diagnosis. Biosens. Bioelectron. 176, 112895. doi:10.1016/j.bios.2020.112895
Stepanova, V., Smolko, V., Gorbatchuk, V., Stoikov, I., Evtugyn, G., and Hianik, T. (2019). DNA-polylactide Modified Biosensor for Electrochemical Determination of the DNA-Drugs and Aptamer-Aflatoxin M1 Interactions. Sensors 19 (22), 4962. doi:10.3390/s19224962
Wang, X., Gao, F., Gong, Y., Liu, G., Zhang, Y., and Ding, C. (2019). Electrochemical Aptasensor Based on Conductive Supramolecular Polymer Hydrogels for Thrombin Detection with High Selectivity. Talanta 205, 120140. doi:10.1016/j.talanta.2019.120140
Yao, J., Cheng, Y., Zhou, M., Zhao, S., Lin, S., Wang, X., et al. (2018). ROS Scavenging Mn3O4nanozymes Forin Vivoanti-Inflammation. Chem. Sci. 9 (11), 2927–2933. doi:10.1039/c7sc05476a
Zhang, G., Liu, Z., Fan, L., Han, Y., and Guo, Y. (2021). A Novel Dual Signal and Label-free Electrochemical Aptasensor for Mucin 1 Based on hemin/graphene@PdPtNPs. Biosens. Bioelectron. 173, 112785. doi:10.1016/j.bios.2020.112785
Zhang, H., Peng, L., Li, M., Ma, J., Qi, S., Chen, H., et al. (2017). A Label-free Colorimetric Biosensor for Sensitive Detection of Vascular Endothelial Growth Factor-165. Analyst 142 (13), 2419–2425. doi:10.1039/c7an00541e
Zhao, Y., and Singh, R. P. (2018). The Role of Anti-vascular Endothelial Growth Factor (Anti-VEGF) in the Management of Proliferative Diabetic Retinopathy. Dic 7, 1–10. doi:10.7573/dic.212532
Zhu, C., Liu, D., Chen, Z., Li, L., and You, T. (2019). An Ultra-sensitive Aptasensor Based on Carbon Nanohorns/gold Nanoparticles Composites for Impedimetric Detection of Carbendazim at Picogram Levels. J. Colloid Interf. Sci. 546, 92–100. doi:10.1016/j.jcis.2019.03.035
Zhu, J., Peng, X., Nie, W., Wang, Y., Gao, J., Wen, W., et al. (2019). Hollow Copper Sulfide Nanocubes as Multifunctional Nanozymes for Colorimetric Detection of Dopamine and Electrochemical Detection of Glucose. Biosens. Bioelectron. 141, 111450. doi:10.1016/j.bios.2019.111450
Keywords: electrochemical aptasensor, vascular endothelial growth factor, one-step, signal amplification, metallo nanoenzyme particles
Citation: Mei C, Zhang Y, Pan L, Dong B, Chen X, Gao Q, Xu H, Xu W, Fang H, Liu S, McAlinden C, Paschalis EI, Wang Q, Yang M, Huang J and Yu A-Y (2022) A One-Step Electrochemical Aptasensor Based on Signal Amplification of Metallo Nanoenzyme Particles for Vascular Endothelial Growth Factor. Front. Bioeng. Biotechnol. 10:850412. doi: 10.3389/fbioe.2022.850412
Received: 07 January 2022; Accepted: 21 March 2022;
Published: 09 May 2022.
Edited by:
Chengzhou Zhu, Central China Normal University, ChinaReviewed by:
Guangyao Zhang, Qingdao University, ChinaXin Luo, Hubei University of Technology, China
Chuanxia Chen, University of Jinan, China
Copyright © 2022 Mei, Zhang, Pan, Dong, Chen, Gao, Xu, Xu, Fang, Liu, McAlinden, Paschalis, Wang, Yang, Huang and Yu. This is an open-access article distributed under the terms of the Creative Commons Attribution License (CC BY). The use, distribution or reproduction in other forums is permitted, provided the original author(s) and the copyright owner(s) are credited and that the original publication in this journal is cited, in accordance with accepted academic practice. No use, distribution or reproduction is permitted which does not comply with these terms.
*Correspondence: Mei Yang, meiyang112686@wmu.edu.cn; Jinhai Huang, vip999vip@163.com; A-Yong Yu, yaybetter@hotmail.com
†These authors have contributed equally to this work