 Adam Hatzikyriakou
 Ning Lin
- Department of Civil and Environmental Engineering, Princeton University, Princeton, NJ, United States
With 6.5 million households in the United States located in areas prone to storm surge, assessing the vulnerability of structures and residential communities to coastal flooding is an important concern. Of particular interest is understanding how the performance of structures during surge events is influenced by flood conditions, coastal defenses, and building design at both the house and community level. This study presents such a vulnerability analysis by investigating the impact of coastal flooding from Hurricane Sandy (2012) on 95 km of developed coastline across New Jersey and New York. Exterior structural damage observed from a Federal Emergency Management Agency (FEMA) aerial survey of the study area is related to (1) a hindcast simulation of flood inundation and wave action, (2) a classification of coastal defenses and storm-induced erosion, and (3) minimum building design elevations specified in FEMA’s flood hazard mapping. Findings indicate that the hardest hit communities experienced significant dune erosion, which coincided with severe flood and wave exposure. Furthermore, structures were considerably more susceptible to flood impact if Sandy’s flood level exceeded FEMA’s 100-year Base Flood Elevation dictating building design. These results are quantified by developing fragility curves relating both house and community-level performance to the considered vulnerability parameters. Findings from this study can be used to inform decision making for improving coastal resilience.
Introduction
Nearly 6,000 km of coastline in the United States is prone to coastal flooding due to storm surge (Botts et al., 2015). Recent surge events such as Hurricane Sandy (2012), which damaged or destroyed over 650,000 structures (Blake et al., 2013), highlight the significant vulnerability of many susceptible coastal communities. With the adverse effects of sea-level rise and climate change expected to further increase the potential for flooding in the future (Lin et al., 2016), better understanding the impact of storm surge on coastal structures is a critical concern.
Structural vulnerability to storm surge has traditionally been studied by considering the performance of individual structures during flood events. This has largely relied on the use of empirically estimated depth–damage curves relating the water level relative to a structure’s lowest horizontal member to its expected loss in economic value (Nadal et al., 2010). Examples of depth–damage curves for a wide variety of building types include those developed by the United States Army Corps of Engineers following Hurricane Sandy (USACE, 2015). Although relative inundation and economic losses are key aspects of vulnerability, recent events such as Hurricane Sandy have also led to greater interest in dynamic flood effects and physical damage to coastal structures. Initial steps in these directions include considering wave action as a damage predictor (Hatzikyriakou and Lin, 2017; Tomiczek et al., 2017) and assessing the performance of structural components such as foundations and building envelopes (Hatzikyriakou et al., 2015). Dynamic effects such as flood velocity and hydrodynamic forces have also been considered in recent tsunami studies, such as of the 2004 Indian Ocean tsunami in Thailand (Suppasri et al., 2011).
In addition to studying the performance of individual structures, in many cases an important concern is the performance of aggregate units such as administrative jurisdictions or land use categories (Merz et al., 2010). Broadening the treatment of the flood vulnerability in such a way can provide greater insight into the spatial extent of vulnerability, the social impact of coastal flooding and the potential for intangible losses such as business disruptions (Messner and Meyer, 2006). As a basis for doing so, macroscale studies are typically implemented by upscaling damage estimates for individual assets over an aggregate unit of interest (Scawthorn et al., 2006; De Moel et al., 2015). While this approach is useful for estimating the magnitude of flood impact, however, upscaling inevitably provides limited insight into the large-scale factors underlying flood vulnerability. The devastating impact of Hurricane Sandy’s surge on structures has highlighted the importance of two coastal community attributes in particular. The first is the integrity of coastal defenses such as dunes whose erosion can have profound effects on the overall performance of residential communities (Sopkin et al., 2014). The second is a community’s risk mitigation policy specified by the Base Flood Elevations (BFE) in its Flood Insurance Rate Map (FIRM), which dictate the minimum elevation of structures above the ground (FEMA, 2013).
Considering the effect of flood conditions, coastal defenses and building design on structural performance at both the house and community level is an important step toward better understanding flood vulnerability. Existing studies of the physical impact of storm surge on structures, however, have been limited in scope by the complexity of coastal flooding and the inevitable difficulties of data acquisition. As a result, previous studies of coastal vulnerability have typically relied on qualitative post-event surveys of structures with a particular emphasis on the Gulf Coast region (e.g., Eamon et al., 2007; Robertson et al., 2007). The extensive documentation of coastal flooding and building damage from Hurricane Sandy along the Atlantic coast, however, has motivated more comprehensive vulnerability flood studies. Several studies, for example, have analyzed in detail the impact of flood exposure, dune erosion and house composition in Ortley Beach, NJ, one of the hardest hit communities by Sandy’s surge (Hatzikyriakou et al., 2015; Xian et al., 2015; Hatzikyriakou and Lin, 2017). Despite this progress, however, a framework for relating flood conditions, coastal defenses and building design to structural performance at both the house and community level has yet to be developed.
We present such a vulnerability analysis in this study by investigating the impact of storm surge from Hurricane Sandy along 95 km of developed coastline across New Jersey and the southern shore of Long Island, New York. To do so, the analysis divides the study area into 200 m increments (“communities”) and relates observed exterior structural damage from a Federal Emergency Management Agency (FEMA) aerial survey to (1) a hindcast simulation of flood inundation and wave action, (2) a classification of coastal defenses and storm-induced erosion, and (3) minimum building design elevations specified in FEMA’s flood hazard mapping. Data collected from the study area are used to develop fragility curves relating both the individual and aggregate performance of structures in the communities to the vulnerability parameters (i.e., flood conditions, dune erosion, and BFEs). As such, this vulnerability analysis provides important insight into the factors underlying flood vulnerability and a comprehensive overview of Hurricane Sandy’s impact on residential communities. Findings from the study can be used as a basis for recommending substantive risk mitigation measures for improving coastal resilience.
We begin in Section “Hurricane Sandy” by summarizing the impact of storm surge from Hurricane Sandy on coastal structures and discussing the importance of the vulnerability parameters noted above. Section “Method” presents methods for estimating the damage and vulnerability parameters over the study area. Section “Results” presents the results from the vulnerability analysis and uses fragility curves to quantify house and community-level performance. Section “Discussion” discusses the implications of these findings on coastal resilience and proposes directions for future research. Finally, Section “Conclusion” concludes by summarizing the main findings of the study.
Hurricane Sandy
Causing 72 fatalities, Hurricane Sandy significantly impacted coastal communities across New Jersey and New York with a devastating storm surge. Although a characteristic tropical cyclone over most of its lifetime, Sandy underwent a complex evolution while moving into higher latitudes. Encountering a low-pressure trough following its landfall in Cuba, Sandy transitioned into an extratropical storm as it began to draw baroclinic energy from the ventilation of cold air into its warm core. This change was marked by a dramatic increase in size as Sandy ballooned to over 1,100 statute miles in diameter over the course of several days (Halverson and Rabenhorst, 2013). Moving further northward, Sandy next encountered an area of high pressure over Greenland which began to steer the storm westward into the United States (Mattingly et al., 2014). Sandy made its final landfall near Brigantine, New Jersey on October 29, 2012 as a fully post-tropical cyclone.
These unique meteorological events, compounded with landfall during a spring high tide and the funnel-like shape of New York Bay, resulted in unprecedented storm surge across New Jersey and New York. At the Battery in New York City, for example, a storm surge of 2.8 m was measured, estimated as a 400-year event (Lin et al., 2016). In general, the magnitude of storm surge coincided with proximity to New York Bay, with communities in northern New Jersey and southwestern Long Island experiencing the highest surge levels. Storm surge in these areas was likewise accompanied by significant wave action, noted as the primary damage mechanism for low-rise oceanfront structures (Blake et al., 2013; FEMA, 2013). In contrast to Sandy’s significant surge, maximum sustained wind speeds of only 80 mph (130 km/h) or less were measured at landfall. As a result, Sandy was not a design-wind event and minimal wind-related damage to structures was observed (FEMA, 2013).
Flooding due to Sandy’s surge had devastating effects on coastal infrastructure with significant disruptions to transportation networks, power outages to 8.5 million customers and total losses exceeding $70 billion (Russ, 2012; Blake et al., 2013). Coastal residential communities across Monmouth and Ocean counties in New Jersey were especially hard hit, accounting for a large portion of the 61,000 displaced families and 22,000 uninhabitable housing units in the state (Venetis, 2014). In New York, 305,000 homes were either damaged or destroyed by Sandy’s surge (Russ, 2012). Communities on Fire Island located on the southern coast of Long Island were among the hardest hit in New York, with many homes in the area completely washed away from their foundations (Blake et al., 2013).
The considerable variation in the performance of communities, even among those most exposed to storm surge, points to additional factors contributing to community vulnerability. Coastal defenses were noted as a particularly important community feature. While engineered defenses such as seawalls, bulkheads, and revetments were in general observed to maintain their function, the performance of dunes was highly variable (Sopkin et al., 2014). Significant dune erosion was a common characteristic among most of the hardest hit communities. In New Jersey, the worst erosion occurred in Barnegat Peninsula, a barrier island located in Ocean County. Erosion was so severe in the community of Mantoloking that Sandy’s surge breached the barrier island altogether (FEMA, 2013). In New York, impacted communities across Coney Island, Rockaway Peninsula, and Long Beach Island saw an average vertical dune erosion of 1.4 m (Sopkin et al., 2014).
In addition to coastal defenses, aspects of the built environment itself also influenced community performance. Among the most important characteristics was the elevation of buildings above the ground, which is a key factor controlling the flood loads on structures. Buildings whose lowest horizontal member was below Sandy’s flood level were repeatedly observed to suffer from either water intrusion or substantial structural damage (FEMA, 2013). The minimum design elevation for coastal structures is reflected by the 100-year flood return level [known as the BFE] specified by an FEMA’s FIRM. As result, the water level relative to a community’s BFE was noted as a key indicator of structural vulnerability in post-event surveys of Sandy’s impact (FEMA, 2013).
The impact of flood exposure, coastal defenses, and building design on structural performance was particularly evident in the coastal community of Ortley Beach, NJ. Located on low-lying Barnegat Peninsula (Figure 1 inset), the community’s dune experienced significant erosion during Sandy and decreased by nearly 3 m in elevation (FEMA, 2013). This increased exposure to storm surge resulted in significant inland flooding characterized by high water levels and devastating wave action (Hatzikyriakou and Lin, 2017). These flood conditions significantly exceeded the design capacity of structures in Ortley Beach since buildings were not substantially elevated above the ground (Hatzikyriakou et al., 2015). This vulnerable building stock reflected the BFEs delineated in the community’s FIRM, which were either at or near ground level or not specified at all. The combination of these factors resulted in devastating damage to structures, with the average financial support provided to homeowners in the Ortley Beach ($24,672) through FEMA’s Individual Assistance Program ranking fourth highest among zip codes in New Jersey (O’Dea, 2013).
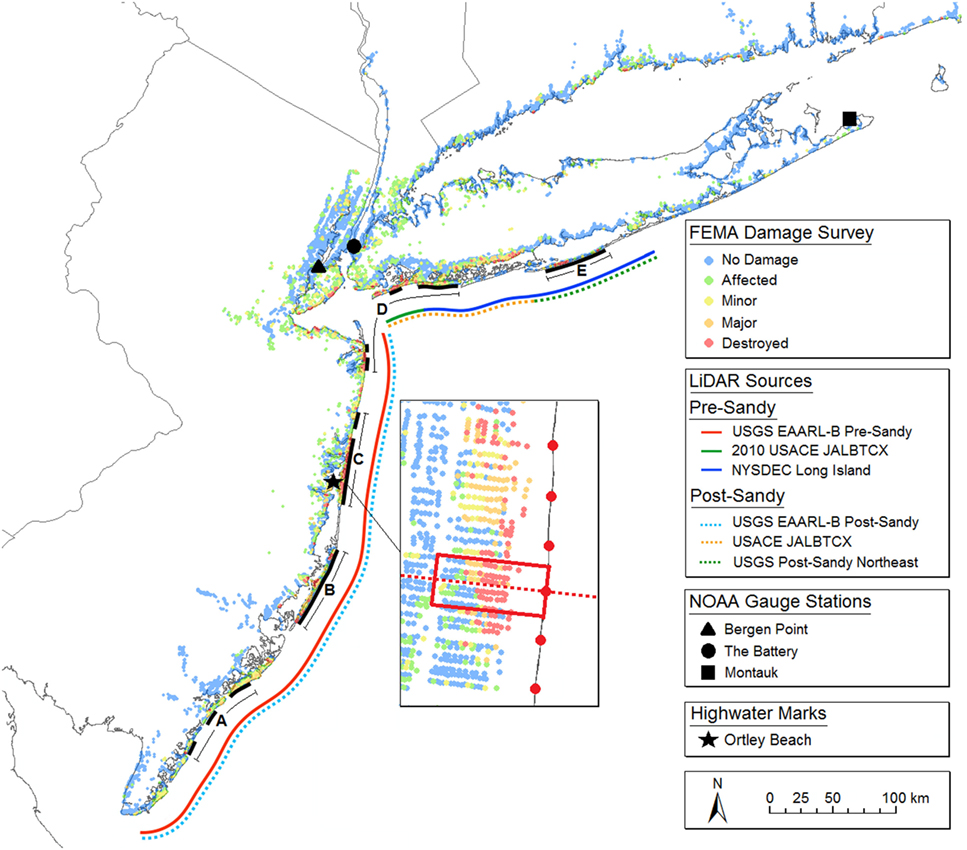
Figure 1. Federal Emergency Management Agency (FEMA) aerial damage survey of New York and New Jersey. Portions (A–E) of coastline considered in the study are outlined in black. The subfigure shows the results of the FEMA survey for Ortley Beach, NJ and an example of the 200 m × 300 m discretization and one-dimensional transect used in the study. (Red circles in the subfigure represent the center points of the 200 m discretization of the coast.) Black triangle, circle, and square markers show the location of NOAA gages at Bergen Point, the Battery, and Montauk, NY. The black star marker shows the location of surveyed highwater marks in Ortley Beach, NJ.
The impact of flooding in Ortley Beach was documented immediately following Hurricane Sandy by a team from Princeton University and the University of Notre Dame (Hatzikyriakou et al., 2015). To assess building performance in the community, Xian et al. (2015) estimated a loss ratio for each surveyed structure defined as the percent loss in a building’s replacement value. To do so, Xian et al. (2015) used photographs collected during the survey to first assess physical damage to critical structural components such as foundations, exteriors siding and walls. These assessments were then combined with the estimated replacement cost of components based on the RS Means (2013) online database to compute the decrease in building value. Due to no access to the inside of buildings, losses to interior components (e.g., drywall, mechanical equipment, etc.) and the contents of structures (e.g., furniture, appliances, etc.) were not considered. Figure 2A shows a plan view of Ortley Beach with each polygon representing the footprint of a surveyed building shaded according to its loss ratio.
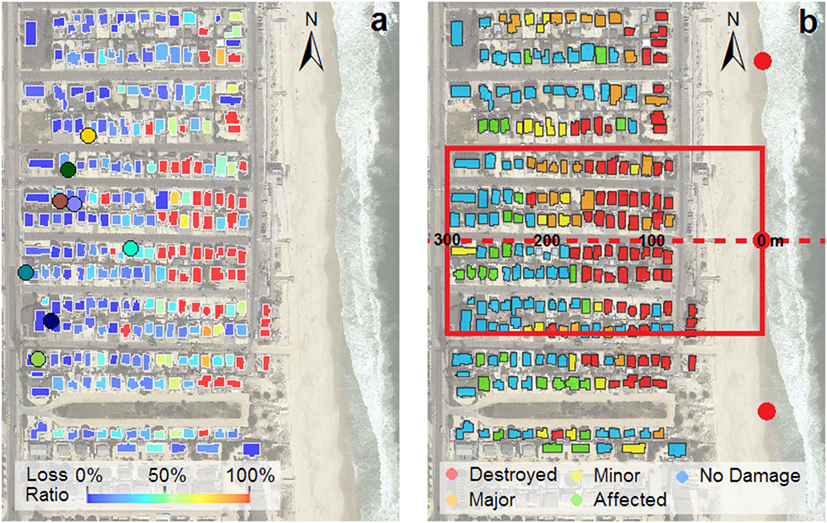
Figure 2. Plan view of Ortley Beach, NJ with polygons representing surveyed structures colored based on their (A) estimated loss ratio from Xian et al. (2015) and (B) damage state from Federal Emergency Management Agency aerial survey. Colored circles in panel (A) represent the location of observed highwater marks. Panel (B) shows an example of the 200 m × 300 m discretization and one-dimensional transect used for data collection. Red circles in panel (B) represent the center points of the 200 m discretization of the coast. Distance markers along the transect in panel (B) are consistent with those shown in Figures 5 and 6. [Panel (A) is reproduced from Hatzikyriakou and Lin (2017).]
Method
Motivated by observations from Sandy, a framework for relating structural performance to flood conditions, coastal defenses, and building design at both the house and community level is presented next. To do so, a study area covering 95 km of coastline and 22,954 structures in New Jersey and New York is first defined. This study area covers coastline comprised predominantly of single and two story light-frame residential structures roughly consistent in terms of building layout and density. Locations with large shoreline obstructions such as high-rise buildings, which may have significantly influenced flooding, are excluded from the analysis. The spatial extent of the study area is shown as a solid black line divided into five regions in Figure 1.
As the basis for extracting information, the study area is discretized into “communities” with along-shore and cross-shore dimensions of 200 m × 300 m and with a one-dimensional transect centered at their midpoint (e.g., Figure 1 inset). The location of a community’s shoreline is defined as the mean high water elevation contour (Weber et al., 2005). The dimensions for discretization were chosen after experimentation to maximize information about vulnerability. The along-shoreline distance is chosen small enough to provide localized information while large enough such that coastal changes such as dune erosion are independent across segments. The cross-shore distance is a balance between including as many structures directly impacted by storm surge as possible while excluding typically undamaged structures farther inland which tend to bias results.
The following subsections detail methods describing structural performance (see Community Impact), hindcasting flood inundation and wave action (see Flood Modeling), classifying coastal defenses and assessing dune erosion (see Coastal Defenses), and estimating the flood level relative to FEMA’s 100-year BFEs (see Base Flood Elevation). The procedure for obtaining these pieces of information for the study area is illustrated and evaluated by comparison with the detailed survey of Ortley Beach noted earlier. The section concludes by presenting a cumulative logit model and a fractional logit model for statistically relating the vulnerability parameters to structural performance at both the house and community level (see Quantitative Vulnerability Analysis).
Community Impact
The impact of flooding to communities in the study area is investigated by using a large-scale aerial survey of 270,000 structures in New Jersey and New York conducted by FEMA’s Modeling Task Force (FEMA, 2012). The survey classified the exterior structural performance of buildings in the region (denoted as Yhouse) into five ordinal states (0—no damage, 1—affected, 2—minor damage, 3—major damage, and 4—destroyed) based on visible damage to each structure’s foundation, exterior walls, and envelope. The criteria used for classification in the FEMA survey along with the number of observations for each damage state in the study area are shown in Table 1. Assessed building damage from the aerial survey for New Jersey and New York is shown in Figure 1 and for Ortley Beach in Figure 2B.
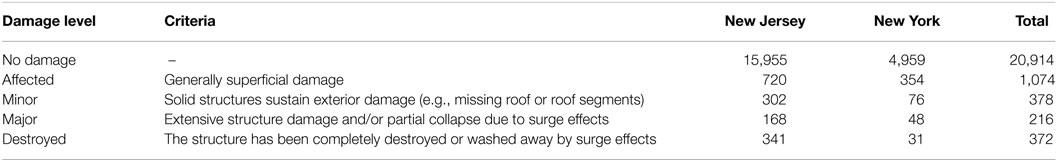
Table 1. Damage assessment criteria used in Federal Emergency Management Agency aerial imagery survey [reproduced from FEMA (2012)] and the number of observations for each damage state in the study area.
The FEMA damage survey is evaluated by comparison with assessed building value loss in Ortley Beach estimated by Xian et al. (2015). The two assessments shown in Figure 2 show good agreement for the spatial variation of damage across the community. In particular, flood impact in the community was closely related to a building’s distance from the coast, with nearshore structures heavily damaged and buildings further inland less affected. A potential discrepancy between the two surveys is the assessment of damage features in the detailed ground-based survey not visible to the aerial FEMA survey. Despite this limitation, however, the FEMA survey provides a reasonable assessment of the large-scale impact of Sandy’s surge on coastal structures.
In addition to the performance of individual structures (denoted as Yhouse), aggregate building performance for each discretized community (denoted as Ycom) is defined as the percentage of structures in a community classified as “destroyed,” “major damage,” or “minor damage.” Based on the assessment criteria used in the aerial survey (Table 1), these states correspond to flood damage to structural components such as foundations, framing, and exterior siding. As a result, Ycom can be roughly interpreted as the percentage of structures in a community with at least some degree of structural damage during Hurricane Sandy.
Flood Modeling
Flood conditions experienced by structures during Sandy are hindcasted using a two-tier modeling framework. The first tier applies the coupled ADvanced CIRCulation and Simulating WAves Nearshore models (ADCIRC + SWAN; Dietrich et al., 2011) to simulate surge/wave evolution over the Atlantic basin from 6 days before 1 day after Sandy’s landfall. The second tier takes outputs from the ADCIRC + SWAN model to simulate inland flooding using a one-dimensional phase-resolving Boussinesq surf zone model (BOUSS1D; Demirbilek et al., 2009).
In addition to being applied to study flood risk in the Hawaii islands (Kennedy et al., 2012), this two-tier modeling framework has also been used to simulate coastal flooding associated with Hurricane Sandy. Specifically, Hatzikyriakou and Lin (2017) coupled a hindcast simulation of Sandy’s surge using ADCIRC + SWAN with BOUSS1D to model flood inundation and wave propagation in Ortley Beach. This study extends the application of BOUSS1D to simulate flood conditions across the study area indicated in the Figure 1. The following subsections briefly summarize the two-tier modeling framework and its use in this study for analyzing structural vulnerability.
ADCIRC + SWAN
The coupled ADCIRC and SWAN models use a hurricane’s wind and pressure field as forcing to simulate the associated surge and wave conditions on an unstructured finite element mesh (Dietrich et al., 2011). Wind and pressure fields for historic hurricanes can be defined parametrically using a storm’s center location, maximum wind speed, minimum central pressure and radius of maximum wind recorded at 6 h intervals in the Extended Best Track database (Demuth et al., 2006; updated). Using a storm’s wind and pressure field, ADCIRC computes the water level and current at each grid point by solving the shallow water and momentum equations (Luettich et al., 1992). Wave propagation is modeled at each time step using SWAN by solving the wave action balance equation (Booij et al., 1999). Since resolving individual waves over large domains is not computationally feasible, waves in SWAN are phase averaged so as to only compute wave statistics rather than the actual sea surface at each time step. ADCIRC + SWAN has been extensively evaluated with observed storm surge conditions from previous cyclones including Hurricanes Katrina (2005) and Ike (2008) (Dietrich et al., 2012). A recent application of ADCIRC + SWAN includes a study of urban flooding in New York City during Hurricane Sandy (Yin et al., 2016).
BOUSS1D
Since both ADCIRC and SWAN are large-scale hydrodynamic models intended to simulate storm surge evolution over an entire basin, resolving meter-length coastal features such as dune profiles over the large study area is not feasible. Furthermore, the phase averaging of waves in SWAN can underestimate inland flood conditions since individual waves in a wave group can penetrate significantly further inland (Kennedy et al., 2012). To overcome these shortcomings, a simplified one-dimensional Boussinesq phase-resolving model (BOUSS1D; Demirbilek et al., 2009) is used in this study. This surf zone model is capable of modeling wave runup (i.e., uprush of water on a slope following wave breaking), wave overtopping (i.e., the rate of runup over the crest of a beach), and inland flooding conditions. Among recent applications of BOUSS1D, Taflanidis et al. (2013) used the model’s efficiency to presimulate flooding for a large parameter space of hurricane characteristics and develop surrogate models for rapid flood prediction during an event.
Hindcast Simulation
ADCIRC + SWAN is used to simulate Sandy’s surge across the study area following an approach similar to that used by Yin et al. (2016). The coupled models are run on a computational mesh developed by the Region II FEMA office with a ~100 m resolution near the coast and ~50 km resolution over the deep ocean (FEMA, 2014). The hindcast simulation is driven by surface wind, sea-level pressure and tidal forcing. The surface wind and pressure at each grid point is determined using storm characteristics obtained from the Extended Best Track database (Demuth et al., 2006; updated). Specifically, sea-level pressure is determined from a simple parametric model (Holland, 1980), and surface wind is estimated by fitting a symmetrical hurricane wind profile (Chavas et al., 2015) adjusted by a fraction of the storm translation velocity to account for the asymmetry induced by surface background winds (Lin and Chavas, 2012).
The hindcast of Sandy’s surge using ADCIRC + SWAN is evaluated by comparing simulated storm tide above mean sea level to the observed water level at NOAA gage stations located in Bergen Point, the Battery, and Montauk, NY (Figure 3). The hindcast shows good agreement with the observed maximum storm tide level, which was likely the most significant factor affecting inland flooding. The slight underestimation of tidal peaks before and after the maximum storm tide is likely a result of the simple parametric treatment of Sandy’s wind profile which did not consider the storm’s extratropical characteristics.
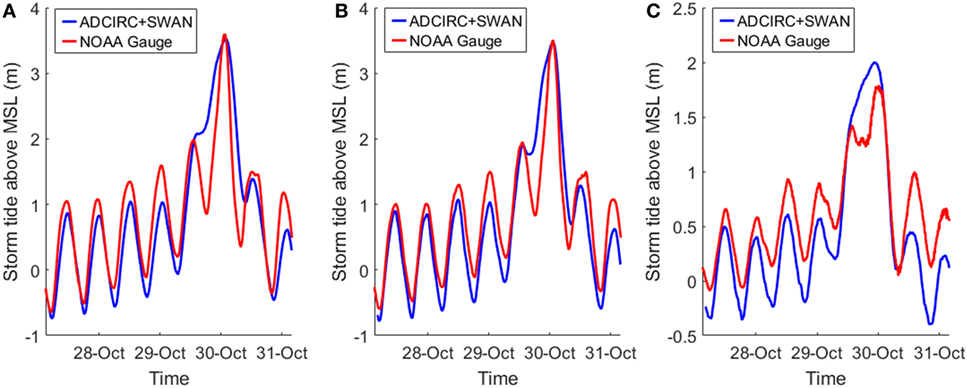
Figure 3. Comparison of ADCIRC + SWAN simulated storm tide above mean sea level (m) and observed water levels at NOAA gage stations located at (A) Bergen Point, NY, (B) the Battery, NY, and (C) Montauk, NY. The locations of the gages are, respectively, shown as triangle, circle, and square markers in Figure 1.
BOUSS1D is implemented using a one-dimensional cross-shore transect for each discretized community (e.g., the dashed line in Figure 2B) originating a kilometer off the coast and with a 2 m grid spacing. Bathymetric elevation along each transect is extracted from NOAA’s Hurricane Sandy 1/9 arc-second Digital Elevation Model. Topographic elevation is extracted from multiple LiDAR surveys conducted immediately following Hurricane Sandy (discussed in greater detail in Section “Coastal Defenses”). The post-Sandy elevation is used to incorporate the impact of dune erosion on the flooding. Due to the numerical complexity of modeling the effects of buildings, a bare-earth topography is used. Although this simplification does not consider the potential dampening of waves due to flood obstructions, it nevertheless provides an informative and numerically feasible means of simulating flooding. Hydrodynamic forcing for each transect is specified at its origin using the parametric Joint North Sea Wave Project wave spectrum (Hasselmann et al., 1973). The wave spectrum is defined using the peak surge level, significant wave height and maximum wave period at the transect origin estimated from the ADCIRC + SWAN simulation. BOUSS1D is run during the half hour of peak storm tide and requires an approximately 2 min runtime on a desktop. At the end of the simulation, a time series of inundation at any point along the transect can be extracted. A zero-down crossing analysis of the inundation time series can then be used to determine wave heights over the simulation time (Forristall, 1978).
The BOUSS1D hindcast is evaluated using highwater marks collected during the survey of Ortley Beach (Hatzikyriakou and Lin, 2017). Highwater marks consist of debris lines or water stains on stationary objects indicating the maximum water level during a flood. Figure 4 shows the comparison of highwater mark heights above ground level to the maximum simulated water elevation above ground level for each observation. The color of the data points corresponds to the colored markers in Figure 2A indicating the location of the highwater marks in Ortley Beach. The comparison shows a relatively good agreement considering the complexity of community flooding, with an R2 of 0.4.
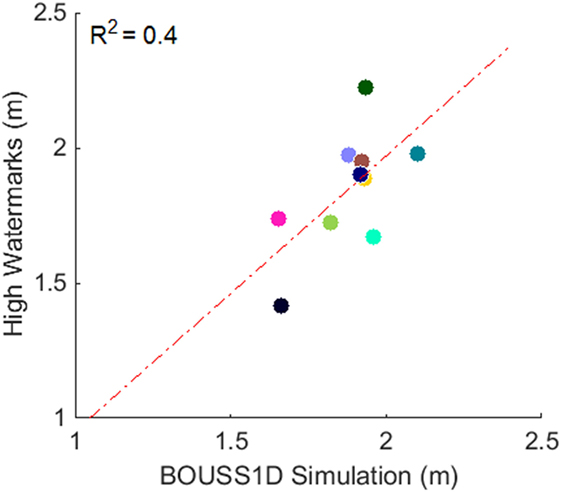
Figure 4. Comparison of surveyed high watermark elevation above the ground and BOUSS1D simulated inundation for Ortley Beach. Note that the color of points corresponds to the colored markers in Figure 2A. Two watermarks—colored pink and black—are located beyond the extent of Figure 2A. [This figure is reproduced from Hatzikyriakou and Lin (2017).]
Figures 5A,B show the simulated flood inundation and wave action along the transect indicated in Figure 2B. Specifically, Figure 5A shows the maximum (dmax), 75th percentile (d75%), mean (dmean), 25th percentile (d25%), and minimum (dmin) inundation depth above ground level. Figure 5B shows the maximum wave height (Hmax), average of the highest third of waves (known as the significant wave height, Hsig), mean wave height (Hmean), average of the highest tenth of waves (H1/10), and minimum wave height (Hmin). These results highlight the significant impact of storm surge in Ortley Beach during Sandy. In particular, structures in the community experienced a maximum inundation of around 2 m and a significant wave height (the most common metric of wave action) of around 0.25–1 m.
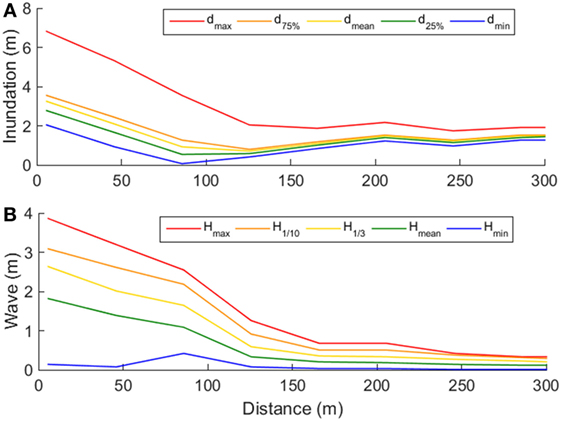
Figure 5. Metrics of (A) simulated flood inundation above ground level and (B) wave action along a transect in Ortley Beach shown in Figure 2B.
The exposure of each building in the study area to flood inundation and wave action is defined as the maximum inundation (dhouse) and significant wave height (hhouse) of its projection onto its community’s transect. Community exposure to these hazard parameters is computed as the average maximum inundation (dcom) and average significant wave height (hcom) of the structures in a community.
Coastal Defenses
Coastal defenses in the study area are classified using oblique aerial photography taken by the USGS of the New Jersey and New York coastlines (USGS, 2012). The defenses used by the communities fall into two general categories. The first and most common shoreline protection is vegetated frontal dunes. The second defense is seawalls typically in the form of sheetpile barriers or stone walls.
With dune erosion noted as a frequent cause of severe community flooding, dune performance in the study area is assessed by comparing the elevation of dunes immediately before and after Sandy. Pre- and post-Sandy dune profiles are determined using multiple airborne Light Detection and Ranging (LiDAR) surveys of coastal New Jersey and New York. Airborne LiDAR systems consist of pulse emitting devices mounted on airplanes capable of producing dense spatial point clouds of ground elevation. The spatial extent of the LiDAR surveys used is shown in Figure 1. The average point spacing and collection date for each survey is summarized in Table 2.
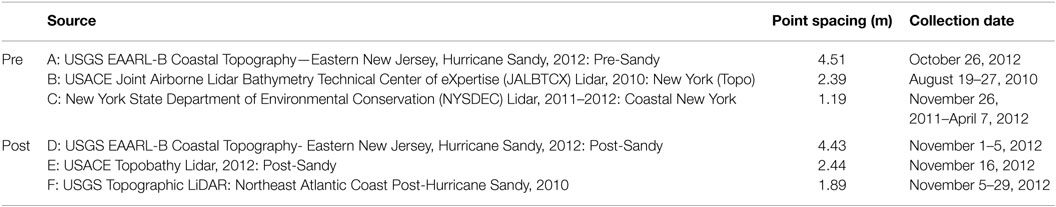
Table 2. Average point spacing and collection date of pre- and post-Sandy LiDAR ground elevation surveys.
Dune profiles before and after Sandy are determined by converting the LiDAR point data into rasters with a 1.5 m cell size and then extracting ground elevation along each discretized community’s transect. Figure 6 shows a pair of dune profiles in Ortley Beach along the transect indicated in Figure 2B. Dune performance during Sandy is quantified by first determining the maximum dune height above NAVD88 before and after Sandy and then computing the percent change in dune elevation . In the case of the transect in Ortley Beach shown in Figure 6, the community’s dune decreased by 3.1 m or 52% of its original height. This significant erosion was the underlying cause of the significant exposure to both flood inundation and wave action along the transect noted in Section “Hindcast Simulation.”
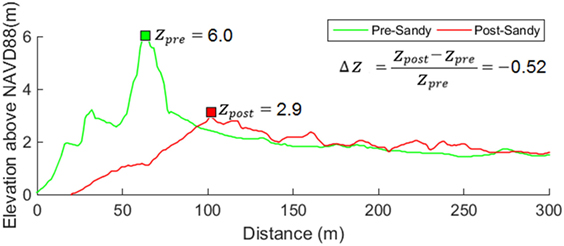
Figure 6. Ground elevation above NAVD88 along a transect in Ortley Beach (Figure 2B) before (green) and after (red) Hurricane Sandy.
Base Flood Elevation
The exceedance of flood inundation above the lowest horizontal member of coastal structures can significantly contribute to flood vulnerability (FEMA, 2011). Consistent with findings from previous surge events, the elevation of structures relative to Sandy’s flood level was noted as common indictor of flood damage during Hurricane Sandy (FEMA, 2013). House elevations for buildings in close proximity to the coast are largely determined by FEMA’s 100-year BFEs, which are delineated by flood zones specified in a community’s FIRM. A flood zone’s BFE represents the minimum design elevation for all new construction and for rebuilt structures where the cost of improvement is more than 50% a building’s market value (FEMA, 2011). This minimum design elevation is frequently exceeded by 1–2 ft (known as freeboard) by community’s seeking to improve flood resilience and lower flood insurance premiums. Structures constructed or substantially improved before 1974 and therefore predate the development of FIRMs are not required to meet the minimum design elevation. In the case of the discretized community in Ortley Beach shown in Figure 2B, the average minimum design elevation above ground level was 0.26 m. In comparison, the average actual house elevation (determined during the manual survey of Ortley Beach) was 0.54 m, highlighting the tendency of structures to slightly exceed FEMA’s minimum design requirements.
The minimum design elevation for each structure in the study area is estimated by taking the difference between its BFE and the local ground elevation. The minimum design elevation for structures located in low-risk flood zones without a BFE is assumed to be 0. To estimate the flood inundation relative to BFE, a structure’s minimum design elevation above ground level is subtracted from the maximum inundation of its projection onto its community’s transect (Δrhouse). If no inundation occurred, the structure is excluded from the analysis. In the community-level analysis, the average relative inundation for a community (Δrcom) is computed as the average of relative inundation for all inundated buildings in the community. Here Δrcom can be considered as Sandy’s inundation relative to FEMA’s flood mapping.
Quantitative Vulnerability Analysis
Cumulative Logit Model
To better understand coastal vulnerability, the relationship between structural performance and the vulnerability parameters determined in the previous sections can be statistically estimated. In the case of the house level analysis where building performance is classified using ordinal damage states (Yhouse ∈ {0, 1, 2, 3, 4}), structural vulnerability is quantified using a cumulative logit model (Agresti, 2013; Lallemant et al., 2015). In this model, the cumulative probability of a structure experiencing a particular damage state D is given by the following equation:
where, in general, X is a vector of p explanatory variables, is a vector of regression coefficients, and {αD} is a set of regression intercepts which differ for each damage state D. The unknown regression parameters can be estimated using the maximum likelihood method (Agresti, 2013). We use the cumulative logit model to generate fragility curves to quantify structural performance in the house level analysis.
Fractional Logit Model
In the case of overall community vulnerability, the aggregate performance of structures is defined as the ratio of structures with at least minor damage (Ycom), and we estimate the expected community response for given vulnerability parameters, E[Ycom|X]. Since Ycom is bounded in the unit interval (i.e., Ycom ∈ [0,1]), estimating E[Ycom|X] can face several challenges. In particular, while using ordinary least squares is a common method for modeling response data, this approach suffers from several conceptual flaws in this case. First, a linear model for E[Ycom|X] does not guarantee predictions will be constrained to the unit interval. Second, the clustering of data points at 0 and 1 frequently results in problems of heteroscedasticity as the variance of responses is not constant over all values of X.
In this study, an easily implementable fractional logit model proposed by Papke and Wooldridge (1996) is used to estimate community vulnerability. To respect the boundedness of responses in the unit interval, the fractional logit model treats the conditional expectation as a logistic function of the following form:
where α is a regression intercept and is a vector of regression coefficients. Given a sample of observed community responses (y1, …, yn) and explanatory variables (x1, …, xn) for the n discretized communities in the analysis, the regression parameters can be estimated by maximizing the quasi-likelihood function
This procedure yields consistent parameter estimates and robust standard errors (Papke and Wooldridge, 1996).
Results
House Level Analysis
Results from the house level analysis for the 22,954 structures considered in the study area are shown in Figure 7. The box plots in Figures 7A,B, respectively, show the quartiles of maximum inundation and significant wave height for each of the five damage states assessed by the FEMA aerial survey. The median value for both hazard parameters increases with the severity of building damage highlighting the importance of flood inundation and wave action as damage predictors. A similar trend is also apparent for relative inundation where the severity of building damage increases with the extent by which Sandy’s flood level exceeded a structure’s minimum design elevation (Figure 7C). An interesting feature of Figure 7C is the median relative inundation for structures classified with no damage is 0.54 m (1.77 ft). This value is reflective of the 1–2 ft freeboard above FEMA’s BFE which is common for many coastal structures.
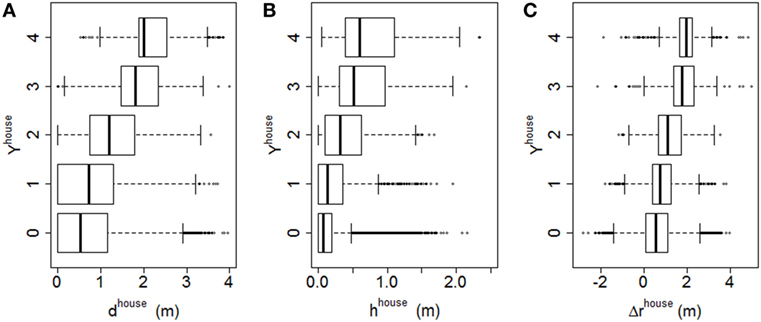
Figure 7. Box plots relating quartiles of (A) maximum inundation, (B) significant wave height, and (C) relative inundation to damage states from Federal Emergency Management Agency aerial survey (0—no damage, 1—affected, 2—minor damage, 3—major damage, and 4—destroyed).
The relationship between these vulnerability parameters and building damage is quantified by the fragility curves shown in Figure 8. Note that following convention, the fragility curves show the probability of equaling or exceeding a damage state, which is 1 minus the cumulative probability defined in Eq. 1. Consistent with the raw data from Figure 7, the fragility curves indicate that the probability of equaling or exceeding a damage state has a strong dependence on maximum inundation, significant wave height and relative inundation. The probability of a structure experiencing at least minor damage, for example, is 0.16 at a relative inundation of 2 m. This probability doubles to 0.34 at a relative inundation of 3 m.
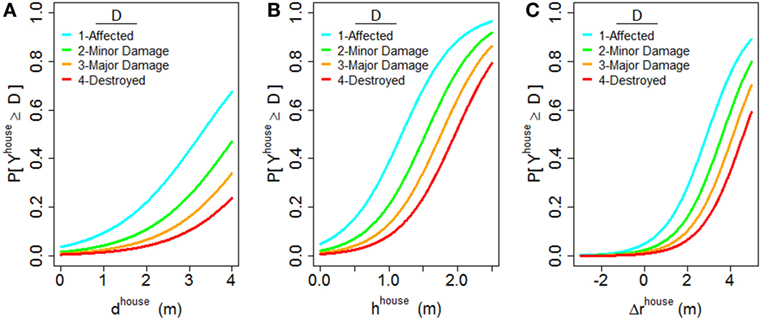
Figure 8. Fragility curves relating probability of exceeding a damage state to (A) maximum inundation, (B) significant wave height, and (C) relative inundation.
Community-Level Analysis
Results from the community-level analysis are shown in Figure 9. The five subfigures correspond to the five regions labeled “A” through “E” in Figure 1. Extracted vulnerability parameters for each of the discretized communities are shown as color bands. Band 1 represents the community-level impact (Ycom). Band 2 represents the percent change in dune elevation (Δzcom). Hashed markers for this band indicate communities with seawalls. Bands 3 and 4 represent the average community inundation (dcom) and average community significant wave height (hcom), respectively. Finally, Band 5 shows the average community relative inundation (Δrcom). The shading of the bands is shown in Figure 9A.
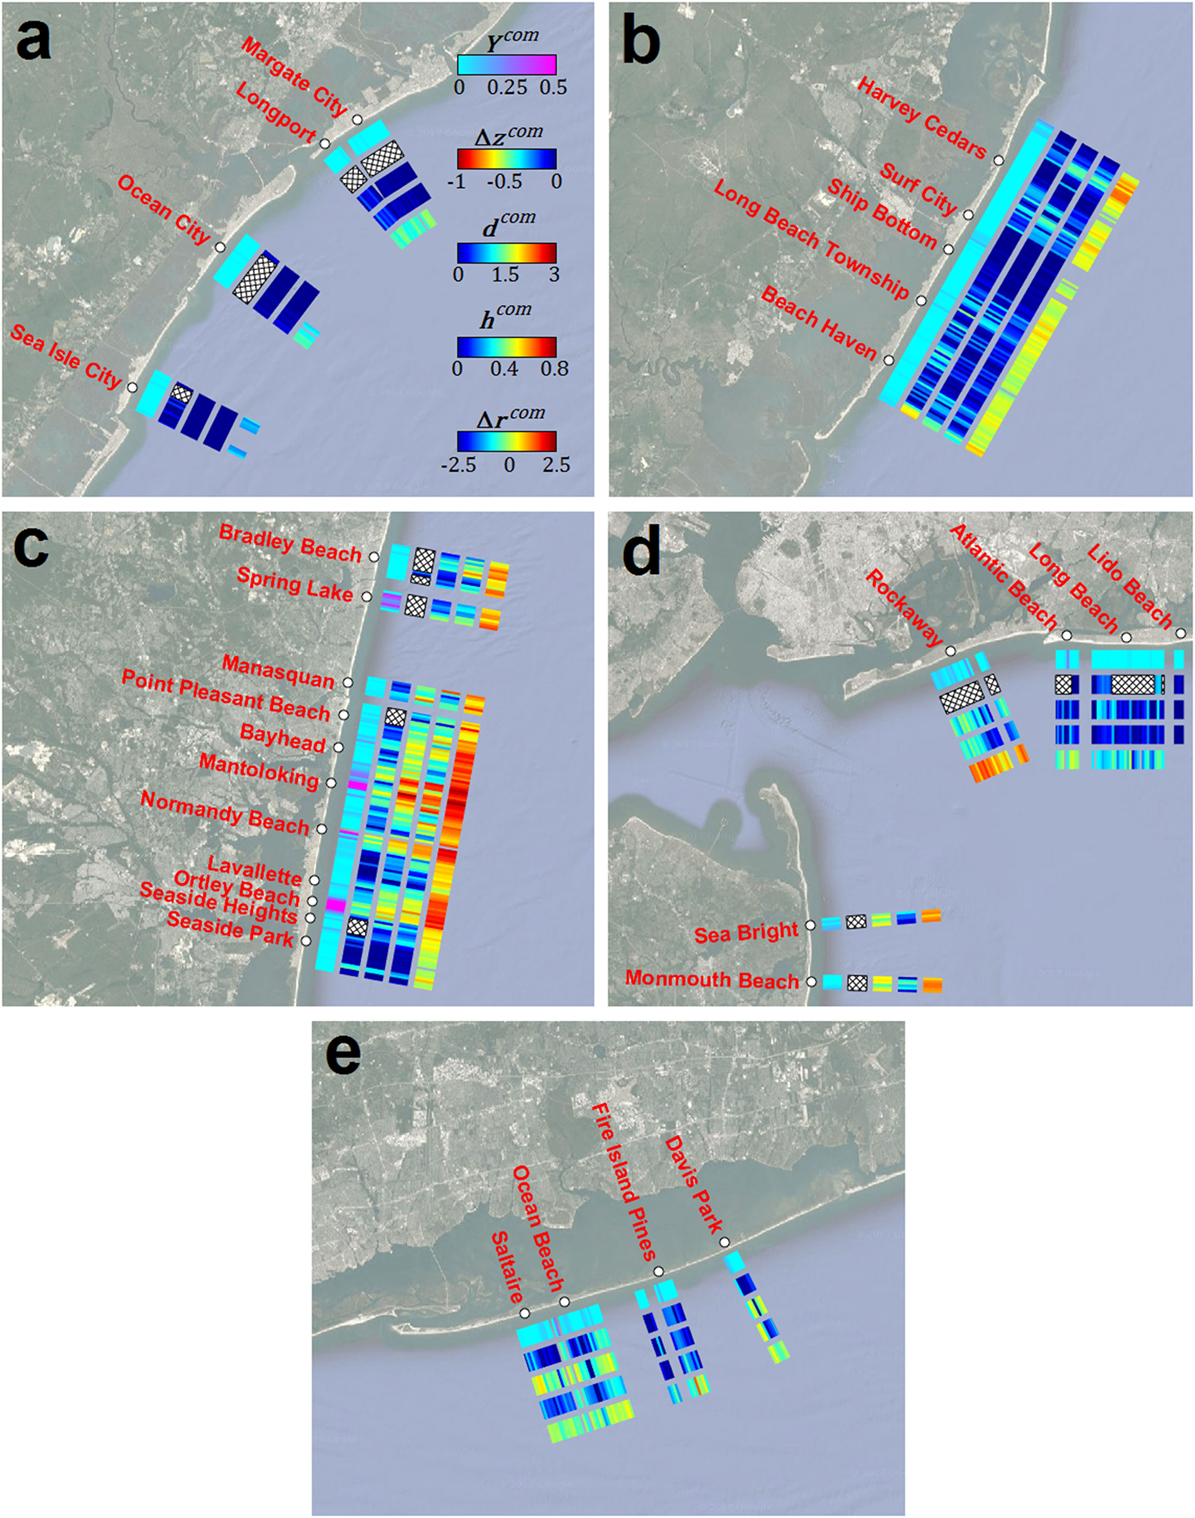
Figure 9. Results of the community-level analysis with colored bands (beginning from the coast) representing community impact (Ycom), percent change in dune elevation (Δzcom; hashed markers indicate communities with seawalls), average inundation (dcom), average significant wave height (hcom), and average relative inundation (Δrcom). (A–E) Each of the subfigures corresponds to the regions labeled A to E on Figure 1.
Although a majority of communities in the study area were largely unaffected by Sandy’s surge, the community-level analysis reveals several hotspots of flood impact. While communities with seawalls tended to perform well overall, communities with eroded dunes experienced significant building damage. This is particularly evident for communities in Ocean County, NJ such as Ortley Beach, Normandy Beach and Mantoloking where dunes were completely eroded (Band 2; Figure 9C). Locations with substantial dune erosion coincided with increased exposure to both inundation and wave action. Furthermore, in heavily impacted communities Sandy’s flood level tended to significantly exceed the BFEs specified in FEMA’s flood mapping.
Community impact is related to average flood conditions in Figure 10, with Figure 10A showing the effect of average house inundation and Figure 10B the effect of average significant wave height. The black line and shaded regions are the estimated expected community response and associated statistical uncertainty from a fitted fractional logit model. While community impact is relatively low for communities experiencing minor flooding, building damage increases significantly for communities with an average house inundation exceeding 1 m. For an average inundation of 2 m, the expected ratio of impacted structures (with at least minor damage) is 0.14. A similar trend is also apparent for average wave action, which is the dominant mechanism for severe structural damage during storm surge. In particular, the overall performance of communities was poor where the average significant wave height experienced by structures was greater than 0.4 m. The considerable scatter in results is likely caused by factors not included in the analysis. Potential sources of uncertainty include differences in building stock age and construction type across the discretized communities. The clustering of community impact data points at the lower bounds is likely due to structures which are exposed to inundation and wave conditions but are built sufficiently off the ground to remain undamaged.
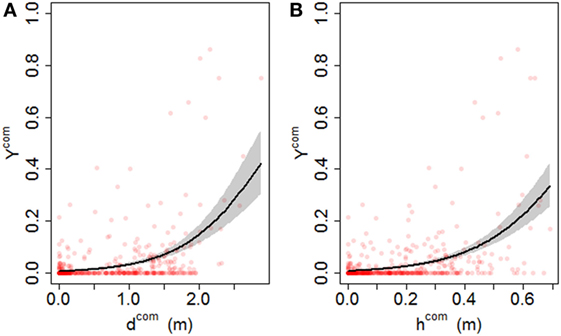
Figure 10. Community response (ratio of buildings with at least minor damage) as a function of (A) average house inundation and (B) average significant wave height. Data points represent raw data for 464 discretized communities in study area. Solid black curve and shaded black region represent the estimated expected community response and associated 95% confidence interval, respectively.
Community impact is related to large-scale features in Figure 11, with Figure 11A showing the effect of storm-induced erosion. As expected, a greater decrease in dune height elevation coincides with an increasing potential for community impact. This becomes particularly prevalent for communities where dune height decreases by more than 40%. The effect of inundation relative to FEMA’s BFE on community impact is shown in Figure 11B. Positive (negative) relative inundation values represent communities where Sandy’s flood level was on average above (below) the minimum design elevation of structures. Results indicate that nearly all impacted communities experienced positive relative inundation, with the hardest hit communities experiencing the highest relative inundation.
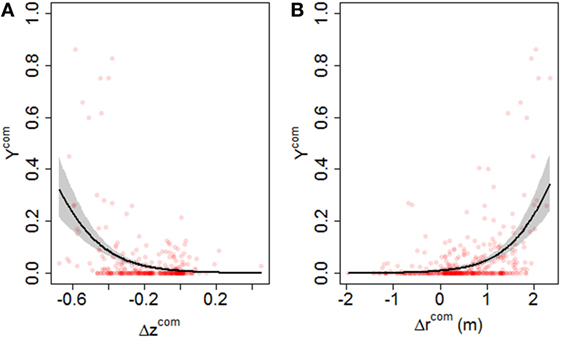
Figure 11. Community response (ratio of buildings with at least minor damage) as a function of the (A) percent change in dune height and (B) average relative inundation to community performance. Data points represent raw data for 464 discretized communities in study area. Solid black curve and shaded black region represent the estimated expected community response and associated 95% confidence interval, respectively.
Discussion
The findings from the vulnerability analysis have important implications for effective coastal management. Since coastal defenses such as seawalls and dunes are typically linear barriers lacking redundancy, the failure of defenses can have devastating effects on community performance as repeatedly noted during Sandy. While hard defenses tend to be reliable if initially constructed well, the performance of dunes can be considerably more variable during surge events. In particular, variables impacting dune vulnerability such as sediment morphology and dune geometry can be significantly altered by long-term coastal processes. As a result, failing to adequately maintain dune capacity through beach nourishment can have devastating consequences during surge events and therefore dune maintenance should be a critical priority for coastal managers. In the case of Ortley Beach, a 25-year history of shoreline retreat resulted in a minimal berm width before Sandy and thus significantly magnified the potential for erosion (Richard Stockton College of New Jersey, 2012). Given the importance of dune performance on coastal vulnerability, further research into topics such as optimal scheduling of dune nourishment, computational modeling of dune erosion and improved outreach with community stakeholders is needed.
The local flood environment experienced by coastal communities is likewise a key factor affecting structural performance. While great emphasis has historically been placed on flood inundation during surge events, dynamic characteristics such as wave action are essential damage mechanisms and therefore must not be neglected (Hatzikyriakou and Lin, 2017). The ADCIRC + SWAN and BOUSS1D models applied in this study present an accurate and computationally efficient approach to simulating these flood effects over large study areas. Although this study focused on a single historical event, the modeling framework can also be coupled with recent advances in cyclone modeling to estimate various return periods of inundation and wave action for a given location (Lin et al., 2012; Lin and Emanuel, 2015). This modeling can be combined with estimates of structural vulnerability such as those presented in this study to quantify surge damage risk at both the house and community levels.
Finally, the importance of flood inundation relative to a structure’s BFE highlights the critical role of effective FEMA flood mapping. As the primary tool for communicating flood risk and motivating the design of coastal structures, improving the accuracy of FIRMs is an important future objective. In particular, greater effort should be placed on maintaining up-to-date FIRMs which incorporate potential changes in coastal defenses like long-term dune erosion noted earlier. The potential impact of sea-level rise and climate change should also be accounted for.
Conclusion
The performance of residential structures within coastal communities during storm surge is sensitive to various vulnerability parameters. Using a case study of coastal flooding during Hurricane Sandy, this study investigates the effect of storm-induced erosion, flood conditions and minimum design requirements on observed exterior structural damage to coastal buildings. These features are, respectively, determined by using pre/post-Sandy topographical surveys, a hindcast simulation using a pair of hydrodynamic models and the 100-year BFE specified in FEMA’s coastal flood mapping. Findings indicate that the hardest hit communities experienced significant dune erosion which coincided with severe flood inundation and wave exposure. Furthermore, communities were considerably more susceptible to flood impact if flood inundation exceeded minimum design requirements. These findings provide important insight into the factors underlying coastal vulnerability and a basis for improving coastal resilience. Further research into community vulnerability from other flood events validating and expanding the findings of this study is an important future objective. In addition, research relating the age of structures to the likelihood of damage would provide key insight into the effectiveness of FEMA mitigation strategies since the program’s inception.
Author Contributions
NL and AH designed the research. AH collected data and performed analysis. AH and NL cowrote the paper.
Conflict of Interest Statement
The authors declare that the research was conducted in the absence of any commercial or financial relationships that could be construed as a potential conflict of interest.
The reviewer, MB, and handling editor declared their shared affiliation.
Acknowledgments
This research was supported by the National Science Foundation (NSF) grant EAR-1520683 and the United States Army Corps of Engineers (USACE) Climate Preparedness and Resilience Program with administrative support from Oak Ridge Institute for Science and Education (ORISE). The authors would like to thank Dr. Andrew Kennedy for his helpful insights and suggestions.
References
Agresti, A. (2013). Categorical Data Analysis. Wiley Series in Probability and Statistics, 3rd Edn. Hoboken, NJ: John Wiley & Sons.
Blake, E. S., Kimberlain, T. B., Berg, R. J., Cangialosi, J., and Beven, J. L. II (2013). Tropical Cyclone Report: Hurricane Sandy (AL182012). Miami, FL: National Hurricane Center.
Booij, N., Ris, R., and Holthuijsen, L. H. (1999). A third-generation wave model for coastal regions: 1. Model description and validation. J. Geophys. Res. 104, 7649–7666. doi: 10.1029/98JC02622
Botts, H., Jeffery, T., Du, W., and Suhr, L. (2015). CoreLogic Storm Surge Report. Irvine, CA: CoreLogic.
Chavas, D. R., Lin, N., and Emanuel, K. (2015). A model for the complete radial structure of the tropical cyclone wind field. Part I: comparison with observed structure. J. Atmos. Sci. 72, 3647–3662. doi:10.1175/JAS-D-15-0014.1
De Moel, H., Jongman, B., Kreibich, H., Merz, B., Penning-Rowsell, E., and Ward, P. (2015). Flood risk assessments at different spatial scales. Mitigation Adapt. Strateg. Global Change 20, 865–890. doi:10.1007/s11027-015-9654-z
Demirbilek, Z., Nwogu, O. G., Ward, D. L., and Sanchez, A. (2009). Wave Transformation Over Reefs: Evaluation of One-Dimensional Numerical Models. Vicksburg, MS: United States Army Engineering Research and Development Center.
Demuth, J. L., DeMaria, M., and Knaff, J. A. (2006). Improvement of advanced microwave sounding unit tropical cyclone intensity and size estimation algorithms. J. Appl. Meteorol. Clim. 45, 1573–1581. doi:10.1175/JAM2429.1
Dietrich, J. C., Zijlema, M., Westerink, J. J., Holthuijsen, L. H., Dawson, C., Luettich, R. A. Jr., et al. (2011). Modeling hurricane waves and storm surge using integrally-coupled, scalable computations. Coast. Eng. 58, 45–65. doi:10.1016/j.coastaleng.2010.08.001
Dietrich, J. C., Tanaka, S., Westerink, J. J., Dawson, C. N., Luettich, R. A. Jr., Zijlema, M., et al. (2012). Performance of the unstructured-mesh, SWAN + ADCIRC model in computing hurricane waves and surge. J. Sci. Comput. 52, 468–497. doi:10.1007/s10915-011-9555-6
Eamon, C. D., Fitzpatrick, P., and Truax, D. D. (2007). Observations of structural damage caused by hurricane Katrina on the Mississippi gulf coast. J. Perform. Constr. Facil. 21, 117–127. doi:10.1061/(ASCE)0887-3828(2007)21:2(117)
FEMA. (2012). Modeling Task Force (MOTF) Hurricane Sandy Impact Analysis. Federal Emergency Management Agency.
FEMA. (2013). Hurricane Sandy in New Jersey and New York (FEMA P-942). Federal Emergency Management Agency.
FEMA. (2014). Region II Coastal Storm Surge Project: Mesh Development. Federal Emergency Management Agency.
Forristall, G. Z. (1978). On the statistical distribution of wave heights in a storm. J. Geophys. Res. 83, 2353–2358. doi:10.1029/JC083iC05p02353
Halverson, J. B., and Rabenhorst, T. (2013). Hurricane Sandy: the science and impacts of a Superstorm. Weatherwise 66, 14–23. doi:10.1080/00431672.2013.762838
Hasselmann, K., Barnett, T. P., Bouws, E., Carlson, H., Cartwright, D. E., Enke, K., et al. (1973). Measurements of Wind-Wave Growth and Swell Decay during the Joint North Sea Wave Project (JONSWAP). Hamburg: Deutches Hydrographisches Institut.
Hatzikyriakou, A., and Lin, N. (2017). Simulating storm surge waves for estimating structural vulnerability and mapping flood hazards. Nat. Hazards. 89, 939–962. doi:10.1007/s11069-017-3001-5
Hatzikyriakou, A., Lin, N., Gong, J., Xian, S., Hu, X., and Kennedy, A. (2015). Component-based vulnerability analysis for residential structures subjected to storm surge impact from Hurricane Sandy. Nat. Hazards Rev. 17, 05015005. doi:10.1061/(ASCE)NH.1527-6996.0000205
Holland, G. J. (1980). An analytic model of the wind and pressure profiles in hurricanes. Mon. Weather Rev. 108, 1212–1218. doi:10.1175/1520-0493(1980)108<1212:AAMOTW>2.0.CO;2
Kennedy, A. B., Westerink, J. J., Smith, J. M., Hope, M. E., Hartman, M., Taflanidis, A. A., et al. (2012). Tropical cyclone inundation potential on the Hawaiian Islands of Oahu and Kauai. Ocean Model 52–53, 54–68. doi:10.1016/j.ocemod.2012.04.009
Lallemant, D., Kiremidjian, A., and Burton, H. (2015). Statistical procedures for developing earthquake damage fragility curves. Earthquake Eng. Struct. Dyn. 44, 1373–1389. doi:10.1002/eqe.2522
Lin, N., and Chavas, D. (2012). On hurricane parametric wind and applications in storm surge modeling. J. Geophys. Res. Atmos. 117. doi:10.1029/2011JD017126
Lin, N., and Emanuel, K. (2015). Grey swan tropical cyclones. Nat. Clim. Change 6, 106–111. doi:10.1038/nclimate2777
Lin, N., Emanuel, K., Oppenheimer, M., and Vanmarcke, E. (2012). Physically based assessment of hurricane surge threat under climate change. Nat. Clim. Change 2, 462–467. doi:10.1038/nclimate1389
Lin, N., Kopp, R. E., Horton, B. P., and Donnelly, J. P. (2016). Hurricane Sandy’s flood frequency increasing from year 1800 to 2100. Proc. Natl. Acad. Sci. U.S.A. 113, 12071–12075. doi:10.1073/pnas.1604386113
Luettich, R., Westerink, J., and Scheffner, N. W. (1992). ADCIRC: An Advanced Three-Dimensional Circulation Model for Shelves, Coasts, and Estuaries. Report 1. Theory and Methodology of ADCIRC-2DDI and ADCIRC-3DL. United States Army Corps of Engineers.
Mattingly, K. S., McLeod, J. T., Knox, J. A., Shepherd, J. M., and Mote, T. L. (2014). A climatological assessment of Greenland blocking conditions associated with the track of Hurricane Sandy and historical North Atlantic hurricanes. Int. J. Climatol. 35, 746–760. doi:10.1002/joc.4018
Merz, B., Kreibich, H., Schwarze, R., and Thieken, A. (2010). Assessment of economic flood damage. Nat. Hazards Earth Syst. Sci. 10, 1697. doi:10.5194/nhess-10-1697-2010
Messner, F., and Meyer, V. (2006). Flood Damage, Vulnerability and Risk Perception-Challenges for Flood Damage Research. Dordrecht: Springer.
Nadal, N., Zapata, R., Pagán, I., López, R., and Agudelo, J. (2010). Building damage due to riverine and coastal floods. J. Water Res. Plann. Manag. 136, 327–336. doi:10.1061/(ASCE)WR.1943-5452.0000036
O’Dea, C. (2013). Interactive Map: Assessing Damage from Superstorm Sandy. Njspotlight. Available at: http://www.njspotlight.com/stories/13/03/14/assessing-damage-from-superstorm-sandy/
Papke, L. E., and Wooldridge, J. M. (1996). Econometric methods for fractional response variables with an application to 401 (K) plan participation rates. J. Appl. Econom. 11, 619–632. doi:10.1002/(SICI)1099-1255(199611)11:6<619::AID-JAE418>3.0.CO;2-1
Richard Stockton College of New Jersey. (2012). Beach Dune Performance Assessment of New Jersey Beach Profile Network (NJBPN) Sites at Northern Ocean County, New Jersey after Hurricane Sandy Related to FEMA Disaster DR-NJ-4086. Galloway, NJ: Coastal Research Center.
Robertson, I., Riggs, H., Yim, S., and Young, Y. (2007). Lessons from hurricane Katrina storm surge on bridges and buildings. J. Waterw. Port Coast. Ocean Eng. 133, 463–483. doi:10.1061/(ASCE)0733-950X(2007)133:6(463)
RS Means. (2013). RS Means Online Database. Available at: http://www.rsmeansonline.com/
Russ, H. (2012). New York, New Jersey Put $71 Billion Price Tag on Sandy. Available at: http://www.reuters.com/article/us-storm-sandy-cost-nyc-idUSBRE8AP0SZ20121127
Scawthorn, C., Flores, P., Blais, N., Seligson, H., Tate, E., Chang, S., et al. (2006). HAZUS-MH flood loss estimation methodology: II Damage and loss assessment. Nat. Hazards Rev. 7, 72–81. doi:10.1061/(ASCE)1527-6988(2006)7:2(72)
Sopkin, K. L., Stockdon, H. F., Doran, K. S., Plant, N. G., Morgan, K. L., Guy, K. K., et al. (2014). Hurricane Sandy: Observations and Analysis of Coastal Change. Reston, VA: US Geological Survey.
Suppasri, A., Koshimura, S., and Imamura, F. (2011). Developing tsunami fragility curves based on the satellite remote sensing and the numerical modeling of the 2004 Indian Ocean tsunami in Thailand. Nat. Hazard Earth Syst. 11, 173–189. doi:10.5194/nhess-11-173-2011
Taflanidis, A., Kennedy, A., Westerink, J., Smith, J., Cheung, K., Hope, M., et al. (2013). Rapid assessment of wave and surge risk during landfalling hurricanes: probabilistic approach. J. Waterw. Port Coast. Ocean Eng. 139, 171–182. doi:10.1061/(ASCE)WW.1943-5460.0000178
Tomiczek, T., Kennedy, A., Zhang, Y., Owensby, M., Hope, M., Lin, N., et al. (2017). Hurricane damage classification methodology and fragility functions derived from hurricane Sandy’s effects in coastal New Jersey. J. Waterw. Port Coast. Ocean Eng. 143, 04017027. doi:10.1061/(ASCE)WW.1943-5460.0000409
USACE. (2015). North Atlantic Coast Comprehensive Study: Resilient Adaptation to Increasing Risk. Physical Depth Damage Function Summary Report. United States Army Corps of Engineers.
USGS. (2012). Pre and Post Storm Photos for Hurricane Sandy. Available at: http://coastal.er.usgs.gov/hurricanes/sandy/post-storm-photos/obliquephotos.html
Weber, K., List, J., and Morgan, K. (2005). An Operational Mean High Water Datum for Determination of Shoreline Position from Topographic Lidar Data: U.S. Geological Survey Open-File Report 2005–1027. Woods Hole, MA: USGS.
Xian, S., Lin, N., and Hatzikyriakou, A. (2015). Storm surge damage to residential areas: a quantitative analysis for hurricane Sandy in comparison with FEMA flood map. Nat. Hazards 79, 1867–1888. doi:10.1007/s11069-015-1937-x
Keywords: storm surge, flood, structural vulnerability, community, dune, Hurricane Sandy, Federal Emergency Management Agency, Base Flood Elevation
Citation: Hatzikyriakou A and Lin N (2018) Assessing the Vulnerability of Structures and Residential Communities to Storm Surge: An Analysis of Flood Impact during Hurricane Sandy. Front. Built Environ. 4:4. doi: 10.3389/fbuil.2018.00004
Received: 03 June 2017; Accepted: 15 January 2018;
Published: 06 February 2018
Edited by:
Jean-Paul Pinelli, Florida Institute of Technology, United StatesReviewed by:
Craig Miller, University of Western Ontario, CanadaDavid James Henderson, James Cook University, Australia
Mohammad Baradaranshoraka, University of Florida, United States
Copyright: © 2018 Hatzikyriakou and Lin. This is an open-access article distributed under the terms of the Creative Commons Attribution License (CC BY). The use, distribution or reproduction in other forums is permitted, provided the original author(s) and the copyright owner are credited and that the original publication in this journal is cited, in accordance with accepted academic practice. No use, distribution or reproduction is permitted which does not comply with these terms.
*Correspondence: Adam Hatzikyriakou, YWhreXJpYWtvdUBnbWFpbC5jb20=