 Samuel Roeslin
 Quincy T. M. Ma
 Hugón Juárez García2
- 1Department of Civil and Environmental Engineering, University of Auckland, Auckland, New Zealand
- 2Departmento de Ingeniería Civil, Universidad Autónoma Metropolitana Azcapotzalco, Mexico City, Mexico
Understanding seismic risk enables efficient resource allocation in the effort to increase the resilience of our cities and communities. Field reconnaissance and data collection following disasters document the damaging effects of earthquakes to enable lessons and wisdom to accumulate from past events. An important aim of such field data analysis is establishing a better understanding of building performance such as causes of building failures. These lessons provide essential basis to improve our design codes, develop regulations and policies, to increase building resilience by addressing the infrastructure vulnerability. Currently, to make use of the datasets from around the world, significant effort is required to decode the data which often have unique local and regional context and bias. The struggle begins at data collection where there is a lack of consistent methodology and definitions that can adequately cover the regional nuance. This manuscript proposes a new paper-based tool which addresses the need for a global yet detailed universal methodology for building damage assessment post-earthquakes. The new form is based on the GEM taxonomy v2.0 and the European Macroseismic Scale EMS-98. The recent Mexican earthquake from the 19 September 2017 led to significant building damage in the capital Mexico City and the state of Morelos. A team from New Zealand assessed damage throughout the capital and tested the new paper form in Calle La Morena. The street case study presents a novel visualization of the damage data and buildings characteristics which highlights the correlation between the damage and the building features. It is hoped that this kind of illustration will lead to better comprehension of the damage drivers.
Introduction
One of the earliest contemporary earthquake reconnaissance and observation for scientific account was that by Robert Mallet (1810–1881). Mallet spent 1 month in Italy following the 1857 great Neapolitan earthquake (Ferrari and Mcconnell, 2005), and he collected meaningful data and documented his finding in the report “The first principles of observational seismology” (Mallet, 1862). Approximately 50 years later, the U.S. experienced one of the worst natural disasters in its history with the 1906 San Francisco earthquake. The earthquake and following fire killed more than 3,000 persons and left 400,000 persons homeless (The US National Archives Records Administration, 2017). More importantly, before the event, San Francisco was the premier city
of the West Coast. After 1906, population abandoned San Francisco, and Los Angeles quickly outgrew San Francisco in the following decade. Los Angeles is now the financial center of California and is five times as large as San Francisco (Jones, 2014). The San Francisco earthquake and other significant earthquakes such as the 1923 Kanto and 1995 Kobe Earthquakes highlighted the importance of the economic and social consequences of earthquake disasters. It pointed to the need for improving the resilience of our cities and urban environment.
Purpose of modern earthquake engineering is to mitigate damage in buildings and infrastructures to reduce the impact of earthquakes on the society. Earthquake risk reduction is a multidisciplinary risk management exercise and is not restricted to improving the science behind more accurate seismic hazard prediction. It encompasses enhancing the understanding of the exposure and vulnerability of our built environment. Then, applying appropriate risk management measures such as Avoid-Control-Accept-Transfer to minimize the related losses. Earthquake risk reduction requires knowledge from seismology, structural, and geotechnical engineering as well as psychology and economics. The most valuable resource in damage mitigation and loss prediction for future earthquakes is actual data and lessons from past events. In the structural engineering fields, the perishable building performance data on damage and undamaged buildings are invaluable in identifying failure causes and damage patterns. Lessons learned enable engineers, planners, and officials to adjust the current setting to optimize future social and economic outcomes. The most direct lever for this is via improving structural design standards and seismic loss prediction models.
This paper first discusses the concept of “natural risk” and present an example use of empirical damage data. Then, a review is provided on post-earthquake damage collection tools and damage collection forms available in the U.S., Europe, and New Zealand. A new paper-based building damage observation form based on the GEM buildings taxonomy v2.0 is proposed. This new form was trialed in Mexico City following the 2017 Puebla earthquake. Results and key findings are presented.
The Role of Seismic Damage Assessment in Earthquake Risk Mitigation
What Is “Natural Risk”?
In a non-technical context, “risk” is often understood as “a situation involving exposure to danger” (Oxford Dictionaries, 2018) and set of circumstances that might lead to an undesirable outcome and adverse consequences. In a technical context, Hansson (2014) differentiates the definition of “risk” from a qualitative and quantitative sense. From a qualitative definition “risk” either refers to the unwanted event itself or the cause of the unwanted event. In a quantitative sense, “risk” expresses the probability of the occurrence of an unwanted event. It sometimes describes the process of decision making in cognizance of the possible adverse consequences. The most common definition of risk in technical contexts is the expected value of an undesirable outcome expressed as the product of risk probabilities and its severity (Hansson, 2014).
In the context of natural hazards, risk is defined as the combination of the natural hazard, exposure of the structure, and the vulnerability of the studied asset as shown schematically in Figure 1 (Lallemant, 2017). Risk only appears if these components are together.
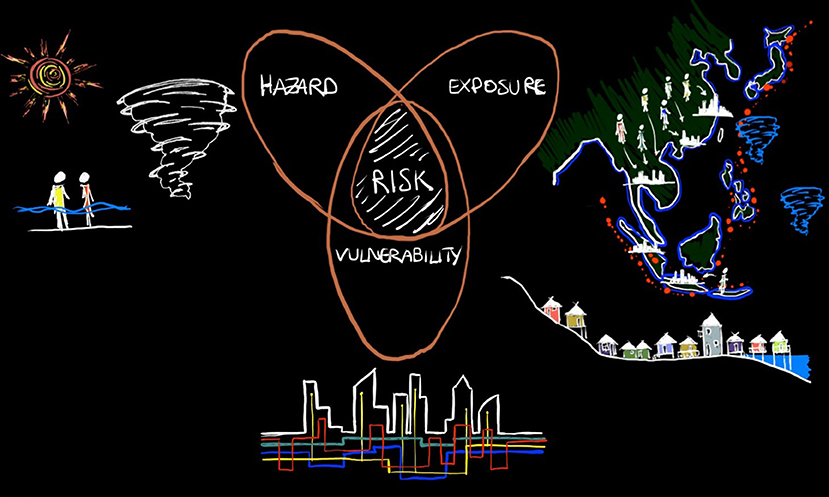
Figure 1. Risk from earthquakes is the combination of natural hazard, exposure, and vulnerability (Lallemant, 2017).
How to Quantify Earthquake Risk?
Porter (2018) presents a concise summary of the engineering approach to risk analysis. A schematic overview is reproduced in Figure 2. Informed decision making requires understanding of asset characteristics and the site-specific potential hazards. This approach to risk analysis aligns with the Pacific Earthquake Engineering Research Center (PEER) Performance-Based Earthquake Engineering (PBEE) methodology.
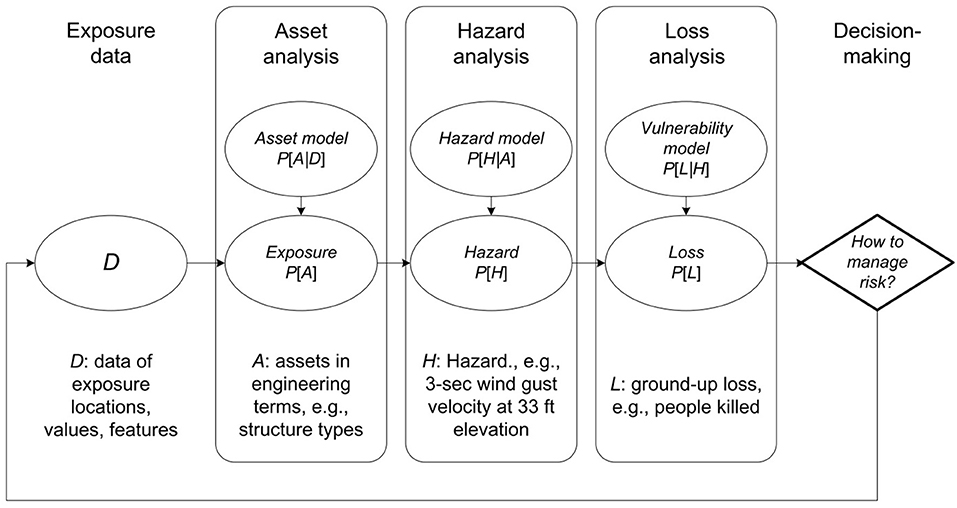
Figure 2. An engineering approach to risk analysis (Porter, 2018).
The PEER PBEE methodology is an evolution of the “Vision 2000” framework which emerged in the aftermath of the 1994 Northridge earthquake in an effort to improve seismic codes. The framework developed new criteria based on field observations and quantitative evaluations. It established concepts of key engineering response parameters, defined acceptance limits for building performance objectives in various level of ground shaking (SEAOC Vision Committee, 1995). The “Vision 2000” methodology sets out a relationship between the performance objective, the risk profile of the facility, the probability of an earthquake, and the response parameters related to each performance objective. The newly introduced definitions for the building performance are: fully operational, operational, life safe, and near collapse (Poland et al., 1995). Work such as FEMA 273 [(Applied Technology Council (ATC), 1997)], ATC-32 [(Applied Technology Council (ATC), 1996a,b)], and FEMA 356 (FEMA, 2000) followed. PEER subsequently extended concept to account for uncertainties via a probabilistic framework, this is now commonly referred to as the PEER PBEE methodology. The PEER PBEE methodology provides a consistent and clear framework for the decision-making process regarding the seismic performance of an asset (Cornell and Krawinkler, 2000). In recent years, the PEER methodology has been extensively described (Yang et al., 2009; Gunay and Mosalam, 2012; Broccardo et al., 2016). The PEER methodology considers the building performance at a system level rather than the failure of individual structural components. The decision variable (DV) is expressed through simple performance metrics such as the casualties, the repair costs, and loss-of-use duration (3D'S: death, dollars, and downtime), which are meaningful to technical and non-technical stakeholders (Porter, 2003). The first version of PBEE expressed DV as a function of the seismic hazard, in terms of an intensity measure (IM), and damage, characterized as damage measure (DM) (Cornell and Krawinkler, 2000). Porter (2003) improved the PEER methodology and proposed a four stages approach which combines the results of hazard analysis, structural analysis, damage analysis and loss analysis. The above are characterized by probability functions of IM, engineering demand parameters (EDP), DM and DV. The mathematical expression of the mean annual rate of a DV is shown as Equation (1).
Equation (1) expresses the mean annual rate of the DV as an integral of a chain of conditional probabilities depending on the DM, a measure of physical damage associated with a given EDP (e.g., local failure, degree of collapse, loss of load capacity), the EDP, a measure used to characterize structural response (e.g., floor acceleration, interstory drift, roof displacement), and the IM of the earthquake, a measure used to characterize the intensity of ground shaking (e.g., ground acceleration, ground velocity, spectral displacement). G(DM/EDP) and G(DV/DM) require a damage analysis and loss analysis based on fragility and loss models, respectively (Yang, 2013). The concept of the PEER PBEE methodology is thouroughly explained in the seminal work of Porter (2003). In recents years, the earthquake and structural engineering community studied the PEER PBEE methodology (Kiureghian, 2005; Dhakal, 2011; Gunay and Mosalam, 2012), and applied it (Krawinkler, 2005; Mitrani-Reiser, 2007; Cutfield, 2015; Burton et al., 2016). The interested reader is directed to the above-mentioned articles.
It is possible to calibrate these damage and loss models based on analytical or laboratory data, expert opinion, or empirical data. While each approach offers advantages, empirical data is often regarded as the most desirable as it comes from the inspection of buildings subjected to real earthquakes and thus reflects actual achieved performance. In the field, seismic damage assessment performed in the frame of earthquake reconnaissance missions play a crucial role in the understanding of our buildings deficiencies and strengths. A better understanding of the failure can lead to possible design code improvement. However, the damage data collection is also an essential step in improving our damage and loss models which also has applications in emergency response and risk management. Figure 3 presents the chain of action from the damage data collection until the implementation of the loss prediction model. The damage state of a building following an earthquake is the root of the validation step in the damage prediction process. We assess the extent of damage and collect damage data following an earthquake to help us develop our damage prediction models. The data can also be used for the ultimate validation of the loss prediction.
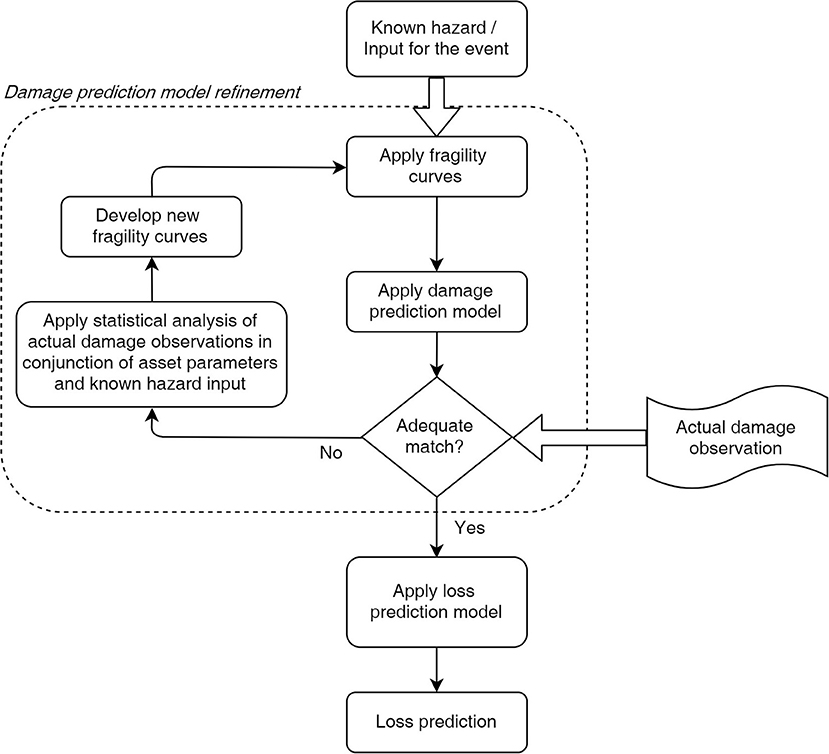
Figure 3. Damage assessment in the earthquake risk reduction.
Post-Earthquake Damage Collection
Review of Existing Collection Forms
The first seismic damage assessment methodology for the US was developed by the Applied Technology Council (ATC) in 1985. The American Federal Emergency Management Agency (FEMA) contacted ATC to bridge the existing literature gap to make earthquake damage, loss and inventory data available. The report “ATC-13 Earthquake Damage Evaluation Data for California” (Rojahn et al., 1985) presents damage and loss estimates as well as details of the methodology employed to compute these estimates. In the 1990's, ATC published the “ATC-20 Procedures for Postearthquake Safety Evaluation of Buildings” (Friedman et al., 1989) and “ATC-20-2 Addendum to the ATC-20 Post-earthquake Building Safety Procedures” (Bolton et al., 1995). These two reports introduced a methodology for the seismic damage evaluation focused exclusively on Californian building stock. In Europe, the first tool for the seismic vulnerability assessment was developed in 1992 and implemented in 1998. The European Seismological Commission developed the European Macroseismic Scale 1998 (EMS-98) bringing a common framework for the vulnerability definition and damage classification of masonry and concrete buildings (Grünthal, 1998). In Italy, the “Field Manual for post-earthquake damage and safety assessment and short-term countermeasures (AeDES)” provides tools for the evaluation of seismic damage data post-earthquake (Baggio et al., 2007). In 1998, the New Zealand Society for Earthquake Engineering (NZSEE) published the guidelines “Post-earthquake building safety procedures.” The assessment forms and building evaluation methodology is identical to the ATC-20 damage data collection form. Nevertheless, it differentiates itself in the placard use. An update of the guidelines followed in 2009 (NZSEE, 2009). The evaluation process includes two levels of rapid assessment followed by a detailed engineering evaluation if necessary. The ATC forms account for specificities of the American building stock characteristics only, thus pointing to the need for a single form capable of capturing building features from different countries. The tool should be global to allow a data collection on a universal basis anywhere in the world, yet detailed enough to capture important region-specific features.
In 2009, private and public entities collaboratively founded the Global Earthquake Model (GEM) aimed to develop a single model for evaluating earthquake risk in any location worldwide. Research efforts focused on different aspects. One of the work streams was the development of tools to capture damage data following earthquakes (Foulser-Piggott et al., 2014).
GEM Inventory Data Capture Tools (IDCT)
As part of GEM, scientists and engineers developed three tools to capture data on site. The researchers programmed two digital tools, one Windows software (Jordan et al., 2014) and a mobile application (app for short) (Rosser et al., 2014). At the time of writing, the app is only available for Android device. The app is open-source and collaborative; features can be improved and added via the GitHub repository [(Global Earthquake Model (GEM), 2013)]. While these tools streamlined the data processing process, they also have limitations surrounding the robustness of the device, the limit of devices available, power and cellular communication requirement, and inflexibility of input for onsite use. Paper forms are thus developed and used as a backup tool or as a tool itself.
The tool development process included field tests in learning from earthquake (LFE) exercise in L'Aquila, Italy, in Athens, Greece, and Bishek, Kyrgyzstan (Foulser-Piggott et al., 2013). These experience further improved aspects of the form construction such as color coding for different categories, presentation order of attributes. Field tests pointed to the need to refine lateral-load resisting system (LLRS) options and data options (Foulser-Piggott et al., 2013).
GEM Building Taxonomy v2.0
Building features classification and arrangements are described in building taxonomies. The recorded use of building taxonomies can be found from the end of the eighteenth century. Insurance companies needed to accurately define and document the building characteristics to provide adequate fire insurance. The concept of recording building characteristics evolved during the nineteenth century. Events such as the great fire of New York City in 1835 which led to the bankruptcy of 23 of the 26 insurance companies at the time (The Graduate Center CUNY, 2001) emphasized the need for accurately cataloging of building inventory and classification of buildings and their components. This categorization of material, elements, and components into several groups is called “building taxonomy.”
While the use of building taxonomy is standard practice for the calculation of risk related to fire, it is only in the mid-1900s that earthquake insurance used taxonomy systems for rating purposes (Brzev et al., 2013). The 1970s saw the emergence of PBEE procedures (Porter, 2005). The building industry first started to adopt taxonomy classification systems in 1985 with the ATC-13 Earthquake Damage Evaluation Data for California (Rojahn et al., 1985). ATC-13 evolved to form the FEMA P-154. This methodology first developed in 1985, is still in use today in an updated version, the FEMA P-154 Rapid Visual Screening of Buildings for Potential Seismic Hazards: A Handbook (Rojahn et al., 2015). The beginning of the twenty-first century saw the development of building taxonomies applicable outside the U.S. Taxonomies useable in several countries such as The World Housing Encyclopedia [(Earthquake Engineering Research Institute (EERI) International Association for Earthquake Engineering (IAEE), 2000)] or the PAGER-STR taxonomy (Jaiswal and Wald, 2008). A recent popular implementation is the GEM Building Taxonomy v2.0 which is designed to be applicable worldwide (Brzev et al., 2013). The GEM taxonomy describes and uniformly classifies buildings according to 13 attributes (Table 1). Additional information on the GEM Building Taxonomy Version 2.0 is available in the technical report, Brzev et al. (2013).
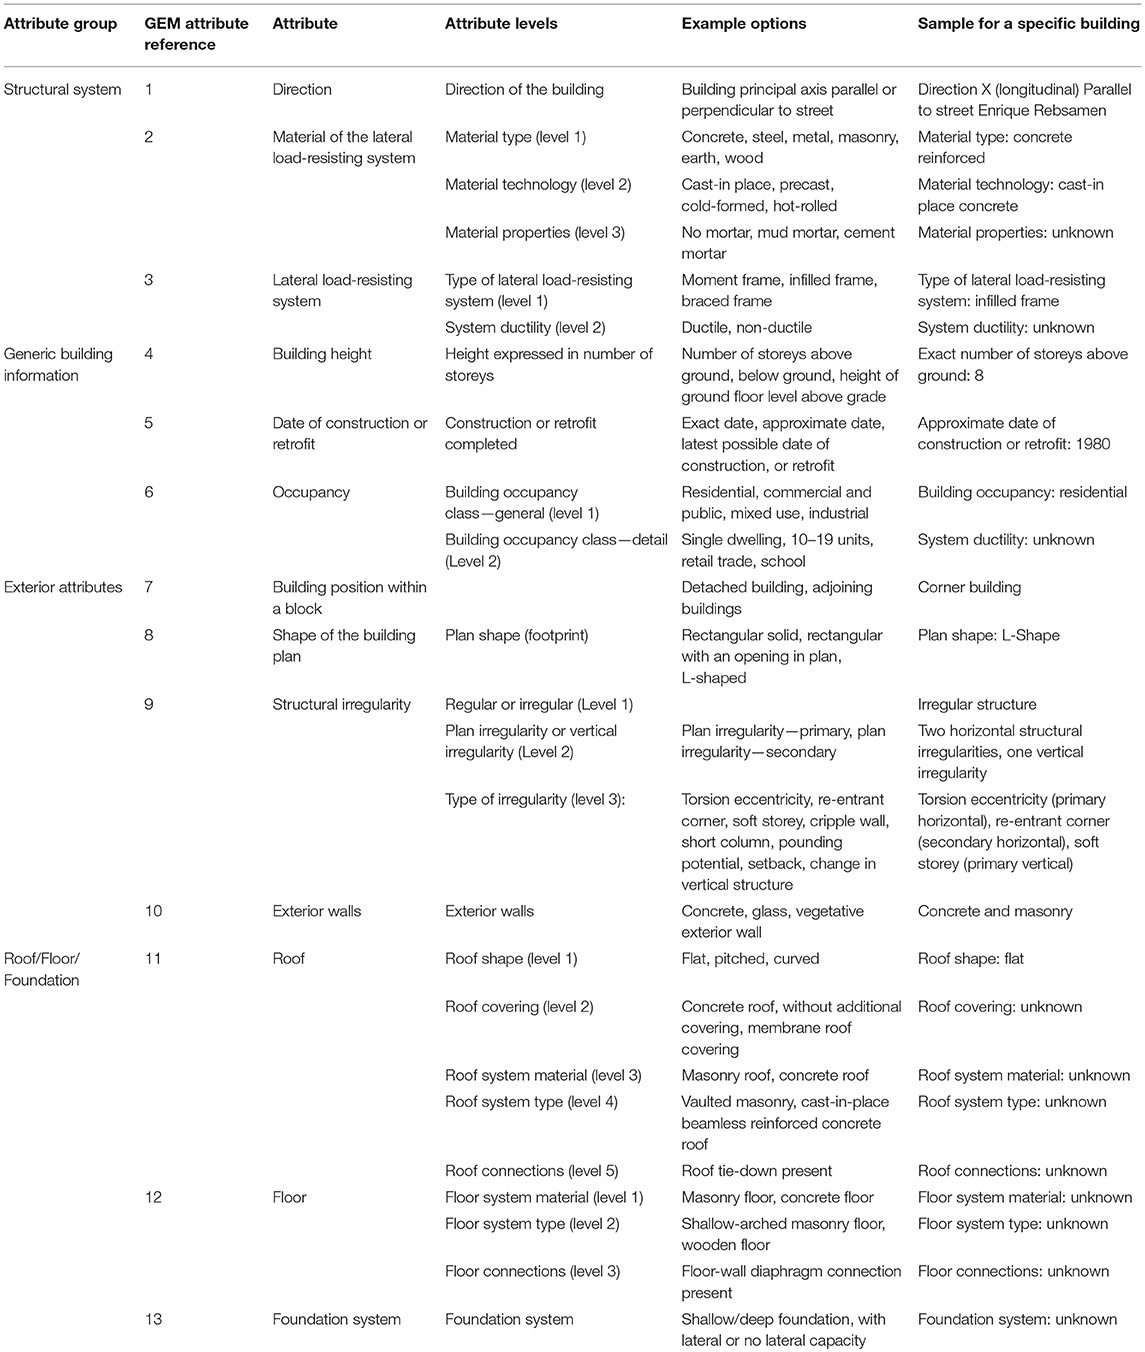
Table 1. Overview of the GEM building taxonomy categories.
Non-structural Components
Non-structural components are essential regarding losses and decision-making. In Performance-Based Earthquake Engineering, non-structural components significantly influence the damage and loss analyses (Porter, 2005). Taghavi and Miranda (2003) showed that non-structural components could make up 60–80% of the total value of a building. To capture damage, define the performance of non-structural components and distinguish between the performances of several design types, it is important to adequately identify and categorize these non-structural components with sufficient details so that components with different damageability are addressed to different categories (Porter, 2005).
Improved Paper Form Based on the GEM Building Taxonomy v2.0
The improved form proposed in this project was designed with universal applicability in mind, in line with the GEM objective. Care was taken to develop a standard and consistent definition of building features to ensure past, current, and future data are comparable. It is the first damage assessment form that combines and aligns the GEM Building Taxonomy v2.0 (Brzev et al., 2013) and EMS-98 (Grünthal, 1998) into one paper form. While the European Macroseismic Scale EMS-98 was primarily developed for European countries, engineers used the EMS-98 damage scale to assess building damage all over the world: in Italy (Borg et al., 2010; Del Gaudio et al., 2017), in France/Spain (Monfort et al., 2011), in Mexico (Juarez Garcia et al., 2004), in New Zealand (Cattari et al., 2015; Stirling et al., 2015; Fikri et al., 2018). The GEM Building Taxonomy is appropriate to consistently describe and classify buildings worldwide (Allen et al., 2015). It was already employed in several projects [(Global Earthquake Model (GEM), 2015; Wieland et al., 2015; Silva et al., 2018)]. The new developed paper form is also one of the few forms that allows for the collection of non-structural components seismic performance data. It combines the nonstructural damage observation form developed by Taghavi and Miranda (2003) and the non-structural building components taxonomy developed by Porter (2005). It is the only form that includes sketches from the glossary of GEM taxonomy (Allen et al., 2013).
The improved paper form comprises six mains sections.
• Section one collects information about the assessor and general building information such as building location (address and GPS coordinates).
• Section two records building information: type of occupancy, number of storeys, building position within a block, date of construction, building shape.
• Section three records the general description of building damage including location and extent based on the EMS-98 (Grünthal, 1998). The placement of this section in the form is deliberate as it places this on the first page. This section also introduces essential definitions that assist the assessment of building elements.
• Section four focuses on structural elements. It records details about the building material and the LLRS in each direction. There is also a space to record any structural irregularity in the structure (in plan and vertical).
• Section five deals with exterior attributes (e.g., roof, façade), flooring systems, foundation system, and ground condition.
• Section six is dedicated to non-structural components from non-structural walls to ceilings and encompasses some building content. On the last page, there is space for a sketch of the building and prompts to write reference and captions for any photographs taken.
A version of the paper form is available in the Supplementary Material.
Field Test of the Improved Paper Form
An international LFE team trialed the improved form on site in Mexico City following the 19 September 2017 Puebla earthquake. The team composition was diverse, consisting of local and foreign academic researchers, graduate, and undergraduate students. The experience in deploying the improved paper form was successful. It provided great detail, enabled consistent damage gradings, and was easy to use. The definition of the general building damage according to the EMS-98 was well-received and understood by local assessors. Local assessment forms such as the one developed at the Autonomous University Azcapotzalco in Mexico City (Gomez-Bernal, 2017) also expressed building damage according to the EMS-98. One of the advantages of the EMS-98 is that the documents are available in full and short form in English, French, Spanish, and Chinese (Grünthal, 1998). Nevertheless, experience in the field showed that training is necessary for assessors to become familiar with the assessment form. The alignment of this new paper form with the GEM taxonomy also made the reporting of the information in the GEM—Direct Observation Tools (Jordan et al., 2014) straightforward.
The new form was designed with an emphasis on non-structural components. It was hoped to collect empirical data on the performance of non-structural components. However, during the field test, the number of internal inspections was limited due to difficulties in obtaining access to private properties and buildings. A better solution for future missions might be to send a questionnaire on non-structural components to owners of damaged buildings (see Supplementary Material). Previous research showed that satisfactory results could be achieved if the form is self-explanatory (Taghavi and Miranda, 2003).
Future Improvement
Assessors appreciated the simplified sketches depicting damage and structural categories included in the form. These sketches were taken from the glossary of GEM taxonomy (Allen et al., 2013). Some assessors suggested more pictures and complementary explanation to be included in the paper form [e.g., explanation on short columns, cripple walls, torsion eccentricity (TOR)]. There exists a trade-off between sufficient explanation and overall length of the form. Version 1.2.0 of the IDCT Android app (March 2018) was available in Spanish. Translation of the paper form into Spanish and any other language used in earthquake-prone countries is recommended and could make the assessment process more accessible. The difficulty for assessors to enter buildings and assess non-structural elements was already pointed. It is thus questionable if the current form section on non-structural components can be reduced to critical non-structural components to reduce overall form length.
Table 2 shows a detailed comparison of the features of the assessment form based on the GEM Building Taxonomy v2.0 vs. the local form used in Mexico. A significant advantage of the paper form based on the GEM Building Taxonomy v2.0 is the direct integration in the GEM environment. Any assessment completed with the IDCT tool produces outputs that are consistent with the data required for the GEM exposure and consequences databases, and thus directly usable by any software and tool developed by the GEM community [(Global Earthquake Model (GEM), 2014)]. Interested readers about the possibilities of GEM tools are directed to The OpenQuake-engine User Manual [(Global Earthquake Model (GEM), 2018b)] as well as the OpenQuake Risk Modeler's Toolkit–User Guide [(Global Earthquake Model (GEM), 2018a)]. The broad terminology of GEM Building Taxonomy gives high flexibility in attribute definitions. The scope goes beyond the building industry and is transferable for loss calculation and estimation for the insurance industry.
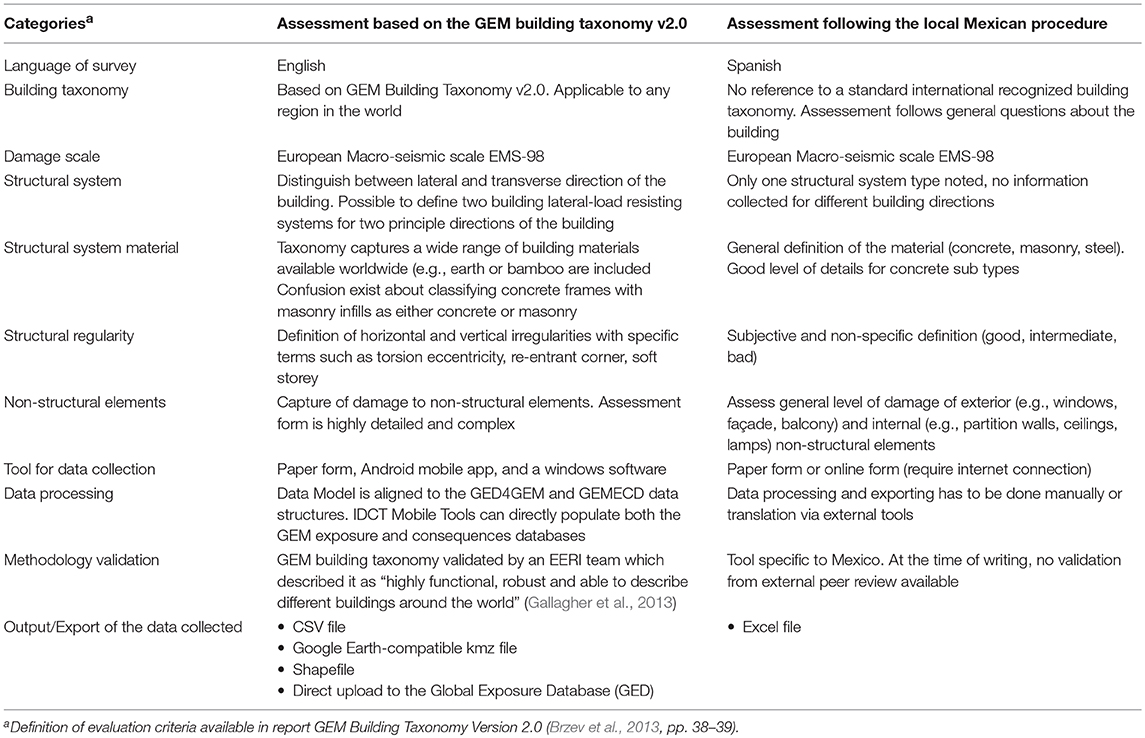
Table 2. Comparison of the GEM assessment methodology vs. the local Mexican procedure.
Reconnaissance Mission in Mexico City
The 2017 Puebla Earthquake
On Tuesday, 19 September 2017, at 13:14 p.m. local time (18:14:38 UTC) a Mw 7.1 earthquake struck the central part of Mexico [(United States Geological Survey (USGS)., 2017)]. The 2017 Puebla earthquake occurred on the anniversary of the devastating 1985 Michoacán earthquake. The Puebla earthquake is an intraplate earthquake that started at an intermediate epicentral depth of 48.0 km. The epicenter was located 12 km to the southeast of Axochiapan between the states of Morelos and Puebla [(United States Geological Survey (USGS)., 2017)]. The most affected regions are the rural areas of Puebla and Morelos and the urban area of Mexico City. The death toll was 369, 38 buildings collapsed, and more than 3,000 buildings suffered damage (McDonnell et al., 2017; Ortega, 2017; Munich, 2018) making the Puebla earthquake the fifth largest natural catastrophe in 2017 with 6 billion USD$ of overall losses (Munich, 2018).
The authors are part of a New Zealand team that assessed building damage in Mexico in October 2017. The survey covered the neighborhoods of La Condesa and Roma as well as the southern part of Mexico City. The team observed damage from minor cracks up to total collapse. The NZ team actively worked with locals teams including students and professors from the UAM Azcapotzalco (Roeslin et al., 2018).
Damage Data Collection by Teams From Mexico
Following the Puebla earthquake, the Mexican government mandated engineers and architects from the Mexican college of civil engineers [Colegio de Ingenieros Civiles de México (CICM)] and the Mexican society of structural engineering [Sociedad Mexicana de Ingeneria Estructural (SMIE)] to assess the extent of damage in the city. The assessors used the evaluation form from the Secretariat of Civil Protection of Mexico City (Luciano Fernandez, personal communication). The objective of the assessment was to evaluate if a building presented any threat to its occupant and the public. If inspectors deemed the building unsafe, a further detailed inspection is requested. Buildings were classified into lower risk, high risk, uncertain and collapsed. Findings and generated maps are published publicly [(Colegio de Ingenieros Civiles de México (CICM), 2017)].
Case Study: Calle La Morena
Building Assessment
The assessors inspected 25 buildings in the western part of Calle La Morena. These buildings formed a case study which represented a broad selection of buildings with different features and a full range of damage from no damage to total collapse. The buildings are located in the geotechnical zone III a (Órgano del Gobierno del Distrito Federal, 2004), south of the most damaged neighborhoods of La Condesa and La Roma. It was not possible to access the inside of the buildings thus the assessments were limited to exterior inspections only. Nevertheless, the exterior inspections provided meaningful data on the building characteristics and extent of damage of the structural elements. In the Calle La Morena, the building assessor assessed damage with the improved GEM paper tool. The assessor then transferred the data in a digital form using the GEM Windows tool (Jordan et al., 2014), as shown in Figure 4A. The software links the damage assessment as well as photographs taken on site to a geotagged data point. The geographical position can be exported as a kmz file (Figure 4B) or as a Shapefile. Buildings characteristics and features can be exported as a CSV file.
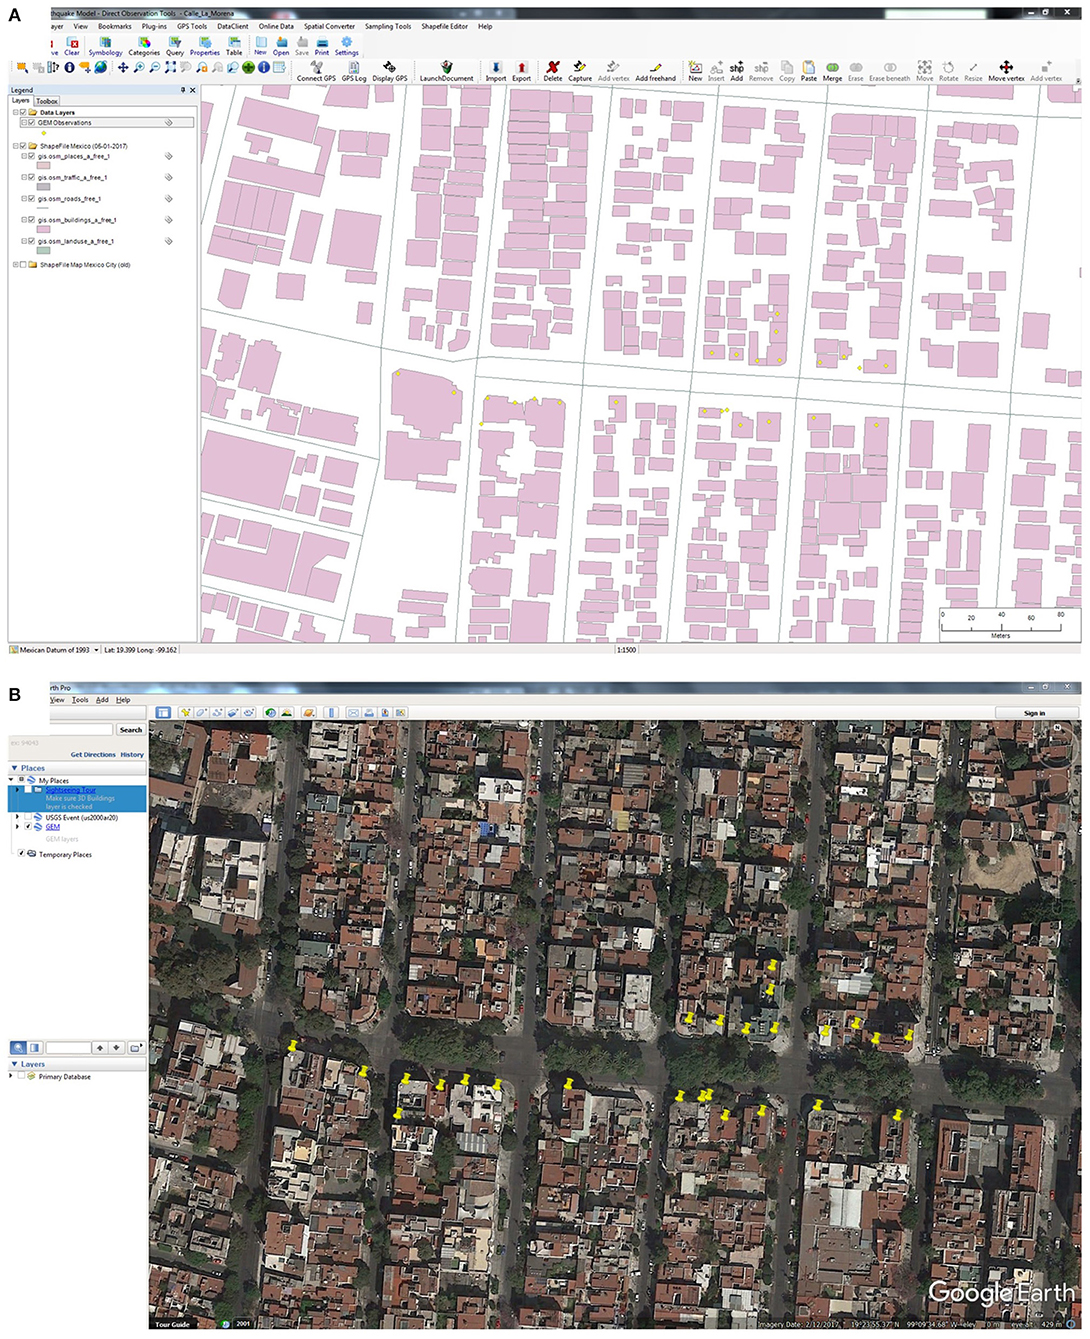
Figure 4. Screenshots of the GEM IDCT software. (A) Depicting building boundaries property as available from shape files. (B) Post earthquake assessment exported as kmz file overlayed over satellite images in Google Earth.
Statistical Findings
Figure 5 shows the overall distribution of damage grade of the assessed buildings, and the distribution as separated by number of storeys. Out of the 25 buildings assessed, 15 suffered no damage, 10 experienced at least slight damage, and 1 building collapsed. The damage scale followed EMS-98, and a consistent color code was used for all graphs in this paper. The color code ranged from beige for buildings with no damage to dark red for collapsed buildings.
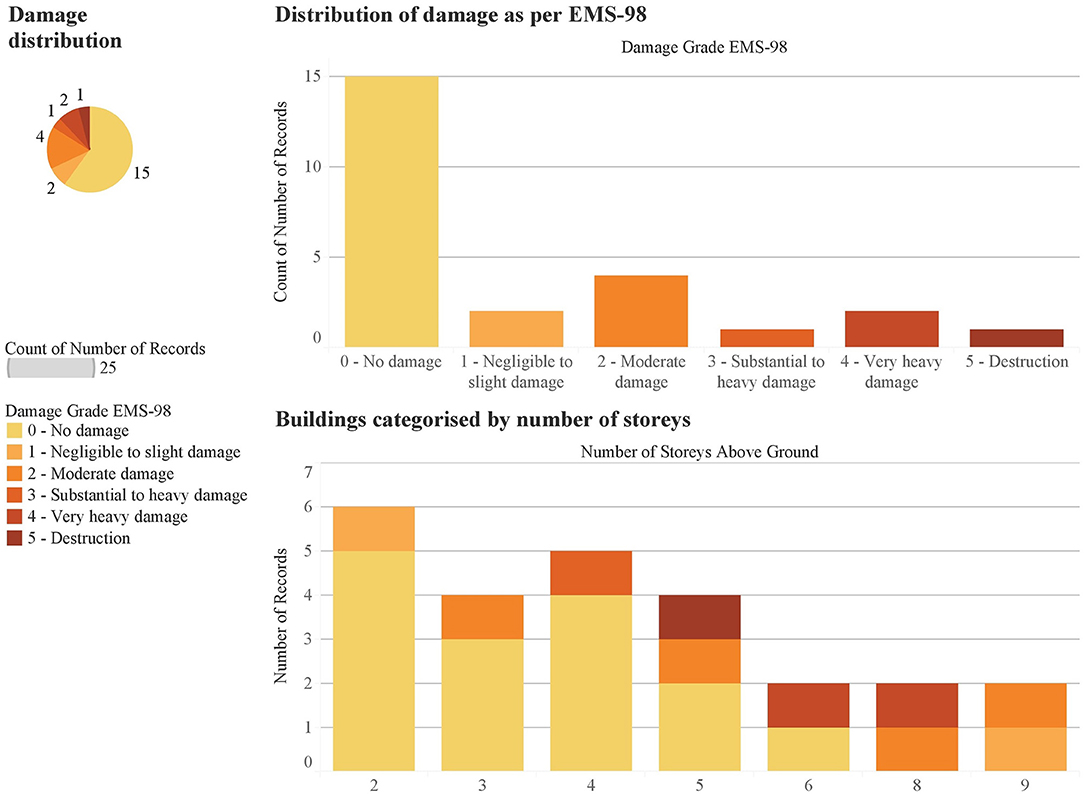
Figure 5. Distribution of damage categories for the 25 buildings studied in the street La Morena. Damage categories as per EMS-98.
Figure 6A plots the damage grade distribution separated by the number of storeys and building occupancy. It is shown that five to eight storeys building were most severely damaged. From the assessed buildings, 60% are residential (RES) and 36% are mixed-used, mostly residential and commercial (MIX1), as shown on Figure 6B. It is noteworthy that this analysis was able to show that residential units with 20–49 units were the most damaged.
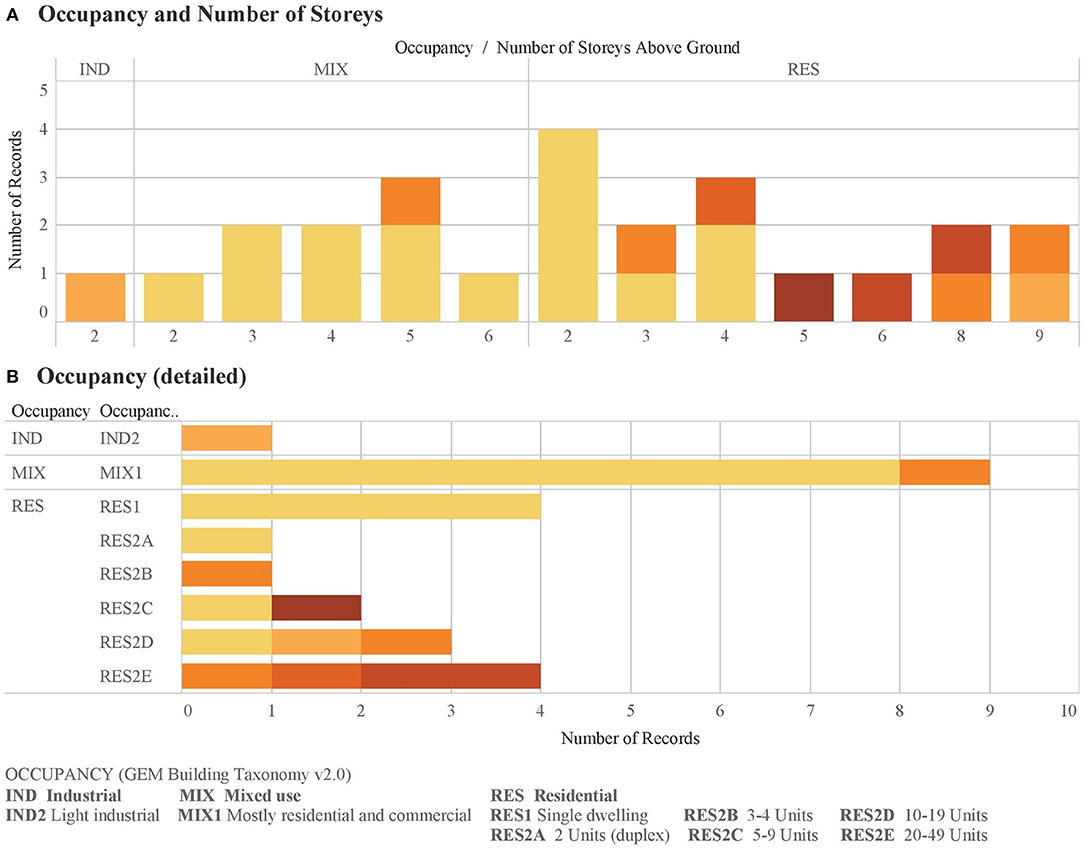
Figure 6. (A) Building categorized by occupancy and number of story. (B) Detail of the building occupancy.
The building position and building plan shape influence damage as shown in Figure 7. Buildings are classified into bins according to their plan shape and their position as per the GEM Building taxonomy definitions. Eighty-four percent of the buildings assessed were surrounded by two adjoining structures and 16% have only a building on one side. The plan shape observed in Calle La Morena Street were diverse. Overall the buildings with a solid rectangular plan suffered little or moderate damage. In contrary, H-shaped building experienced very heavy damage. Figure 8 shows the building material and the lateral load resisting system, respectively. Fifty percent of the building are concrete buildings and 10% are masonry buildings. In 40% of the cases, it was not possible to determine the material of the structural elements. It was even more challenging when attempting to identify the lateral load resisting system in the field. It was not possible to identify the lateral load resisting system of 70% of the buildings in the case study. Like other reconnaissance missions, the field assessment in Mexico City following the 2017 Puebla earthquake highlighted the difficulty in obtaining accurate classification from external observations. This is oftentimes made more difficult with the lack of official authority of scientific data collection teams and health and safety concerns. The difficulty of defining the building structural system and material of the structural elements from external observation increases the variability. This variability should be captured in the data analysis process and represented as epistemic uncertainty. One possibility to overcome the limitation of external inspections, is to access to buildings plans. For some buildings in Mexico City outside the scope of this case study, building plans and structural drawing were available. For most of these cases it was possible to determine the structural system and the material of the structural elements. This experience highlights the importance of preparation and collecting inventory data prior to a disaster, and archiving them so that the information is accessible immediately after the earthquake.
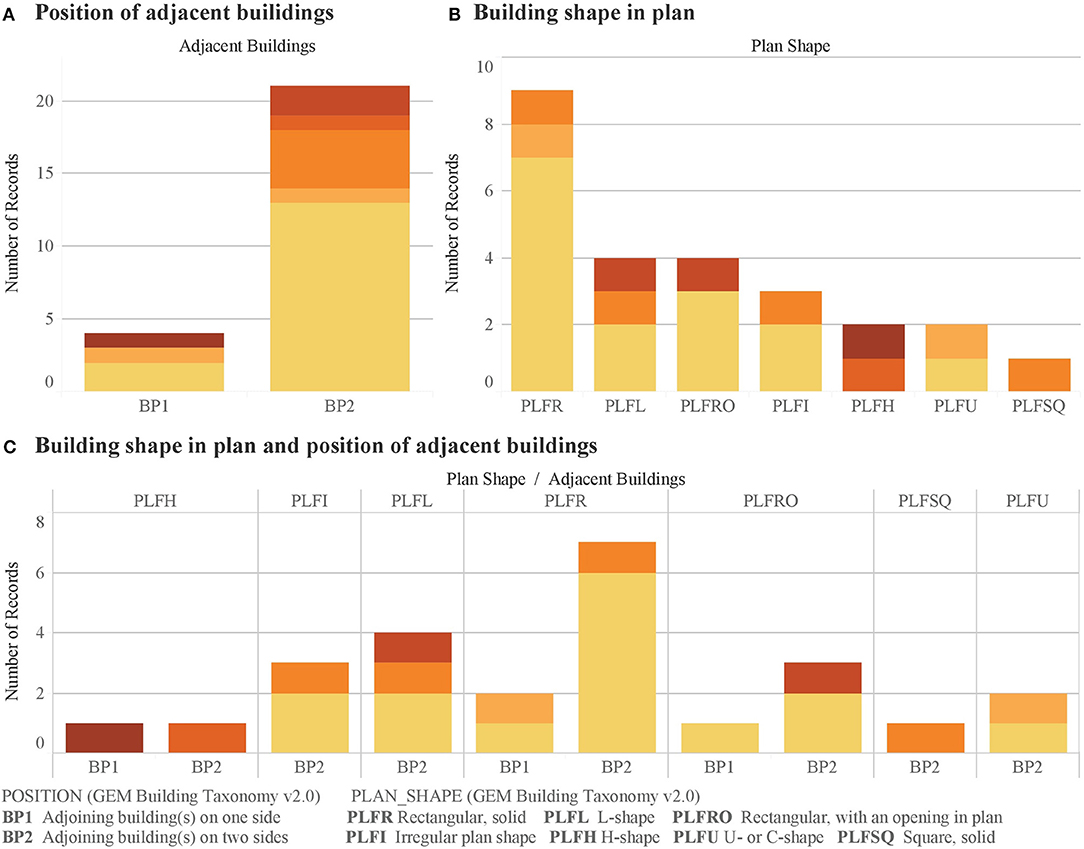
Figure 7. Dashboard showing the number of adjoining buildings and plan shape. (A) Configuration of adjoining buildings. (B) Plan shape of each building. (C) Combination of plan shape and building position.
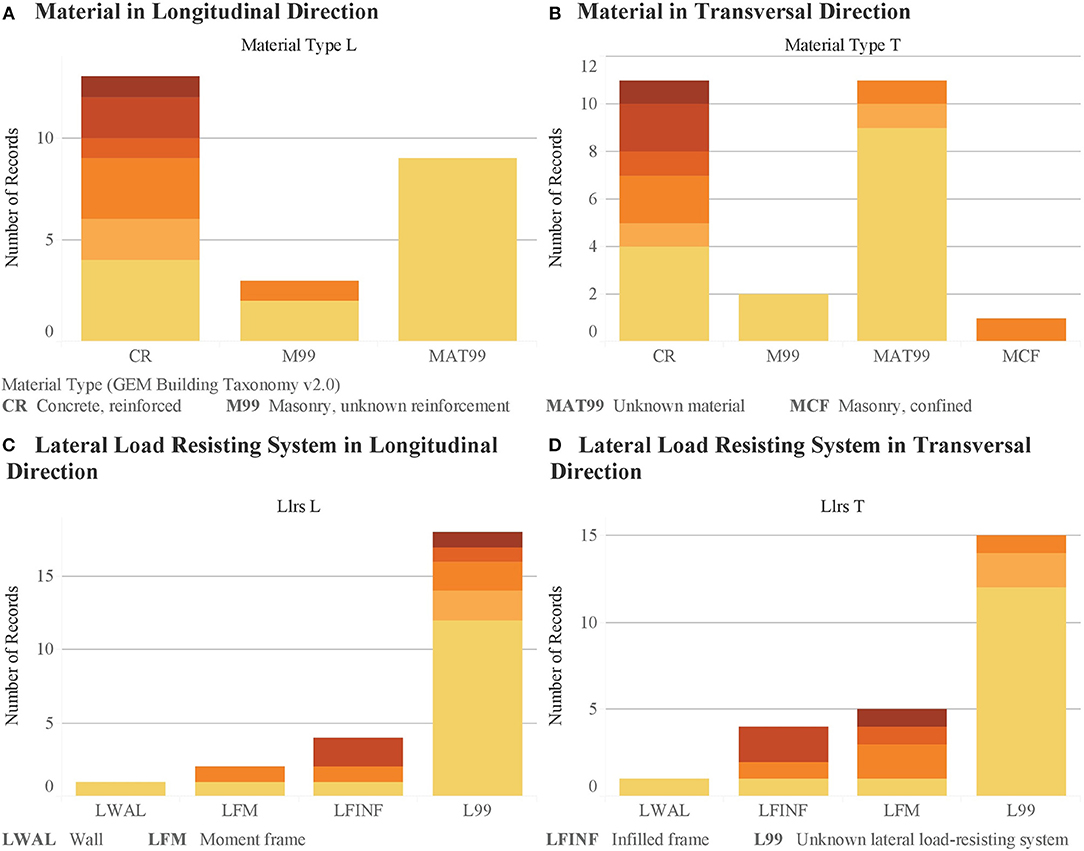
Figure 8. Dashboard showing the material and type of lateral load resisting system. Material of structural system in longitudinal direction (A) and transversal direction (B). Lateral Load Resisting system in longitudinal direction (C) and transversal direction (D).
Figure 9 shows that 40% of the structures present at least one structural irregularity (IRIR) in the vertical or horizontal plane whereas only 44% of the building were regular (IRRE) (in 16% the regularity of the structure is unknown). While regular structures experienced moderate damage or less, 30% of the irregular structures experienced moderate damage and 40% suffered substantial damage or more. Figure 10 shows the type of building irregularity observed in the vertical and horizontal directions. Two-fifth of the structures are irregular. The most common horizontal irregularity is TOR with half of the irregular buildings having torsion issues.
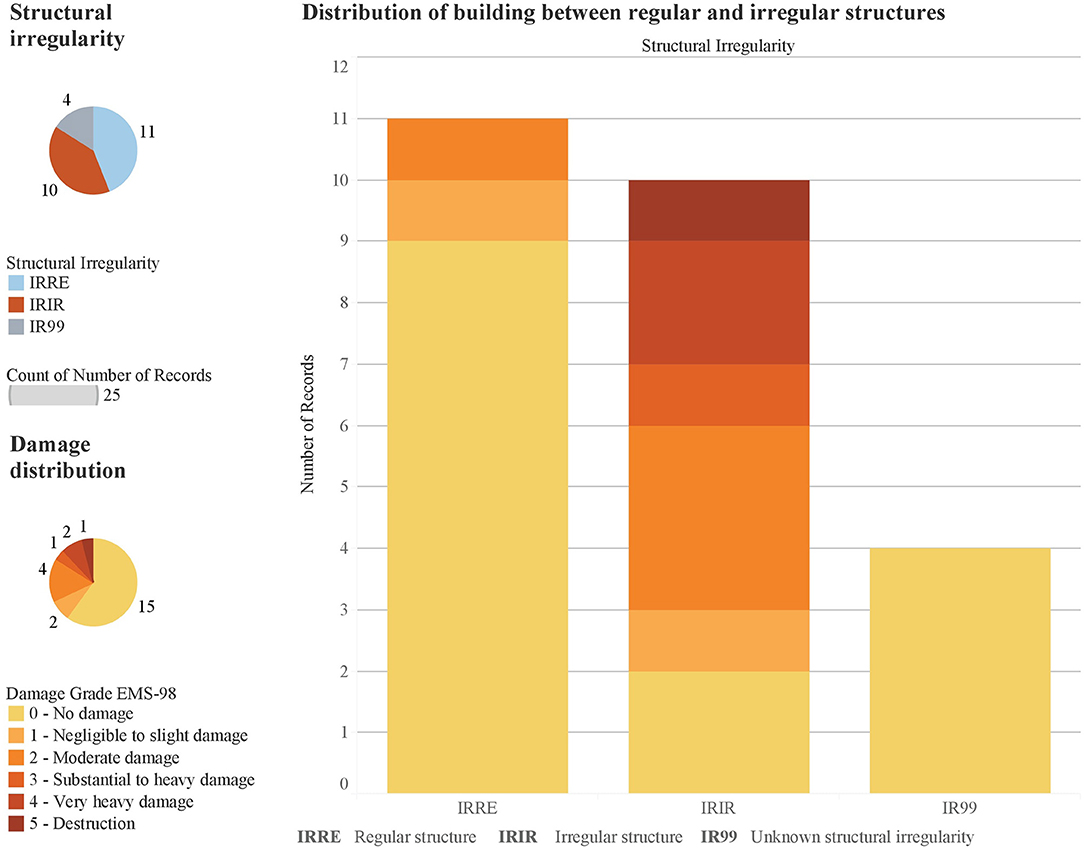
Figure 9. Dashboard showing the distribution of regular and irregular structures and the impact on the damage grade of the building.
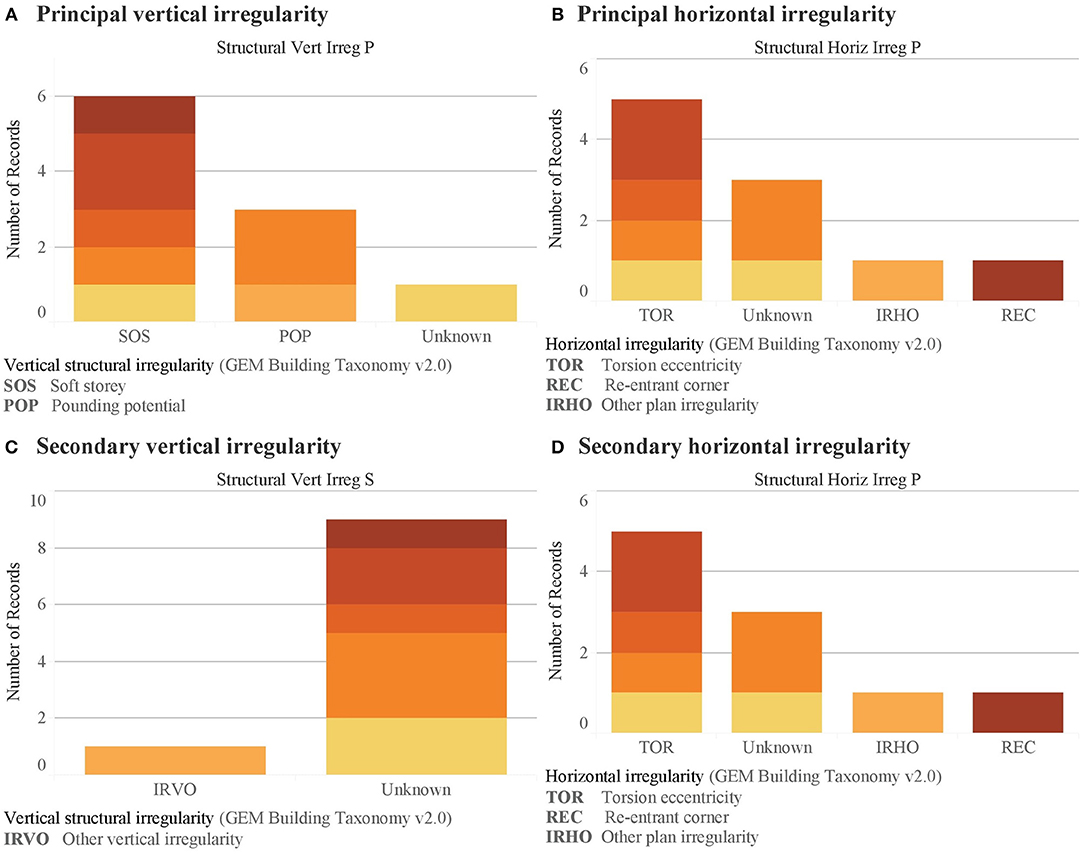
Figure 10. Dashboard showing irregularities in buildings. Principal vertical (A) and horizontal (B) irregularities. Secondary vertical (C) and horizontal irregularities.
Examples of Observed Damages
Figure 11A depicts an example of a corner building with torsion eccentricities. Buildings with substantial and heavy damage all presented problems with torsion. The collapsed building had a re-entrant corner (REC). Figure 11B shows that 30% of the vertically irregular structures experienced pounding (POP) and 60% had soft storey (SOS) failure. In fact, all heavily damaged buildings presented a soft storey. Figure 11C shows a building with a soft storey on the ground floor. In the case study, only residential buildings suffered heavy damage or more. Buildings with a residential and commercial use (often with shops located in the ground floor) were less damaged. One possible explanation lies in the structural elements of the ground floor. Where commercial facilities are present, structural elements are sized appropriately to carry the load. However, in residential buildings, the ground floor is often used as parking spaces (Figure 11C). Building designers often try to maximize the parking spot and structural design is compromised leading to fewer elements and or slender columns, to sustain the loads from the upper floors. During the assessment following the Puebla earthquake, the team saw several cases of failed columns. Assessors observed shear cracks, as exposed on Figure 12A or total column failure with buckling of the longitudinal reinforcement bars due to insufficient confinement from widely spaced stirrups (Figure 12B).
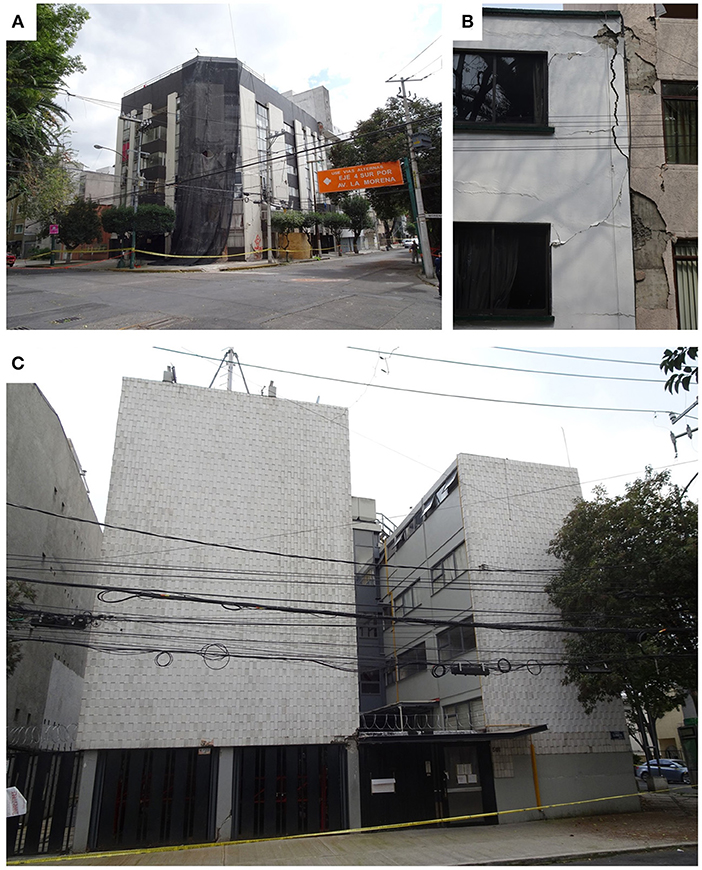
Figure 11. Damage in La Morena. (A) Corner building with torsion eccentricity. (B) Pounding failure. (C) Soft storey in the ground floor.
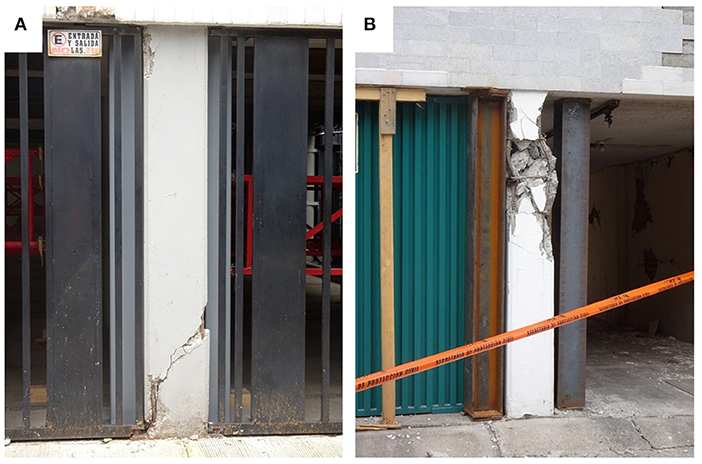
Figure 12. (A) Failure of the column in shear. (B) Buckling of the longitudinal reinforcement bars.
Learnings From the Case Study
The Calle La Morena case study highlighted the various behavior of 25 buildings located in the same geographical area even though they experienced similar seismic demand. The buildings studied were diverse by their number of storeys, structural systems, occupancy, and position in a block. Building damage ranged from no damage to total collapse of the building. Building assessors collected relevant building characteristics such as the number of storeys, the building occupancy, the position of the building, and the damage grade according to the European Macroseismic Scale EMS-98 (Grünthal, 1998). Each category has a clear structure aligned with the GEM definition. Experience gathered in the field showed that the definition of building features according to the GEM taxonomy provide consistency in the data collected. The GEM structure simplifies the universal understanding while allowing for regional specificities. This case study is of interest to understand the factors and correlation of factors leading to vulnerability. This is assisted by visualizing the damage distribution data individually by each building characteristic.
Conclusion
Modern earthquake engineering aims to reduce the impact of earthquakes on our society. Natural risks such as earthquakes only appear if a building stock is exposed and vulnerable to a natural hazard. To achieve an impactful reduction of loss and mitigating damage in our built environment it is essential to understand both the hazard and vulnerability. The vulnerability of the built environment is correlated to the behavior and performance of the building stock. Understand the deficiencies and strengths of the actual building environment whenever an earthquake affects a region is a critical part of deriving lessons for future damage mitigation. Earthquake reconnaissance missions improve damage predictions models and provide the invaluable empirical actual building performance data.
This study presented an improved post-earthquake building assessment form. It retained the flexible GEM Building Taxonomy v2.0 as a base and employed the EMS-98 for the damage definition. It introduced pictures and explanation of the damage grades within the form. The redevelopment also included a new section for collection damage information of non-structural elements. Following the 2017 Puebla earthquake in Mexico, the form was trialed on 25 buildings in Calle La Morena as a case study. The experience using the new form based on the GEM Building Taxonomy v2.0 was positive. This new form simplified the data extraction as data were easily exported into a GEM framework.
Author Contributions
SR: data collection, chart generation, writing; QM: correction and feedback; HG: logistic in Mexico.
Conflict of Interest Statement
The authors declare that the research was conducted in the absence of any commercial or financial relationships that could be construed as a potential conflict of interest.
Acknowledgments
The authors would like to thank Prof. Alonso Gómez-Bernal for his insights, comments and help during our stay in Mexico. We also thank the Universidad Autónoma Metropolitana-Azcapotzalco in Mexico City.
Supplementary Material
The Supplementary Material for this article can be found online at: https://www.frontiersin.org/articles/10.3389/fbuil.2018.00072/full#supplementary-material
Data sheet 1. Paper form for Building Seismic Assessment based on GEM Building Taxonomy v2.
Data sheet 2. Form for assessment of non-structural elements based on Taghavi and Miranda (2003).
Data sheet 3. Building damage assessment form developed at UAM Azcapotzalco by Dr. Alonso Gómez-Bernal.
Image 1. Seismic record station CJ04, zone III b, soft soil.
Image 2. Seismic record station ES57, zone II – transition zone.
Image 3. Seismic record station SI53, zone III a – soft soil.
References
Allen, L., Brzev, S., Charleson, A. W., Scawthorn, C., and Silva, V. (2015). “GEM building taxonomy – an open global building classification system,” in 2015 NZSEE Conference (Wellington).
Allen, L., Charleson, A., Brzev, S., and Scawthorn, C. (2013). Glossary for GEM Taxonomy. Available online at: https://taxonomy.openquake.org/
Applied Technology Council (ATC) (1996a). ATC-32 Improved Seismic Design Criteria for California Bridges: Provisional Recommendations.
Applied Technology Council (ATC) (1996b). ATC-40 Seismic Evaluation and Retrofit of Concrete Buildings, Vol. 1, 612.
Applied Technology Council (ATC) (1997). FEMA 273, NEHRP Guidelines for the Seismic Rehabilitation of Buildings.
Baggio, C., Bernardini, A., Colozza, R., Corazza, L., Bella, M., Di Pasquale, G., et al. (2007). Field Manual for Post-Earthquake Damage and Safety Assessment and Short Term Countermeasures (AeDES). JRC Scientific and Technical Reports, 1–100.
Bolton, P., Russell, J. E., Stratta, J. L., and Weis-taylor, P. (1995). ATC-20-2 Addendum to the ATC-20 Postearthquake Building Safety Evaluation Procedures.
Borg, R. P., Indirli, M., Rossetto, T., and Kouris, L. A. (2010). “L'Aquila earthquake April 6th, 2009: the damage assessment methodologies,” in COST ACTION C26: Urban Habitat Constructions Under Catastrophic Events - Proceedings of the Final Conference (Naples), 557–564.
Broccardo, M., Esposito, S., and Stojadinovic, B. (2016). “Application of the PEER-PBEE framework for probabilistic resilience assessment of a structural system,” in International Symposium on Sustainability and Resiliency of Infrastructure (Taipei).
Brzev, S., Scawthorn, C., Charleson, A., Allen, L., Greene, M., Jaiswal, K., et al. (2013). GEM Building Taxonomy Version 2.0. Pavia: GEM Foundation.
Burton, H. V., Deierlein, G., Lallemant, D., and Lin, T. (2016). Framework for incorporating probabilistic building performance in the assessment of community seismic resilience. J. Struct. Eng. 142:C4015007. doi: 10.1061/(ASCE)ST.1943-541X.0001321
Cattari, S., Ottonelli, D., Pinna, M., Lagomarsino, S., Clark, W., Giovinazzi, S., et al. (2015). “Preliminary results from damage and vulnerability analysis of URM churches after the Canterbury earthquake sequence 2010-2011,” in New Zealand Society for Earthquake Engineering Conference—NZSEE, 10 (Rotorua).
Colegio de Ingenieros Civiles de México (CICM) (2017). Sismo 19 de Septiembre. Available online at: https://www.sismosmexico.org/ (Accessed May 31, 2018).
Cornell, C. A., and Krawinkler, H. (2000). Progress and challenges in seismic performance assessment. PEER Center News. Available online at: http://www3.nd.edu/~linbeck/krawinkler.htm
Cutfield, M. R. (2015). Advanced Methods for Performance-Based Seismic Loss Assessment and Their Application to a Base Isolated and Conventional Office Building. Department of Civil & Environmental Engineering, The University of Auckland. Available online at: http://hdl.handle.net/2292/27716
Del Gaudio, C., Ricci, P., Verderame, G. M., and Manfredi, G. (2017). Urban-scale seismic fragility assessment of RC buildings subjected to L'Aquila earthquake. Soil Dyn. Earthquake Eng. 96, 49–63. doi: 10.1016/j.soildyn.2017.02.003
Dhakal, R. (2011). Structural Design for Earthquake Resistance Past, Present and Future. Report to the Canterbury Earthquake Royal Commission. Available online at: http://www.rebuildchristchurch.co.nz/blog/2012/11/canterbury-royal-comission-technical-report-structural-design-for-earthquake-resistance-past-present-and-future
Earthquake Engineering Research Institute (EERI) and International Association for Earthquake Engineering (IAEE) (2000). World Housing Encyclopedia (WHE). Available online at: http://www.world-housing.net/ (Accessed March 19, 2018).
FEMA (2000). Prestandard and Commentary for the Seismic Rehabilitation of Buildings. Rehabilitation Requirements.
Ferrari, G., and Mcconnell, A. (2005). Robert Mallet and the “Great Neapolitan earthquake” of 1857. Notes Rec. R. Soc. 59, 45–64. doi: 10.1098/rsnr.2004.0076
Fikri, R., Dizhur, D., Walsh, K., and Ingham, J. (2018). Seismic performance of Reinforced Concrete Frame with Masonry Infill buildings in the 2010/2011 Canterbury, New Zealand earthquakes. Bull. Earthquake Eng. 1–21. doi: 10.1007/s10518-018-0476-8
Foulser-Piggott, R., Bevington, J., and Vicini, A. (2014). End-to-End Demonstration of the Inventory Data Capture Tools. GEM Technical Report 2014-06 V1.0.0, GEM Foundation, Pavia. doi: 10.13117/GEM.DATA-CAPTURE.TR2014.06
Foulser-Piggott, R., Vicini, A., Verrucci, E., Bevington, J., and Shelley, W. (2013). IDCT Mobile Tools – Field Test Reports, GEM Foundation.
Friedman, L. R., Officer, P., Bruce, R. A., Christensen, T. M., Hanson, R. D., Ross, A. E., et al. (1989). ATC-20 Procedures for Postearthquake Safety Evaluation of Buildings.
Gallagher, H., Farmer, B., Mendoza, C., Lee, C., Dickson, H., and Greene, M. (2013). GEM Building Taxonomy Testing and Evaluation. GEM Building Taxonomy Global Component.
Global Earthquake Model (GEM) (2013). GitHub - GEM Direct Observation Tools for Android. Available online at: https://github.com/gem/DirectObservationToolsForAndroid (Accessed May 10, 2018).
Global Earthquake Model (GEM) (2014). OpenQuake - Getting started. Available online at: https://www.globalquakemodel.org/oq-getting-started (Accessed May 31, 2018).
Global Earthquake Model (GEM) (2015). South America Risk Assessment (SARA) Project. Available online at: https://sara.openquake.org/ (Accessed September 15, 2018).
Global Earthquake Model (GEM) (2018a). OpenQuake Risk Modeller's Toolkit - User Guide. Available online at: https://docs.openquake.org/oq-irmt-qgis/v3.1.0/#
Global Earthquake Model (GEM) (2018b). The OpenQuake-engine User Manual. Global Earthquake Model (GEM) Open-Quake Manual for Engine version 3.0.1. Pavia: GEM Foundation.
Gomez-Bernal, A. (2017). Formato Para Levantamiento de Edificios. Available online at: http://estructuras.azc.uam.mx/formatoSismo.html
Gunay, M., and Mosalam, K. (2012). PEER performance based earthquake engineering methodology, revisited. J. Earthquake Eng. 17, 829–858. doi: 10.1080/13632469.2013.787377
Hansson, S. O. (2014). “Risk,” in The Stanford Encyclopedia of Philosophy, ed E. N. Zalta (Metaphysics Research Lab, Stanford University). Available online at: https://plato.stanford.edu/archives/spr2014/entries/risk/
Jaiswal, K. S., and Wald, D. J. (2008). Creating a Global Building Inventory for Earthquake Loss Assessment and Risk Management, Vol. 1160. USGS.
Jones, L. (2014). Lucy Jones Advises LA on Resiliency and ‘The Big One.’ The Planning Report. Available online at: https://www.planningreport.com/2014/11/07/lucy-jones-advises-la-resiliency-and-big-one
Jordan, C. J., Adlam, K., Laurie, K., Shelley, W., and Bevington, J. (2014). User Guide: Windows Tool for Field Data Collection and Management. GEM Technical Report, 60.
Juarez Garcia, H., Bernal, G., Arellano Mendez, E., and Sordo Zabay, E. (2004). “Seismic vulnerability assessment for Colonia Roma in Mexico City,” in 13th World Conference on Earthquake Engineering (Vancouver, BC).
Kiureghian, A. D. (2005). Non-ergodicity and PEER's framework formula. Earthquake Eng. Struct. Dyn. 34, 1643–1652. doi: 10.1002/eqe.504
Krawinkler, H. (2005). Van Nuys Hotel Building Testbed Report: Exercising Seismic Performance Assessment. PEER Report 2005/11. Berkeley, CA: University of California, Berkeley.
Lallemant, D. (2017). “Natural Hazards, Un-natural Disasters” – On Hurricane Irma, Harvey and Others. Available online at: http://david-lallemant.com/natural-hazards-un-natural-disasters-hurricane-irma-harvey-others/ (Accessed May 25, 2018).
Mallet, R. (1862). Great Neapolitan Earthquake of 1857 - The First Principles of Observational Seismology. London: Chapman and Hall London.
McDonnell, P. J., Vives, R., and Linthicum, K. (2017). At least 3,000 buildings found damaged in Mexico City as search narrows for earthquake's last possible survivors. LA Times. Available online at: http://www.latimes.com/world/mexico-americas/la-fg-mexico-earthquake-mainbar-20170922-story.html
Mitrani-Reiser, J. (2007). An Ounce of Prevention: Probabilistic Loss Estimation for Performance-Based Earthquake Engineering. California Institute of Technology. Available online at: http://thesis.library.caltech.edu/2207/
Monfort, D., Lantada, N., Goula, X., Barbat, A. H., Negulescu, C., Pujades, L., et al. (2011). “Generación de escenarios de riesgo sísmico en una zona transfronteriza del Pirineo,” in Congreso Nacional de Ingeniería Sísmica, 1–9. Available online at: http://hdl.handle.net/2117/14832
Munich, R. E. (2018). The Five Largest Natural Catastrophes in 2017. Munich. Available online at: https://www.munichre.com/en/media-relations/publications/press-releases/2018/2018-01-04-press-release/index.html
NZSEE (2009). Guidelines for Building Safety Evaluation During a State of Emergency. New Zealand Society for Earthquake Engineering (NZSEE).
Órgano del Gobierno del Distrito Federal (2004). Gaceta oficial del Distrito Federal - Normas Técnicas Complementarias para Diseño por Sismo. Mexico City. Available online at: http://www.smie.org.mx/informacion-tecnica/normas-tecnicas-complementarias.php
Ortega, A. (2017). La CDMX con heridas en mas 500 edificaciones. Expansion (Martes, 26 de septiembre 2017). Available online at: https://expansion.mx/nacional/2017/09/26/la-cdmx-con-heridas-en-mas-500-edificaciones
Oxford Dictionaries (2018). Definition of Risk. Available online at: https://en.oxforddictionaries.com/definition/risk
Poland, C. D., Hill, J., Sharpe, R. L., and Soulages, J. (1995). Vision 2000: Performance Based Seismic Engineering of Buildings. Structural Engineers Association of California. Available online at: https://books.google.co.nz/books?id=8NlMNAAACAAJ&source=gbs_navlinks_s
Porter, K. (2003). “An overview of PEER's performance-based earthquake engineering methodology,” in Ninth International Conference on Applications of Statistics and Probability in Civil Engineering (ICASP9) (San Francisco, CA: Civil Engineering Risk and Reliability Association (CERRA)), 973–980. Available online at: http://spot.colorado.edu/~porterka/Porter-2003-PEER-Overview.pdf
Porter, K. (2005). A Taxonomy of Building Components for Performance-Based Earthquake Engineering. Civil Engineering. Available online at: http://citeseerx.ist.psu.edu/viewdoc/download?doi=10.1.1.90.1198&rep=rep1&type=pdf
Porter, K. (2018). A beginner's guide to fragility, vulnerability, and risk. University of Colorado Boulder and SPA Risk LLC, Denver CO.
Roeslin, S., Elwood, K. J., Juarez-Garcia, H., Gomez-Bernal, A., and Dhakal, R. P. (2018). “The September 19th, 2017 Puebla, Mexico Earthquake,” Paper presented at NZSEE 2018; New Zealand Society for Earthquake Engineering Annual Conference (Auckland), 1–10.
Rojahn, C., Heintz, J. A., Hortacsu, A., and McLane, T. (2015). FEMA P-154 Rapid Visual Screening of Buildings for Potential Seismic Hazards: A Handbook. Applied Technology Council.
Rojahn, C., Sharpe, R. L., Scholl, R. E., Kiremidjian, A. S., and Nutt, R. V. (1985). ATC-13 Earthquake Damage Evaluation Datas for California. Redwood City, CA: Applied Technology Council.
Rosser, J., Morley, J. G., and Vicini, A. (2014). User Guide: Android Mobile Tool for Field Data Collection. GEM Technical Report, 26.
Silva, V., Crowley, H., Jaiswal, K., Acevedo, A. B., Pittore, M., and Journey, M. (2018). “Developing a global earthquake risk model,” in 16th European Conference on Earthquake Engineering (Thessaloniki).
Stirling, M. W., Gerstenberger, M. C., Goded, T., and Ries, W. (2015). Macroseismic Intensity Assessment for the M6.2 2011 Christchurch Earthquake. GNS Science.
Taghavi, S., and Miranda, E. (2003). Response Assessment of Nonstructural Building Elements. Pacific Earthquake Engineering Research Center.
The Graduate Center CUNY (2001). Great Fire of 1835 - Aftermath. Available online at: https://virtualny.ashp.cuny.edu/FIRE/damages.html (Accessed July 24, 2018).
The US National Archives and Records Administration (2017). San Francisco Earthquake, 1906. Available online at: https://www.archives.gov/legislative/features/sf (Accessed May 5, 2018)
United States Geological Survey (USGS). (2017). M 7.1 - 1km E of Ayutla, Mexico. Available online at: https://earthquake.usgs.gov/earthquakes/eventpage/us2000ar20#executive (Accessed March 23, 2017).
Wieland, M., Pittore, M., Parolai, S., Begaliev, U., Yasunov, P., Tyagunov, S., et al. (2015). A multiscale exposure model for seismic risk assessment in Central Asia. Seismol. Res. Lett. 86, 210–222. doi: 10.1785/0220140130
Yang, T. Y. (2013). “Assessing seismic risks for new and existing buildings using performance-based earthquake engineering (PBEE) methodology,” in Handbook of Seismic Risk Analysis and Management of Civil Infrastructure Systems. (Woodhead Publishing), 307–333. doi: 10.1533/9780857098986.3.307
Keywords: seismic damage assessment, 2017 Puebla earthquake, building damage, seismic assessment forms, Global Earthquake Model (GEM), European Macroseismic Scale EMS-98
Citation: Roeslin S, Ma QTM and García HJ (2018) Damage Assessment on Buildings Following the 19th September 2017 Puebla, Mexico Earthquake. Front. Built Environ. 4:72. doi: 10.3389/fbuil.2018.00072
Received: 27 July 2018; Accepted: 16 November 2018;
Published: 04 December 2018.
Edited by:
Sean Wilkinson, Newcastle University, United KingdomReviewed by:
Michele Palermo, Università degli Studi di Bologna, ItalyLuigi Di Sarno, University of Sannio, Italy
Copyright © 2018 Roeslin, Ma and García. This is an open-access article distributed under the terms of the Creative Commons Attribution License (CC BY). The use, distribution or reproduction in other forums is permitted, provided the original author(s) and the copyright owner(s) are credited and that the original publication in this journal is cited, in accordance with accepted academic practice. No use, distribution or reproduction is permitted which does not comply with these terms.
*Correspondence: Samuel Roeslin, cy5yb2VzbGluQGF1Y2tsYW5kLmFjLm56