 Kaiqi Lin1
 Xinzheng Lu
- 1College of civil engineering, Fuzhou University, Fuzhou, China
- 2Beijing Engineering Research Center of Steel and Concrete Composite Structures, Tsinghua University, Beijing, China
- 3Key Laboratory of Urban Security and Disaster Engineering of Ministry of Education, Beijing University of Technology, Beijing, China
Research on multi-hazard prevention and mitigation in building structures is the most recent developing trend in civil engineering. In this study, an analytical model is proposed to calculate the structural resistance of a type of multi-hazard resilient prefabricated concrete (MHRPC) frame under earthquake and column removal scenarios. The MHRPC frame is assembled using prefabricated RC beams and columns, unbonded post-tensioning (PT) tendons, energy-dissipating steel angles, and large rotational shear plates. According to the experimental results, the MHRPC frame exhibits the features of low damage and self-centering under seismic loading. Meanwhile, when subjected to column removal scenarios, the MHRPC frame is proven to demonstrate a high progressive collapse resistance. In order to calculate the seismic and progressive collapse resistance of the MHRPC frame, analytical models for the critical components in the MHRPC frame (PT tendons and steel angles) are compared and selected based on the experimental results and numerical simulations. Furthermore, calculation methods for the seismic and progressive collapse resistance of the MHRPC frame specimens are proposed. The calculation results are validated using the experimental results. This study could provide a reference for the design of MHRPC frame structures, considering both earthquake and progressive collapse.
Introduction
Over the past several years, increased attention has been paid to multi-hazard mitigation and prevention of building structures in the engineering community. Li et al. (2011) reviewed the state-of-art research on the multi-hazard from the perspective of (1) damages and loses, (2) assessment of effects, and (3) design and mitigation strategies. The importance of life-cycle and multi-hazard design are highlighted. Gidaris et al. (2017) reviewed the multi-hazard fragility and restoration models of highway bridges for the risk and resilience assessment of regional portfolios and transportation networks. Kamath et al. (2015) and Shah et al. (2016) evaluated the residual lateral resistance of a two-story RC frame after the post-earthquake fire. The effectiveness of ductile detailing in improving the structural residual strength is validated. A multi-hazard resistant bridge pier considering earthquake and explosion load is proposed and experimentally tested by Fujikura et al. (2008). ElSayed et al. (2015) suggested the layout of seismically detailed reinforcement in concrete-block shear walls for resisting the blast load. For the most commonly constructed multi-story RC frame structures, numerous existing studies have proven that earthquake-induced collapse and progressive collapse starting from a local failure are the major failure modes of multi-story RC frames (Sozen et al., 1998; Lu et al., 2012). Hence, increasing the resistance capacity of seismic and progressive collapse is critical for improving the safety margin and collapse resistance of RC frames.
Progressive collapse of a building structure refers to the disproportionate chain collapse action of a structure, initiated by a small and localized failure that may be caused by fire, explosion or overloading (Ellingwood, 2006). A typical progressive collapse example of an RC frame is the 1995 bombing of the Murrah Federal Building in Oklahoma City (Sozen et al., 1998). Thereafter, numerous countries published progressive collapse design requirements for RC frames.
In fact, the seismic and progressive collapse designs for RC frames vary significantly in terms of the design methodology. Seismic design aims to resist a system-level lateral load and realize a “strong-column-weak-beam” failure mode under an earthquake. Hence, the seismic resistance of frame columns is critical to the seismic performance of an RC frame. In contrast, progressive collapse design needs to bridge local unbalanced vertical loads by enhancing lateral components to redistribute the unbalanced gravity load, and avoiding the initial failure propagation. According to Lin et al. (2017), an RC frame with a relatively low seismic design intensity can hardly meet the requirements of progressive collapse design, and its beams should be strengthened to prevent progressive collapse. However, after the progressive collapse design, it is found that newly added progressive collapse reinforcements in the beams may lead to an unfavorable “strong-beam-weak-column” failure mode, which will, in turn, weaken the structural seismic performance.
In order to improve the seismic and progressive collapse resistance of newly-designed RC frame structures simultaneously, a novel multi-hazard resilient prefabricated concrete (MHRPC) frame, incorporating a series of high-performance components, namely post-tensioning (PT) tendons, energy-dissipating steel angles, and shear plates, is proposed, as illustrated in Figures 1A,B (Lin et al., in press). Furthermore, the seismic and progressive collapse performance of the newly proposed MHRPC frame was experimentally compared with a conventional RC frame by means of seismic cyclic tests of beam-column joint specimens and progressive collapse tests of two-span substructures, as illustrated in Figures 1C,D. The test setups are shown in Figure 1E. The results indicate that, compared to the conventional RC frame, the MHRPC frame specimen exhibits substantially smaller residual deformations and less component damage following the seismic cyclic test. During the progressive collapse test, the MHRPC specimen exhibits a significantly higher progressive collapse resistance than the conventional RC specimen, and meets the chord rotational capacity requirement as stipulated in Department of Defense (2016), which demonstrates superior progressive collapse resistance. It is concluded that the MHRPC frame system provides a satisfying solution for improving the seismic and progressive collapse resistance of RC frame.
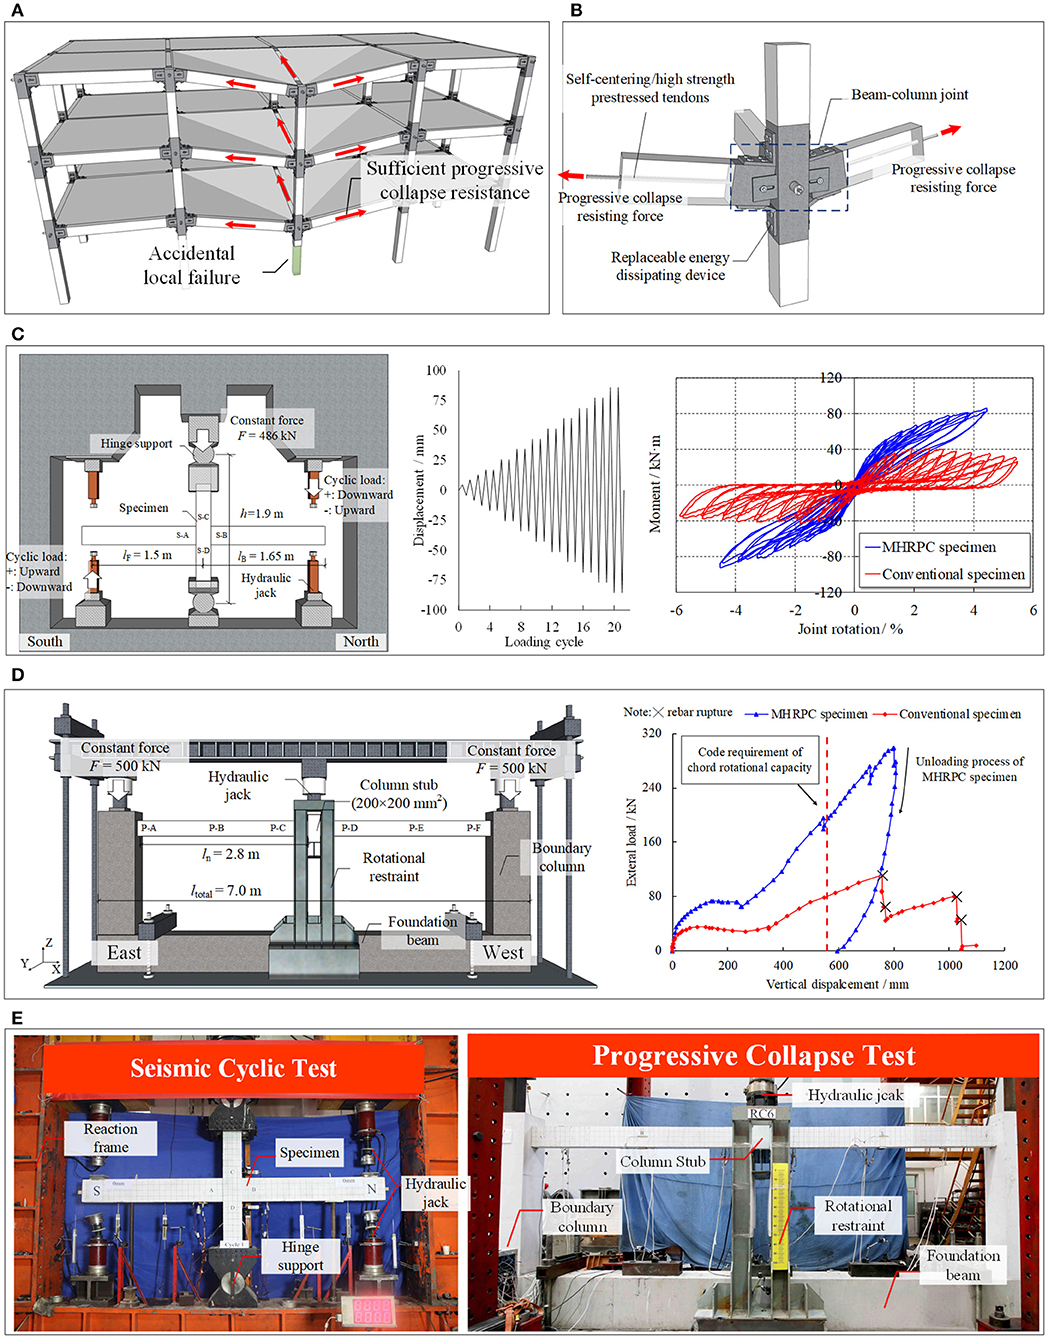
Figure 1. Schematic and test results of the MHRPC frame. (A) Deformation of MHRPC frame under column removal scenario. (B) Details of beam-column joint. (C) Comparison of the seismic cyclic performance between MHRPC and conventional RC frames. (D) Comparison of the progressive collapse performance between MHRPC and conventional RC frames. (E) Test setups (Lin et al., in press).
Although many experimental, numerical, and analytical studies have been conducted on the earthquake resilient RC structures (Priestley and Tao, 1993; Wolski et al., 2009; Gerami et al., 2013; Fakharifar et al., 2014; Gerami and Sivand-Pour, 2014; Song et al., 2014, 2015; Lu et al., 2015). Limited work has been reported on the progressive collapse performance of this type of structures. Moreover, existing analytical models for the progressive collapse resistance calculation are only suitable for conventional RC frames (Yi et al., 2008; Lu et al., 2018). Note that the proposed MHPRC frame is comprised of a series of high-performance components, the resistance contribution of different components needs to be quantified under both earthquake and column removal scenarios. Hence, it is necessary to propose an accurate and easy-to-implement analytical model for the seismic and progressive collapse designs of the MHRPC frame system.
Based on the experimental results, an analytical model is proposed in this study to calculate the structural resistance of the MHRPC frame, considering earthquake and column removal scenarios analytically. The results are compared to the experimental ones and exhibit strong agreement. This study could provide a reference for the design of multi-hazard resilient RC frame structures.
Resistance Contributions of Key Components in MHRPC Frame
Seismic Cyclic Test
According to Lin et al. (in press), the measurement results of the PT tendons and steel angles in the seismic cyclic tests are illustrated in Figure 2. The results indicate that the tendon force increased as the joint rotation amplitude increased (Figure 2A). Meanwhile, the steel angles were found to yield, and dissipated energy once the joint rotation reached 1.6% (Figure 2B). Compared to the steel angles, the shear plates remained elastic during the seismic cyclic tests (Lin et al., in press).
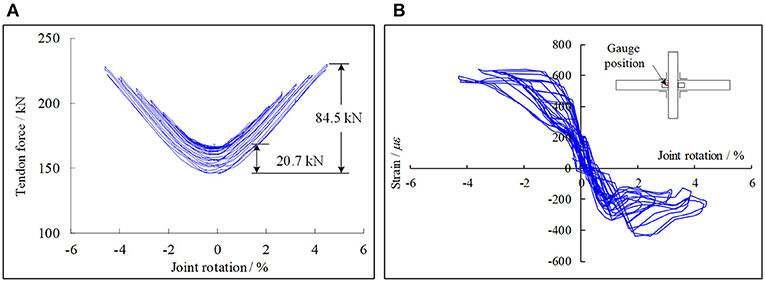
Figure 2. Measurement results of seismic cyclic test. (A) Tendon force. (B) Angle strain (Lin et al., in press).
Progressive Collapse Test
The measurement results of the PT tendons, steel angles, and shear plates in the progressive collapse test are illustrated in Figure 3. According to the experimental observations of Lin et al. (in press), the loading process of the MHRPC specimen can be divided into the beam mechanism and catenary mechanism stages. During the beam mechanism stage, progressive collapse resistance is provided by the compressive arch action (CAA) and flexural capacities of the beams. The displacement corresponding to the peak resistance at this stage is defined as Db as shown in Figure 3B. During the catenary mechanism stage, the progressive collapse resistance originates from the catenary force of the PT tendons and steel angles. The displacement corresponding to code required chord rotation (i.e., 0.20 rad) is defined as D0.20 as shown in Figure 3B (Department of Defense, 2016). According to the strain gauge reading on the shear plate, the shear plate acts as a cantilever beam and resists the shear force transferred from the bolt during the test (Lin et al., in press).
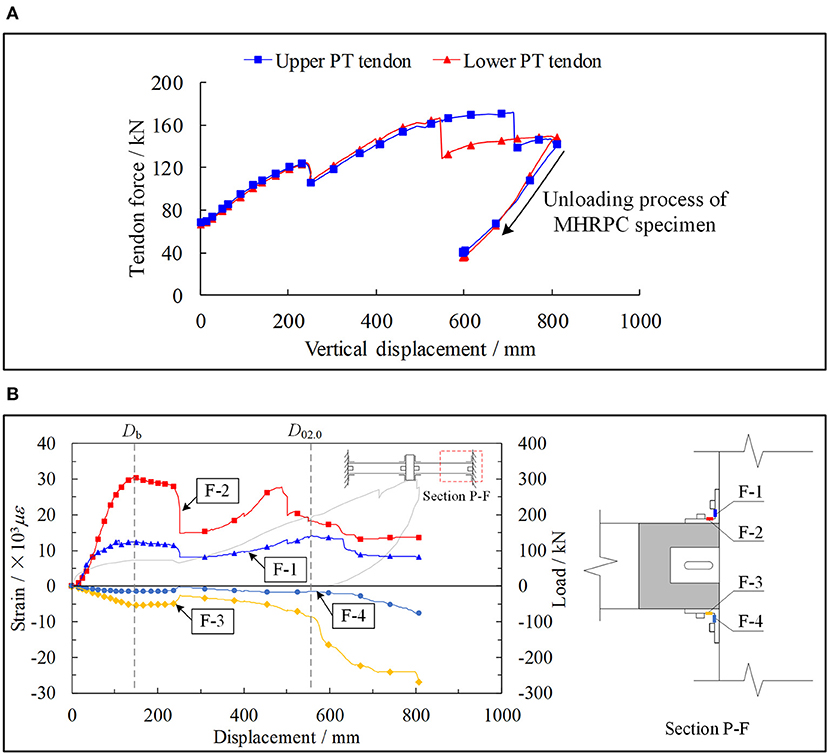
Figure 3. Measurement results of progressive collapse test. (A) Tendon force. (B) Angle strain (Lin et al., in press).
It can be concluded that, for the proposed MHRPC frame, the energy-dissipating steel angles and PT tendons served as the key load-resisting components in both the seismic cyclic and progressive collapse tests. The shear plate was responsible for transferring part of the shear force at the beam ends and ensuring a large chord rotational capacity under the column removal scenario. Therefore, this study focuses on analyzing the resistance contributions of the PT tendons and steel angles. Based on the component-level analyses, an analytical model is developed to calculate the seismic cyclic and progressive collapse resistance of the tested specimens.
Analytical Model for PT Tendon
In this study, referring to the Design Specification for Unbonded Post-Tensioned Precast Concrete Special Moment Frames Satisfying ACI 374.1 and Commentary (ACI 550.3-13) (American Concrete Institute, 2013), the PT tendon model proposed by Mattock (1979) is adopted. According to Mattock (1979), the stress-strain relationship of a PT tendon can be expressed by Equation (1):
where E is the elastic modulus of the PT tendon; f py is the yield strength of the PT tendon, which can be approximated as 90% of the ultimate strength; ε is the strain of the PT tendon, which can be calculated by ε = ε0 + Δε ; ε0 is the initial strain. According to the material test carried out by Lin et al. (in press), the tensile strength of the PT tendon is 1,993 MPa.
In the tests on the MHRPC frame specimens, as the prefabricated beams and columns are covered by steel sleeves at the ends, the deformation of the PT tendon is assumed to arise primarily from the relatively rigid body rotations between the prefabricated components. Hence, the incremental strain (Δε) can be calculated by analyzing the specimen deformation modes. Thereafter, the resistance contribution of the PT tendons can be determined using Equation (1).
Analytical Model for Steel Angle
In the MHRPC frame, the steel angle connections aid in: (1) providing flexural strength and dissipating seismic energy in the seismic cyclic tests; and (2) providing a catenary force during the catenary mechanism stage of the progressive collapse tests. It should be noted that, in the catenary stage, the steel angles will experience large deformations. Hence, the analytical model of the steel angle should be able to calculate the load-carrying capacity in both the small and large deformation stages.
The connection between the steel angles and prefabricated components is identical to the widely used semi-rigid connection with top and seat angles. The steel angles are arranged around the beam-column joint region, and connected to the prefabricated beams and columns by means of high-strength bolts. As semi-rigid connections with top and seat angles are used extensively in steel structures, numerous experimental, numerical and analytical studies exist (Kishi and Chen, 1990; Calado and Ferreira, 1994; Mander et al., 1994; Bernuzzi et al., 1996; Ahmed et al., 2001; Kishi et al., 2001; Garlock et al., 2003; Komuro et al., 2004; Li, 2007; Yuan, 2007; Yang and Jeon, 2009; Ahmed and Hasan, 2015; Hasan et al., 2017; Kong and Kim, 2017). Among these researches, Kishi and Chen (1990) proposed calculation methods for the initial stiffness and ultimate moment capacity of different types of semi-rigid connections, including the top and seat angle connection. Mander et al. (1994) calculated the plastic moment capacity of the connection by means of virtual work principles. For the initial stiffness, the Kishi and Chen model 1990 was adopted by Mander et al. (1994) in their research. Another widely used steel angle connection model was proposed by Garlock et al. (2003), based on cyclic load tests on different steel angles.
Key Parameters of Steel Angle Connections
When the beam-column joint is subjected to a rotation of θ, the prefabricated beam rotates along point O and the deformation of top and seat angles are shown in Figure 4A. Under such a load, the top angle is subjected to a horizontal force V as shown in Figure 4B and the plastic hinges locate at the column side of the steel angle. Furthermore, the beam side of the seat angle rotates along the plastic hinge on the steel angle as shown in Figure 4C.
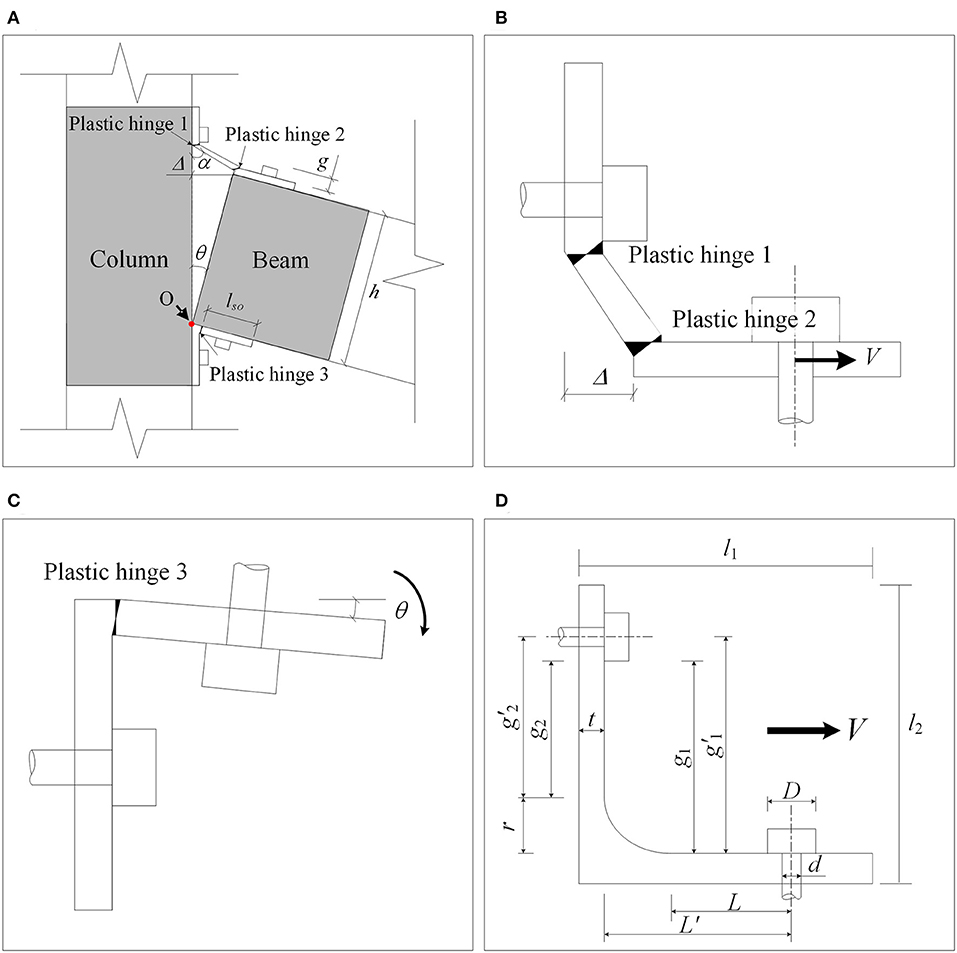
Figure 4. Deformation of MHRPC joint. (A) Overall deformation. (B) Top angle. (C) Seat angle. (D) Dimensions of steel angle.
According to Kishi and Chen (1990), Mander et al. (1994), and Garlock et al. (2003), when the top angle is subjected to a horizontal force V at the beam side, its strength is affected by the following parameters: plastic hinge distance g, angle thickness t, and angle width b, among others. The distance between two plastic hinges is determined by the bolt size and location and the steel angle filet length. In order to provide an improved description of the analytical model for the steel angle, a series of parameters for calculating the steel angle resistance (g1, g1', g2, g2', r, L, t, and L') are defined, as illustrated in Figure 4D. Moreover, the geometric parameters of a steel angle connection are defined, including the steel angle leg length (l1 and l2), bolt diameter (d), and bolt head diameter (D). Based on the deformation mode in Figure 4C, the seat angle strength depends primarily on the flexural resistance at the plastic hinge location.
Analytical Model for Steel Angles
The analytical model for the steel angle connections includes calculation methods for the yield moment, initial stiffness, and post-yield resistance. Hence, the proposed model is introduced in terms of these three aspects.
Yield Moment
(1) The Kishi and Chen (1990) and Garlock et al. (2003) method (namely, Method Y1)
When the beam-column joint reaches the yield state, according to the moment equilibrium between the external force (My) and internal force, the yield moment can be expressed as follows (Kishi and Chen, 1990; Garlock et al., 2003):
where Mseat is the flexural strength at plastic hinge 3 (Figure 4C), which can be calculated by Equation (3); Mp is the flexural strength at plastic hinge 2 (Figure 4B); Vp is the shear force transferred from the frame beam; and h is the beam height.
Assuming that both angle legs have the same thickness t, the flexural strength of a steel angle with a width b and material strength f y can be calculated according to Equation (3).
Moreover, the shear force Vp can be calculated using Equation (4), as suggested by Garlock et al. (2003):
(2) The Mander et al. (1994) method (namely, Method Y2)
In contrast to Kishi and Chen (1990) and Garlock et al. (2003), Mander et al. (1994) deduced the expression for the yield moment by means of the virtual work principle, as indicated in Equation (5):
where m1, m2, and m3 are the flexural strength at plastic hinges 1, 2, and 3, respectively, which can also be calculated by Equation (3); h′ is the distance between plastic hinge 2 and the rotation center O; and g is the distance between plastic hinges 1 and 2.
Initial Stiffness
The initial stiffness of the top and seat angle connection can be derived by calculating the initial stiffness of the top and seat angles, respectively. The initial stiffness contribution of the seat angle can be calculated by Equation (6) (Mander et al., 1994).
where E is the elastic modulus of the steel; I is the sectional moment of inertia; and lsois the distance between plastic hinge 3 and the angle leg tip, as indicated in Figure 4A.
Calculation methods for the initial stiffness contribution of the top angle include the Kishi and Chen (1990) and the Garlock et al. (2003) methods.
(1) The Kishi and Chen (1990) method (namely, Method S1)
According to Kishi and Chen (1990), the top angle acts as a cantilever beam and its initial stiffness contribution can be derived according to Equation (7):
where E is the elastic modulus of the steel; I is the sectional moment of inertia; t is the angle thickness; g′ is the distance from plastic hinge 1 to the mid-thickness of the angle leg on the beam side; and h0 is the distance between the mid-thickness of the top and seat angles on the beam side. When the top and seat angles have the same thickness, h0 = h+t.
(2) The Garlock et al. (2003) method (namely, Method S2)
Garlock et al. (2003) assumed that the top angle is fixed at the bolt positions on both the beam and column sides, as illustrated in Figure 5. The initial stiffness contribution of the top angle can be calculated by Equations (8–10). The initial stiffness can be expressed in terms of the bending and shear stiffness (Kbend and Kshear):
where Cθ is the rotation angle corresponding to a unit movement of the steel angle heel, which can be derived by Equation (11); e is the half-length of the square rigid zone, which is equal to t/2; and g and L are two steel angle connection parameters, as defined in Figure 5. As suggested by Garlock et al. (2003), when calculating the initial stiffness contribution of the top angle, g1′ and L′ as depicted in Figure 4D are assigned to g and L, respectively. Taking the beam height into consideration, the flexural stiffness contribution of the top angle can be determined.
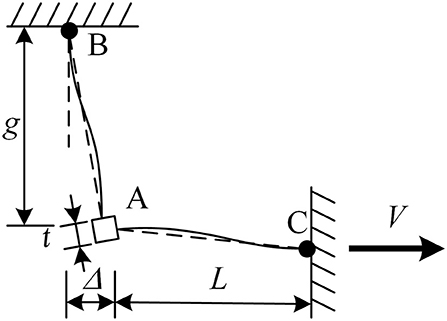
Figure 5. Analytical model for top angle (Garlock et al., 2003).
Post-yield Resistance
The shear force of the top angle following yielding can be calculated by Equation (12), according to Garlock et al. (2003):
where Δ is the movement of the top angle heel, as illustrated in Figure 5; and α is the material hardening parameter of the steel. It should be noted that Kishi and Chen (1990) also proposed a power-law-based model to simulate the post-yield behavior of the steel angle connection. However, the power index in the Kishi and Chen method 1990 should be calibrated by means of a series of experimental data, which is not practical in engineering design; therefore, it is not adopted in this study.
Model Selection for Steel Angle
Steel Angle Database
In order to the compare the accuracies of the different methods mentioned above, a total of 45 steel angle connection specimens were collected from the literature (Calado and Ferreira, 1994; Mander et al., 1994; Bernuzzi et al., 1996; Garlock et al., 2003; Komuro et al., 2004; Li, 2007; Yuan, 2007; Yang and Jeon, 2009; Ahmed and Hasan, 2015). Detailed information regarding these specimens can be found in the database in Appendix Table 1 in Supplementary Material.
Moreover, a benchmark FE model for the steel angle connection in the experiments of Lin et al. (in press) is constructed using MSC.Marc. Based on the benchmark model, 24 FE models with various design parameters (bolt positions, angle thicknesses, and material strengths) are built to establish the numerical database in Appendix Table 2 in Supplementary Material.
The cyclic tests on steel angles conducted by Garlock et al. (2003) are used to validate the accuracy and feasibility of the FE models. Taking specimen L6-516-9 as an example, solid elements are used to construct the models. The steel angle model is divided into four layers along the thickness. The material parameters are assigned according to the tension coupon results provided by Garlock et al. (2003). The simulated cyclic response of specimen L6-516-9 is compared to the experimental result in Figure 6, which indicate that the above FE model can accurately reproduce the cyclic behaviors of the steel angle in the tests.
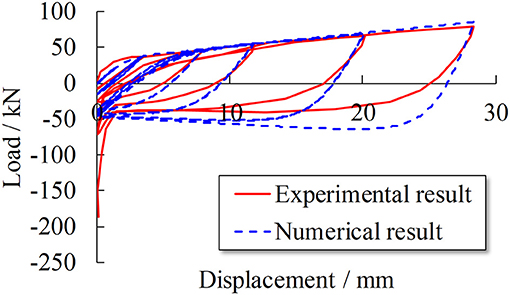
Figure 6. Validation of numerical model (specimen L6-516-9) (Garlock et al., 2003).
Based on the above experimental and numerical database, different analytical models for the steel angle connection are compared and selected. Subsequently, the selected models are used to analyze the experimental results of the MHRPC specimens.
Model Selection
Yield strength
The ratios between the calculated yield strengths and experimental results for the 45 specimens in the experimental database are compared in Figure 7A. The blue hollow triangle data points indicate the results from Method Y1 (Kishi and Chen, 1990; Garlock et al., 2003), while the red solid diamond data points represent the results from Method Y2 (Mander et al., 1994). The mean absolute errors (MAEs) of Methods Y1 and Y2 are represented by the blue and red solid lines, respectively. Note that Method Y2 is only suitable for beam-column joint specimens with top and seat angle connections, and the corresponding data points for specimens 1–7 (Garlock et al., 2003) are absent as these tests are cyclic tests of the steel angles.
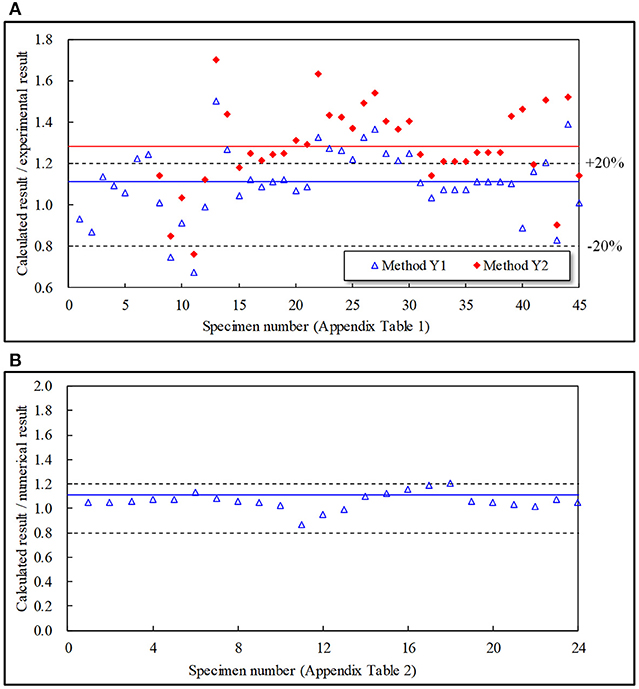
Figure 7. Comparison of different yield strength calculation methods. (A) Comparison with experimental database. (B) Comparison with numerical database.
The results indicate that both methods can provide an accurate estimation of the yield strength of the steel angle connections. The MAE of Method Y1 is 16.42% with a standard deviation of 0.163, while the MAE of Method Y2 is 30.91% with a standard deviation of 0.197. Moreover, additional data points from Method Y1 are within the range of ±20%, as illustrated in Figure 7A.
The calculated yield strengths using Method Y1 are compared to the numerical database results in Figure 7B. The results demonstrate that Method Y1, validated by the experimental database, can accurately calculate the yield strength of the steel angle connection model. The MAE is 7.44% with a standard deviation of 0.064. Hence, Method Y1 is adopted in this study to calculate the yield strengths of the steel angle connections.
Initial Stiffness
Similarly, the ratios between the calculated initial stiffness and experimental results for the specimens in the experimental database are illustrated in Figure 8A. The blue hollow triangle data points denote the results from Method S1 (Kishi and Chen, 1990), while the red solid diamond data points represent Method S2 (Garlock et al., 2003). The MAEs of Methods S1 and S2 are indicated by the blue and red solid lines, respectively. The MAE of Method S1 is 89.61% with a standard deviation of 1.356, while that of Method S2 is 133% with a standard deviation of 2.251. Both Methods S1 and S2 can provide accurate predictions for certain specimens. In contrast, neither of the two models can provide an effective prediction for the remaining specimens. It should be noted that such errors may arise from either the analytical models or experimental measurement errors. The errors of the analytical models may come from the idealization of the connection, measured material strength and so on. The experimental measurement errors may be caused by the installation of the tested specimens (e.g., relative slide, content of stiffening, machining error, etc.), the accuracy of the apparatus and so on. Actually, errors larger than 500% are also found in existing literature when predicting the initial stiffness of the top and seat angle connections (Kong and Kim, 2017). Hence a numerical database is necessary for selecting a more accurate initial stiffness calculation method. Similar model selection methodology is also adopted in many existing studies (Hasan et al., 2017; Kong and Kim, 2017).
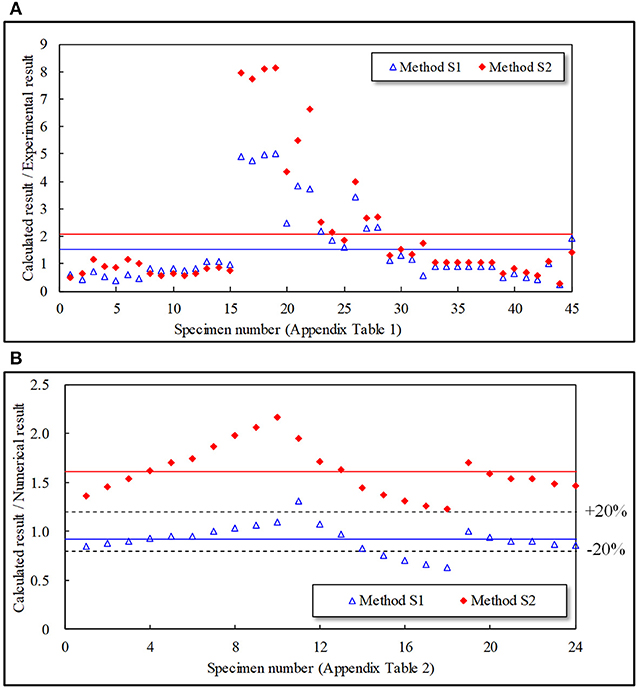
Figure 8. Comparison of different initial stiffness calculation methods. (A) Comparison with experimental database. (B) Comparison with numerical database.
Compared to the experimental results, the FE model results can avoid errors from the experimental measurement. For all of the models in the numerical database, the calculated initial stiffness values are compared to the numerical results in Figure 8B. It is demonstrated that the calculated initial stiffness of Method S1 is slightly smaller than the numerical result. The MAE of Method S1 is 12.80% with a standard deviation of 0.145. In contrast, the result of Method S2 is higher than the corresponding numerical results. The MAE is 61.59% with a standard deviation of 0.247. Based on the comparison of the two methods, Method S1 is suggested for calculating the initial stiffness of the top angle in this study.
To conclude, the proposed calculation procedure for the top and seat angle connection is summarized in Figure 9A. Taking model T6 in Appendix Table 2 in Supplementary Material as an example, the calculated load-displacement curve using the proposed method is compared to the numerical results, with strong agreement, as indicated in Figure 9B.
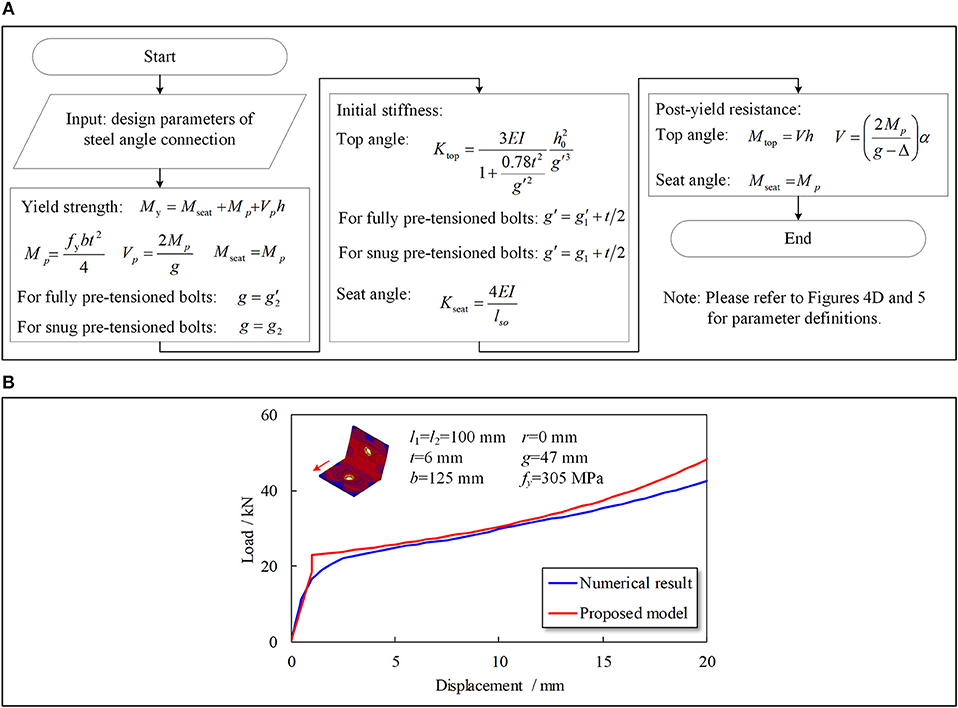
Figure 9. Calculation method for steel angle connection. (A) Calculation procedure. (B) Validation of proposed method.
Analytical Model for MHRPC Frame
Seismic Resistance
According to El-Sheikh et al. (2000), during the initial loading stage of the seismic cyclic test, the deformation of the beam-column joint arises from the flexural deformation of the prefabricated concrete beam until reaching the linear limit state. The initial stiffness is defined as the secant stiffness when the component reaches the linear limit state. El-Sheikh et al. (2000) suggested that the linear limit state moment could be determined according to Equations (13–15).
where Mllis the linear limit state moment corresponding to the frame beam on one side of the beam-column joint; T is the pre-tension force of a PT tendon; f pi is the initial stress of a PT tendon; Ap is the total area of the PT tendons; h is the beam height; f ci is the initial stress of the concrete under pre-tension; and f c′ is the concrete cylinder strength. Note that, in the seismic cyclic tests of Lin et al. (in press), as the specimen is loaded at the beam ends on both sides of the joint, the calculated linear limit state should be 2Mll.
Before the specimen reaches the linear limit state, the initial stiffness of the moment-rotation relationship for the MHRPC joint specimens can be approximated by Equation (16).
where E is the material elastic modulus, and for simplicity, the elastic modulus of concrete is used in this study; Ig is the sectional moment inertia; and L is the effective length of the frame beam on one side of the joint, which can be taken as the distance between the edges of two steel jackets. In the seismic cyclic tests of Lin et al. (in press), L = 1.2 m. According to the drawings provided in Lin et al. (in press), the calculated initial stiffness is 8,138 kN·m for the MHRPC joint specimen. Moreover, in the first test of this specimen (initial pre-stressing level: 42%), the calculated linear limit state moment is 34.7 kN·m, corresponding to a joint rotation of 0.426%. In the second test (initial pre-stressing level: 20%), the linear limit state moment is 16.7 kN·m, corresponding to a joint rotation of 0.205%.
According to Lin et al. (in press), in the seismic cyclic test of the MHRPC frame joint specimen, the prefabricated beams rotate along the corner points at the beam-column interfaces, as illustrated in Figure 4A. The steel angles begin to deform and contribute to the flexural resistance once the specimen reaches the linear limit state. The deformation of the steel angle heel (Δ) can be calculated according to Equation (17):
where θ is the joint rotation and θll is the joint rotation corresponding to the linear limit state. Note that, when θ is smaller than θll, Δ = 0. h is the beam height. The resistance from the top and seat angle connection can be calculated according the procedure illustrated in Figure 9A.
Moreover, the elongation of the top PT tendon (Δtendon) can be calculated by Equation (18), according to the deformation mode of the beam-column joint, as illustrated in Figure 10:
where d1 and d2 are the distances from the PT tendon centers to the bottom of the prefabricated beam, respectively. Note that, in the MHPRC frame, the PT tendons are arranged symmetrically along the sectional height, and the elongation of the bottom PT tendon can also be calculated by Equation (18). When considering the total length of the PT tendon (ltendon), the strain increment in Equation (1) can be calculated following Δε = Δtendon/ltendon, based on which the internal force of the PT tendon can be determined. Furthermore, the flexural resistance contribution of the PT tendons can be obtained.
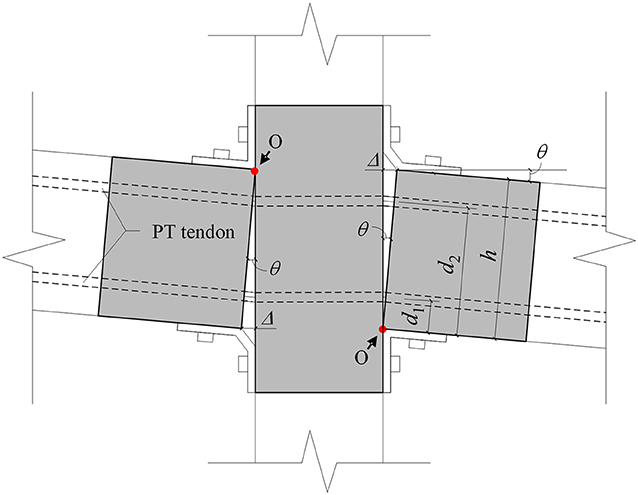
Figure 10. Joint region deformation of the seismic cyclic test specimen.
The moment-rotation relationship of the MHRPC joint specimen can be approximated by summing the flexural resistance contributions from the PT tendons and steel angle connections. Note that, in the seismic cyclic tests of Lin et al. (in press), the MHRPC joint specimen is tested twice in order to verify the reparability and self-centering capacity. During the first test, the initial pre-stressing level is set as 42%, while in the second test, it is 20%. The analytical backbone curves are compared to the experimental results in Figure 11. It should be noted that the calculated tendon force-rotation relationships in the two tests are also compared to the experimental measurements in Figure 11. The results indicate that the calculated cyclic response of the MHRPC joint specimen, including the tendon force-rotation relationship, fits strongly with the test results. The proposed method can be used in the seismic resistance design and analysis of such MHRPC frame structures.
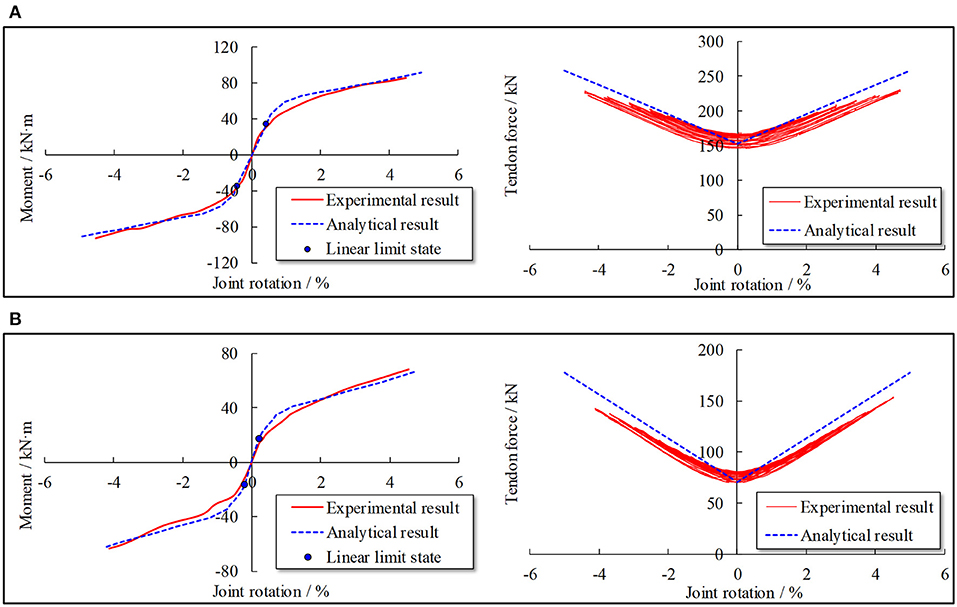
Figure 11. Comparison of seismic cyclic test results. (A) First test of MHRPC joint specimen (initial pre-stressing level: 42%). (B) Second test of MHRPC joint specimen (initial pre-stressing level: 20%).
Progressive Collapse Test
As discussed previously, according to the load-displacement curve in Figure 1D, the loading process of the progressive collapse test of the MHRPC substructure can be divided into the beam mechanism and catenary mechanism stages. Hence, the analytical model also includes the beam mechanism and catenary mechanism parts.
Beam Mechanism
The progressive collapse resistance of the MHRPC substructure mainly originates from the CAA and flexural resistance of the frame beam. The calculation method proposed by Lu et al. (2018) is adopted in this study. The peak displacement corresponding to the peak CAA resistance can be estimated by Equation (19).
where l is the total specimen length and h is the beam height. Furthermore, the progressive collapse resistance can be calculated following the Park and Gamble (2000) method (Equations 20–25).
where the parameter definitions are illustrated in Figure 12. A more detailed CAA calculation procedure in RC frame beams can be found in Lu et al. (2018).
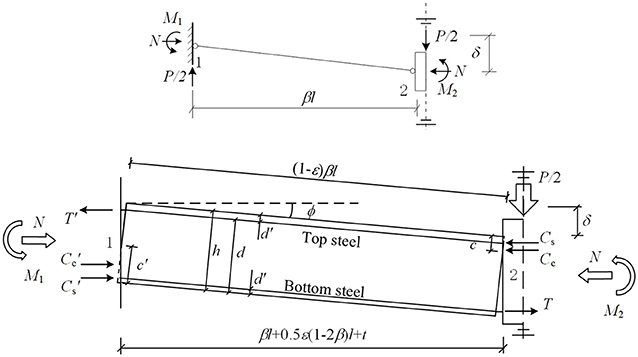
Figure 12. Definition of parameters in Park and Gamble model 2000.
The calculated CAA resistance of the progressive collapse test specimen in Lin et al. (in press) is 58.53 kN. Combined with the previously estimated peak displacement, a typical loading point can be denoted as illustrated in Figure 15A.
Catenary Mechanism
During the catenary mechanism stage, the MHRPC substructure deforms, as illustrated in Figure 13. The elongation of a PT tendon can be calculated by Equation (26), according to the geometry.
where δ is the column stub displacement and ln is the net span of the prefabricated beam. Based on the tendon elongation, the strain increment and tendon force can be calculated further. The progressive collapse resistance contribution of the PT tendons is composed of the vertical components of the tendon forces.
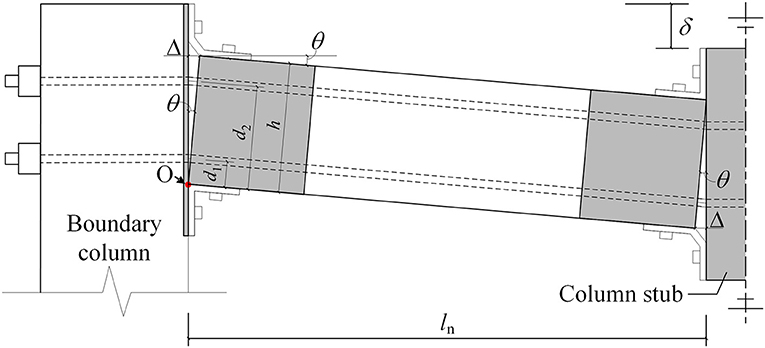
Figure 13. Deformation of progressive collapse test specimen.
Moreover, according to Yang and Tan (2013), the catenary force contribution of the steel angle connections is dependent on the ultimate tensile force of the steel angles, which can be calculated by Equation (27).
where Na is the ultimate tensile force of the steel angle and beff, a is the effective width of the steel angle, which is determined by Equations (28, 29).
where the parameter definitions are provided in Figure 14.
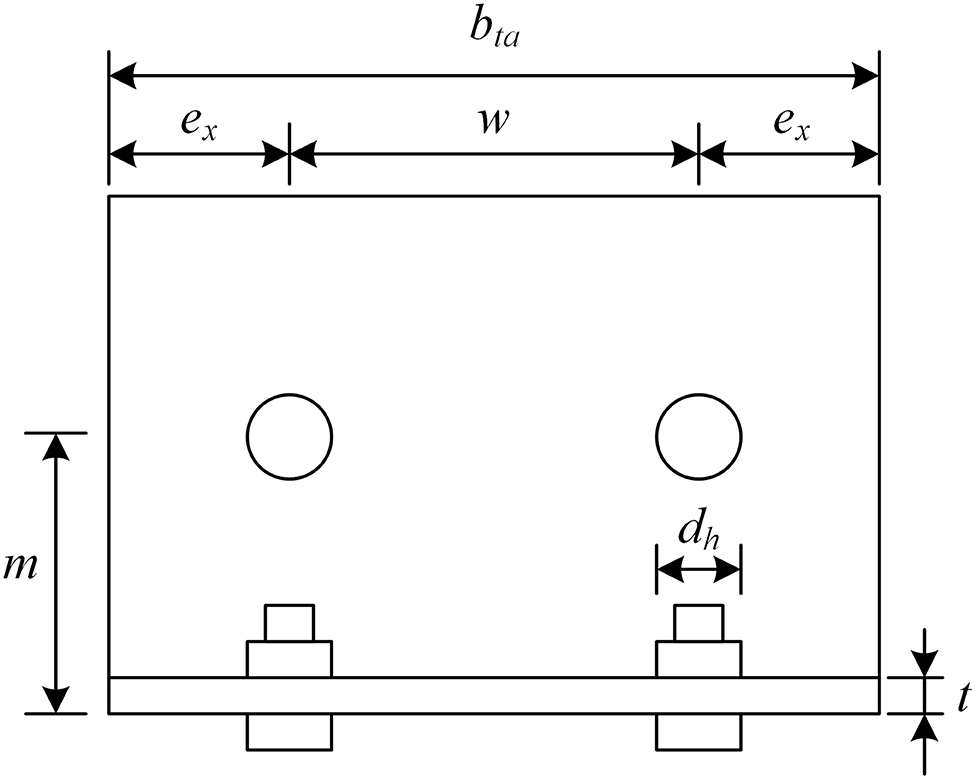
Figure 14. Definitions of angle parameters (Yang and Tan, 2013).
For the steel angle used in the progressive collapse test of the MHRPC substructure, the calculated beff, a and Na values are 62.5 mm and 130.54 kN, respectively. Furthermore, the progressive collapse resistance contribution is composed of the vertical components of tensile forces in the steel angles.
The calculated load-displacement curve of the progressive collapse test is compared to the experimental result, as illustrated in Figure 15A. It should be noted that the tendon force-displacement relationship is also compared in Figure 15B. The results indicate the proposed method can provide reasonable predictions of the progressive collapse resistances for MHRPC substructures in the beam mechanism and catenary mechanism stages.
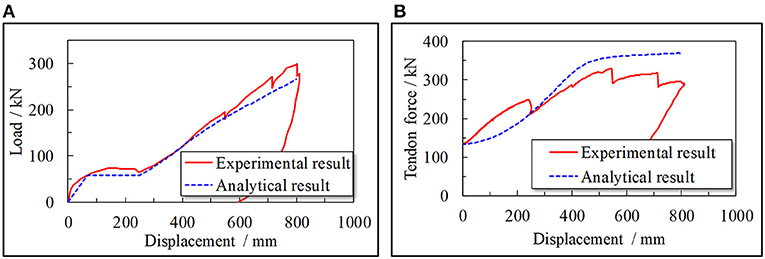
Figure 15. Comparison of the progressive collapse test results. (A) Load-displacement curve. (B) Tendon force.
Conclusion
A novel MHRPC frame system has been proposed to improve the seismic and progressive collapse performance of commonly used RC frames by Lin et al. (in press). In this study, based on the experimental tests of the MHRPC frame specimens, an analytical model for the design of the MHRPC frame is established and validated by means of experimental results. The main contributions of this study include the following.
(1) The resistance contributions of different components in the MHPRC frame are analyzed based on the experimental measurement data, which lays a foundation for developing the proposed calculation methods for the MHRPC frame.
(2) Two databases of steel angle connections (experimental and numerical) are constructed based on the literature review and FE modeling using MSC.Marc. An analytical model for the steel angle is suggested and validated using the databases.
(3) deformation modes of the MHRPC specimens in the seismic cyclic and progressive collapse tests are analyzed to calculate the deformation of steel angles and elongations of PT tendons. On this basis, the resistance contributions of both the PT tendons and steel angle connections are quantified using the tendon constitutive and steel angle models. Thereafter, the seismic cyclic and progressive collapse responses of the MHRPC specimens are calculated and validated using the experimental results.
This work could provide a reference for the seismic and progressive collapse design of such MHRPC frame structures.
Author Contributions
KL and XL contributed development of the proposed model and performed the analysis. KL wrote the first draft of the manuscript; KL, XL, YL, WZ, and LY wrote sections of the manuscript. All authors read and approved the submitted manuscript version.
Conflict of Interest Statement
The authors declare that the research was conducted in the absence of any commercial or financial relationships that could be construed as a potential conflict of interest.
Acknowledgments
The authors are grateful for the financial support received from the National Natural Science Foundation of China (No. 51778341).
Supplementary Material
The Supplementary Material for this article can be found online at: https://www.frontiersin.org/articles/10.3389/fbuil.2018.00073/full#supplementary-material
References
Ahmed, A., and Hasan, R. (2015). Effect and evaluation of prying action for top-and seat-angle connections. Int. J. Adv. Struct. Eng. 7, 159–169. doi: 10.1007/s40091-015-0089-2
Ahmed, A., Kishi, N., Matsuoka, K. I., and Komuro, M. (2001). Nonlinear analysis on prying of top-and seat-angle connections. J. Appl. Mech. 4, 227–236. doi: 10.2208/journalam.4.227
American Concrete Institute (ACI). (2013). Design Specification for Unbonded Post-tensioned Precast Concrete Special Moment Frames Satisfying ACI 374.1 and Commentary. ACI 550.3-13. Farmington Hills, MI.
Bernuzzi, C., Zandonini, R., and Zanon, P. (1996). Experimental analysis and modelling of semi-rigid steel joints under cyclic reversal loading. J. Constr. Steel. Res. 38, 95–123. doi: 10.1016/0143-974X(96)00013-2
Calado, L., and Ferreira, J. (1994). “Cyclic behaviour of steel beam-to-column connections - an experimental research,” in Proceedings of International Workshop and Seminar on Behaviour of Steel Structures in Seismic Areas. (Timisoara), 381–389.
Department of Defense (2016). Design of Structures to Resist Progressive Collapse. Unified Facility Criteria, UFC 4-023-03. Washington, DC.
Ellingwood, B. R. (2006). Mitigating risk from abnormal loads and progressive collapse. J. Perform. Constr. Facil. 20, 315–323. doi: 10.1061/(ASCE)0887-3828(2006)20:4(315)
ElSayed, M., El-Dakhakhni, W., and Tait, M. (2015). Resilience evaluation of seismically detailed reinforced concrete-block shear walls for blast-risk assessment. J. Perform. Constr. Facil. 30:04015087. doi: 10.1061/(ASCE)CF.1943-5509.0000742
El-Sheikh, M., Pessiki, S., Sause, R., and Lu, L. W. (2000). Moment rotation behavior of unbonded post-tensioned precast concrete beam-column connections. ACI Struct. J. 97, 122–131. doi: 10.14359/841
Fakharifar, M., Sharbatdar, M. K., Lin, Z., Dalvand, A., Sivandi-Pour, A., and Chen, G. (2014). Seismic performance and global ductility of RC frames rehabilitated with retrofitted joints by CFRP laminates. Earthq. Eng. Eng. Vib. 13, 59–73. doi: 10.1007/s11803-014-0212-6
Fleischman, R. B., Chasten, C. P., Lu, W. L., and Driscoll, G. C. (1989). Top and Seat Angle Connections and End Plate Connections: Snug vs Fully Pre-tensioned Bolts. ATLSS Report No. 89-06, Lehigh University.
Fujikura, S., Bruneau, M., and Lopez-Garcia, D. (2008). Experimental investigation of multihazard resistant bridge piers having concrete-filled steel tube under blast loading. J. Bridge Eng. 13, 586–594. doi: 10.1061/(ASCE)1084-0702(2008)13:6(586)
Garlock, M. M., Ricles, J. M., and Sause, R. (2003). Cyclic load tests and analysis of bolted top-and-seat angle connections. J. Struct. Eng. 129, 1615–1625. doi: 10.1061/(ASCE)0733-9445(2003)129:12(1615)
Gerami, M., Sharbati, Y., and Sivandi-Pour, A. (2013). Nonlinear seismic vulnerability evaluation of irregular steel buildings with cumulative damage indices. Int. J. Adv. Struct. Eng. 5:9. doi: 10.1186/2008-6695-5-9
Gerami, M., and Sivand-Pour, A. (2014). Performanc-based seismic rehabilitation of existing steel eccentric braced buildings in near fault ground motions. Struct. Des. Tall Spec. Build. 23, 881–896. doi: 10.1002/tal.1088
Gidaris, I., Padgett, J. E., Barbosa, A. R., Chen, S., Cox, D., Webb, B., et al. (2017). Multiple-hazard fragility and restoration models of highway bridges for regional risk and resilience assessment in the United States: state-of-the-art review. J. Struct. Eng. 143:04016188. doi: 10.1061/(ASCE)ST.1943-541X.0001672
Hasan, M. J., Ashraf, M., and Uy, B. (2017). Moment-rotation behaviour of top-seat angle bolted connections produced from austenitic stainless steel. J. Constr. Steel. Res. 136, 149–161. doi: 10.1016/j.jcsr.2017.05.014
Kamath, P., Sharma, U. K., Kumar, V., Bhargava, P., Usmani, A., Singh, B., et al. (2015). Full-scale fire test on an earthquake-damaged reinforced concrete frame. Fire Saf. J. 73, 1–19. doi: 10.1016/j.firesaf.2015.02.013
Kishi, N., Ahmed, A., Yabuki, N., and Chen, W. F. (2001). Nonlinear finite element analysis of top-and seat-angle with double web-angle connections. Struct. Eng. Mech. 12, 201–214. doi: 10.12989/sem.2001.12.2.201
Kishi, N., and Chen, W. F. (1990). Moment-rotation relations of semirigid connections with angles. J. Struct. Eng. 116, 1813–1834. doi: 10.1061/(ASCE)0733-9445(1990)116:7(1813)
Komuro, M., Kishi, N., and Chen, W. F. (2004). “Elasto-plastic FE analysis on moment-rotation relations of top-and seat-angle,” in Proceedings of 5th International Workshop on Connections in Steel Structures, (Amsterdam), 111–120.
Kong, Z., and Kim, S. E. (2017). Numerical estimation for initial stiffness and ultimate moment of top-seat angle connections without web angle. J. Struct. Eng. 143:04017138. doi: 10.1061/(ASCE)ST.1943-541X.0001875
Li, W. L. (2007). Behavior of Semi-Rigid Beam-to-Column Minor Axis Connections in Steel Frame. dissertation, [Xi'an]: Xi'an University of Architecture & Technology (in Chinese).
Li, Y., Ahuja, A., and Padgett, J. E. (2011). Review of methods to assess, design for, and mitigate multiple hazards. J. Perform. Constr. Facil. 26, 104–117. doi: 10.1061/(ASCE)CF.1943-5509.0000279
Lin, K. Q., Li, Y., Lu, X. Z., and Guan, H. (2017). Effects of seismic and progressive collapse designs on the vulnerability of RC frame structures. J. Perform. Constr. Facil. 31:04016079. doi: 10.1061/(ASCE)CF.1943-5509.0000942
Lin, K. Q., Lu, X. Z., Li, Y., and Guan, H. (in press). Experimental study of a multi-hazard resistant prefabricated reinforced concrete frame structure. Soil Dyn. Earthq. Eng. doi: 10.1016/j.soildyn.2018.04.011
Lu, X. L., Cui, Y., Liu, J. J., and Gao, W. J. (2015). Shaking table test and numerical simulation of a 1/2-scale self-centering reinforced concrete frame. Earthq. Eng. Struct. Dyn. 44, 1899–1917. doi: 10.1002/eqe.2560
Lu, X. Z., Lin, K. Q., Li, C. F., and Li, Y. (2018). New analytical calculation models for compressive arch action in reinforced concrete structures. Eng. Struct. 168, 721–735. doi: 10.1016/j.engstruct.2018.04.097
Lu, X. Z., Ye, L. P., Ma, Y. H., and Tang, D. Y. (2012). Lessons from the collapse of typical RC frames in xuankou school during the great wenchuan earthquake. Adv. Struct. Eng. 15, 139–153. doi: 10.1260/1369-4332.15.1.139
Mander, J. B., Chen, S. S., and Pekcan, G. (1994). Low-cycle fatigue behavior of semi-rigid top-and-seat angle connections. Eng. J.-Amer. Inst. Steel Constr. 31, 111–122.
Mattock, A. H. (1979). Flexural strength of prestressed concrete sections by programmable calculator. PCI J. 24, 32–54. doi: 10.15554/pcij.01011979.32.54
Priestley, M. N., and Tao, J. R. (1993). Seismic response of precast prestressed concrete frames with partially debonded tendons. PCI J. 38, 58–69. doi: 10.15554/pcij.01011993.58.69
Shah, A. H., Sharma, U. K., Kamath, P., Bhargava, P., Reddy, G. R., and Singh, T. (2016). Effect of ductile detailing on the performance of a reinforced concrete building frame subjected to earthquake and fire. J. Perform. Constr. Facil. 30:04016035. doi: 10.1061/(ASCE)CF.1943-5509.0000881
Song, L. L., Guo, T., and Cao, Z. L. (2015). Seismic response of self-centering prestressed concrete moment resisting frames with web friction devices. Soil. Dyn. Earthq. Eng. 71, 151–162. doi: 10.1016/j.soildyn.2015.01.018
Song, L. L., Guo, T., and Chen, C. (2014). Experimental and numerical study of a self-centering prestressed concrete moment resisting frame connection with bolted web friction devices. Earthq. Eng. Struct. Dyn. 43, 529–545. doi: 10.1002/eqe.2358
Sozen, M. A., Thornton, C. H., Corley, W. G., and Mlakar, P. F. Sr. (1998). The Oklahoma City bombing: structure and mechanisms of the Murrah Building. J. Perform. Constr. Facil. 12, 120–136. doi: 10.1061/(ASCE)0887-3828(1998)12:3(120)
Wolski, M., Ricles, J. M., and Sause, R. (2009). Experimental study of a self-centering beam-column connection with bottom flange friction device. J. Struct. Eng. 135, 479–488. doi: 10.1061/(ASCE)ST.1943-541X.0000006
Yang, B., and Tan, K. H. (2013). Robustness of bolted-angle connections against progressive collapse: mechanical modelling of bolted-angle connections under tension. Eng. Struct. 57 153–168. doi: 10.1016/j.engstruct.2013.08.041
Yang, J. G., and Jeon, S. S. (2009). Analytical models for the initial stiffness and plastic moment capacity of an unstiffened top and seat angle connection under a shear load. Int. J. Steel Struct. 9, 195–205. doi: 10.1007/BF03249494
Keywords: calculation model, multi-hazard, prefabricated concrete frame, earthquake, progressive collapse
Citation: Lin K, Lu X, Li Y, Zhuo W and Ye L (2018) Analytical Model for Multi-Hazard Resilient Prefabricated Concrete Frame Considering Earthquake and Column Removal Scenarios. Front. Built Environ. 4:73. doi: 10.3389/fbuil.2018.00073
Received: 29 September 2018; Accepted: 21 November 2018;
Published: 04 December 2018.
Edited by:
Ehsan Noroozinejad Farsangi, Graduate University of Advanced Technology, IranReviewed by:
Emanuele Brunesi, Fondazione Eucentre, ItalyAbbas Sivandi-Pour, Graduate University of Advanced Technology, Iran
Christian Málaga-Chuquitaype, Imperial College London, United Kingdom
Copyright © 2018 Lin, Lu, Li, Zhuo and Ye. This is an open-access article distributed under the terms of the Creative Commons Attribution License (CC BY). The use, distribution or reproduction in other forums is permitted, provided the original author(s) and the copyright owner(s) are credited and that the original publication in this journal is cited, in accordance with accepted academic practice. No use, distribution or reproduction is permitted which does not comply with these terms.
*Correspondence: Xinzheng Lu, bHV4ekB0c2luZ2h1YS5lZHUuY24=