 Lorenzo Diana
 Julien Thiriot
 Yves Reuland
 Pierino Lestuzzi
- 1Applied Computing and Mechanics Laboratory (IMAC), School of Architecture, Civil and Environmental Engineering (ENAC), Swiss Federal Institute of Technology Lausanne (EPFL), Lausanne, Switzerland
- 2Department of Structural and Geotechnical Engineering (DISG), University of Rome 'La Sapienza', Rome, Italy
Assessing seismic vulnerability at large scales requires accurate attribution of individual buildings to more general typological classes that are representative of the seismic behavior of the buildings sharing same attributes. One-by-one evaluation of all buildings is a time-and-money demanding process. Detailed individual evaluations are only suitable for strategic buildings, such as hospitals and other buildings with a central role in the emergency post-earthquake phase. For other buildings simplified approaches are needed. The definition of a taxonomy that contains the most widespread typological classes as well as performing the attribution of the appropriate class to each building are central issues for reliable seismic assessment at large scales. A fast, yet accurate, survey process is needed to attribute a correct class to each building composing the urban system. Even surveying buildings with the goal to determine classes is not as time demanding as detailed evaluations of each building, this process still requires large amounts of time and qualified personnel. However, nowadays several databases are available and provide useful information. In this paper, attributes that are available in such public databases are used to perform class attribution at large scales based on previous data-mining on a small subset of an entire city. The association-rule learning (ARL) is used to find links between building attributes and typological classes. Accuracy of wide spreading these links learned on <250 buildings of a specific district is evaluated in terms of class attribution and seismic vulnerability prediction. By considering only three attributes available on public databases (i.e., period of construction, number of floors, and shape of the roof) the time needed to provide seismic vulnerability scenarios at city scale is significantly reduced, while accuracy is reduced by <5%.
Introduction
Seismic-risk assessment at urban scale is an essential step toward earthquake-resilient communities; not only in highly seismic-prone regions but also in regions with low-to-moderate seismic hazard. The concept of resilience is not exclusively related to safety of inhabitants, but also to the capacity of systems to recover from a seismic event and to get back to previous levels of load-bearing capacity (Bruneau and Reinhorn, 2007; Cimellaro et al., 2010a,b; Alexander, 2013; Burton et al., 2015). Indeed, even slight damages can cause production interruptions and communication breakdowns with potential consequences on the prosperity of entire regions that last for months and even years. Architects, engineers and urban planners should be involved in the pre-earthquake phase, not only in towns with high seismicity, for the definition of scenarios regarding seismic vulnerability. Such scenarios are useful to estimate the levels of damage that urban systems are expected to suffer in case of seismic events. Thus, efficient pro-active actions can be implemented, which help increasing the general resilience.
Evaluating seismic risk at large scale is a complex and wide process of knowledge. Multiple domains are involved: seismic hazard, exposure and seismic vulnerability (Carreño et al., 2007). Several models and datasets exist in literature: WHE—World Housing Encyclopedia (EERI, 2004); FEMA—Federal Emergency Management Agency (ATC (Applied Technology Council), 2005; Pager—Prompt Assessment of Global Earthquakes for Response (Jaiswal and Wald, 2008); GEM—Global Earthquake Model (Brzev et al., 2013). The time demand and the expensiveness of evaluations depend on the type of detail required. In order to develop scenarios of urban vulnerability, several thousands of buildings would need to be evaluated. Lately, researches have been developed for large scale building-by-building evaluations (Yamashita et al., 2011; Xiong et al., 2018). In general, building-specific and detailed evaluation of the entire building stock is undermined by the economic and technical needs of such a process, even more so in regions with low-to-moderate seismic hazard. Therefore, simplifications are necessary. First, a reduction in the number of assessed buildings is performed: buildings are clustered into typological classes and the vulnerability of each class—rather than each building—is calculated in detail.
A fundamental starting point to urban assessment is thus the definition of an appropriate taxonomy. The taxonomy is particularly important because several typological classes are introduced to describe accurately the structural behavior of the existing building stock. In Europe, several studies have defined taxonomies: starting with the EMS-98 (Grünthal et al., 2001) with the definition of building classes and vulnerability classes and then with the Risk-UE project (Lagomarsino and Giovinazzi, 2006) who have implemented the EMS-98 classes by adding some specifications.
Once the taxonomy is defined, a specific typological class can be attributed to each building. This attribution process is essential to achieve meaningful seismic evaluations at urban scale, since the estimation of the expected damage is directly related to the building type. Attributing types to buildings is commonly based on surveys (ATC (Applied Technology Council), 2005). Several approaches exist to survey existing buildings: starting with the well-established building-by-building visual inspection, which at urban scale has the drawback of being highly time demanding (McEntire and Cope, 2004; Marquis et al., 2017). Over the last few years, surveys involving drones, satellites, and open maps have been introduced to reduce the time demand (Suzuki et al., 2010; Ehrlich et al., 2013). Deep-learning approaches, collecting data from pictures of buildings or other sources are then implemented for automatic attribution of types (Mallepudi et al., 2011) or directly for seismic-vulnerability estimates (Alizadeh et al., 2018).
At the current state of the art, an increase in the speed of the survey phase (i.e., attribution of typological classes to all buildings and consequently the estimation of the expected damage) can be obtained by using building data that is readily available in public databases (Riedel et al., 2014). By the selection of appropriate attributes (such as number of floors, material and year of construction) and the application of data-mining methods, correlations between building attributes and typological classes on small learning sets can be defined (Riedel et al., 2014). The association-rule learning (ARL) is a data-mining method (Agrawal et al., 1993) that is based on finding association rules between attributes of buildings that help discovering statistical links between building features. Once correlations are defined on the learning set, a class (or a probability to belong to a class) can be attributed to each building that is subsequently analyzed. The ARL method allows to use available building attributes to assign buildings to predefined classes and, by extension, to define their vulnerability. Vulnerability represents the intrinsic predisposition of a building to be affected and to suffer damage following the occurrence of a given event (Guéguen, 2013).
When dealing with vulnerability analysis at larger scales, the aim is to assess the impact of an earthquake on a set of buildings within an area of interest. Two main approaches exist for seismic-vulnerability assessment of existing buildings at large scale: empirical (or macro-seismic) methods and mechanical methods (Lestuzzi et al., 2016). In empirical methods, the vulnerability of each class is measured in terms of a vulnerability index, V, that is calculated based on the observed damage of buildings of every class in past earthquakes. Mechanical methods are based on a model-based evaluation of the structural behavior of buildings: by the interaction between the structural behavior (identified for example by capacity curves) and the seismic demand (identified for example by response spectra), the expected damage reached by a typological class is determined.
In Europe, a fundamental research project for both empirical and mechanical method is the Risk-UE project. The Risk-UE project represents the first collaborative and comprehensive research program that studied territorial seismic risk focused on the European built environment (Lestuzzi et al., 2017).
Within the Risk-UE project (Mouroux et al., 2004; Mouroux and Le Brun, 2006), which proposes “an advanced approach to earthquake risk scenarios with applications to different European towns,” the vulnerability of existing buildings is evaluated according to the two approaches: Level 1 or LM1, based on the empirical method; and Level 2 or LM2, based on the mechanical method. The empirical method, LM1, involves the macro-seismic intensity according to EMS-98 (Grünthal et al., 2001) and vulnerability and ductility indexes. Lagomarsino and Giovinazzi (2006) proposed a correlation between macro-seismic intensity of the European macro-seismic scale EMS-98 and building damage. This correlation is shown in terms of vulnerability curves for each building type. The vulnerability indexes are derived from the vulnerability curves of EMS-98 (Giovinazzi and Lagomarsino, 2001). In EMS-98, the expected damage of each type is defined using linguistic terms (“few,” “many,” “most”) considering five damage grades. With the LM1 methods of the Risk-UE project, these terms have been transformed into numbers (parameter V) applying an implicit Damage Probability Matrix and using the fuzzy set theory (Dubois and Parade, 1980). For LM1 calculations, the European macro-seismic scale, EMS-98, defines the hazard and the damage-grade scale (from D1 to D5).
Mechanical models (LM2) are based on the structural response of the buildings, expressed by the force-displacement curve (capacity curve). Three parameters are needed to represent capacity curves in a simplified elastic-perfectly plastic model: dy—yield displacement; Ay—yield acceleration; du—ultimate displacement. In general, several mechanical methods exist in literature, many of them are based on the Capacity Spectrum Method of ATC-40 (ATC (Applied Technology Council), 1996). Within the framework of this paper, vulnerability is calculated using the macro-seismic approach (LM1).
In this paper, the application of the ARL method for attributing typological classes (for seismic evaluation) to buildings is proposed. The methodology is then applied to the city of Basel, in Switzerland, where several datasets are available containing information of all buildings. The analyzed datasets provide elementary attributes and characteristics of buildings. The main goal of the paper is to evaluate the performance in the attribution of typological classes on a learning set (containing more than 700 buildings), considering various combinations of attributes. In a second phase, the distribution matrixes obtained are applied to the entire city of Basel, which has been partially surveyed as part of a Master thesis at the IMAC Lab, EPFL (Thiriot, 2019).
Methodology
When assessing the seismic vulnerability of existing buildings at large scale, the definition of typological classes and their attribution to the building stock of an urban system are elementary. The building-by-building evaluation is a process that can hardly be performed at urban scales, since it requires amounts of time and money that are not available, especially in regions with low-to-moderate seismicity that have reduced mobilization of resources (Riedel et al., 2015). Thus, methods are needed to attribute, in a simplified way, a specific typological class to each building in a region of interest. Such a list of typological classes (or types) that compose the urban system is called taxonomy (Porter et al., 2001). The classes proposed by Lagomarsino and Giovinazzi (2006) have been adopted by the Risk-UE project. This taxonomy is an improvement of the previous taxonomy proposed in EMS-98. In order to provide an example of a taxonomy, all building classes that are considered to form part of the city of Basel, which is considered as a case study in this paper (see section Case Study) are presented in Table 1. The typological class definitions can be retrieved in the Risk-EU project and in the EMS-98.
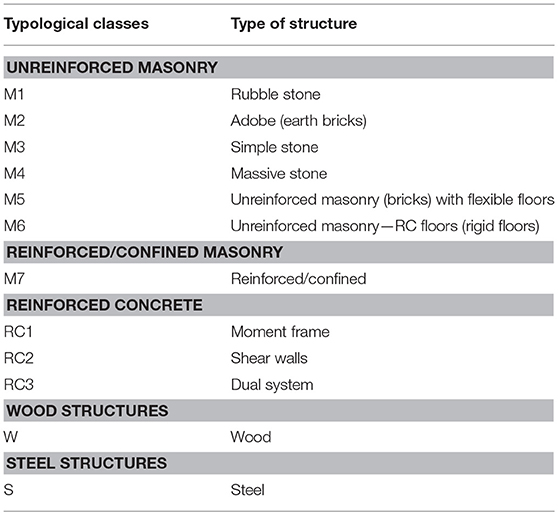
Table 1. Typological classes that are considered for the city of Basel.
The aim of the presented methodology is to find correlations between building attributes, such as period of construction, number of floors (related to the building height), shape of the roof and footprint surface [as described in section Collection of Building Attributes (STEP 1)], which are available in large datasets, and typological classes (see Table 1). By doing so, a given class is attributed, with a certain probability, to a given building. The process of identifying patterns, defining correlations and attributing types is based on data-mining large datasets. The method used for the determination or correlations between attributes and typological types is the ARL (Association Rule Learning) method. In detail, understanding the influence of attributes and their combination on the general performance of the proposed class attribution is investigated. The flowchart presented in Figure 1 describes the methodology applied in the present work explaining how typological classes are attributed and vulnerability is assessed for large-scale studies: in step 1 attributes of buildings are gathered from large-scale databases; in step 2 a data-mining process is applied on a training set of buildings to find correlations between attributes and typological classes; in step 3 typological classes are assigned to buildings; and finally in step 4 vulnerability assessment is performed. Two validation phases are included: one at the end of step 3 regarding the performance of class attribution; one at the end of step 4 regarding the performance of vulnerability evaluations. The validation process can only be performed on the parts of the city for which information concerning the real typological classes is available, for instance from visual inspection of buildings. Therefore, the two validation phases that are involved in the city-scale steps (steps 3 and 4), are performed exclusively on a part of the learning set where knowledge is complete. As the distribution of building types is not homogeneous within a city, the case study analyzed in this paper involves a further validation set, which is lying outside the learning set (see section Evaluation of the Accuracy of Damage Distributions).
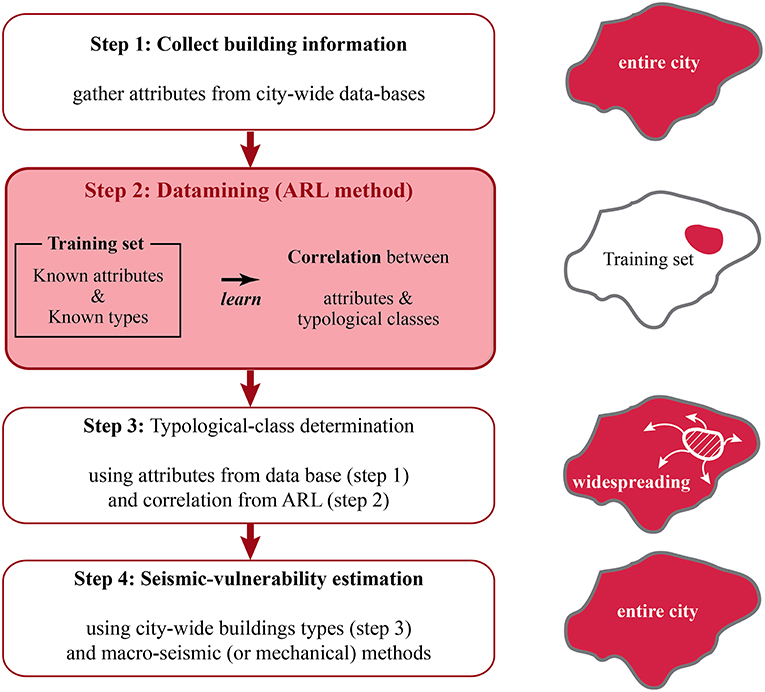
Figure 1. Flowchart describing the learning of correlations in the training set using the association rule learning (ARL) in order to attribute a type to each building and to determine seismic vulnerability at city scale.
In the following sections, the four steps involved in learning correlations between building attributes and typological classes in order to determine city-scale seismic vulnerability are described.
Collection of Building Attributes (STEP 1)
The first step consists in the selection of the attributes needed to describe the analyzed building stock. While several other parameters could be possibly chosen from databases, such as number of inhabitants and monetary value of buildings, four building attributes are collected in this paper in order to apply the ARL method: the period of construction; the number of stories; the footprint surface; and the shape of the roof. These attributes are selected because they are considered to fulfill two criteria: having an influence on the structural behavior of buildings and being retrievable from city-wide databases. Thus, these four parameters are estimated to facilitate understanding of correlations between building attributes and typological classes. The period of construction, the number of stories and the shape of the roof have been chosen accordingly to the previous work of Riedel et al. (2015) while the footprint surface has been added in order to evaluate its influence on the final results. Other valuable attributes, such as shape and percentage of openings, are not considered as few current databases contain this type of attributes.
For applications in Switzerland, the date of construction can be taken from the Federal Register of Buildings and Dwelling (RegBL) of the Federal Statistical Office (BFS in German/OFS in French). This register includes all residential buildings in Switzerland and their dwellings. Data is updated on a trimester basis. Five intervals for the period of construction are defined: before 1900; 1900–1944; 1945–1969; 1970–1988; and after 1989. These intervals correspond to major construction periods: the year 1900 corresponds to a turning point in the development of brick constructions; 1945 and the end of the World War II, has led to a widespreading of new methods in the construction industry; the year 1970 corresponds to the first and very basic seismic considerations in Swiss building codes; and finally in 1989 real seismic considerations have been introduced in Switzerland (Lestuzzi and Badoux, 2013).
The number of floors and the footprint surface are derived from the same database (RegBL). The intervals chosen for the number of floors are: less than 4 stories; between 4 and 6 stories; 7 or more stories. As well other data, such as the official number of the building (EGID number) and geo-coordinates, that are useful for the combination of attributes and for figure editing, are available on the same database.
The shape of the roof (flat/sloped) is not available in the Federal Register of Buildings and Dwellings. This attribute provides information regarding the nature of the roof material and, as a consequence, regarding the construction materials of the entire building. Information concerning the shape of the roof is therefore taken from another source. For the case study of section Case Study, the 3D Model of the city of Basel is considered. This model contains all the buildings of the city in 3D with their roof. Each 3D model corresponds to a single building with its proper EGID (federal building identifier) reference number. Therefore, it is possible to link every 3D with the corresponding building in the RegBL database.
The four attributes selected have been collected for all the buildings composing the asset of the city of Basel.
The Association-Rule-Learning Method (STEP 2)
An essential step of the methodology consists in learning correlations between building attributes and typological classes on a learning subset of the city, for which attributes and typological classes are both known. The method used within the framework of this paper for the attribution of typological classes to buildings is the Association Rule Learning (ARL) method (Riedel et al., 2014): a method for determining relationships between variables in large databases (such as databases of buildings in a city). It has been introduced by Agrawal et al. (1993) as a list of if/then statements that help discovering relationships between seemingly unrelated data. The combination of attributes of buildings (Yj) and the typological classes, Xi, are linked together by a conditional matrix that is derived from the learning set. The probability that the building belongs to a specific class Xi knowing that the combination Yj has a non-zero probability is written P (Xi|Yj) and is defined by:
This method has first been used for seismic applications in the assessment of the city of Grenoble (France) (Riedel et al., 2014). In the case of Grenoble, the vulnerability classes (A, B, C, D and E) of EMS-98 have been considered. Used attributes have been those available in the INSEE (French Institute of Statistics) database, such as the number of floors and the construction period. In this paper, the classes of the Risk-UE project are considered. As mentioned before, the object of the study is the city of Basel in Switzerland.
Definition of the Learning Set
For the learning phase, a small subset of the building stock of the city should be selected. On this learning subset buildings are evaluated individually in order to derive the typological class and the building attributes (as shown in step 2 of Figure 1). Ideally, classes are attributed based on original drawings. However, often such drawings cannot be retrieved and specific types are attributed based on expert-conducted visual inspection. A support for decision-making that takes the form of a decision tree is developed to help data collectors in the field to classify buildings and to guarantee uniform and correct attributions. When typological class attribution is based on visual inspection, misclassifications cannot be excluded. The number of floors—for seismic evaluations—is taken as the number of vibrating masses (number of floor masses in a multiple-degree-of-freedom model). At the end of the survey campaign, all the buildings composing the learning set correspond to a specific typological class (see Table 1) and are characterized by the four attributes collected in step 1.
As first step for the application of the ARL method and to enable a subsequent validation step, the learning set is divided into two parts. The first part is the training set and is composed of randomly selected 30% of the buildings forming the learning set. The training set is used to define correlations between building attributes and typological classes. The remaining 70% of the surveyed buildings are used to evaluate the accuracy of class attribution using the correlations that are defined from the training set. Riedel et al. (2014) have shown that using 30% of the learning set for training results in stable values for assessing the performance of the correlations for type attribution.
The data-mining process defining the ARL method consists in generating a distribution matrix that contains the probability for a building—defined by a combination of the selected attributes—to belong to each typological class. Once the distribution matrix is derived from the training set, the attribute combination allows each building to be assigned with a typological class.
Typology Determination (STEP 3)
The third step consists in the attribution of typological classes to all the buildings composing the city. For the buildings that are not part of the training set, the real typological class is not available since performing a building-by-building survey campaign is hindered by the associated time and money demands. Therefore, for the whole city, only the attributes collected in step 1 are available.
Once correlations between building attributes and typological classes are derived, classes can be attributed following three approaches. The first two methods—called Pmax and Prandom–associate each building to one specific class. The Pmax method attributes each building to the class that has the maximum probability among the same attribute combination. The second method, Prandom, attributes a class to buildings according to random selection. A cumulative probability is calculated for each combination and then, a number from the interval [0, 1] is randomly generated. The random number defines the class of the building from the cumulative probability distribution. The third method—called Pdistribution–does not associate each building to a single class; it associates to each building the probability to belong to each class. For more specifications, see section Wide-Spreading the Typological Association to the Entire City of Basel (STEP 3).
An important step related to city-scale applications of association rules, which are learned on a small subset (training set) of buildings, is validation on a set (validation set) of buildings that are not used to learn association rules and for which real typological classes are known. Depending on the attribution method, various approaches for validation are available, as discussed in the following section.
Validation of Typology Attribution
The accuracy of distribution matrixes can be assessed in two ways, which are related to the two approaches: attributing classes to buildings (association of one specific type to each building, using either Pmax or Prandom) or repartition of probability values corresponding to each type (Pdistribution). For both ways of attribution, the accuracy can be evaluated based on the total distribution of classes. Only for the case of associating one specific typological class to each building, the accuracy of the distribution matrix can also be evaluated using a confusion matrix. Table 2 summarizes the approaches that are used to associate classes to buildings and to evaluate the accuracy on the validation set.
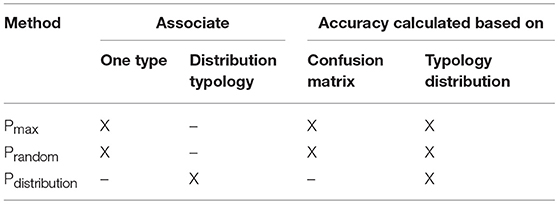
Table 2. Summary of methods to associate a class with ARL and the evaluation of the accuracy using the training set.
Within this paper, accuracy is defined with respect to both, false positives and false negatives. However, when a typology distribution is used to evaluate building attribution, only false negatives affect the accuracy (while false positives tend to increase the accuracy). On the other hand, a confusion matrix allows, in the case of direct association of a specific type to each building (Pmax and Prandom), to compare the attribution of buildings to typological classes by the ARL method with the attribution that is obtained by visual survey. An example of such a confusion matrix is shown in Table 4 (section Evaluation of the Typological-Attribution Accuracy on the Learning Set). Columns of this matrix correspond to the “real” classes attributed, which are obtained by visual survey. Rows correspond to classes that are associated by the ARL method. The values of the diagonal correspond to correctly associated buildings: a building on the diagonal is assigned to the same class by the ARL method and by visual surveys. Buildings that are outside of the diagonal are assigned by the Pmax–ARL method to another class than based on visual surveys.
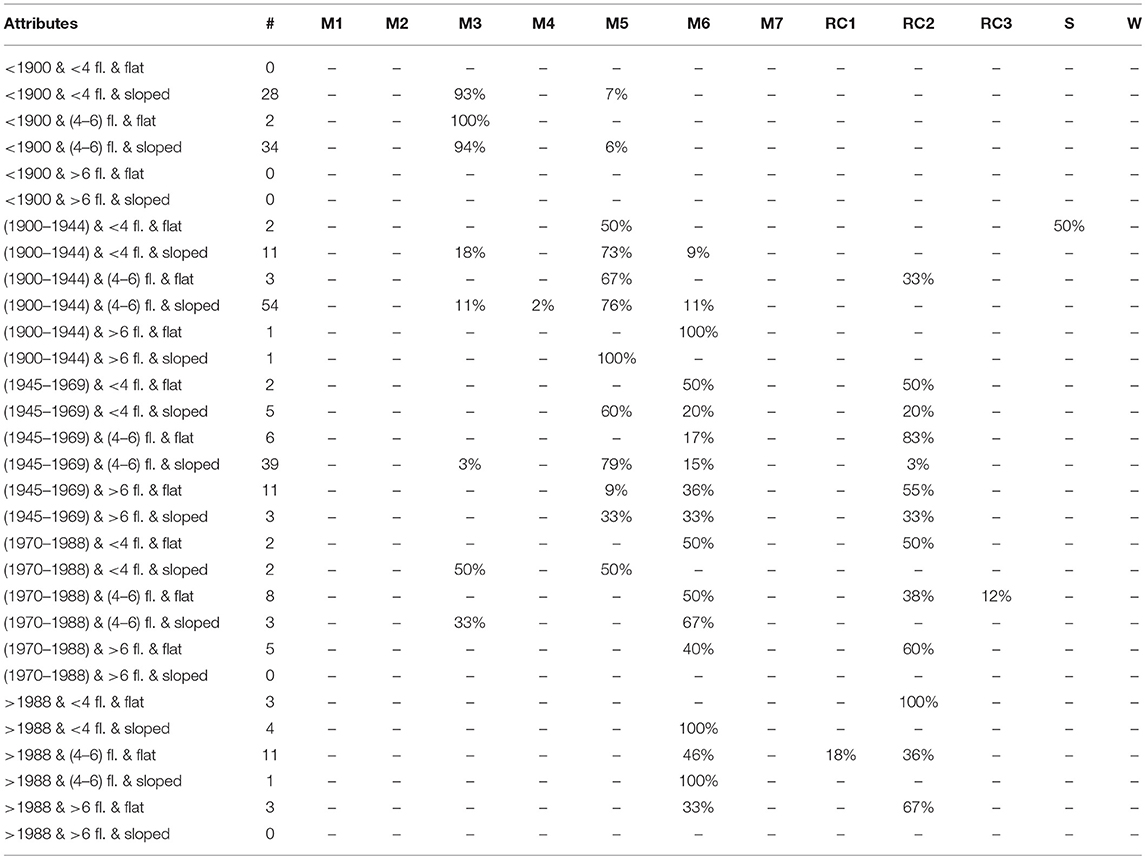
Table 3. Example of a St. Alban typology probability matrix (30% of the visual inspection | 213 buildings) with three attributes (number of stories, construction period, and roof shape).
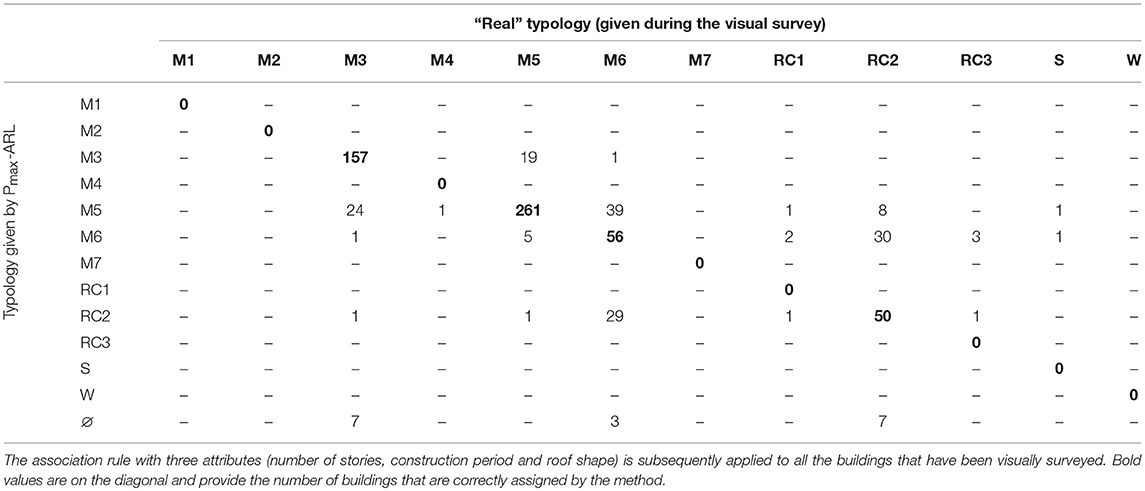
Table 4. Example of a confusion matrix obtained by Pmax-ARL method on the St. Alban district, considering 30% of the visual survey as training set.
For confusion matrixes, the accuracy is defined as the number of buildings, for which classes are correctly attributed (elements of the diagonal, Aii), divided by the total number of buildings (Stehman, 1997). In other terms, the accuracy is the sum of the diagonal divided by the sum of all elements (correctly attributed elements are limited to true positives as in a confusion matrix true negatives for one class are equivalent to true positives for another class):
Thus, confusion matrixes provide the accuracy with respect to false positives and false negatives. An additional step can be done by separating the assessment of accuracy in columns or lines: on one hand, non-diagonal elements in one column provide false negatives and thus, allow calculating the recall score; on the other hand, non-diagonal elements in one row provide false positives and thus, allow quantifying the precision.
Evaluating classification accuracy using probability distributions of classes involves checking whether the general distribution of each class is conserved between the ARL method and visual surveys. The real distribution of classes is the outcome of visual surveying. This distribution is compared with the distribution provided by the ARL method. The distribution corresponding to the ARL method is obtained by multiplying the probability distribution for a given combination of attributes and the number of buildings having this given attribute combination. The accuracy is derived as the difference (in number of buildings) between the “real” and the “derived” distribution (see for an example Table 5 at section Evaluation of the Typological-Attribution Accuracy on the Learning Set):
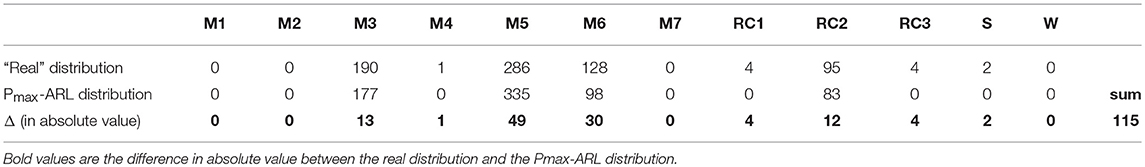
Table 5. “Real” distribution of buildings in St. Alban (obtained from the visually surveyed buildings) and the distribution given by ARL with the Pmax method.
The main difference between the two validation methods is based on the fact that the confusion matrix allows a building-by-building attribution. As a consequence, all miscategorizations are considered as errors. The accuracy values obtained with Equation (2) are therefore lower (accuracy is checked with respect to false positives and false negatives) than the accuracy obtained with the probability distribution. Indeed assessing accuracy with respect to distributions, is a comparison of the sum of columns of the confusion matrix (real distribution) with the sum of rows of the confusion matrix (ARL-based type distribution) and thus, compensation between errors increases accuracy. Probability evaluation is commonly used for large-scale evaluations. It is a mean to understand the total distribution of types. The goal is to establish the total number of buildings in a certain typological class. Thus, errors (whether false positives and false negatives) can compensate each other without impacting the final results. Therefore, general accuracy is higher than the accuracy based on the confusion matrix. If the goal is to obtain an estimate of seismic vulnerability of a given region, rather than the vulnerability of a specific building, this approach is deemed acceptable. It is recalled that both accuracy evaluations can only be performed on the parts of the city where the real typology classification is available.
Seismic-Vulnerability Assessment (STEP 4)
The typological-class attribution (step 3) is the starting point for seismic-vulnerability assessment at urban scale. As introduced in section Introduction, the vulnerability of each type is defined according to appropriate vulnerability functions. Such functions are described by Equation (4):
Where I is the seismic input provided in terms of macro-seismic intensity according to the European scale EMS-98; V is the vulnerability index according to the value of the vulnerability indexes for each type of construction; Q is the ductility index of the structure; μD is the mean damage value that the building is expected to sustain.
Each typological class is linked to specific vulnerability and ductility indexes (V and Q), following previous studies (Lagomarsino and Giovinazzi, 2006). Vulnerability of buildings of the same typological class changes with the height category they belong to. The macro-seismic model (LM1) is used to perform vulnerability assessments. The mean damage that is expected for each class is determined using Equation (4). Thus, the accuracy achieved with the ARL method is assessed with respect to the predicted vulnerability. Classes, such as type M3 and M5, which are hard to distinguish in classification have similar vulnerability indexes, an improvement in accuracy can be expected with respect to typological-class attribution.
Starting from the mean damage (see Equation 4) obtained for each type and height category (related to the number of floors), damage distributions can be obtained. The probability, pk, related to each damage grade Dk (k = 0 … 5), for a given mean damage μD, is evaluated according to the probability mass function of the binomial distribution (Lagomarsino and Giovinazzi, 2006):
Vulnerability can be assessed in two ways. The first one involves a deterministic evaluation: it is only based on the mean damage (μD) (Equation 4) for each class and height category. The second one is based for each class and height category on the distribution of damage grades obtained according to a probability mass function (using Equation 5).
Validation of Vulnerability Assessment
For both methods of vulnerability determination (deterministic and probabilistic), the accuracy is calculated as the sum of the differences in absolute value between the number of buildings attributed by the ARL to each damage grade and the “real” number of building for each damage grade (Diana et al., 2018), according to the following equation:
In a similar way to typology attribution (see section Validation of Typology Attribution), the validation of vulnerability assessments is performed exclusively on the parts of the city for which real typological classes are available following a visual inspection campaign.
Case study
The objective of this paper is related to the seismic-vulnerability assessment of the city of Basel. Seismic hazard is not uniform throughout Switzerland. Some areas are characterized by higher hazard, such as the Basel region in northwestern Switzerland. In particular, the region of the city of Basel is classified in Zone Z3a, where the design value of horizontal acceleration of the ground is (SIA, 2014). The Basel region is characterized by the second-highest seismic hazard in Switzerland after the Valais region (Z3b), according to Appendix F of Swiss codes SIA 261 (SIA, 2014).
In 1356, the Basel region suffered the strongest earthquake ever recorded in the North of the Alps (Lestuzzi and Badoux, 2013). The Swiss Seismological Service (SED) estimates that this earthquake was of magnitude 6.6 on the Richter scale (Swiss Seismological Service, 2016). The return period of this earthquake is larger than the actual one of building codes (475 years) and is estimated to exceed 2000 years. In the present work, the Basel region is exposed to a macro-seismic intensity of IX according to the EMS-98, which corresponds to the shaking level of the 1,356 earthquake.
The Collection of Building Attributes (STEP 1)
Three out of four attributes listed in methodology step 1 [section Collection of Building Attributes (STEP 1)] are collected in the Federal Register of Buildings and Dwelling (RegBL): the period of construction, the number of stories, and the footprint surface. The shape of the roof is collected in the 3D Model of the city of Basel. All these attributes are collected for the whole building stock of the city of Basel, composed of almost 21,000 buildings.
Concerning the number of floors, when performing the visual inspection phase that is essential to step 2, a slight difference between the attribute listed in the RegBL database and the data retrieved on site has been pointed out. For some buildings (32% of the buildings visually inspected) the number of stories listed in the RegBL database does not correspond to the number of stories derived from visual survey. These differences result from underground floors being included in the floor count of the Federal Statistical Office (BFS/OFS). In addition, “Attics and basements are only taken into account if they are designed, even partially, for housing. However, cellars are not taken into consideration” (Federal Statistical Office, 2017, p. 67). As the number of stories (seismic masses) is defined in groups (less than 4 stories, 4–6 stories, equal or more than 7 stories), errors are reduced. Only 8.2 percent of buildings composing the learning set [see section The Learning Phase (STEP 2)] are classified by the RegBL database in a different height category than by on-site visual inspections.
In order to derive the shape of the roof, data are collected from a vectorial 3D model of the entire city, which contains building-by-building features. In order to be able to process roof attribution in an algorithm, data are exported with a specific code. For each building, a mesh polyface of the building coordinates is extracted as a string of coordinates representing triangles of the surfaces.
An algorithm detects which triangles form the three-dimensional surface of the roof. Then, the inclination of the roof is calculated as the angle between the normal vector of the triangle surface and the vertical. In case of multiple surfaces, if horizontal triangles represent more than 40% of the roof surface, then the roof is considered as flat. If not, the roof is considered as sloped. For sloped roofs, the highest slope of all surfaces is taken to define the inclination.
The Learning Phase (STEP 2)
The learning set for the city of Basel is composed of 710 buildings, which are all located in the St. Alban district. The St. Alban district is chosen to be the learning set as it is deemed representative of the general distribution between the typological classes for the entire city of Basel. Indeed, the St. Alban district presents a miscellaneous building stock: buildings with different periods of constructions, heights (number of floors), materials and construction techniques (in aggregates or isolated), compose this district. The district is composed: for the 26% of simple stone masonry buildings (M3), for the 38% of unreinforced masonry brick buildings with flexible floors (M5) and for the 17% of masonry brick buildings with r.c. floors (M6). The remaining 17% is composed of r.c. buildings (RC1 + RC2 + RC3), mainly with resisting walls (RC2). As a consequence, applying ARL method on this district reduces the risk to bias the evaluation. Therefore, the typology correlations that are obtained for St. Alban can be expanded at city scale.
In addition to the four attributes collected in the public databases (step 1), the typological class for each building is defined for the 710 buildings composing the learning set of St. Alban. The attribution of typological classes to buildings is performed by analyzing archive drawings (on 30 buildings) and by performing either on-site or remote visual inspections. In total, among the 710 buildings, 53% have been surveyed online (using google maps or street view), 43% by on-site visual one-by-one inspection, and 4% based on archive drawings. The determination of the typological class for these buildings, following the classes defined in the Risk-UE project (Table 1), has a high certainty as the error in class attribution reduces with increasing amount of information.
To enable the successive validation phase, typological correlations between attributes have been performed on a subset of the learning set. This training set is composed of randomly selected 30% of the buildings composing the learning set (710*0.3 = 213 buildings) while the remaining 70% is considered as the validation set (710*0.7 = 497 buildings). As an example, Table 3 shows a possible ARL matrix obtained from the combination of three attributes (number of stories, construction period and roof shape).
Wide-Spreading the Typological Association to the Entire City of Basel (STEP 3)
The distribution matrix is the starting point to attribute typological classes using the ARL methodology. For the association of a specific typological class to each building, the Pmax and the Prandom methods are considered. For example, when considering the Pmax method attribution, all buildings built in 1929 with six floors and a sloped roof are classified as M5 buildings (see tenth row of Table 3). In the case of the Prandom attribution, a building built in 1929 with six floors and a sloped roof with a random instance equal to 0.93 will be classified as M6 (Figure 2). In the case when a specific typological class is not associated to a single building, the Pdistribution method is considered. In this case, for example, a building built in 1929 with six floors and a sloped roof will have the probability distribution reported in Table 3 (tenth row) to belong to one of the classes M3 (11%), M4 (2%), M5 (76%), or M6 (11%).
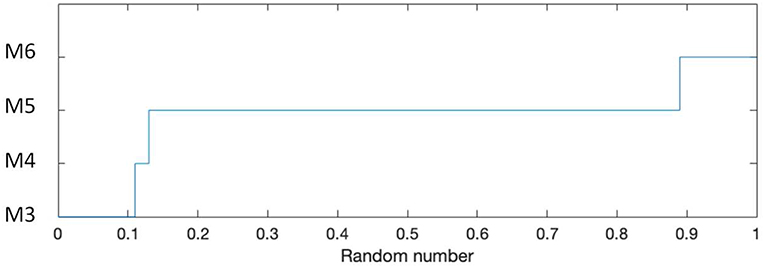
Figure 2. Example of the determination of the building class according to Prandom method for buildings built between 1900 and 1944, with 6 floors and a sloped roof. For random instances between 0 and 0.11, a building type M3 is attributed, for random instances between 0.11 and 0.13 type M4, between 0.13 and 0.89 M5 and over 0.89 type M6.
The distribution matrix (Table 3) is applied to the entire city of Basel (almost 21,000 buildings). Figure 3 shows that the three typological-class distributions (following the three attribution methods Pmax, Prandom and Pdistribution) yield similar predictions when the whole building stock of Basel is considered. Using the Pmax method, classes with low probabilities are ignored unlike for the Prandom and Pdistribution methods. Thus, classes M4, RC1, RC3, and S are not attributed to any building when the Pmax method is used. Prandom and Pdistribution distributions are highly similar, which is expected for large sets of buildings, such as an entire city.
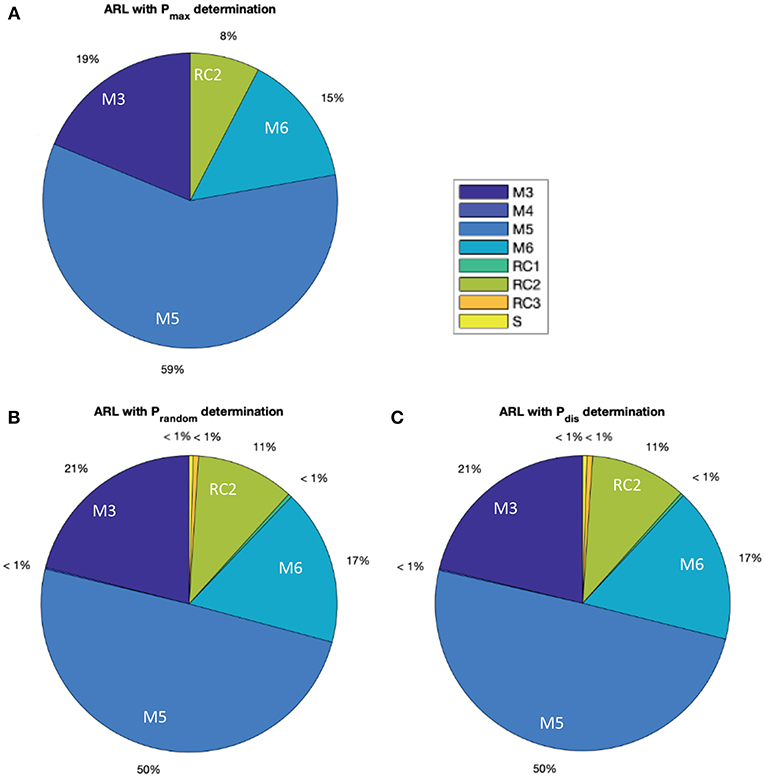
Figure 3. Representation of the distribution of typological classes for the entire city of Basel (A. with Pmax; B. with Prandom; C. with Pdistribution). Class attribution is based on three attributes (construction period, number of stories and roof shape) learned from the learning set in St. Alban [see section The learning phase (STEP 2)].
Seismic-Vulnerability Assessment for the Entire City of Basel (STEP 4)
With the typology distribution being defined in the previous section, the damage distribution for the entire city of Basel can be estimated for any seismic intensity. The damage distribution is achieved by the aggregation of the probability distribution multiplied by the number of related buildings according to the typology distribution (Diana et al., 2018).
Damage distributions for the city of Basel can be obtained for each ARL attribution method (Pmax, Prandom, Pdistribution). The three damage distributions derived from the three ARL attribution methods are similar. As the city of Basel has almost 21,000 buildings, the damage distribution for the Prandom and Pdistribution are identical. Moreover, only slight differences can be observed for damage distribution obtained using the Pmax-ARL.
Damage distribution, based on a probabilistic approach, for the city of Basel is shown in Figure 4 for an earthquake of intensity I = IX. In the case of Figure 4, where buildings are assigned based on three attributes (construction period, number of stories and roof shape), no difference in the damage distribution is observed.
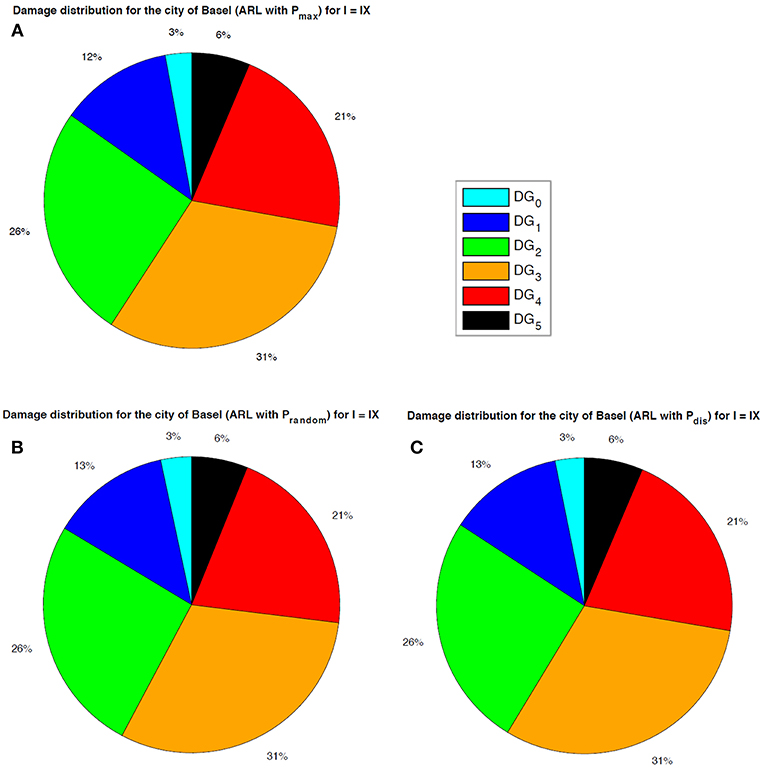
Figure 4. Damage distribution based on probabilistic damage for the city of Basel with an earthquake of intensity I = IX. The three ARL method are considered (A. Pmax; B. Prandom; C. Pdistribution) with St. Alban as training set and considering three attributes (construction period, number of stories and roof shape).
The distribution of damage can be calculated for each zip code (ZIP) of the city, in this way the vulnerability of districts of the city can be evaluated. The Pmax-ARL method considering three attributes (construction period, number of stories and roof shape) is used for the whole Basel building stock.
Figure 5 gives the distribution of damage for each region delimited by a shared ZIP code of the city of Basel after an earthquake of Intensity IX. This graph shows the vulnerability of specific districts in Basel. The most vulnerable district corresponds to ZIP 001, which is the historical city center. In the historic center, 68% of buildings are expected to sustain heavy damage or worse (DG3, DG4, and DG5) after an earthquake of intensity IX. This statement confirms the findings after the L'Aquila earthquake in 2009 about particular vulnerability of city-centers by Guéguen (2013).
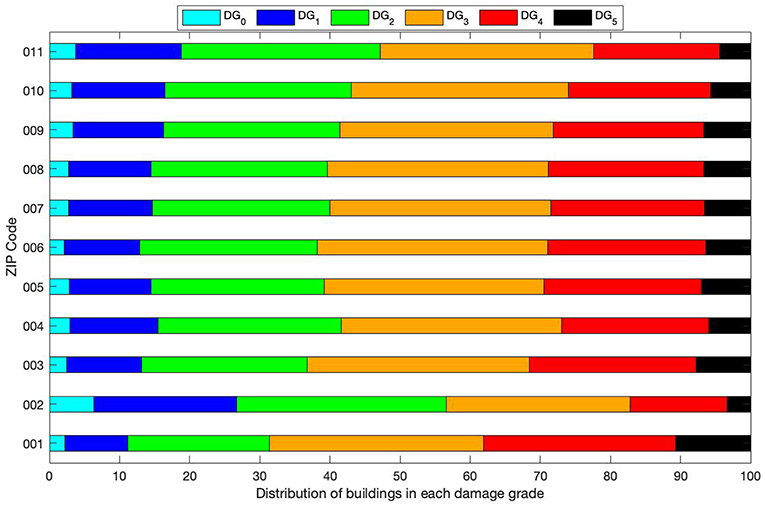
Figure 5. Distribution of damage in each zip code (ZIP) of the districts of the city of Basel.
The least vulnerable district corresponds to the zip code 002: the Universitätspital Basel (Basel university hospital). After an earthquake of intensity IX, there will be 44.6% of buildings with at least heavy damage (DG3, DG4, and DG5). If the Basel university hospital is ignored, the least vulnerable district has ZIP 011, which represents the suburban area. Fifty-six percentage of buildings in this area sustain or exceed heavy damage (DG3, DG4, and DG5) after an earthquake of Intensity IX.
Evaluation of the Typological-Attribution Accuracy on the Learning Set
As discussed in section Validation of Typology Attribution, an important step is validation of the typological-class attribution based on the ARL. In Table 4, the confusion matrix obtained with the direct attribution of typological classes to each building (in this specific case with Pmax) is displayed. The confusion matrix is the mean for evaluate the accuracy of the attribution of types provided by direct attribution methods (Pmax and Prandom). In columns the “real” classes attributed by visual inspection are displayed while in rows the classes associated by ARL method. Therefore, on the diagonal the number of buildings that are correctly assigned are highlighted in bold while on the positions outside the diagonal the errors in attribution are displayed. The buildings on the last row (θ) of Table 4 correspond to buildings that cannot attributed by the ARL method. For such buildings, there exists no building with the same attribute combinations within the buildings that form the training set. For Table 4, accuracy, in accordance with Equation (2), is equal to: 524/710 = 0.738.
The confusion matrix also allows to assess the performance of typological attribution of specific types. For instance, 74 buildings are wrongly attributed to be class M5 and thus, are false positives (precision of 261/(261+74) = 0.78). Also, 25 buildings of type M5 are false negatives as they are not recognized by the ARL method (recall of 261/(261+25) = 0.91). The general score of accuracy combines both types of errors: false positives and false negatives.
In Table 5, the distribution obtained applying the ARL method and the “real” distribution obtained considering visual inspections are displayed. The distribution evaluation is admissible for all the three attribution methods considered (Pmax, Prandom, and Pdistribution). It is an evaluation that is appropriate for large-scale evaluations since it considers exclusively the total number of items being part of a specific class, without considering building-by-building misclassifications. For the example of Table 5, accuracy, calculated using Equation (3), is equal to: 1–115/710 = 0.838. It is worth noting that in distribution evaluation, the accuracy is always higher since errors in class attributions compensate each other.
One of the main goals of the paper is to evaluate the accuracy of building-class attributions that is achieved using several attribute combinations. As stated in section Collection of Building Attributes (STEP 1), considered attributes are: the period of construction; the number of stories; the shape of the roof; and the surface footprint of the building. These four attributes are combined in multiple ways and possible improvements in the class-attribution accuracy are evaluated. Combinations of two attributes (period of construction and number of stories), three attributes (adding either roof shape or surface footprint) and all four attributes are evaluated and compared in Table 6.
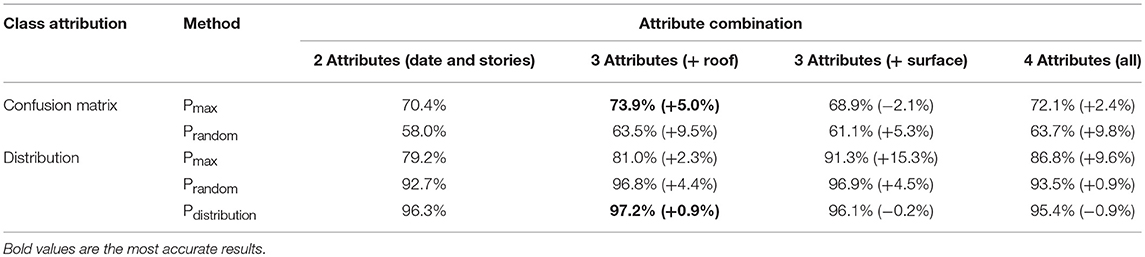
Table 6. Accuracy and change in accuracy for confusion matrix and distribution of classes.
When using the confusion matrix as metric of accuracy, maximum accuracy is obtained by combining three attributes (construction period, number of stories and shape of the roof) and using the Pmax-ARL attribution method. The achieved accuracy is 73.9%. The Pmax method provides more accurate results than the Prandom method as each building is assigned the typological class of maximal probability. More often than not, this assignment is correct.
As can be seen in Table 6 (first two rows), considering more attributes can result in decreasing attribution accuracy. For example, with three attributes (construction date, number of stories and footprint surface), the accuracy of the Pmax-ARL method drops to 68.9% (−2.1%) with respect to the accuracy that is obtained by considering two attributes. When considering four attributes, the accuracy is lower than the accuracy obtained with three attributes (72.1% as opposed to 73.9%). This results from overfitting the training set: the distribution matrix matches the particular data of the training set too closely (with four attributes) and thus, when wide spreading it to a larger set, the lower general validity reduces attribution accuracy. Indeed, random fluctuations in the training data is learned as a correlation between attributes and types. These fluctuations do not apply to new data (validation set) and thus, negatively impact the models ability to generalize.
When assessing classification accuracy using typological distribution (see Table 3), the best accuracy is obtained when three attributes (construction periods, number of stories and shape of the roof) are combined using the Pdistribution-ARL method. The maximum accuracy is 97.2% (see Table 6, last three rows). Unlike when accuracy is assessed using a confusion matrix, the classification obtained based on the Pdistribution (and the Prandom) methods are more accurate than Pmax. For Pdistribution and Prandom attribution methods, the classification follows probabilistic distributions, which explains why they outperform Pmax for which only the class with maximum likelihood is attributed. In general, the accuracy based on the typology distribution is higher than that based on the confusion matrix, since possible errors can be compensated by other errors at larger scale. From Table 6 it can be seen that the shape of the roof seems to be particularly influent, improving substantially the distribution accuracy.
In Figure 6 the number of buildings that are wrongly classified in the case of the two attributes approach (number of stories and period of construction) are represented. On the left of Figure 6, the “real” types for the misclassified buildings are shown, while on the right the types given by the Pmax-ARL method are represented. Thus, Figure 6 can help in understanding the tendencies in mis-attribution of typological classes: as it is possible to notice, errors occur mainly for buildings with four to six floors. In this height interval, for the “before 1900” period, the Pmax-ARL method does not assign any building into the M5-class (bricks masonry with flexible floors), that is in the visually surveyed distribution the most common class. Between 1900 and 1969, the Pmax-ARL method assigns buildings exclusively to class M5 while in the “real” distribution M3- (stone masonry), M4- (massive stone), M6- (brick masonry with rigid floors), and RC2-classes (reinforced concrete wall building) are present.
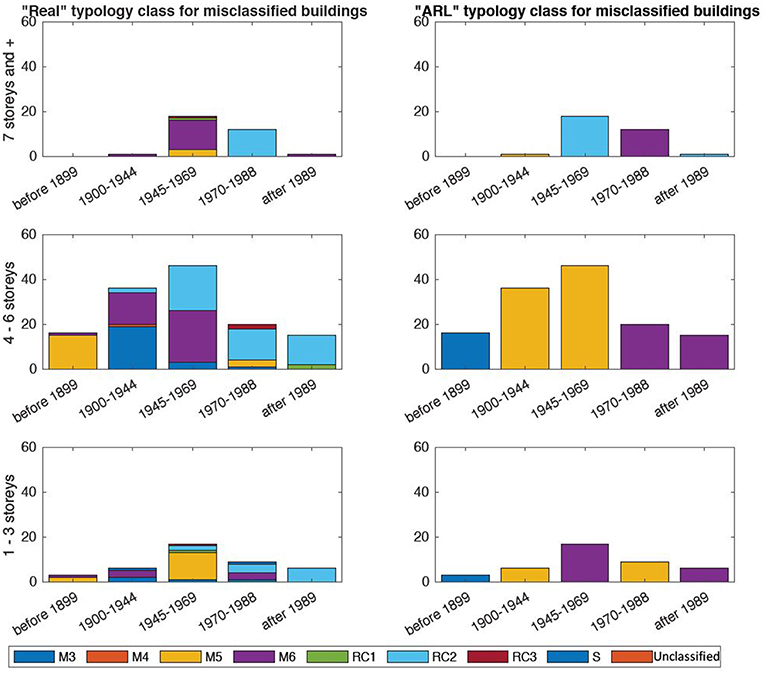
Figure 6. Number of misclassified buildings with Pmax-ARL method (two attributes) on St. Alban with 30% of the survey as training set.
As stated before, the accuracy of class attribution is improved by introducing the shape of the roof. A limit of 5.7° has been chosen as the inclination that separates flat roofs from sloped roofs. Figure 7 shows the distribution of roof shapes for each class that has been visually surveyed in St. Alban. This graph shows that most M3, M4, and M5 buildings have a sloped roof while most reinforced-concrete (RC) and steel buildings (S) have flat roofs. For M6 buildings, 50% have a flat roof and the other 50% have a sloped roof. The shape of the roof seems to be closely related with the typological class, as shown by the improvement in terms of general accuracy in Table 6.
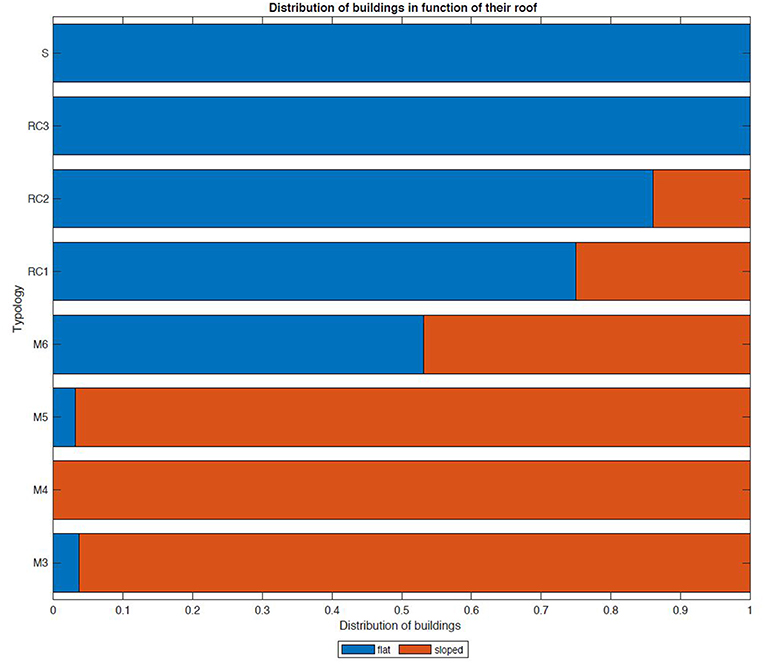
Figure 7. Roof shape for each building in the St. Alban learning set. Roof shapes seem to be closely related with typological classes.
In order to improve the classification accuracy, addition of a third interval for roof slopes, has also been tested. The limit of this angle interval is set as an unknown variable first and the optimal value is derived as the value that maximizes the accuracy. The introduction of this limit angle on classification accuracy is irrelevant. No improvement in accuracy (neither based on the confusion matrix nor on the typological distribution) has been found. Therefore, taking into account two inclination intervals, either flat or sloped, is sufficient.
Evaluation of the Accuracy of Damage Distributions
The accuracy of damage distributions are summarized in Table 7. The best accuracy is obtained when three attributes (construction periods, number of stories and roof shape) are combined and the Prandom-ARL method is used for typological-class attribution (98.4%). The Prandom-ARL method is not stable, as it involves random numbers, but studied random instances provide better results than the Pdistribution-ARL method. For larger amounts of buildings, the accuracy of the Prandom-ARL method equals the accuracy of the Pdistribution-ARL method. Without considering the Prandom-ARL method, the best accuracy is obtained with four attributes (construction periods, number of stories, shape of the roof and footprint surface) with the Pmax-ARL method. The accuracy is 96.3%, which also consists the highest improvement compared with the two-attribute results (+ 7.5%).
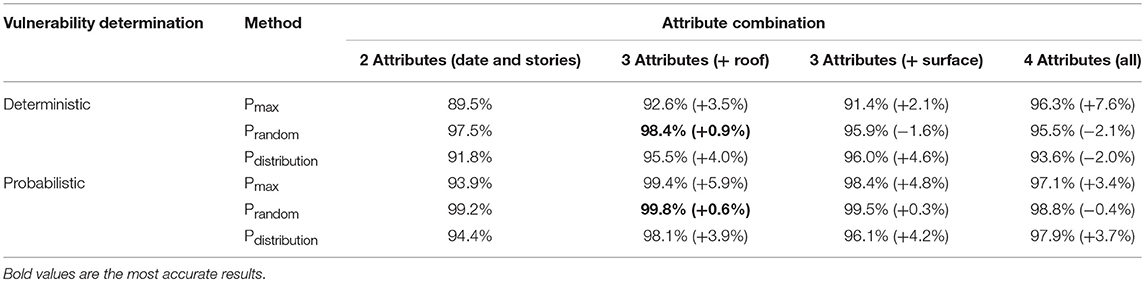
Table 7. Accuracy and change in accuracy for the seismic vulnerability assessment based on the deterministic and probabilistic approach.
Regarding the accuracy of probabilistic vulnerability determination (obtained using Equation 5), the best accuracy is obtained using three attributes (construction periods, number of stories and roof shape) with the Prandom-ARL method (99.8%). Again, this method does not provide stable results and for a large amounts of buildings, accuracy of the Prandom-ARL and the Pdistribution-ARL methods, will yield similar results.
When the Prandom-ARL method is ignored, the best accuracy is obtained with three attributes (construction period, number of stories and shape of the roof) and with the Pmax-ARL method. The accuracy is 99.4%.
Evaluation of the Accuracy for Another District
The accuracy of the ARL method in attributing typological classes is also performed on 223 buildings that have been surveyed in Iselin, another part of the city of Basel. Table 8 (first part) summarizes the accuracy based on the confusion matrix with the improvement of considering three and four attributes. The best accuracy (based on the confusion matrix) is obtained with four attributes (construction periods, number of stories, roof shape and footprint surface) with the Pmax-ARL method. The accuracy is 70.4%.
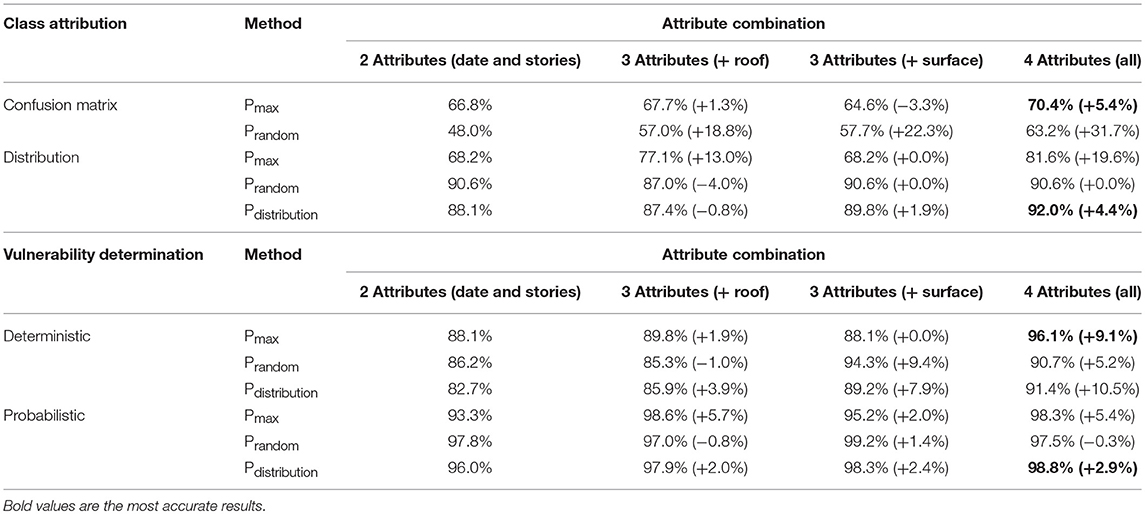
Table 8. Accuracy and change in accuracy results for the district of Iselin.
Considering additional attributes does not always provide better accuracy, as can be seen in Table 8 first row. For instance, with three attributes (construction date, number of stories and footprint surface), the accuracy of the Pmax-ARL method is lower than with two attributes (−3.3%). For the Pmax-ARL method, considering four attributes (construction periods, number of stories, roof shape and footprint surface), instead of two, improves the accuracy by 5.4%.
Table 8 (row three to five) summarizes the accuracy in the distribution of types with the improvement of considering other attributes as the roof shape or the footprint surface. The best accuracy (92%) of the typology distribution is achieved using all four attributes with the Pdistribution-ARL method. The Pdistribution-ARL method, considering four attributes (construction periods, number of stories, roof shape and footprint surface), instead of two attributes, improves accuracy by 4.4%.
Table 8 (first three rows of the second part) summarizes the accuracy for the damage distribution based on the mean damage with the improvement of considering other attributes. The best accuracy for the distribution of mean damage is obtained with four attributes (construction periods, number of stories, roof shape and footprint surface) with the Pmax-ARL method. The accuracy is 96.1%. For the Pmax-ARL method, considering four attributes (construction periods, number of stories, roof shape and footprint surface), instead of only two improves the accuracy for the distribution of mean damage of 9.1%.
The accuracy for the damage distribution based on the probabilistic distribution is summarized in Table 8 (last three rows). The accuracy of damage distribution (with probabilistic damage) is the best for the Pdistribution-ARL method considering all four attributes (construction periods, number of stories, roof shape and footprint surface). The accuracy of the blind check is 98.8%. For the Pmax-ARL method, the accuracy of the damage distribution is higher when only three attributes (construction periods, number of stories and the roof shape) are considered. This accuracy equals 98.6%. While considering three attributes (construction periods, number of stories and roof shape) instead of two improves the accuracy by almost 6%, considering all four attributes instead of three increases accuracy by 5.4%.
Summary and Conclusions
Seismic vulnerability at large scale is time consuming and thus, simplifications are needed. Although a taxonomy should be initially defined to cover the typological classes that compose the building stock, there is potential to speed up the attribution of typological classes to each building using few attributes that are available in existing data-bases, rather than performing visual surveys for each building. In this paper, a typological class attribution based on the association rule learning (ARL) is proposed, based on various combinations of the following attributes: construction periods, number of stories, shape of the roof and footprint surface.
Through a case study, in which the seismic vulnerability is assessed for the entire city of Basel, located in the region with second-highest seismic hazard of Switzerland, the accuracy of a large-scale ARL-based typological-class attribution using attributes that are available in existing databases is assessed. Typological classes of several hundreds of buildings have been derived from visual surveys in a selected district and are used as training set in order to derive correlations between attributes and typological classes. Buildings of another district of the city, for which typological classes have been visually derived, are used as validation tests to evaluate the accuracy of the attribution method.
The following conclusions are drawn:
• in general, for large scale assessments, the loss in accuracy in ARL-based typology attribution is irrelevant when considering seismic damage predictions. Therefore, after defining a rather small learning set (around 5% of the entire building stock of a town), building classes can be assigned to all buildings by considering only three attributes that are readily available in public databases (i.e., period of construction, number of floors, shape of the roof). The reduction in terms of time demand for the preparation of reliable seismic vulnerability scenarios at city scale is particularly pronounced and only slightly reduces accuracy (<5% of error).
• considering all four attributes (period of construction, number of stories, shape of the roof and footprint surface) provides the most accurate typological-class attribution, when buildings from another district than the learning set are used for validation.
• for seismic vulnerability predictions, the loss in accuracy considering three attributes is less relevant than for typological class attribution. In vulnerability evaluations, benefits in time demand when considering only three attributes are therefore strategic in the choice of the number of attributes to gather.
• when considering both, validation of typological class attributions and vulnerability predictions on the learning set, combining three attributes provides more accurate results if compared to the four attributes ones.
• the shape of the roof is an important parameter to consider toward reliable seismic vulnerability assessments and increases accuracy noticeably. Introducing the shape of the roof as third attribute is more useful than footprint surface, especially for the learning set validation. However, introducing more than two categories for the shape of the roof (flat and sloped) does not increase accuracy.
• at the scale of the entire city of Basel, the historic city center is found to be the most vulnerable part of the city while the suburban area results to be the least vulnerable district.
• It should be noted that the work presented in this paper can be further improved by considering several aspects that will be subject for future works:
• starting from confusion matrixes, taking into account false negatives and false positive for each typological class, recall and the precision scores can be calculated. This allows the understanding of error tendencies of the proposed methodology.
• in this paper, the vulnerability indexes of typological classes came from previous European studies. A crucial step consists in verifying whether these indexes correlate well with the vulnerability of buildings of the studied region, Basel. More specifically, these indexes do not consider the interaction between buildings in aggregates.
• in this paper the seismic vulnerability predictions are based on the empirical approach. Mechanical approach will be addressed in future work to check the obtained results.
• with development of 3D-databases, data concerning façade details, such as the window surface, may play a fundamental role in the typological-class attribution since the per-cent of openings provides interesting information on the construction techniques and material used.
Author Contributions
LD: general organization of the research. JT: elaboration of the case study. YR: generation of distribution matrixes. PL: general overview. All authors proofread the paper and agree with the content.
Conflict of Interest Statement
The authors declare that the research was conducted in the absence of any commercial or financial relationships that could be construed as a potential conflict of interest.
Acknowledgments
This work was included in a more comprehensive project framework addressing seismic risk analysis for the city of Basel and was partially financed by the Canton Basel-Stadt.
References
Agrawal, R., Imielinski, T., and Swami, A. (1993). “Mining association rules between sets of items in large databases,” in Proceedings of the 1993 ACM SIGMOD international conference on Management of data—SIGMOD '93 (Washington, DC), 207. doi: 10.1145/170035.17007
Alexander, D. E. (2013). Resilience and disaster risk reduction: an etymological journey. Nat. Hazards Earth Syst. Sci. 13, 2707–2716. doi: 10.5194/nhess-13-2707-2013
Alizadeh, M., Ngah, I., Hashim, M., Pradhan, B., and Pour, A. (2018). A hybrid analytic network process and artificial neural network (ANP-ANN) model for urban earthquake vulnerability assessment. Rem. Sens. 10:975. doi: 10.3390/rs10060975
ATC (Applied Technology Council). (1996). Seismic Evaluation and Retrofit of Concrete Buildings. Report ATC-40, Applied Technology Council, Redwood City, CA.
ATC (Applied Technology Council). (2005). FEMA P-154/January 2015 – Rapid Visual Screening of Buildings for Potential Seismic Hazards: A Handbook. Washington, DC: FEMA–Federal Emergency Management Agency.
Bruneau, M., and Reinhorn, A. (2007). Exploring the concept of seismic resilience for acute care facilities. Earthq. Spectra. 23, 41–62. doi: 10.1193/1.2431396
Brzev, S., Scawthorn, C., Charleson, A. W., Allen, L., Greene, M., Jaiswal, K., et al. (2013). GEM Building Taxonomy Version 2.0. GEM Technical Report 2013-02 V1.0.0, 188 pp., GEM Foundation, Pavia.
Burton, H. V., Deierlein, G., Lallemant, D., and Lin, T. (2015). Framework for incorporating probabilistic building performance in the assessment of community seismic resilience. J. Struct. Eng. 142:C4015007. doi: 10.1061/(ASCE)ST.1943-541X.0001321
Carreño, M. L., Cardona, O. D., and Barbat, A. H. (2007). Urban seismic risk evaluation: a holistic approach. Nat. Hazards. 40, 137–172. doi: 10.1007/s11069-006-0008-8
Cimellaro, G. P., Reinhorn, A. M., and Bruneau, M. (2010a). Framework for analytical quantification of disaster resilience. Eng. Struct. 32, 3639–3649. doi: 10.1016/j.engstruct.2010.08.008
Cimellaro, G. P., Reinhorn, A. M., and Bruneau, M. (2010b). Seismic resilience of a hospital system. Struct. Infrastruct. Eng. 6, 127–144. doi: 10.1080/15732470802663847
Diana, L., Manno, A., Lestuzzi, P., Podestà, S., and Luchini, C. (2018). Impact of displacement demand reliability for seismic vulnerability assessment at an urban scale. Soil Dyn. Earthq. Eng. 112, 35–52. doi: 10.1016/j.soildyn.2018.05.002
EERI. (2004). World Housing Encyclopedia – Summary Publication 2004, eds S. Brzev, and M. Greene (Oakland, CA: Earthquake Engineering Research Institute), 120pp.
Ehrlich, D., Kemper, T., Blaes, X., and Soille, P. (2013). Extracting building stock information from optical satellite imagery for mapping earthquake exposure and its vulnerability. Nat. Hazards. 68, 79–95. doi: 10.1007/s11069-012-0482-0
Federal Statistical Office (2017). Catalogue des caractères, Registre fédéral des bâtiments et des logements, Version 4. Neuchâtel: Office fédéral de la statistique (OFS) (in French).
Giovinazzi, S., and Lagomarsino, S. (2001). “A methodology for the seismic vulnerability analysis of buildings,” in Proc. 10th Italian Conference on Earthquake Engineering (Potenza).
Grünthal, G., Musson, R. M. W., Schwarz, J., and Stucchi, M. (2001). European macroseismic scale 1998, EMS-98. Cahiers du Centre Européen de Géodynamique et de Séismologie, Vol. 19. Luxembourg: Conseil de l'Europe.
Jaiswal, K. S., and Wald, D. J. (2008). Creating a Global Building Inventory for Earthquake Loss Assessment and Risk Management. U.S. Geological Survey Open-File Report 2008-1160, 103pp.
Lagomarsino, S., and Giovinazzi, S. (2006). Macroseismic and mechanical models for the vulnerability and damage assessment of current buildings. Bull. Earthq. Eng. 4, 415–443. doi: 10.1007/s10518-006-9024-z
Lestuzzi, P., and Badoux, M. (2013). Evaluation parasismique des constructions existantes. Lausanne: Presses polytechniques et universitaires romandes (in French).
Lestuzzi, P., Podestà, S., Luchini, C., Garofano, A., Kazantzidou-Firtinidou, D., Bozzano, C., et al. (2016). Seismic vulnerability assessment at urban scale for two typical Swiss cities using Risk-UE methodology. Nat. Hazards. 84, 249–269. doi: 10.1007/s11069-016-2420-z
Lestuzzi, P., Podestà, S., Luchini, C., Garofano, A., Kazantzidou-Firtinidou, D., and Bozzano, C. (2017). Validation and improvement of Risk-UE LM2 capacity curves for URM buildings with stiff floors and RC shear walls buildings. Bull. Earthq. Eng. 15, 1111–1134. doi: 10.1007/s10518-016-9981-9
Mallepudi, S. A., Calix, R. A., and Knapp, G. M. (2011). “Material classification and automatic content enrichment of images using supervised learning and knowledge bases,” in Proceedings of SPIE 7881, Multimedia on Mobile Devices 2011; and Multimedia Content Access: Algorithms and Systems V, 788113 (San Francisco, CA).
Marquis, F., Jenna Jihyun, K., Elwood, K. J., and Chang, S. E. (2017). Understanding post-earthquake decisions on multi-storey concrete buildings in Christchurch, New Zeland. Bull. Earthq. Eng. 15, 731–758. doi: 10.1007/s10518-015-9772-8
McEntire, D. A., and Cope, J. (2004). Damage Assessment After the Paso Robles, San Simeon, California, Earthquake: Lessons for Emergency Management. Natural Hazards Center, Quick Response Research Report #166.
Mouroux, P., Bertrand, E., Bour, M., Le Brun, B., Depinois, S., Masure, P., et al. (2004). “The European RISK-UE Project: an advanced approach to earthquake risk scenarios,” in 13th World Conference on Earthquake Engineering (WCEE) (Vancouver), 1–6 Aug 2004, Paper No. 3329.
Mouroux, P., and Le Brun, B. (2006). Presentation of RISK-UE Project. Bull. Earthq. Eng. 4, 323–339. doi: 10.1007/s10518-006-9020-3
Porter, K. A., Kiremidjian, A. S., and LeGrue, J. S. (2001). Assembly-based vulnerability of buildings and its use in performance evaluation. Earthq. Spectra. 17, 291–312. doi: 10.1193/1.1586176
Riedel, I., Guéguen, P., Dalla Mura, M., Pathier, E., Leduc, T., and Chanussot, J. (2015). Seismic vulnerability assessment of urban environments in moderate-to-low seismic hazard regions using association rule learning and support vector machine methods. Nat. Hazards. 76, 1111–1141. doi: 10.1007/s11069-014-1538-0
Riedel, I., Guéguen, P., Dunand, F., and Cottaz, S. (2014). Macroscale vulnerability assessment of cities using association rule learning. Seismol. Res. Lett. 85, 295–305. doi: 10.1785/0220130148
SIA. (2014). SIA, 261 - Actions sur les Structures Porteuses. Zurich: Société Suisse des ingénieurs et des architects.
Stehman, S. (1997). Selecting and interpreting measures of thematic classification accuracy. Rem. Sens. Environ. 62, 77–89.
Suzuki, T., Sugizaki, R., Kawabata, K., Hada, Y., and Tobe, Y. (2010). Autonomous deployment and restoration of sensor network using mobile robots. Int. J. Adv. Robot. Syst. 7:15. doi: 10.5772/9696
Swiss Seismological Service. (2016). Historical Earthquakes [En ligne]. Available online at: http://www.seismo.ethz.ch/en/knowledge/earthquake-country-switzerland/historicalearthquakes/basel-1356/
Xiong, C., Lu, X. Z., Huang, J., and Guan, H. (2018). Multi-LOD seismic-damage simulation of urban buildings and case study in Beijing CBD. Bull. Earthq. Eng. 17, 2037–2057. doi: 10.1007/s10518-018-00522-y
Keywords: seismic vulnerability, urban scale, existing buildings, data mining, damage distribution
Citation: Diana L, Thiriot J, Reuland Y and Lestuzzi P (2019) Application of Association Rules to Determine Building Typological Classes for Seismic Damage Predictions at Regional Scale: The Case Study of Basel. Front. Built Environ. 5:51. doi: 10.3389/fbuil.2019.00051
Received: 31 January 2019; Accepted: 01 April 2019;
Published: 17 April 2019.
Edited by:
Katsuichiro Goda, University of Western Ontario, CanadaReviewed by:
Viviana Iris Novelli, University of Bristol, United KingdomXinzheng Lu, Tsinghua University, China
Copyright © 2019 Diana, Thiriot, Reuland and Lestuzzi. This is an open-access article distributed under the terms of the Creative Commons Attribution License (CC BY). The use, distribution or reproduction in other forums is permitted, provided the original author(s) and the copyright owner(s) are credited and that the original publication in this journal is cited, in accordance with accepted academic practice. No use, distribution or reproduction is permitted which does not comply with these terms.
*Correspondence: Lorenzo Diana, bG9yZW56by5kaWFuYUBlcGZsLmNo