 Junta Nakano
 Shin-ichi Tanabe
- 1Department of Architecture and Building Engineering, School of Engineering, Tokai University, Hiratsuka, Japan
- 2Department of Architecture, School of Creative Science and Engineering, Waseda University, Tokyo, Japan
In this work, thermal adaptation characteristics and thermal comfort zones were investigated in urban semi-outdoor environments in Tokyo. Four spaces with different levels of environmental control, i.e., heating, ventilation, and air conditioning (HVAC) spaces and non-HVAC spaces, were selected for the seasonal field surveys lasting over a period of 80 days. The survey consisted of the thermal environment measurement, questionnaire survey, and observation of occupancy conditions. The occupants were adapting themselves to fit within a certain range of standard effective temperature (SET∗). Clothing adjustment was the principal form of behavioral adaptation. The dominant factor affecting the clothing adjustment was the daily mean outdoor temperature, and not the immediate environment, in both the non-HVAC and the HVAC spaces. The total number of occupants and the mean occupancy period of the day had a strong linear relationship with the daily mean air temperature of the occupied zone in the non-HVAC spaces. No correlation was found between the thermal environment and the occupancy conditions in the HVAC spaces. Adaptive thermal comfort zones, not comfort temperatures, were derived directly from the subjective votes. The comfort zone in SET∗ was found to be 23–28°C for the predicted percentage of dissatisfied (PPD), 18–29°C for HVAC spaces, and 14–32°C for non-HVAC spaces. Occupants in semi-outdoor environments were tolerant to their thermal environment two to three times wider in range than the one predicted by the PPD. These findings are expected to be useful in the design and assessment of urban semi-outdoor environments.
Introduction
Semi-outdoor environments refer to built environments where natural outdoor elements, such as daylight and fresh air, are designedly introduced. A semi-outdoor environment falls in between the environmental engineering categories of indoor and outdoor environments; an indoor environment refers to a thermal environment that is controlled for the thermal comfort of its occupants, whereas an outdoor environment is one whose occupants are required to adjust themselves to achieve thermal comfort. The degree of environmental control may range from simple shading to moderate air conditioning. Examples of such environments can be found in various urban spaces such as open cafes, terraces, arcades, atriums, train stations, and so forth. As the thermal environment is intended to only be moderately controlled within a semi-outdoor environment, occupants are likely to expect an environment that is different from indoors. Application of an indoor thermal comfort zone for air-conditioned spaces as defined in the ASHRAE 55 standard (American Society of Heating, Refrigerating, and Air-Conditioning Engineers [ASHRAE], 2017) would lead to excessive energy consumption due to excessive environmental control. On the other hand, a failure to have an environment within an acceptable range may discourage people from using such a space.
Various outdoor thermal indices have been developed to describe thermal conditions for human occupancy. The wet bulb globe temperature (WBGT) for hot environments and wind chill index (WCI) for cold environments are the two indices widely used to assess heat stress. For outdoor comfort assessment, the physiological equivalent temperature index (PET) (Höppe, 1999) employed in VDI 2787 (Deutsches Institut für Normung [DIN], 2008) enables human biometeorological evaluation of climate at the regional level. The universal thermal climate index (UTCI) (Błażejczyk et al., 2010) developed by the International Society on Biometeorology is used widely for biometeorological applications. Pickup and de Dear (2000) proposed outdoor standard effective temperature (OUT_SET∗), standard effective temperature (SET∗) modified to include the effect of solar radiation, for evaluation of thermal comfort in outdoor and semi-outdoor environments. PET, UTCI, and SET∗ are all defined as the air temperature of the reference condition but give different values for the same environment. Indices developed for outdoor comfort evaluation target wide range of weather conditions, and prerequisites for the reference condition is different from those of SET∗. An index developed to evaluate a narrower range around thermally neutral conditions is more suited for application in thermal environments, in and around buildings.
The semi-outdoor environments discussed in this study refer to environments that are controlled to various degrees by building engineering. Chun and Tamura (1998) conducted subjective experiments in underground shopping malls and in a department store; these were spaces representative of unstable and stable thermal conditions, respectively. The acceptable temperature range in a department store remained stable and narrow between seasons, while the temperature range in underground malls was much wider, corresponding to seasonal changes in the thermal environment. Spagnolo and de Dear (2003) reported that a large proportion of occupants outside the indoor thermal standard comfort zone found their conditions acceptable in a semi-outdoor environment and indicated the importance of psychological dimensions in the perception of the thermal environment. Nakano and Tanabe (2004) conducted seasonal field studies in semi-outdoor spaces located in Tokyo. Comfort zones in SET∗ are proposed to be19.2–28.9°C for air-conditioned spaces and 15.8–33.7°C for spaces without air conditioning.
Nikolopoulou and Steemers (2003) point out that the concept of adaptation would be effective in understanding thermal comfort in outdoor and semi-outdoor environments. Thermal adaptation can be classified into behavioral, physiological, and psychological processes (Brager and de Dear, 1998). Behavioral adaptation in terms of personal adjustment includes adjustment of clothing, activity, posture, or selection of environment. Physiological adaptation is the acclimatization of the human body to the exposed environment. Psychological adaptation is the change in perception of an environment caused by expectation and habituation. Process or degree of adaptation is affected by environmental context (Humphreys and Nicol, 1998). Thermal adaptation is actively observed in free running or naturally ventilated buildings where environmental features are closer to the outdoor environment than in air-conditioned buildings (de Dear and Brager, 1998; Nicol and Humphreys, 2010). The accumulation of knowledge, based on field studies, have led to the development of empirical comfort models for naturally ventilated buildings, known as the adaptive models. These models predict indoor comfort temperature as a linear function of prevailing outdoor temperature.
Comfort zone, based on adaptive models, are adopted in ASHRAE 55 and ISO 17772-1 (International Organization for Standardization [ISO], 2017). Adaptive standards apply to “indoor spaces designed for human occupancy for periods not less than 15 min” (American Society of Heating, Refrigerating, and Air-Conditioning Engineers [ASHRAE], 2017) with no mechanical heating or cooling. This requirement represents the context of office buildings where the field data for adaptive models were collected and is not equivalent to the concept of the semi-outdoor environment cited in this study. Pitts (2013) categorized transition spaces in buildings into entrance zones, circulation zones, and zones of longer residence. Recommendation of predicted mean vote (PMV) ranges similar to ISO 17772-1 is proposed for each category. The applicability of these recommended comfort ranges needs to be tested. The objective of this study is to investigate thermal adaptation characteristics and the thermal comfort zone of occupants in urban semi-outdoor environments. The outcomes are expected to provide useful information for the design and assessment of such environments. Most data used for analysis in this study were collected from field surveys of an earlier study by Nakano and Tanabe (2004). Outdoor temperatures were unusually low during the summer survey and rarely exceeded 30°C. An additional summer survey of 14 days was conducted in 2003 to supplement typical seasonal data and new sets of 547 observations on subjective responses and environmental variables were added. This study presents additional information on occupant behavior and on comfort zones based on newly proposed methods of analysis, for a deeper understanding of thermal comfort in urban semi-outdoor environments.
Materials And Methods
Survey Areas
Four urban spaces with different levels of environmental control were selected in Tokyo, Japan. Spaces P and B were closed atriums, air conditioned throughout the year (HVAC spaces). Spaces O and T were open public spaces without air-conditioning (non-HVAC spaces). The common feature was that all four spaces were large-scale precincts open to the public, designed as a part of a shopping and office complex for the roaming and resting of visitors. Mechanical means of personal environment control was unavailable in neither HVAC spaces nor non-HVAC spaces. Details of the survey areas are listed in Table 1 and Supplementary Figure 1. Monthly mean outdoor air temperature and relative humidity of Tokyo, based on meteorological observation from 2001 to 2003, are presented in Figure 1. The climate of Tokyo can be divided into four seasons. Winters with a mean temperature of 8°C, observed in December, January, and February. Hot and humid summers are in July, August and early September; average temperatures are around 26°C and may reach up to a maximum of 38°C. Outdoor temperatures in the intermittent seasons of spring and autumn, lie in between those found in summer and winter. Relative humidity is high during summer, at about 70%, and low during winter, at about 50%.
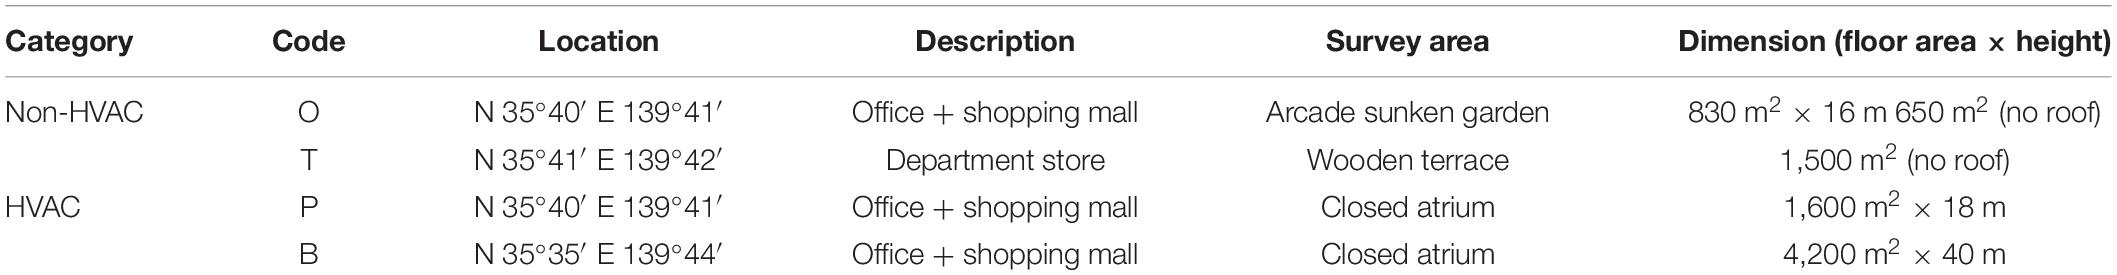
Table 1. Description of survey areas.
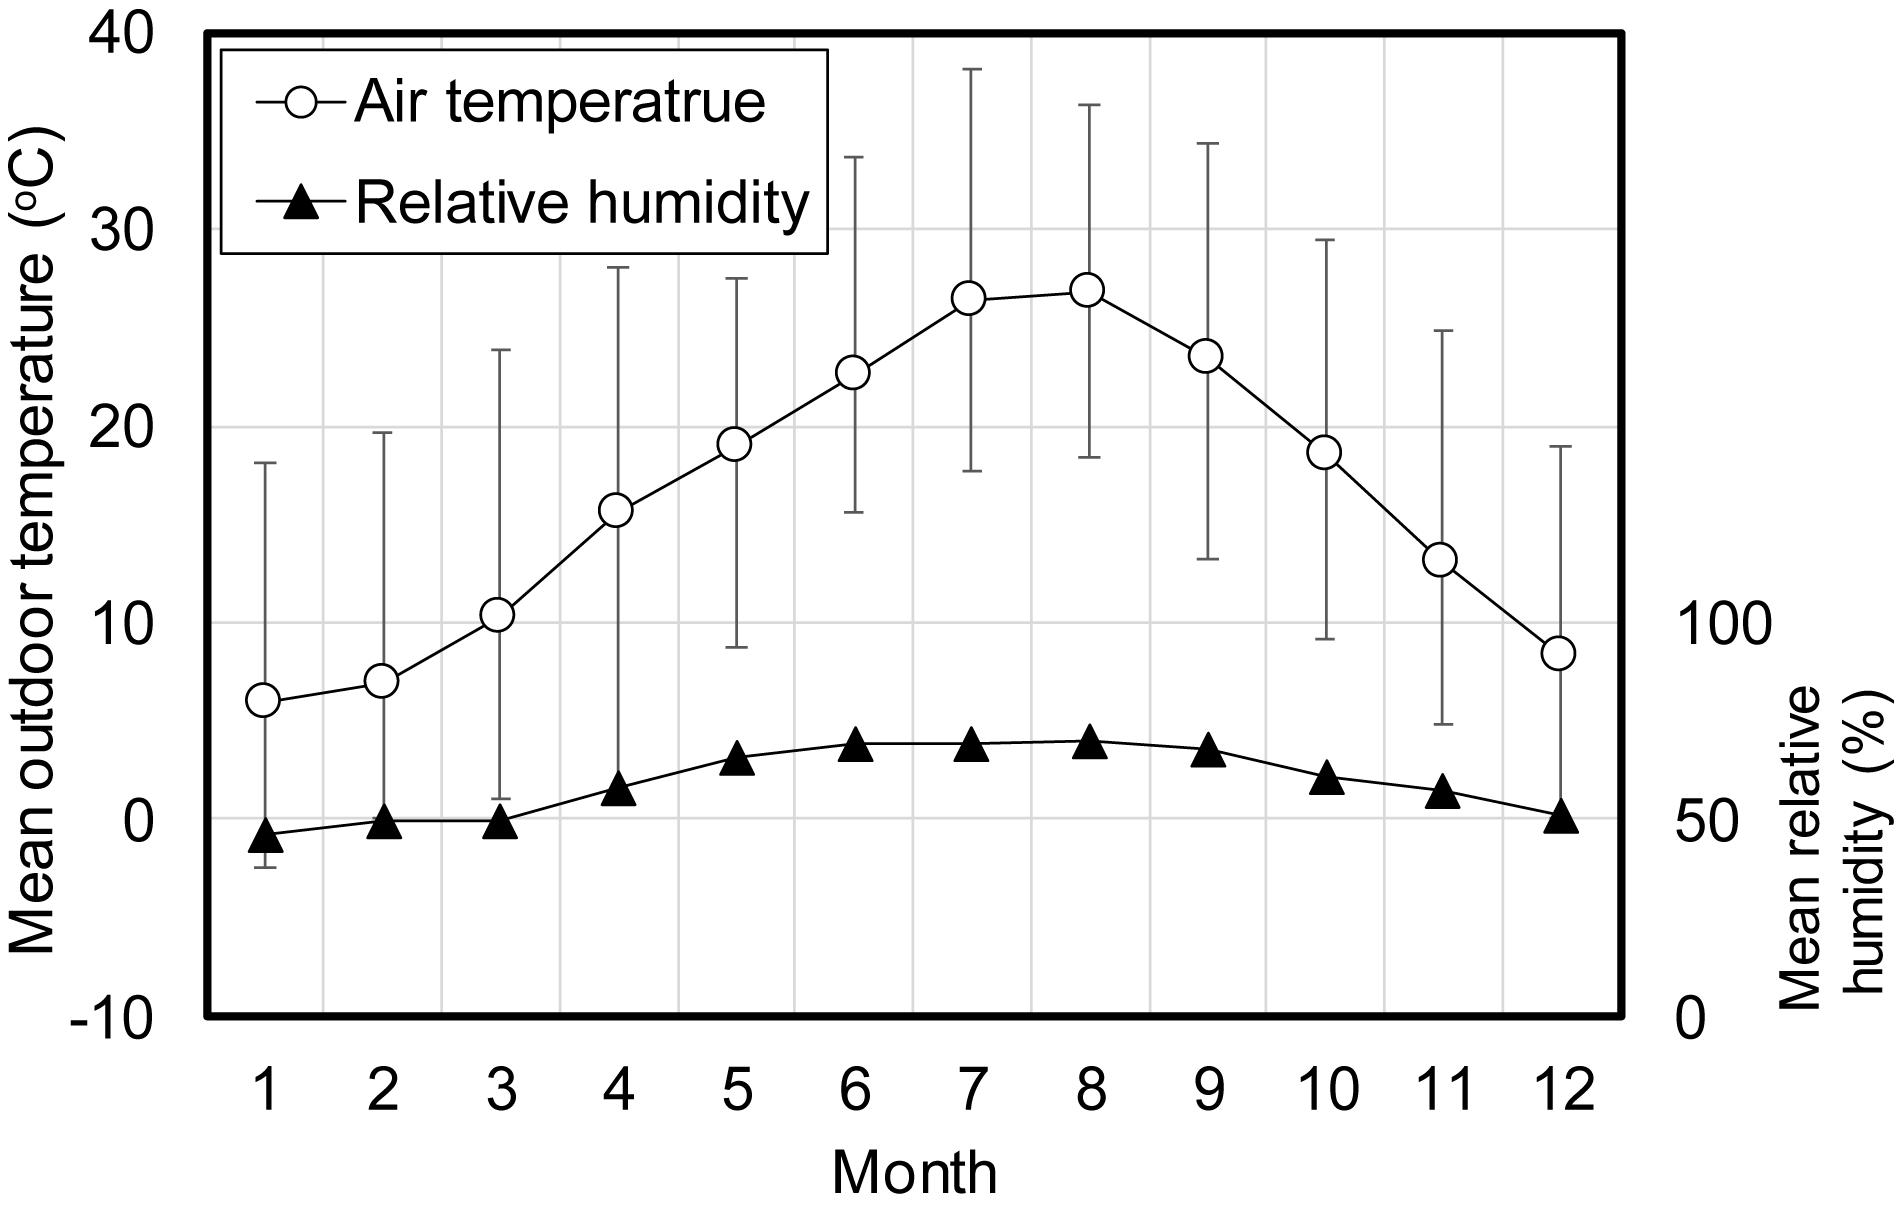
Figure 1. Monthly mean outdoor conditions of Tokyo from 2001 to 2003. Error bars show the maximum and the minimum values of the month.
Survey Design
Four seasonal surveys from the summer of 2001 to the spring of 2002 and an additional survey in the summer of 2003 were conducted. Field measurements from 10:00 to 18:00 each day were carried out for 4 days per space per season. Surveys were suspended on rainy days in non-HVAC spaces. Analysis is based on data from a total of 80 days in this study. Three methods were integrated into the survey design: (1) investigation of occupancy conditions, (2) survey via questionnaire, and (3) thermal environment measurement. The present study focused on short-term occupants defined as visitors who sat down in the survey area. Visitors passing by or standing in the area were left out and not considered.
The occupancy period was measured by randomly selecting visitors in the area and recording their arrival and departure times. The daily mean occupancy period was derived from approximately 100 observations per day. The number of occupants within the survey area was also counted every 10 min. The same occupant was counted several times if the occupancy period was longer than the counting interval. The total number of occupants per day was derived for each survey day.
The questionnaire included questions concerning general comfort, thermal sensation, thermal preference, and thermal acceptability. The subjective scales used for thermal comfort evaluation are presented in Table 2. Background information on occupants, purpose and frequency of visit, activity within 15 min, and clothing items were also asked. The clothing garment checklist is given in Supplementary Figure 2. The clo value for each garment, corresponding to ISO 9920 (International Organization for Standardization [ISO], 1995), was summed to derive total clothing insulation. Thermal insulation for seats with hard surfaces (i.e., plastic, wood, and aluminum) were not considered, but 0.15 clo was added for occupants sitting on cushioned chairs within space P. As clothing was expected to be an important means of behavioral adaptation, a process of crosschecking was employed. Occupant responses on clothing items were compared with the garment checklist recorded via visual observations of survey staff; the clothing was confirmed to be what the respondents were wearing at the time of questionnaire.
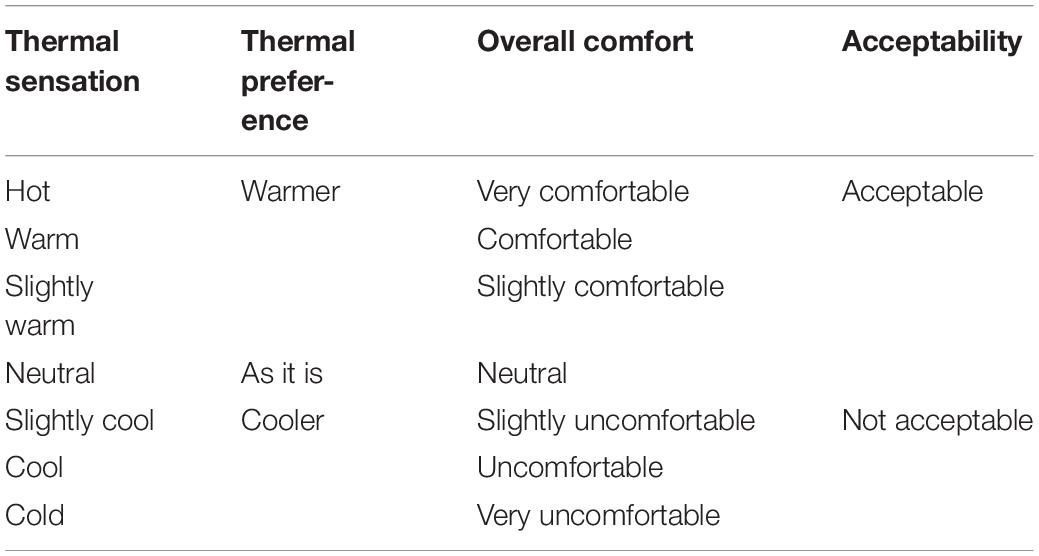
Table 2. Subjective scales for thermal comfort evaluation.
Outdoor temperature and humidity were recorded on site. Data from the nearest meteorological station was also referenced for general climatic observation. A mobile measurement cart equipped with batteries for a full day of operation was devised to measure the immediate thermal environment around the occupant. The accuracies of the instruments are presented in Table 3. Air temperature, humidity, and air velocity were measured at heights of 0.1 m, 0.6 m, 1.1 m, and 1.7 m above ground. Radiation from six directions (up, down, front, back, left, right), was evaluated by measuring the total radiation (0.3–4.0 μm) and solar radiation (0.4–1.1 μm) separately at 1.1 m above ground.
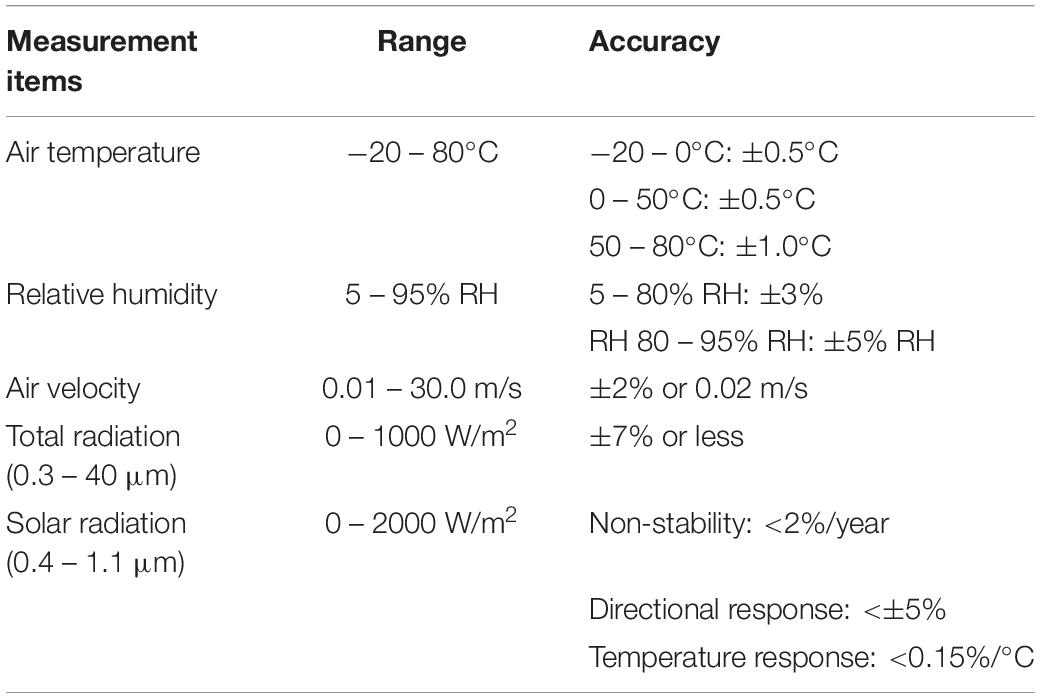
Table 3. Accuracy of measurement instruments.
After obtaining occupant consent to answer the questionnaire, another member of the survey staff pushed the cart to a spot near the respondent in order to measure the surrounding environment for 10 min. A 5-min average prior to the end of each measurement was regarded as the representative thermal environment. The aim was to measure the environment closest to each respondent in terms of time and space. A total of 2,711 sets of valid occupant responses and the corresponding thermal environment variables were collected throughout the project. A snapshot of the survey is presented in Supplementary Figure 3. Statistical summaries of the measured environmental variables and subjective votes are given in Supplementary Tables 1, 2 respectively.
Calculation of Thermal Indices
Thermal indices were calculated for each questionnaire respondent using the environmental variables measured at 1.1 m above ground and the crosschecked clothing insulation recorded on the questionnaire.
Mean radiant temperature (MRT) incorporating the effects of solar radiation was calculated using Equation (1) (Deutsches Institut für Normung [DIN], 2008). Longwave radiation (Li) was derived by subtracting solar radiation (Ii) from the total radiation for each of the six directions (subscript i).
where σ is the Stefan-Boltzmann constant [5.67 × 10⁻⁸W/(m2K4)], a is the solar absorptance of the clothed human body (0.66), and ε is the longwave emissivity of clothed human body (0.97). Fi is the directional weighting factor based on projected area of a seated person (International Organization for Standardization [ISO], 1998). Operative temperature (OT) was derived from the average of air temperature and MRT. SET∗ was calculated by ASHRAE Thermal Comfort Tool (Huizenga, 2011) assuming the metabolic rate of 1.1 met for a seated person with minor influence of prior activity.
Results
Outdoor Climate
The daily mean outdoor temperature of all survey days measured on site (10:00–18:00) is plotted against a merged annual timeline (2001–2003) in Figure 2A. Mean outdoor temperatures reached 33°C in the summer and the lowest value of 7°C was recorded in winter. The average relative humidity was 65% in summer and 48% in winter, and readings of outdoor temperature and humidity in the spring and autumn were in between those of summer and winter. Outdoor conditions of the survey were confirmed to represent the seasonal characteristics of the climate in Tokyo as described in section “Survey Areas.”
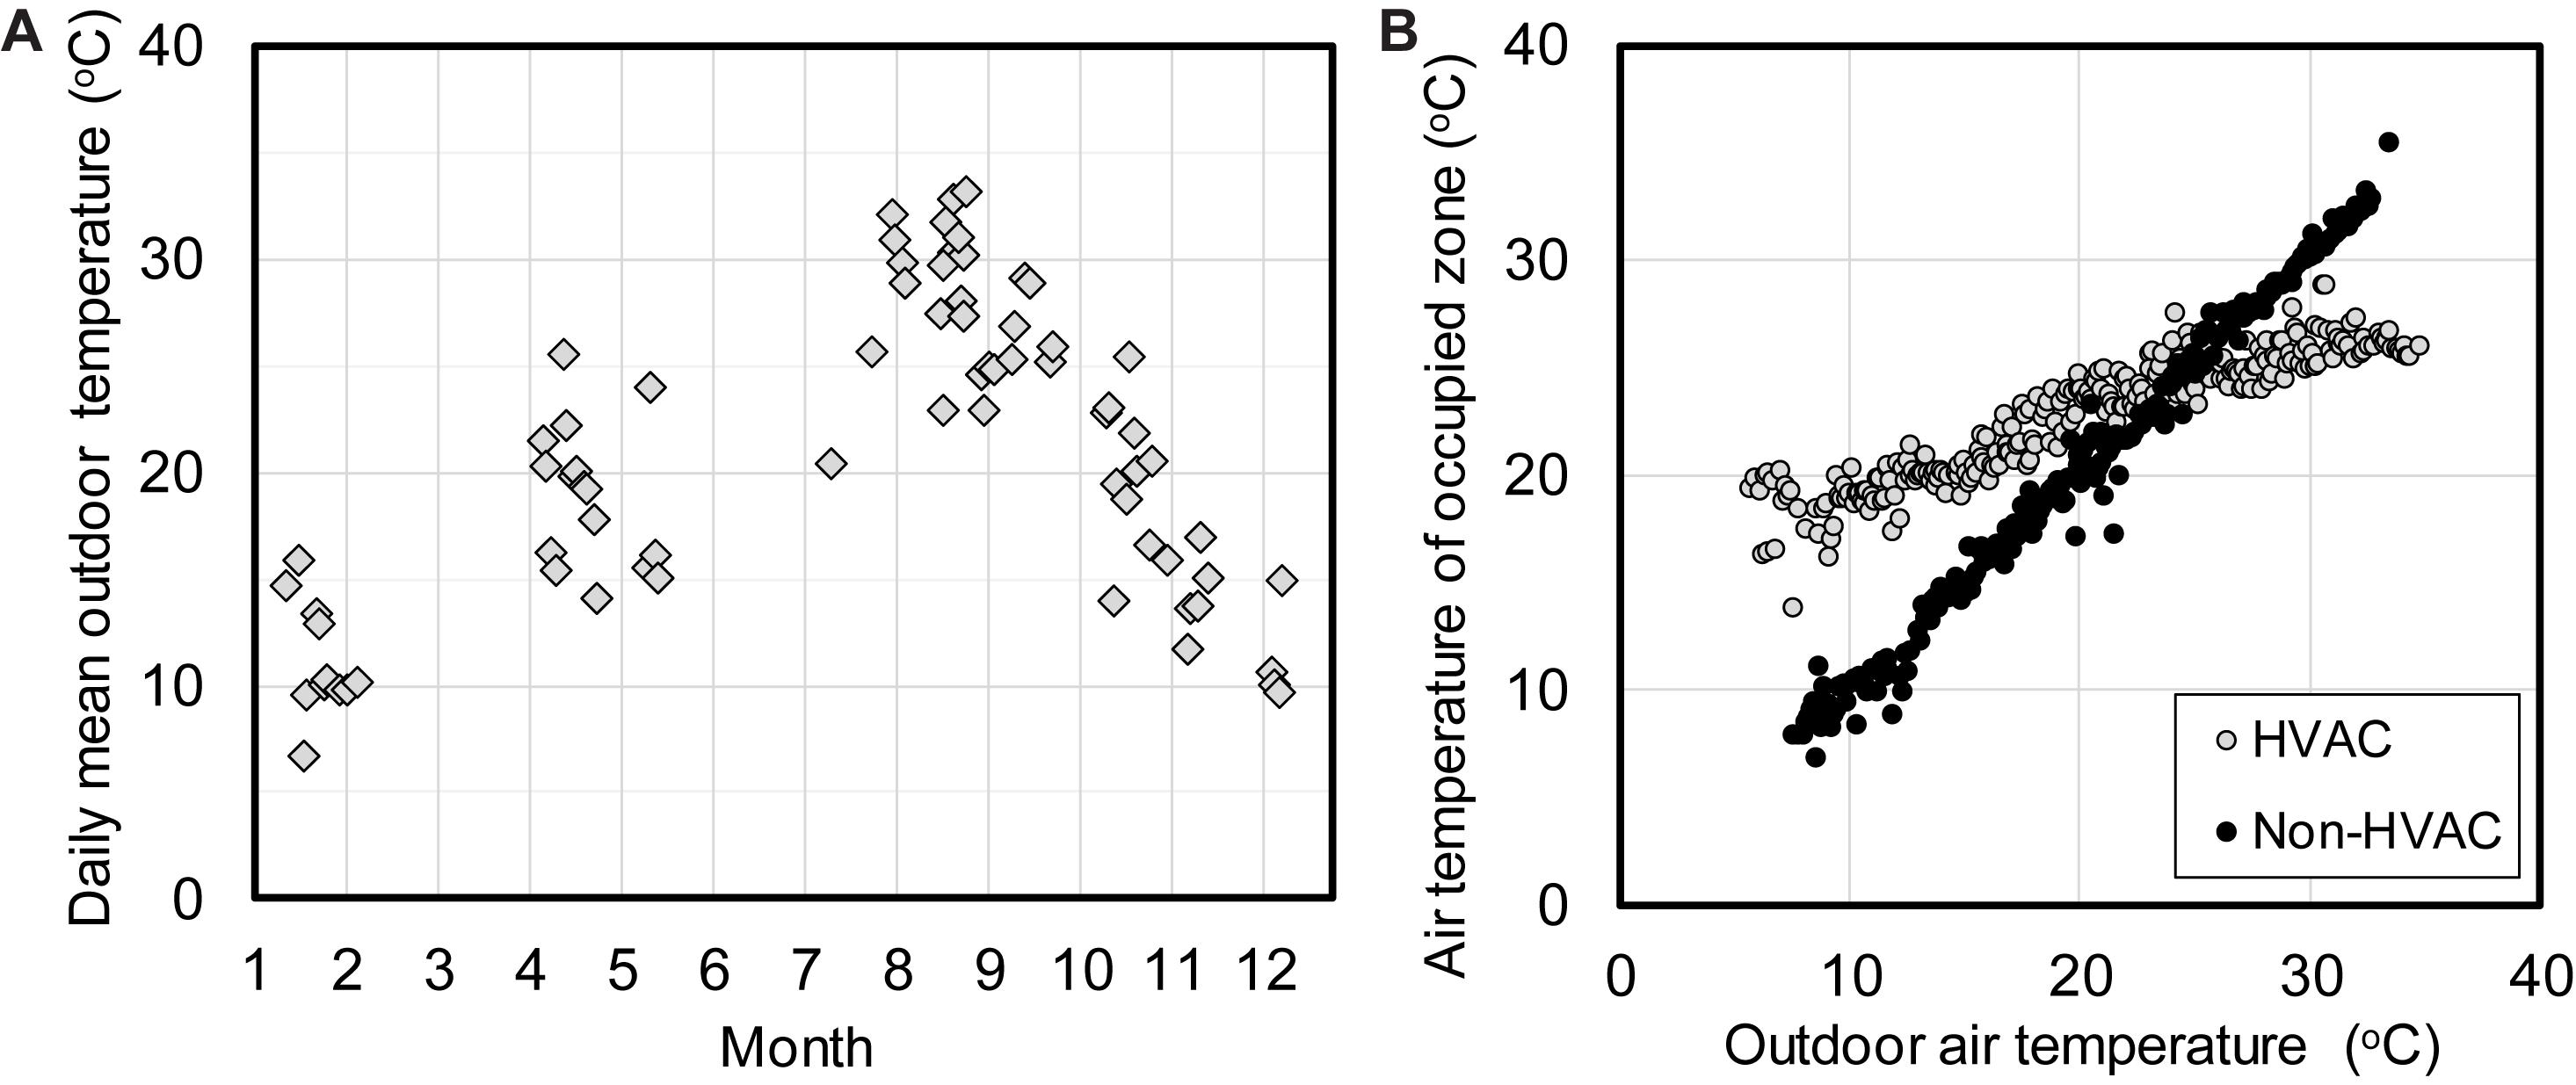
Figure 2. Environmental characteristics of the measured spaces: (A) Daily mean outdoor temperature of all survey days, (B) air temperature of occupied zone versus outdoor air temperature.
Characteristics of Occupied Environment
Occupants in survey areas were free to sit wherever they chose, if the place was vacant. Therefore, the selection of environment for occupancy can be regarded as a form of personal adjustment. The air temperature of the occupied environment is plotted against the immediate outdoor air temperature in Figure 2B. The two values were similar in non-HVAC spaces and the standard deviation of the temperature difference was 0.8°C. Most of the occupied air temperature readings within HVAC spaces were kept within the range of 19–29°C due to environmental control by air conditioning. The two categories for environmental control level were appropriate to classify the thermal environment characteristics of the four spaces.
The distributions of OT and SET∗ are presented in Figure 3. OT distribution in HVAC spaces shows two distinct peaks for summer and winter. OT distribution in non-HVAC spaces was much more scattered due to the wider range of air temperatures and solar radiation. On the other hand, SET∗ in both spaces showed a normal distribution curve with a peak at approximately 24°C. This result suggests that occupants in both HVAC and non-HVAC spaces were adjusting themselves to settle within a certain range of SET∗ values under various environmental conditions.
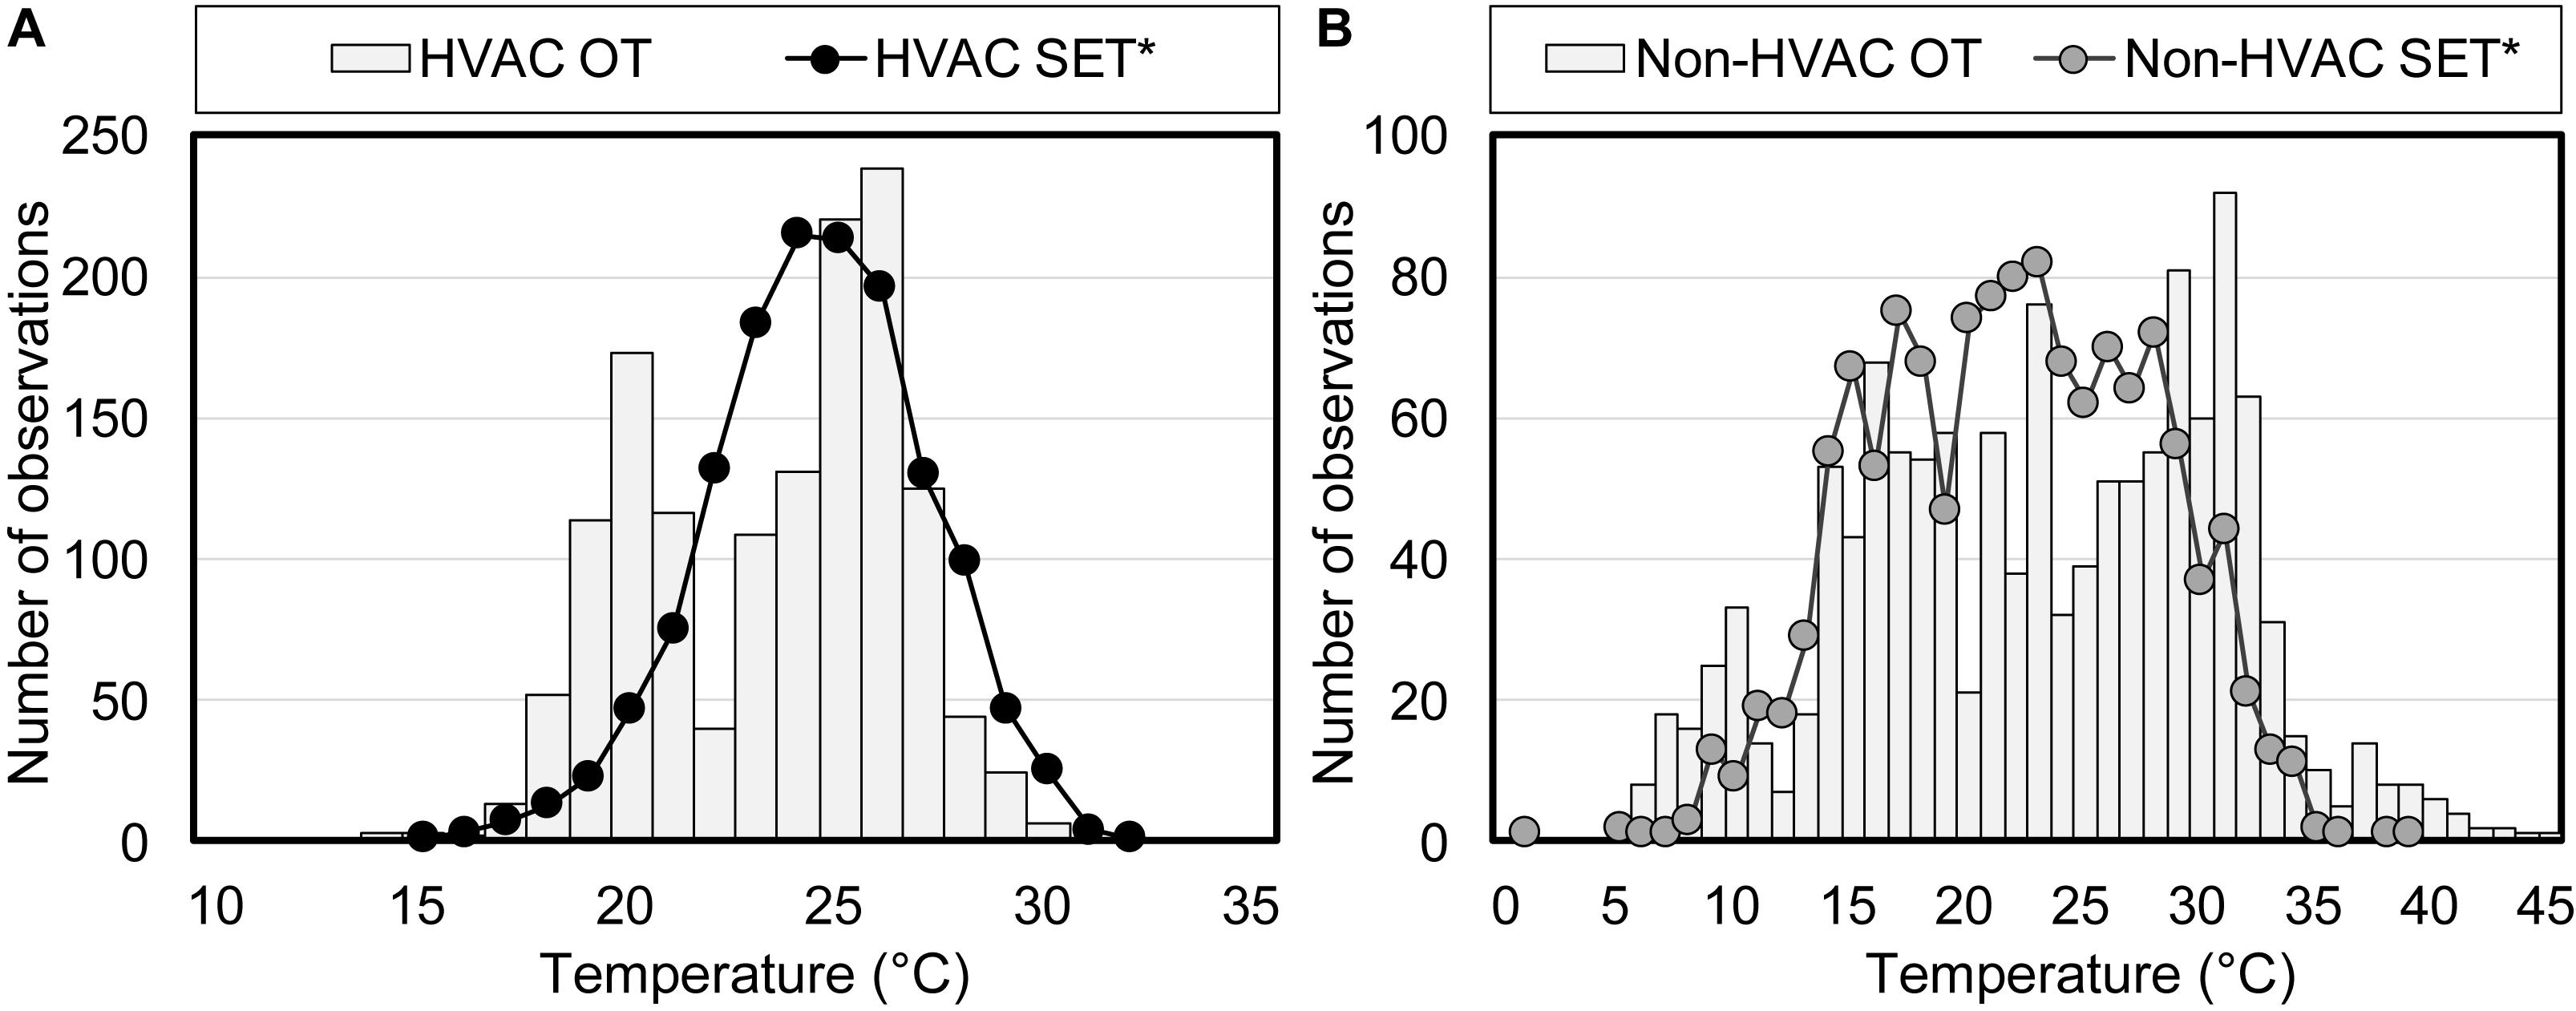
Figure 3. Frequency distribution of OT and SET* in the occupied environment: (A) HVAC spaces, (B) non-HVAC spaces.
Because humidity tends to be evenly distributed within a space, radiant temperature and air velocity are the two main factors to be considered when selecting the occupying environment for thermal comfort. Figure 4A shows the relationship between air temperature and MRT. The air temperature of the occupied environment was rounded off to the nearest 1°C, and the mean value of the MRT in the same temperature category was derived. Temperature categories with less than10 data were omitted from the analysis. Air temperature and MRT were identical in HVAC spaces. MRT tended to be higher than air temperature in non-HVAC spaces where the effect of solar radiation was much larger. MRT should be higher in cold environments and lower in hot environments if occupants are selecting their radiant environment based on thermal comfort. Neither of the spaces proved this hypothesis to be true.
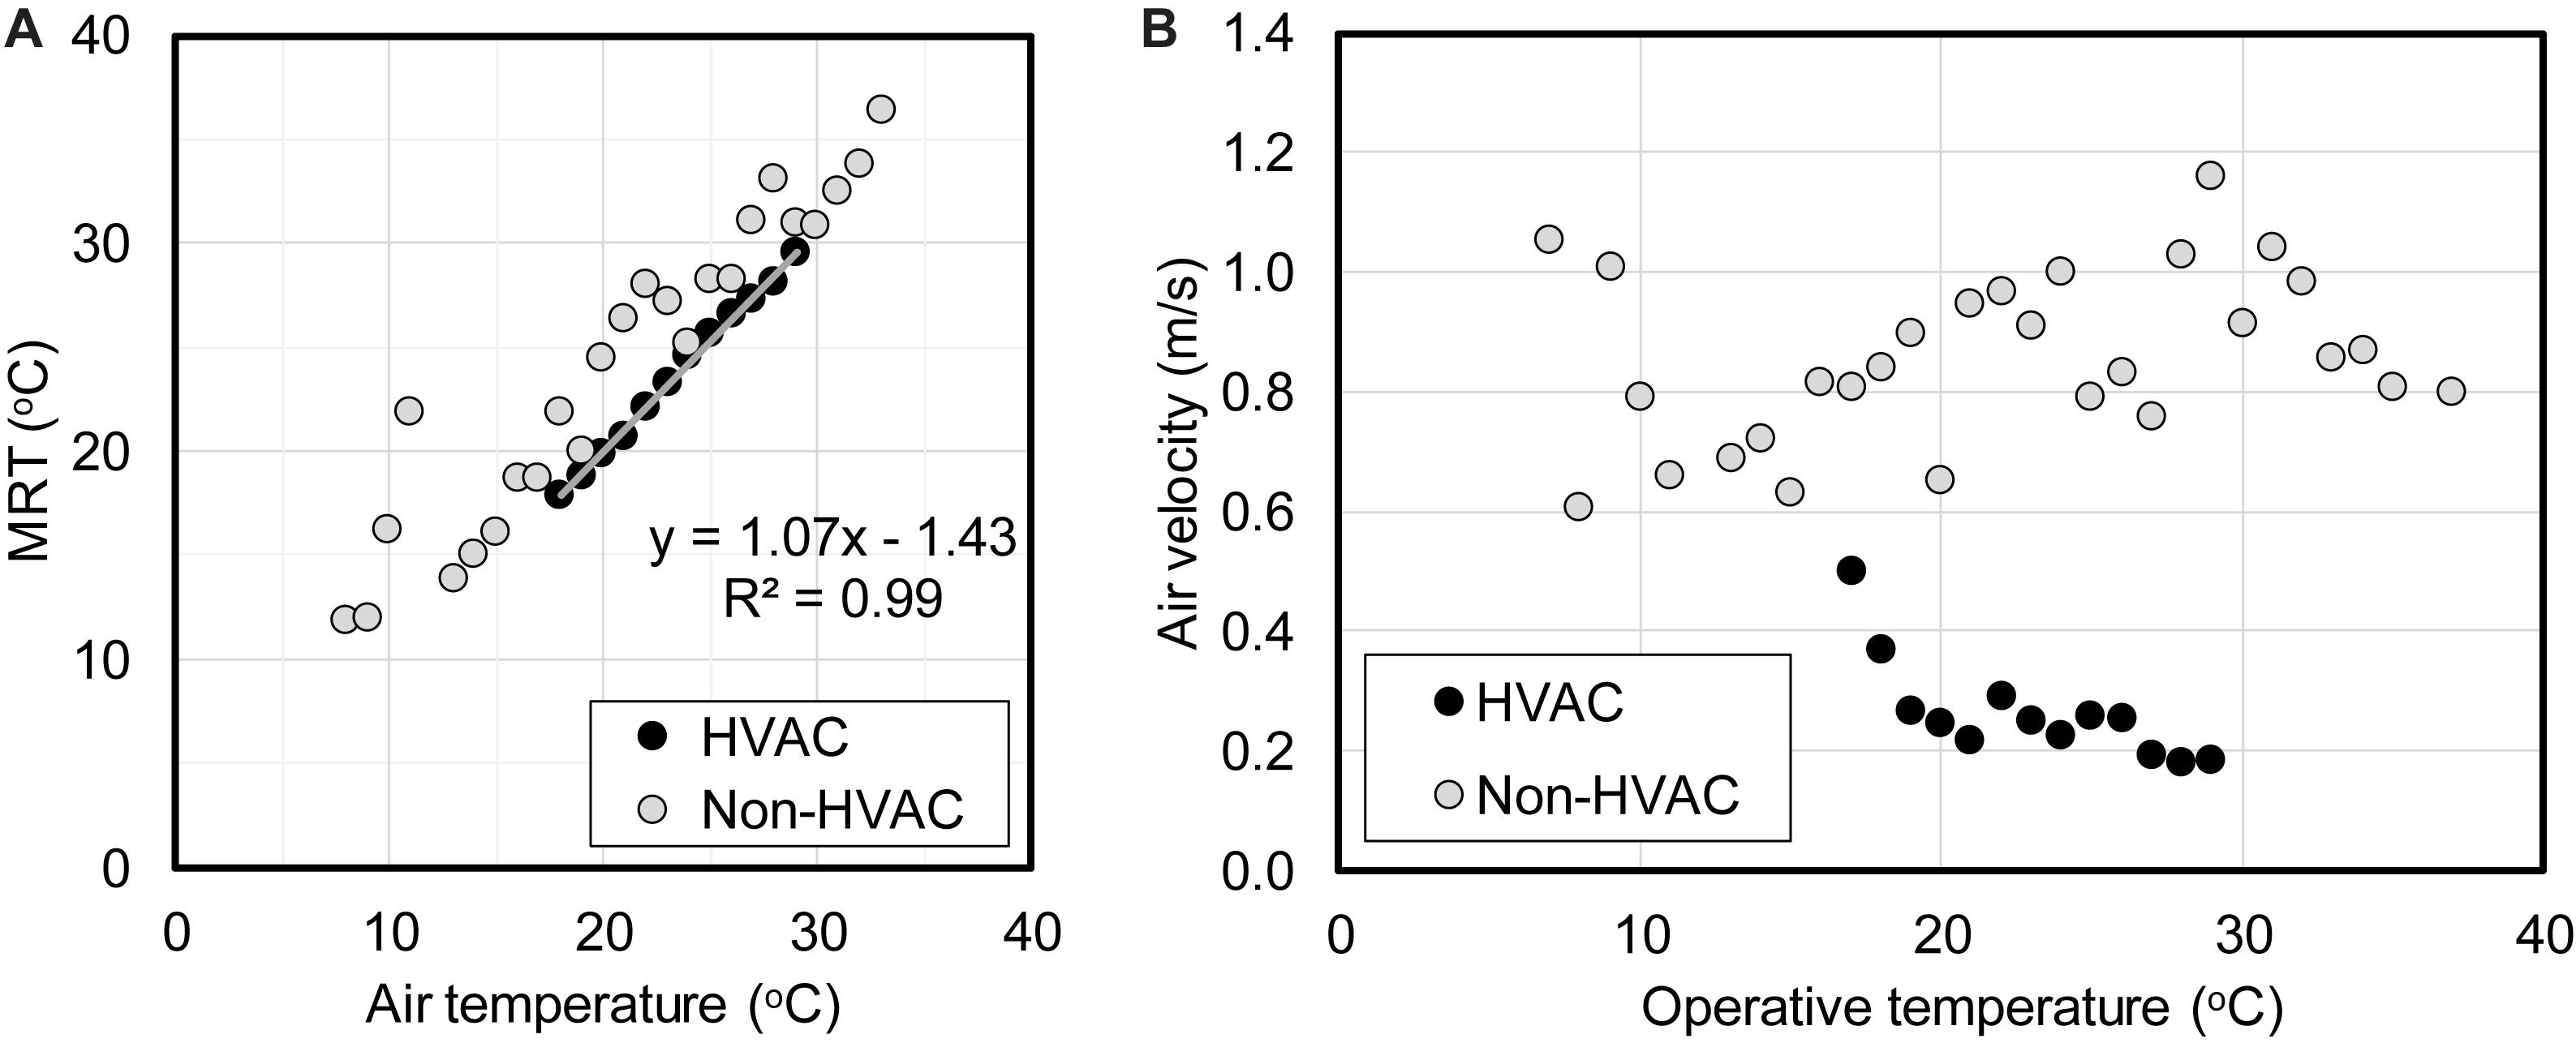
Figure 4. Characteristic of the occupied environment: (A) MRT versus air temperature, (B) air velocity versus operative temperature.
The same analysis was applied to operative temperature and air velocity in Figure 4B. Air velocity was widely distributed in non-HVAC spaces but not correlated with operative temperature. Air velocity in HVAC spaces was stable at around 0.2 m/s between 20 and 30°C. A sudden rise was observed below 20°C; however, this seems odd if the occupants were aiming for thermal comfort. It is likely that the infiltration of outdoor air near the entrance in winter resulted in higher air velocities and lower indoor temperatures at the same time.
The MRT and air velocity results imply that most occupants did not select their environment based on thermal comfort; occupants may have been less motivated to do so due to short duration of occupancy in these spaces.
Clothing Adjustment
Behavioral adaptation by clothing adjustment was analyzed by examining the relationship between environmental variables and clothing insulation. Air temperature and OT of the occupied zone at the time of questionnaire response and the daily mean outdoor temperature of each survey day referenced from the nearest meteorological station were the three selected variables. The linear regression results are given in Table 4.
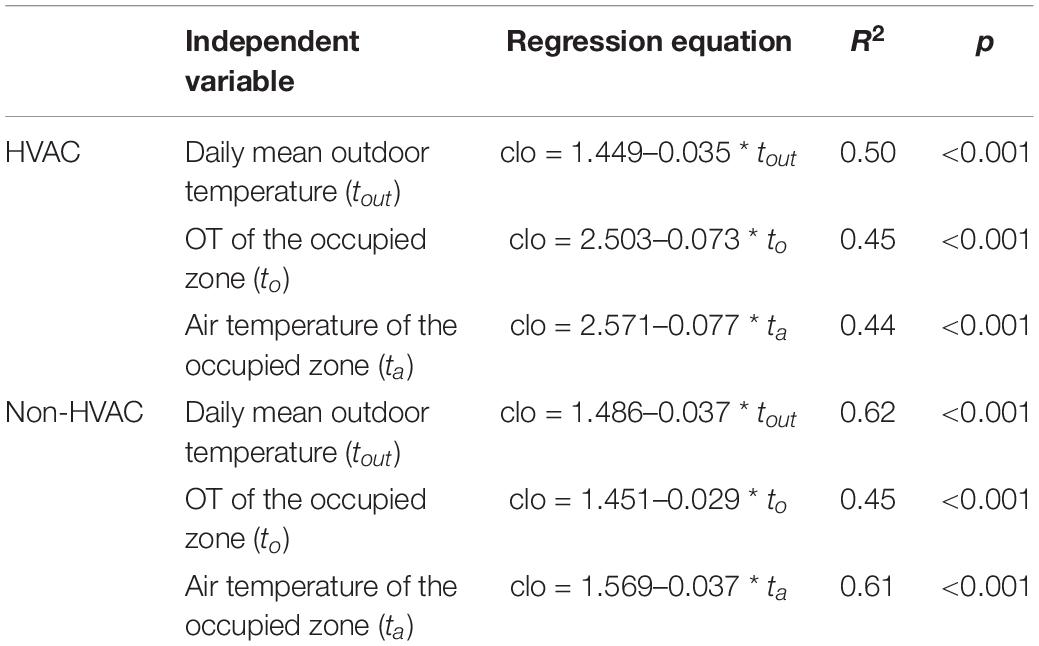
Table 4. Relationship of clothing to representative temperatures.
Mean radiant temperature could be quite different from air temperature in a non-HVAC space due to solar radiation. The fact that the R2 value was lower for OT than the air temperature implies that occupants were not instantly adjusting their clothing to their occupied environment because the OT could change greatly by moving from one place to another. The difference was smaller between the two variables in HVAC spaces. The highest correlation was observed for the outdoor temperature in both types of spaces.
The relationship between outdoor temperature and clothing derived from this analysis was compared with other related studies. The European project, RUROS, carried out extensive field surveys in seven cities in five different countries across Europe to examine the comfort conditions in urban open spaces (Nikolopoulou and Lykoudis, 2006). All the data from the surveys are open to the public.1 The database contains questionnaire responses, clothing, and detailed environmental data measured at the site; the daily mean outdoor temperature is not included, however. The website of the National Climatic Data Center2 provides a summary of daily climatic conditions of cities worldwide. Analysis was conducted for cities in the RUROS database where the daily mean outdoor temperature was available: Athens (Greece), Cambridge (United Kingdom), Sheffield (United Kingdom), and Kassel (Germany). De Carli et al. (2007) reported on clothing behavior in relation to outdoor conditions based on analysis of the two databases. The ASHRAE RP-884 database (de Dear, 1998) is the basis for the ASHRAE adaptive model and contains field survey data of office buildings collected worldwide. The buildings were classified into naturally ventilated (NV), air-conditioned (HVAC), and mixed mode. Another database consists of data from naturally ventilated residential buildings in Singapore and Indonesia (Feriadi et al., 2002). Regression equations were derived for the NV buildings (office + residence) and the HVAC offices.
Regression models of clothing as a function of daily mean outdoor temperature are given in Figure 5. All the five models yielded approximately 0.55 clo for 25.3°C; the difference between the maximum and the minimum clothing predictions were 0.04 clo. The difference was within 0.05 clo in the range of 23.2–25.7°C, where outdoor conditions of the day are expected to be moderate. Discrepancies between the models grew larger as the temperature moved away from this range.
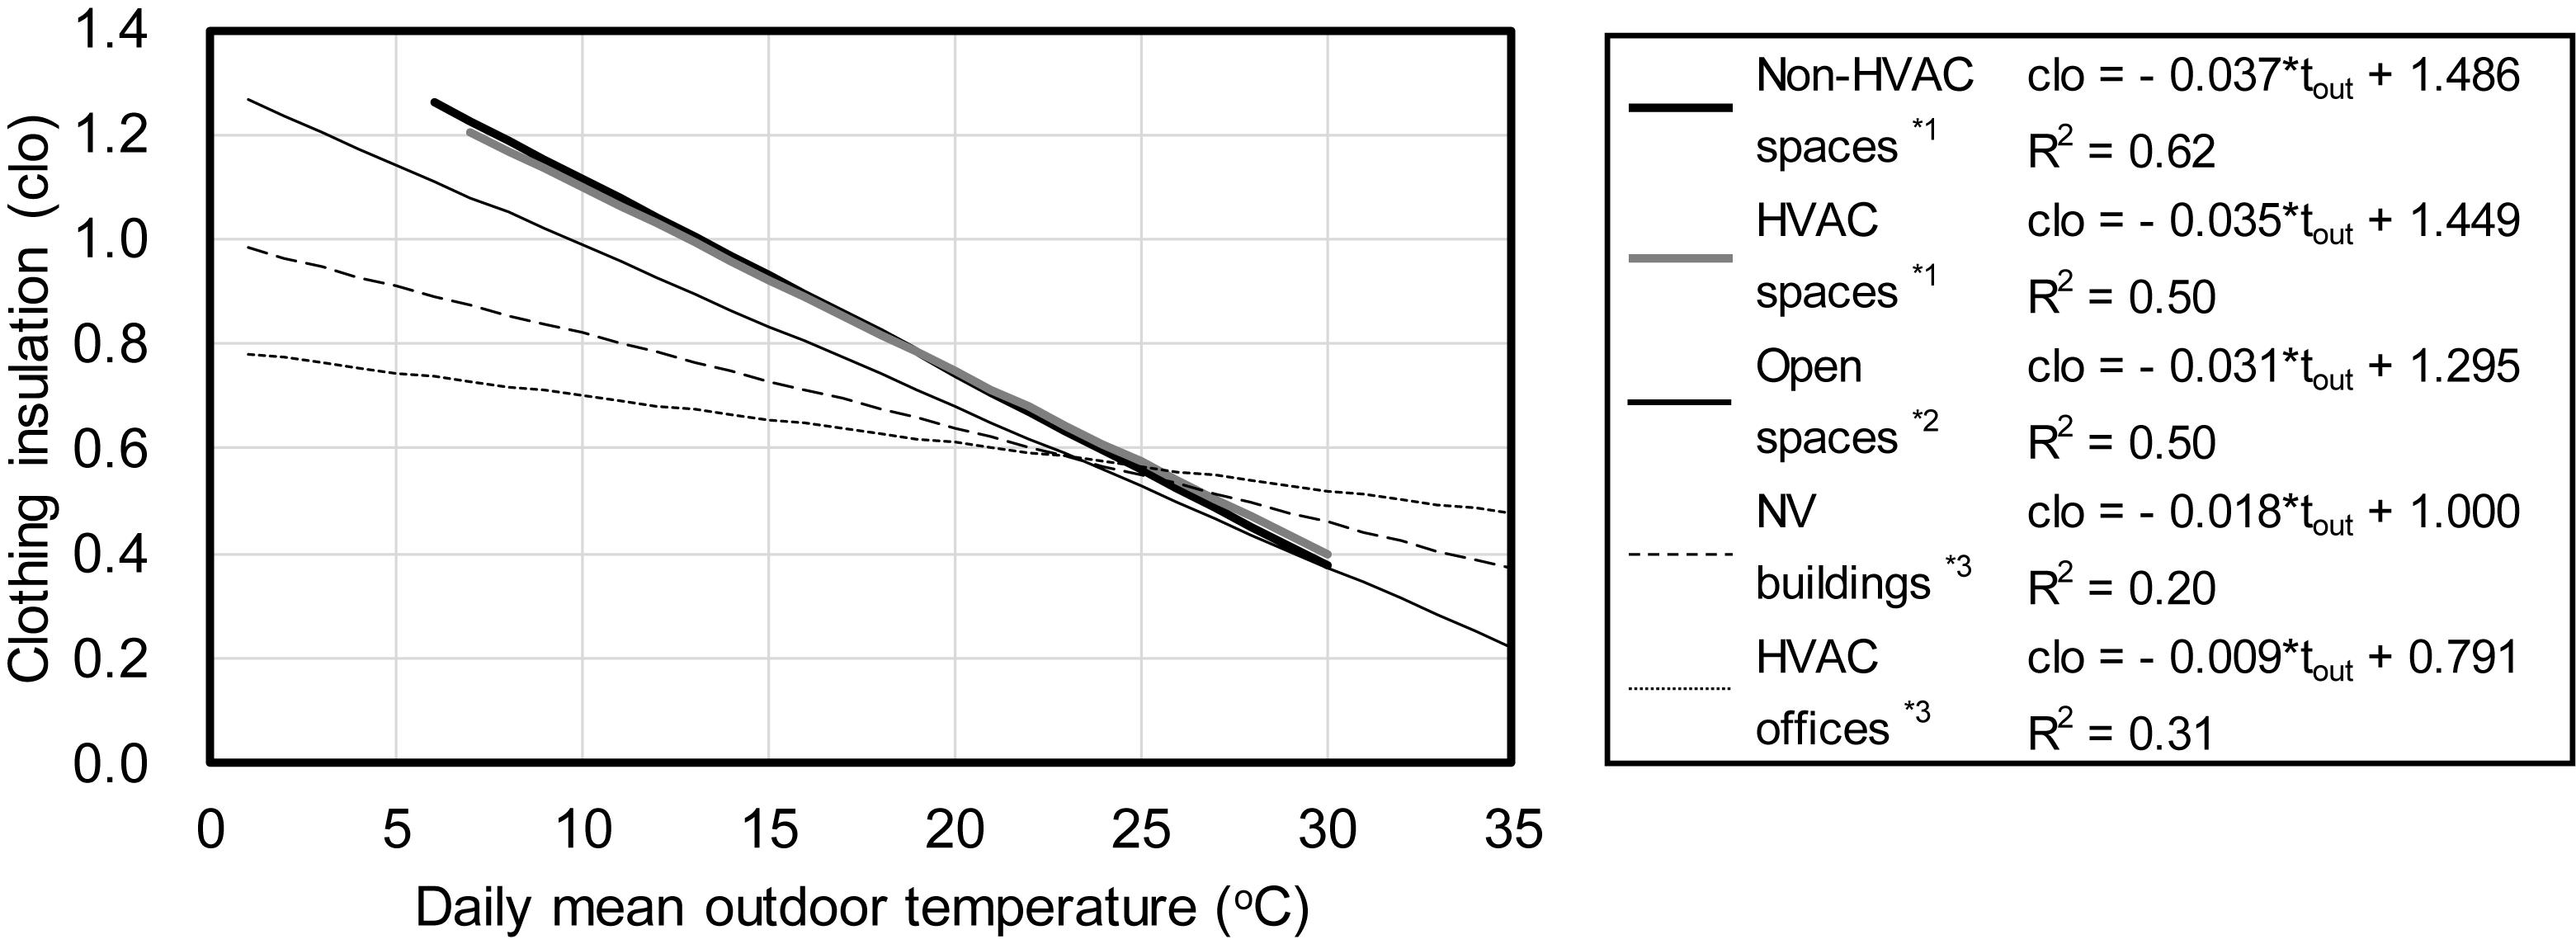
Figure 5. Comparison of different models for clothing versus daily mean outdoor temperature. (*1 the present study, *2 modified from Nikolopoulou and Lykoudis, 2006, *3 De Carli et al., 2007).
The lowest gradient was observed in HVAC offices where occupants mainly adapted to the air-conditioned indoor environment. Non-HVAC and HVAC spaces in this study showed the largest gradient. The result was similar for open spaces in the RUROS project. Occupants in non-HVAC spaces, HVAC spaces, and open spaces are likely to stay only for a short time, and their clothing was more correlated to the climatic conditions of the day. Occupants in NV offices and residences who intended to stay longer adjusted themselves more to the indoor environment. Because the indoor environment itself was affected strongly by the outdoor environment, the gradient was greater than that found for HVAC buildings, however.
Occupancy Condition
The daily mean occupancy period and total number of occupants counted per day is plotted against daily mean air temperature of the occupied zone in Figure 6. Square plots show the results for the HVAC spaces (P, B) and circle plots represent the results for non-HVAC spaces (O, T). Yearly average occupancy periods in the non-HVAC spaces were approximately 10 min in both spaces O and T. The values were 20 min and 15 min for spaces P and B respectively. As the left graph shows, no correlation was found between the occupied environment and the occupancy period in HVAC spaces, whereas, a linear correlation was found for both non-HVAC spaces. The gradients were similar for both spaces O and T and approximately equal to a 1-min decrease in average occupancy period for every decrement of 3–4°C in daily mean air temperature.
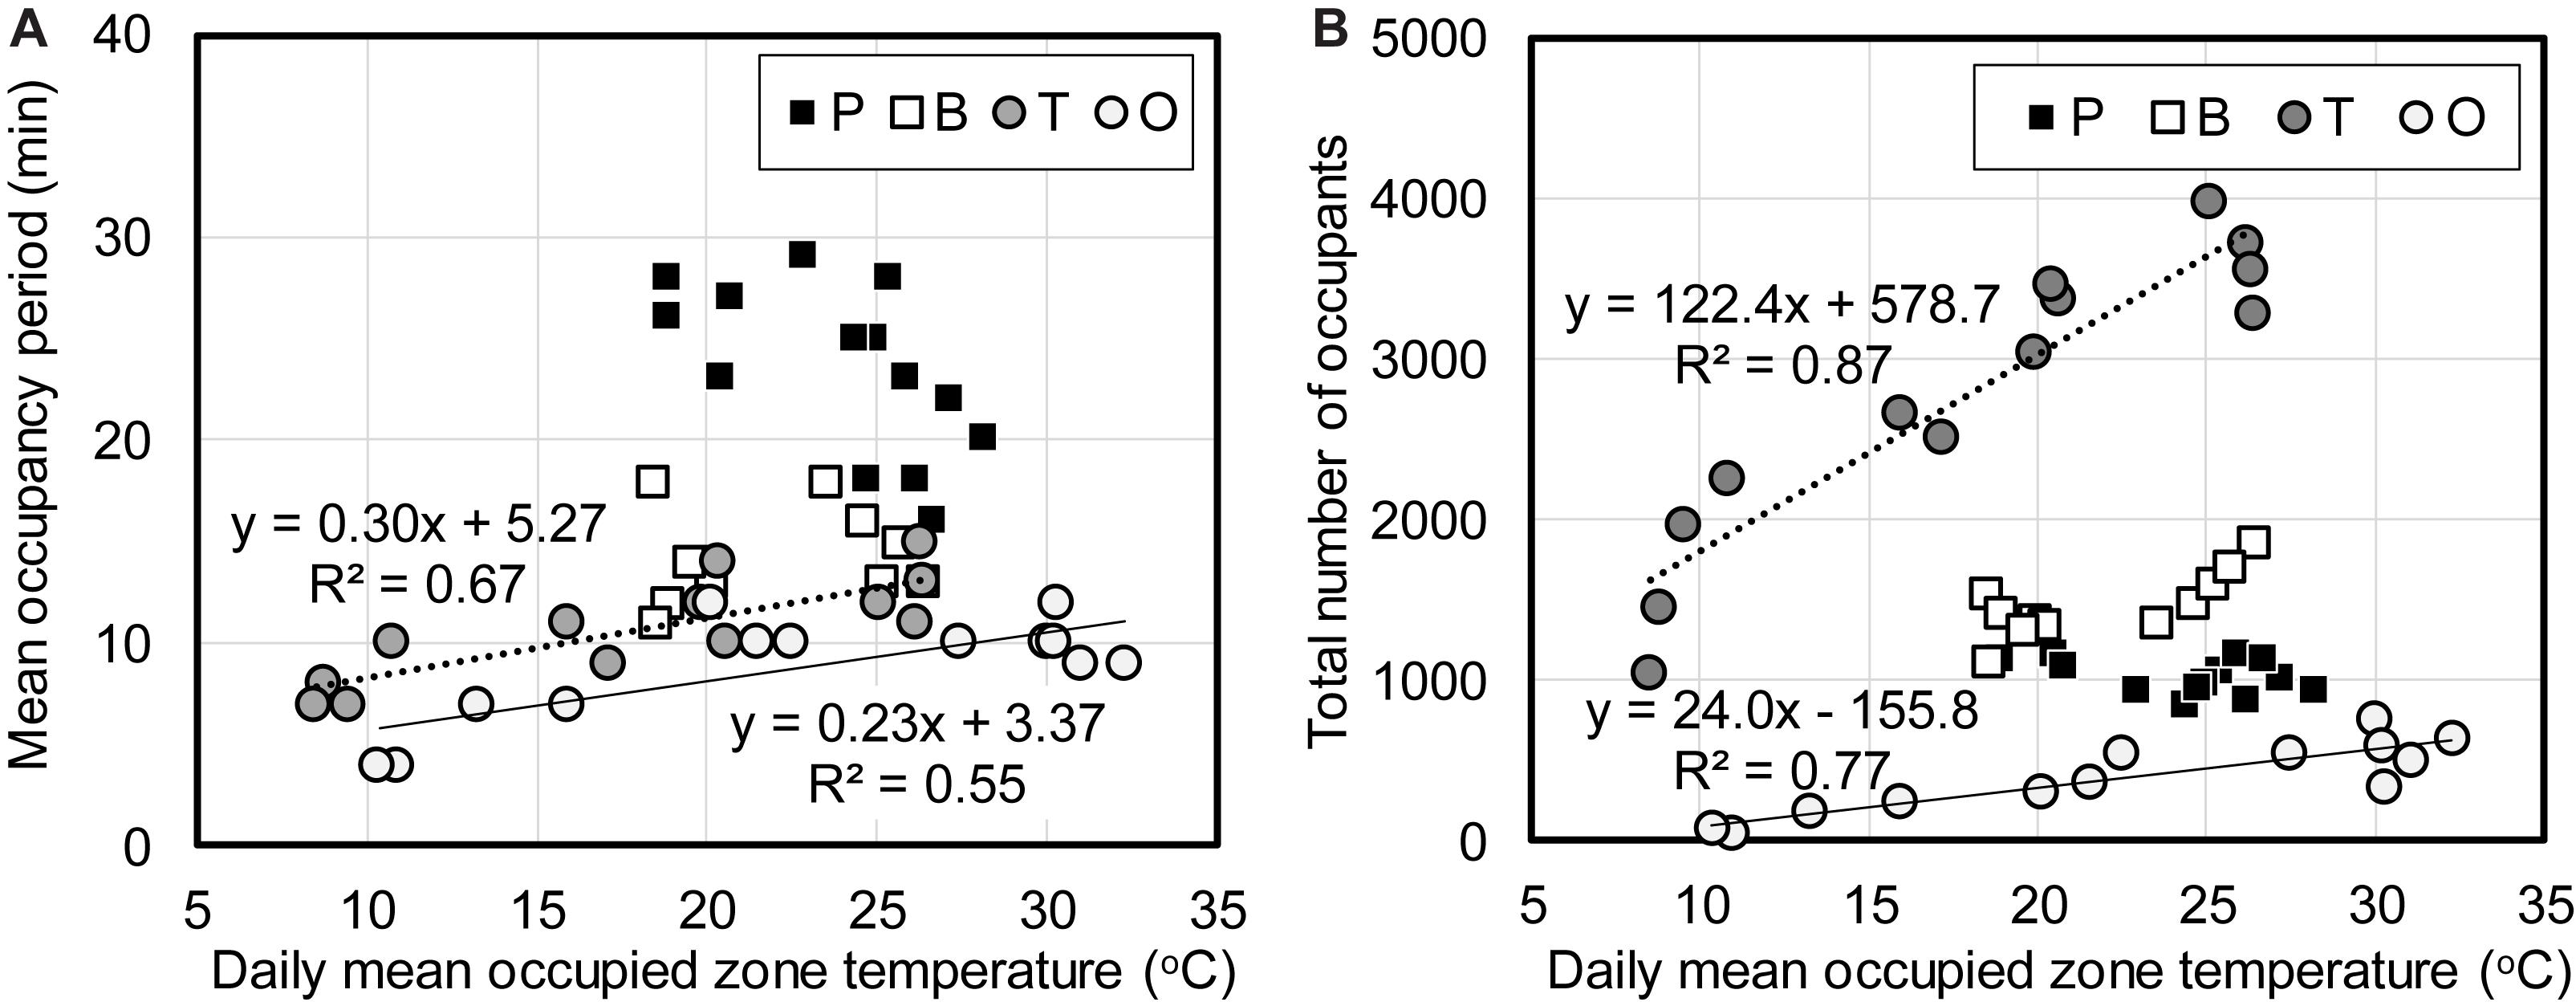
Figure 6. Occupied zone temperature and occupancy condition: (A) occupancy period, (B) total number of occupants.
The right graph shows that the total number of occupants per day also had a strong linear relationship with air temperature in the non-HVAC spaces O and T, while no correlation was found in the HVAC spaces P and B. Occupants in non-HVAC spaces were more responsive to their surrounding environment and chose not to stay when the temperatures were lower. The influence of environmental parameters on the use of urban open areas are studied in various climate zones. In temperate climate zones, the results of Nikolopoulou et al. (2001); Zacharias et al. (2001), Thorsson et al. (2004), and Eliasson et al. (2007) showed that greater numbers of people were observed in accordance with a rise in environmental temperature. On the other hand, Lin (2009) showed that the trend in the same area changed between hot-humid and cool seasons; the number of people decreased as the temperature increased during the hot-humid season in Taiwan. Thorsson et al. (2007) compared the total attendance of people in an outdoor station square and a park in Japan. Attendance indicated a positive correlation with air temperature in the park, but not in the station square; the reason is presumed to be the difference in function of the two places.
The four spaces in this study had the same function; therefore, the environmental conditions within were confirmed to have an influence on how people occupied the non-HVAC spaces. Tokyo has hot and humid summers; however, a decrease in occupants following a temperature increase could not be observed from the present analysis. Lin (2009) conducted surveys on weekends from 16:00 to 17:00 and data averaged over 30-min intervals was used for analysis. On the other hand, the 1-day integrated data collected from 10:00 to 17:00 on week days were employed in this study. Setting a short time span for evaluation has the merit of being able to examine the effect of small changes in the environment. The drawback is that the data could be influenced strongly by non-environmental factors such as the individual occupant schedules. A longer time span has the opposite characteristic of smoothing out fluctuating factors. Air temperature was found to be the dominant parameter affecting occupant behavior over the course of a year in non-HVAC spaces. Occupants in HVAC spaces were not responsive to environmental changes kept within a certain range by air conditioning.
Comfort Zone Analysis
Comfort Zone, Not Comfort Temperature
The principal aim of adaptive comfort studies since the original work by Humphreys (1976) has been to determine the comfort temperature based on the field surveys. Although various types of temperatures are used to represent the thermal environment, outdoor comfort studies have also aimed to derive comfort temperatures as reviewed by Rijal (2012). The comfort temperature is useful information in air-conditioned spaces where the environments can be controlled around a certain set point temperature. However, the temperature cannot be controlled to be stable in outdoor or semi-outdoor environments. Critical information for the design and the evaluation of semi-outdoor environment is not the comfort temperature, but the comfort zone, a range in which the occupants can adapt themselves for comfort.
The comfort zones in the adaptive comfort standards, ASHRAE 55 and ISO 17772-1, are defined by the parallel lines on the upper and the lower side of the linear adaptive model. Although the adaptive model itself is not depicted in the comfort charts, the parallel lines indicate that the comfort zone has a constant temperature width in a vertical direction from the comfort temperature predicted as a function of the outdoor temperature. However, studies supporting the adaptive models have proved that the thermal sensation of occupants, in response to the same sets of thermal environment variables, differed between the naturally ventilated buildings and the air-conditioned buildings. In addition, Bauman et al. (1998) have shown that the occupants with individually controlled desktop air-conditioning units (i.e., with a greater degree of adaptive opportunity) reported 100% acceptability in a wide temperature range as opposed to the occupants without the units. These results indicated the effect of behavioral and psychological adaptation on comfort conditions. Why would adaptation affect only the comfort temperature and not the acceptable temperature range? The assumption of a comfort zone with a constant temperature width under various comfort temperatures should be questioned. Furthermore, thermal neutrality is not likely to be the optimum condition in semi-outdoor environments where environmental changes are taken for granted or even preferred. Thus, information on the adaptive comfort zone, and not on the adaptive comfort temperature, is required for semi-outdoor environments.
Thermal Sensation and Preference
The thermally satisfied state in the predicted percentage of dissatisfied (PPD) index is defined as the three central categories of the 7-point thermal sensation scale (Fanger, 1970) described in Table 2; this assumption is widely agreed in thermal comfort studies. The validity of this hypothesis, in semi-outdoor environments, was tested. The distribution of thermal sensation votes and the corresponding percentage of preference vote of “as it is” are plotted in Figures 7A,B. Categories with less than ten votes were omitted from the analysis. The results of HVAC and non-HVAC spaces show a very similar profile. More than 80% of the occupants who voted “cool (−2)” in summer and “warm (+2)” in winter preferred the environment “as it is”. Thermal sensation and the corresponding percentage of preference vote for “warmer” in winter and “cooler” in summer are shown in Figures 7C,D. In summer, the percentage of “cooler” for the thermal sensation vote of “slightly warm (+1)” was 50-60% for both HVAC and non-HVAC spaces. In contrast, 45% of occupants who felt “slightly cool (−1)” voted “warmer” in the winter. These results prove that the three central categories of the thermal sensation scale do not always indicate the preferred environment, and that the words such as “cool” and “warm” have a slightly different meaning, depending on the season. Voting on preference was determined to be more suitable than voting on thermal sensation for coping with seasonal semantic differences within the evaluation scale used for analysis of yearly observation.
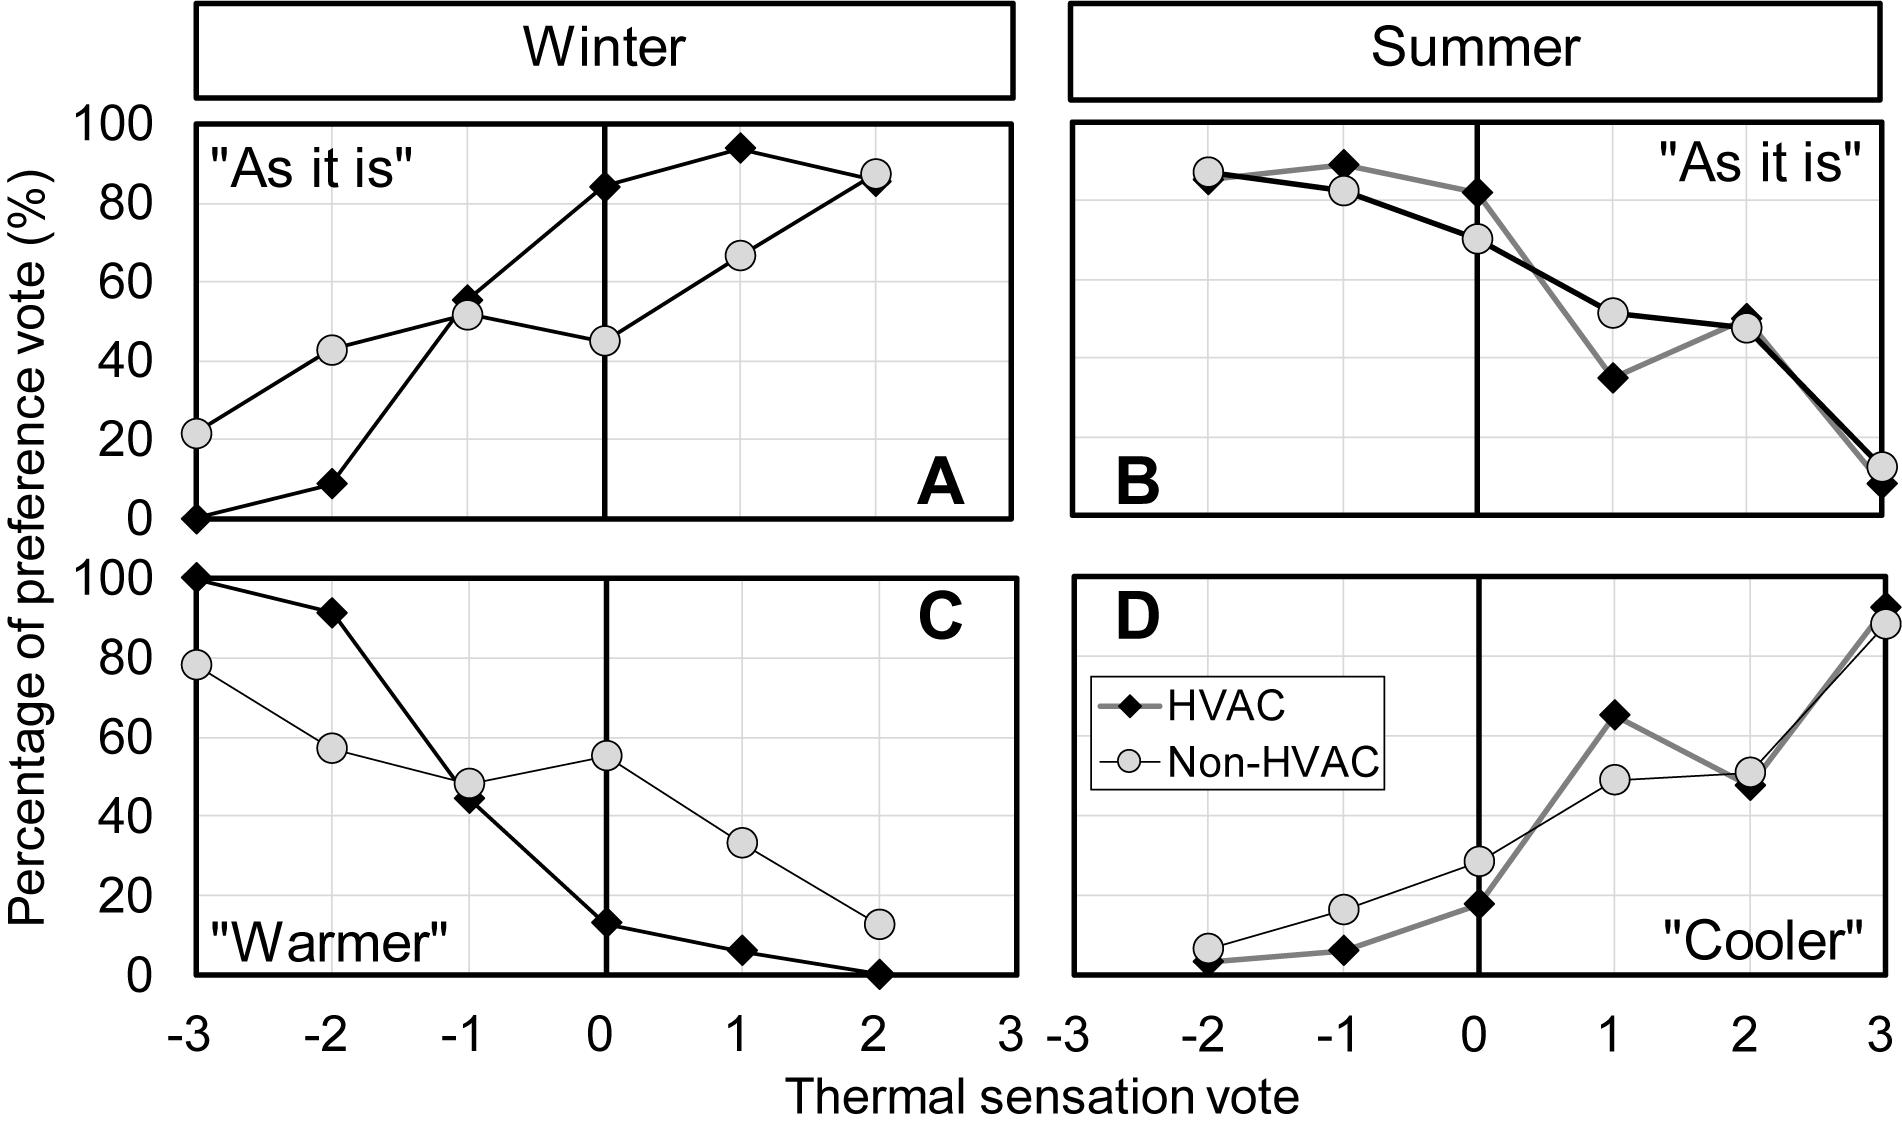
Figure 7. Thermal sensation and corresponding percentage of preference vote in winter and summer: (A,B) “as it is,” (C) “warmer,” (D) “cooler.”
Derivation of Thermal Comfort Zone
A thermal preference vote asking for temperature change does not necessarily imply that the occupant is in a thermally uncomfortable or unacceptable state. Preference votes of “cooler” or “warmer” were paired with overall discomfort (slightly uncomfortable, uncomfortable, very uncomfortable) and unacceptability (not acceptable) votes to determine actual “thermal discomfort” and “thermal unacceptability”. The SET∗ for each occupant was rounded off to the nearest 1°C, and the percentage of votes was derived for each temperature. Temperature classes with less than ten votes were omitted from the analysis. After plotting the percentage of votes versus SET∗, probit curve fit was applied for the warm and cool side separately. The two curves were then added together to derive a combined U-curve. The PPD index was also calculated for the standard environment (air temperature = mean radiant temperature, air velocity of 0.1 m/s, relative humidity of 50%, metabolic rate of 1.0 met, and clothing insulation of 0.6 clo) for reference. The 20% discomfort (80% acceptability) criteria adopted by the ASHRAE 55 Standard was applied for comfort zone analysis. Only 8% of all occupants throughout the survey rated their thermal environment to be uncomfortable in HVAC spaces. The value was slightly higher for non-HVAC spaces, 12%, but still lower than 20%. The rate of discomfort was not constant across all temperature ranges but showed a convex curve. The thermal comfort curve is given in Figure 8 and statistical information on the probit curve is given in Equation (2) and Table 5. The function Φ(z) is the cumulative distribution function of the normal distribution. The curves for “uncomfortably warm” and “uncomfortably cool” were not symmetrical. Higher rise was observed for the warm discomfort in both HVAC and non-HVAC spaces, suggesting that the occupants felt stronger discomfort in warm environment than cool environment.
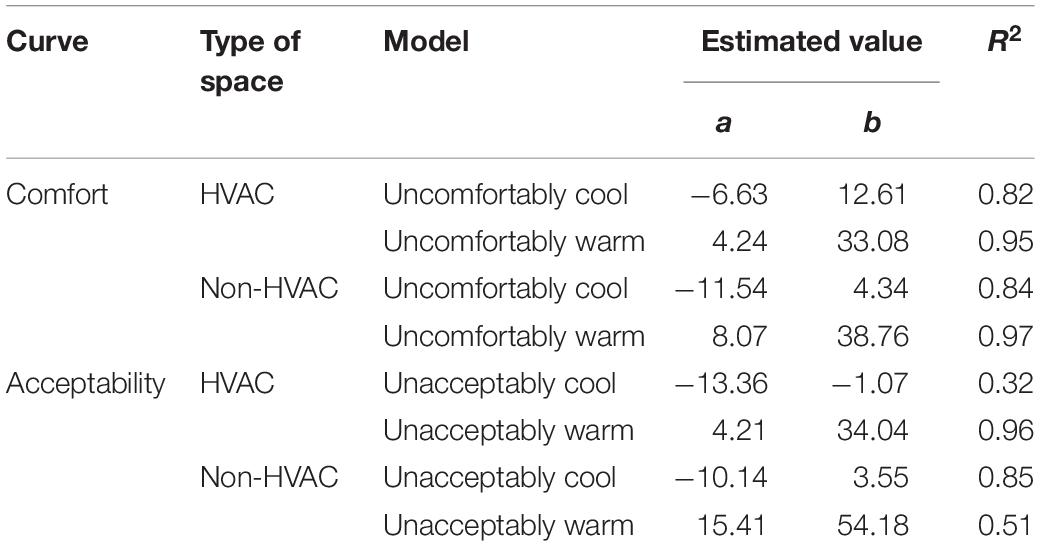
Table 5. Probit regression for thermal comfort and thermal acceptability.
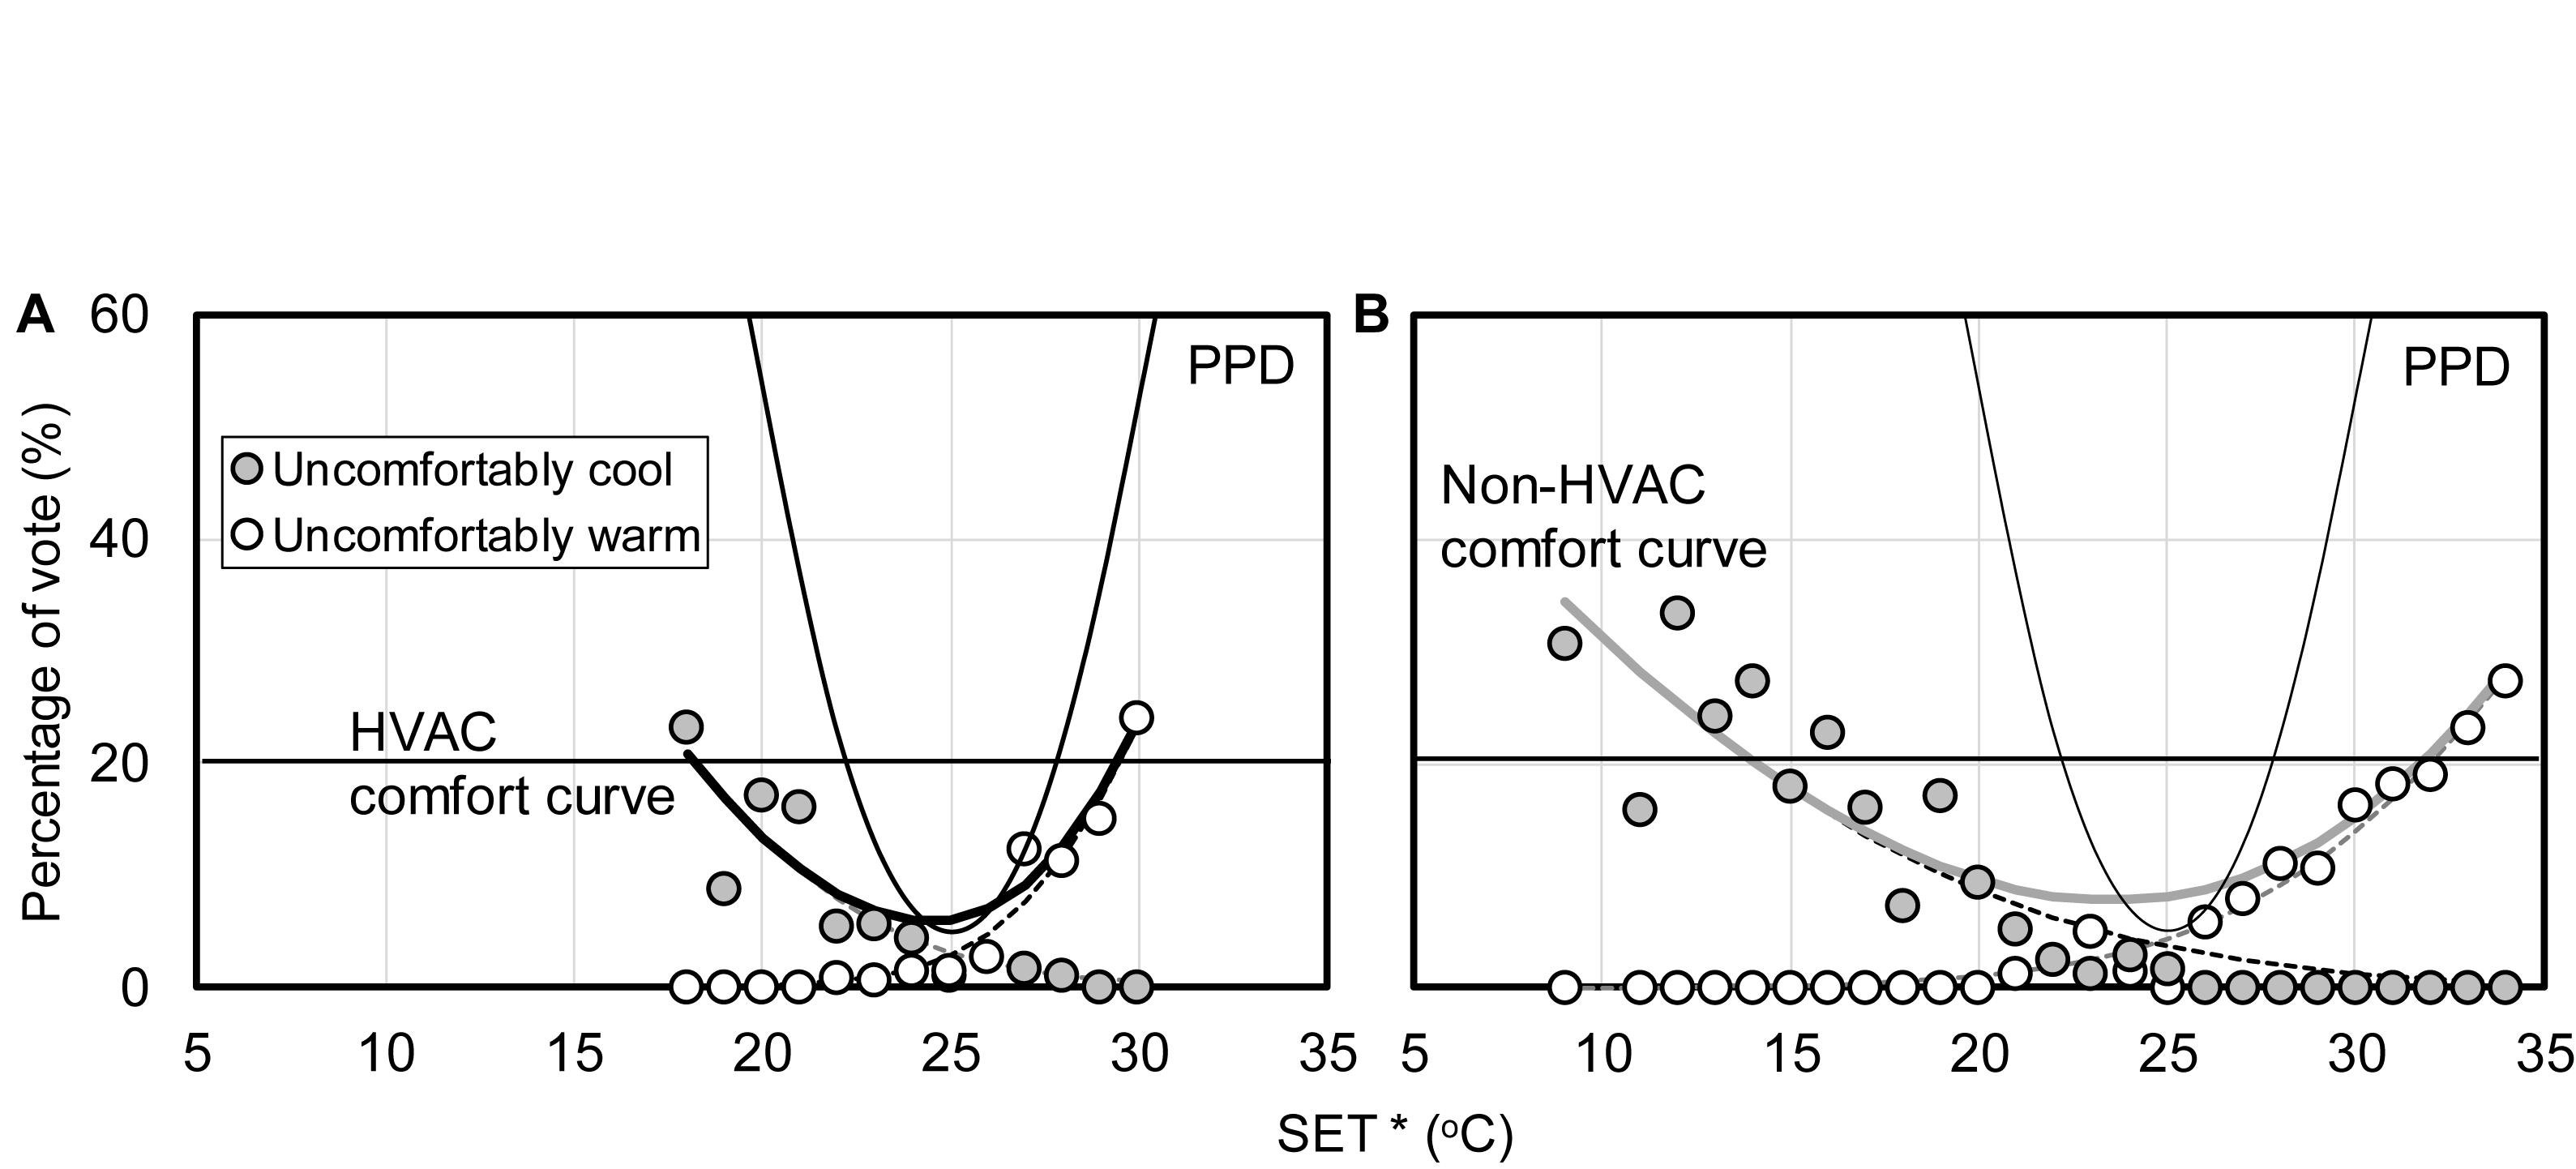
Figure 8. Thermal comfort curve: (A) HVAC spaces, (B) non-HVAC spaces.
Predicted percentage of dissatisfied showed the most acute rise with temperature change. Shallow comfort curves for HVAC and non-HVAC indicate that the occupants were more tolerant of temperature change away from the inflection point, i.e., the minimum discomfort point. These points were not observed at the intersection of the two asymmetric curves for warm and cool discomfort. The lowest percentage of discomfort was found to be 5% at 25.0°C for PPD, 6% at 24.5°C in HVAC spaces, and 8% at 23.6°C in non-HVAC spaces. The comfort zone in SET∗ was found to be 23–28°C for PPD, 18–29°C for HVAC spaces, and 14–32°C for non-HVAC spaces. Occupants in semi-outdoor environments were tolerant of their thermal environment 2 to 3 times wider in range than predicted by PPD.
The thermal acceptability curve is given in Figure 9 and Table 5. The rate of unacceptability was much lower than the rate of discomfort, and did not reach the criteria of 20% except for the lower limit of 12°C in non-HVAC spaces. The word “unacceptable” in Japanese has a stronger nuance of denial that is similar to “intolerable”. Therefore, in this case, an acceptability zone is presumed to describe the limits of tolerance. Occupants were free to stay or leave the area, and the votes of occupants who chose not to stay were not considered in the present analysis; the occupants who stayed, however, tended to feel a greater degree of unacceptability for warmer SET∗ in HVAC spaces and for cooler SET∗ in non-HVAC spaces.
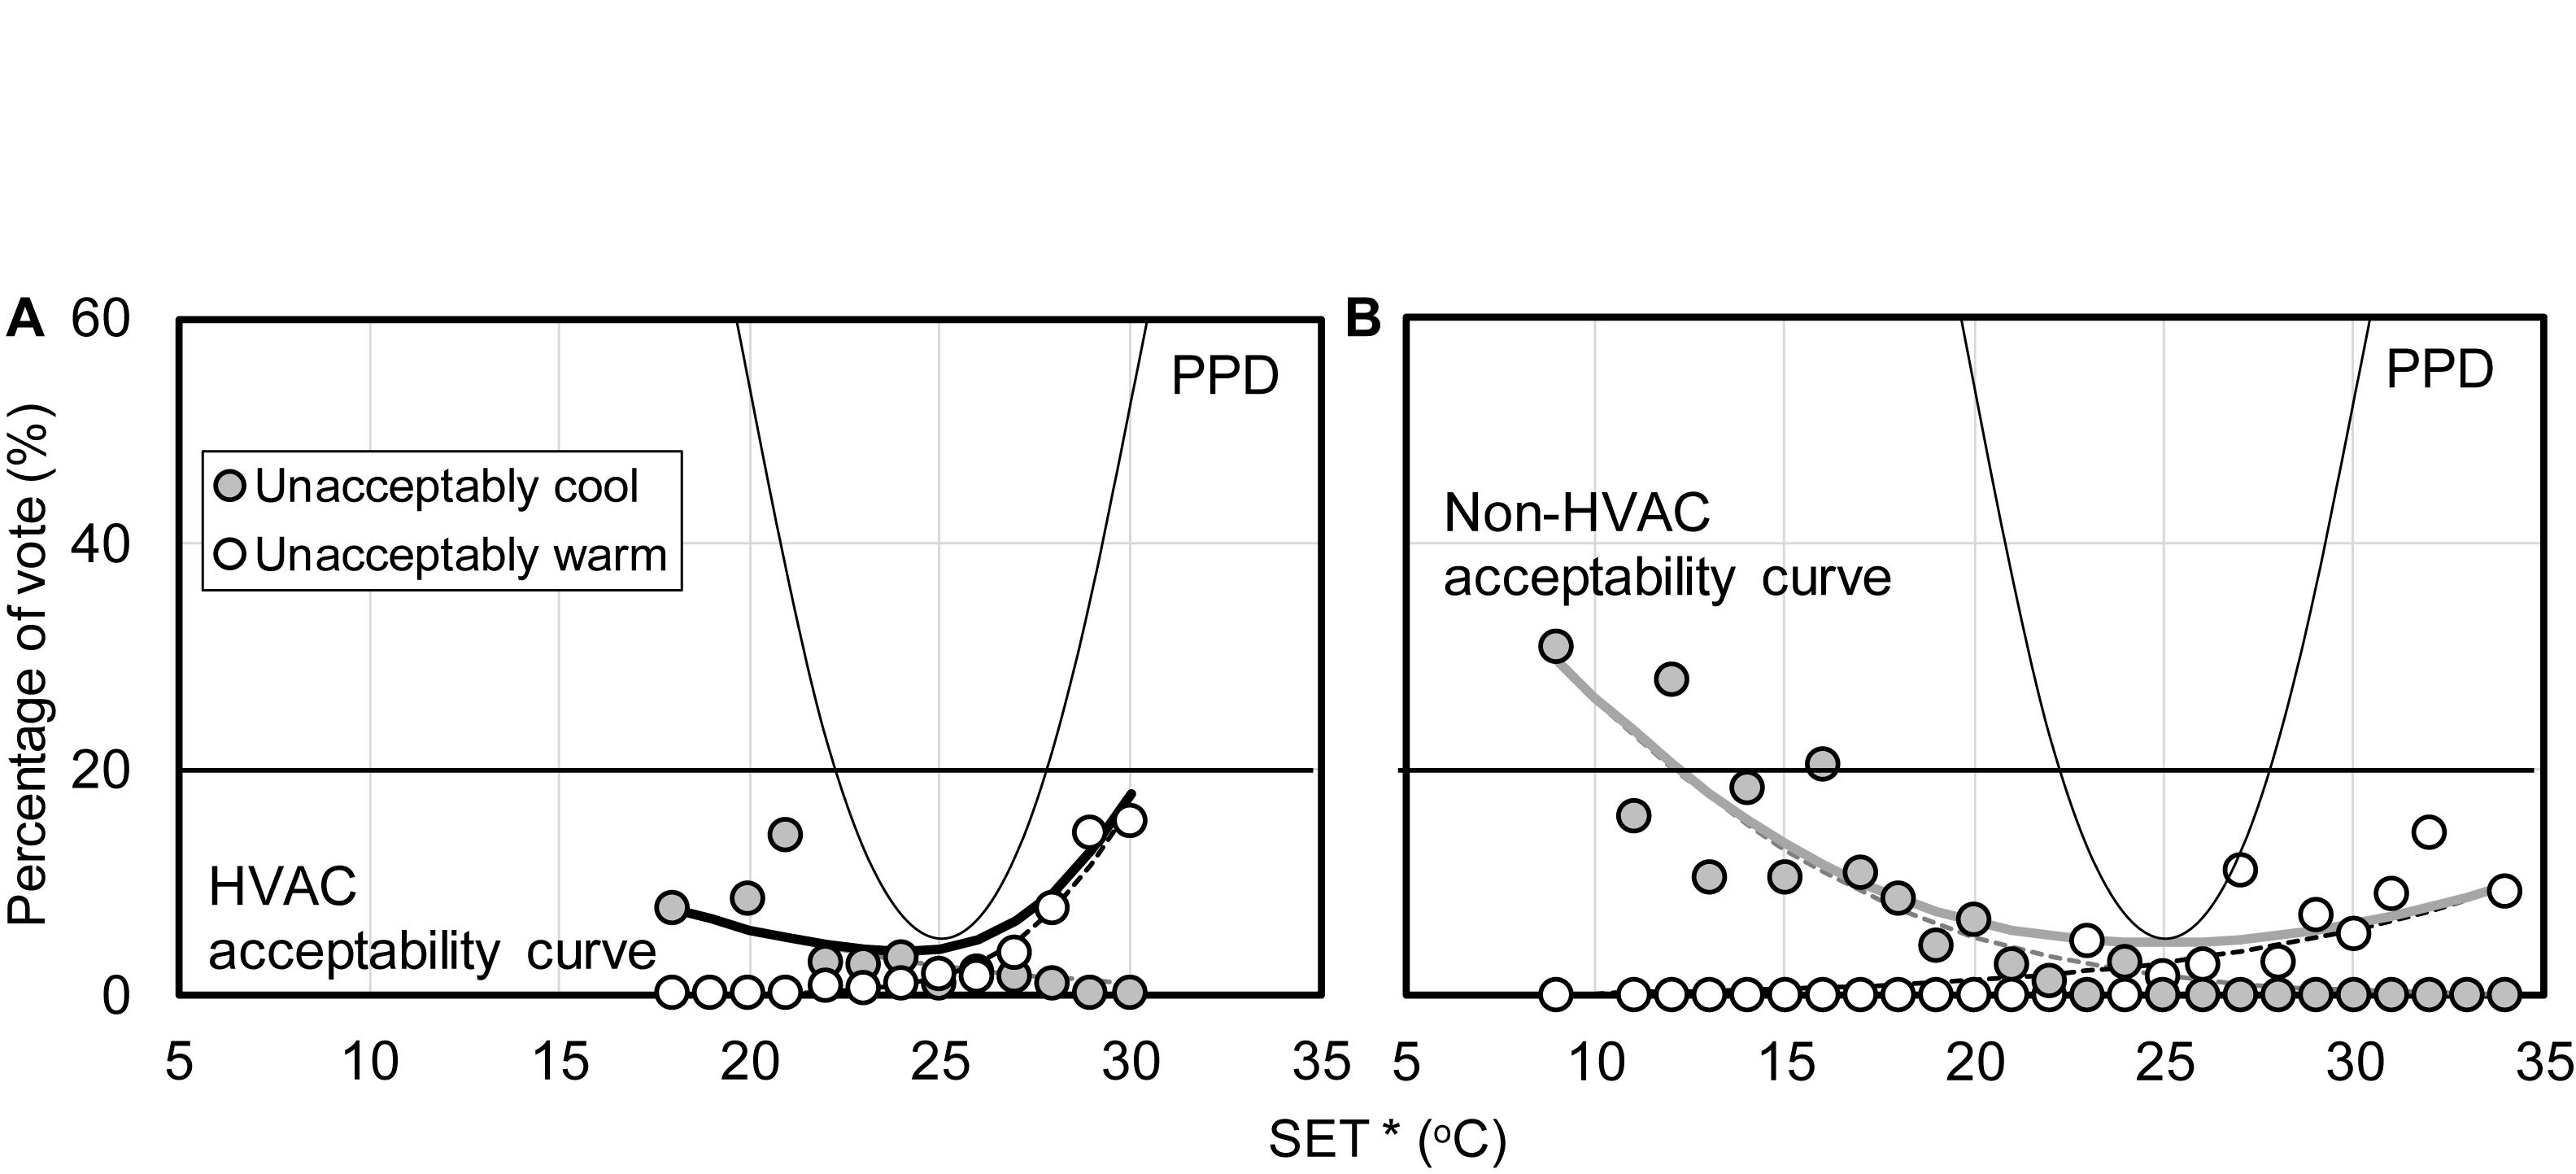
Figure 9. Thermal acceptability curve: (A) HVAC spaces, (B) non-HVAC spaces.
Of the three processes of thermal adaptation, behavioral adaptation in terms of clothing and selection of thermal environment parameters is considered in SET∗ calculation. Physiological adaptation is negligible for such a short occupancy period. Therefore, the difference in comfort zone between non-HVAC and HVAC spaces clearly indicates the effect of psychological adaptation resulting from the difference in the level of environmental control and intended duration of occupancy.
Comparison of Thermal Comfort Zone
As stated in section “Comfort Zone, Not Comfort Temperature,” much of outdoor comfort research defined the comfort condition of occupants by comfort temperature, and not the comfort zone. Recent studies by Li et al. (2016); Salata et al. (2016), Chen et al. (2018), and, Cheung and Jim (2018) derived outdoor thermal acceptability range directly from field observations. The environmental variable employed for their analysis was PET. Hwang and Lin (2007) proposed the comfort zone of semi-outdoor environment without air-conditioning in SET∗ for the hot and humid climatic conditions in Taiwan. The range 21.3–32.8°C for typical applications and 22.9–27.6°C for higher comfort are recommended. Determination of the ranges was based on the acceptability vote and the three central categories of thermal sensation vote, respectively. Comparison with the comfort zone of non-HVAC spaces showed that the lower limit of the two proposed ranges were 7–10°C higher, and the upper limit for typical use was approximately 1°C higher than the comfort zones of this study. Outdoor temperatures are higher in Central Taiwan compared to Tokyo, especially in the winter. Seasonal norms in outdoor conditions may have affected the upper and the lower limit of comfort; however, more data on adaptive comfort zone are needed for further examination.
Comfort zones in the adaptive comfort standards, ASHRAE 55 and ISO 17772-1, are defined in OT for a given outdoor condition. Daily mean outdoor temperature of 8°C and 32°C along with the minimum and the maximum values of the survey days, were used to derive the upper and the lower limit of the 80% comfort zone. The lower limit at 8°C and the higher limit at 32°C were regarded as the yearly comfort zone for NV buildings. These comfort temperature limits in OT were converted into SET∗. The assumption described in section “Derivation of Thermal Comfort Zone” for derivation of the reference PPD curve, was applied to determine the equivalent SET∗ for a given OT. Comparison of the comfort zones are presented in Figure 10. ISO 17772-1 provides recommendations for the NV buildings in three categories corresponding to the level of expectations the occupants might have for the environment as high (I), medium (II), and moderate (III).
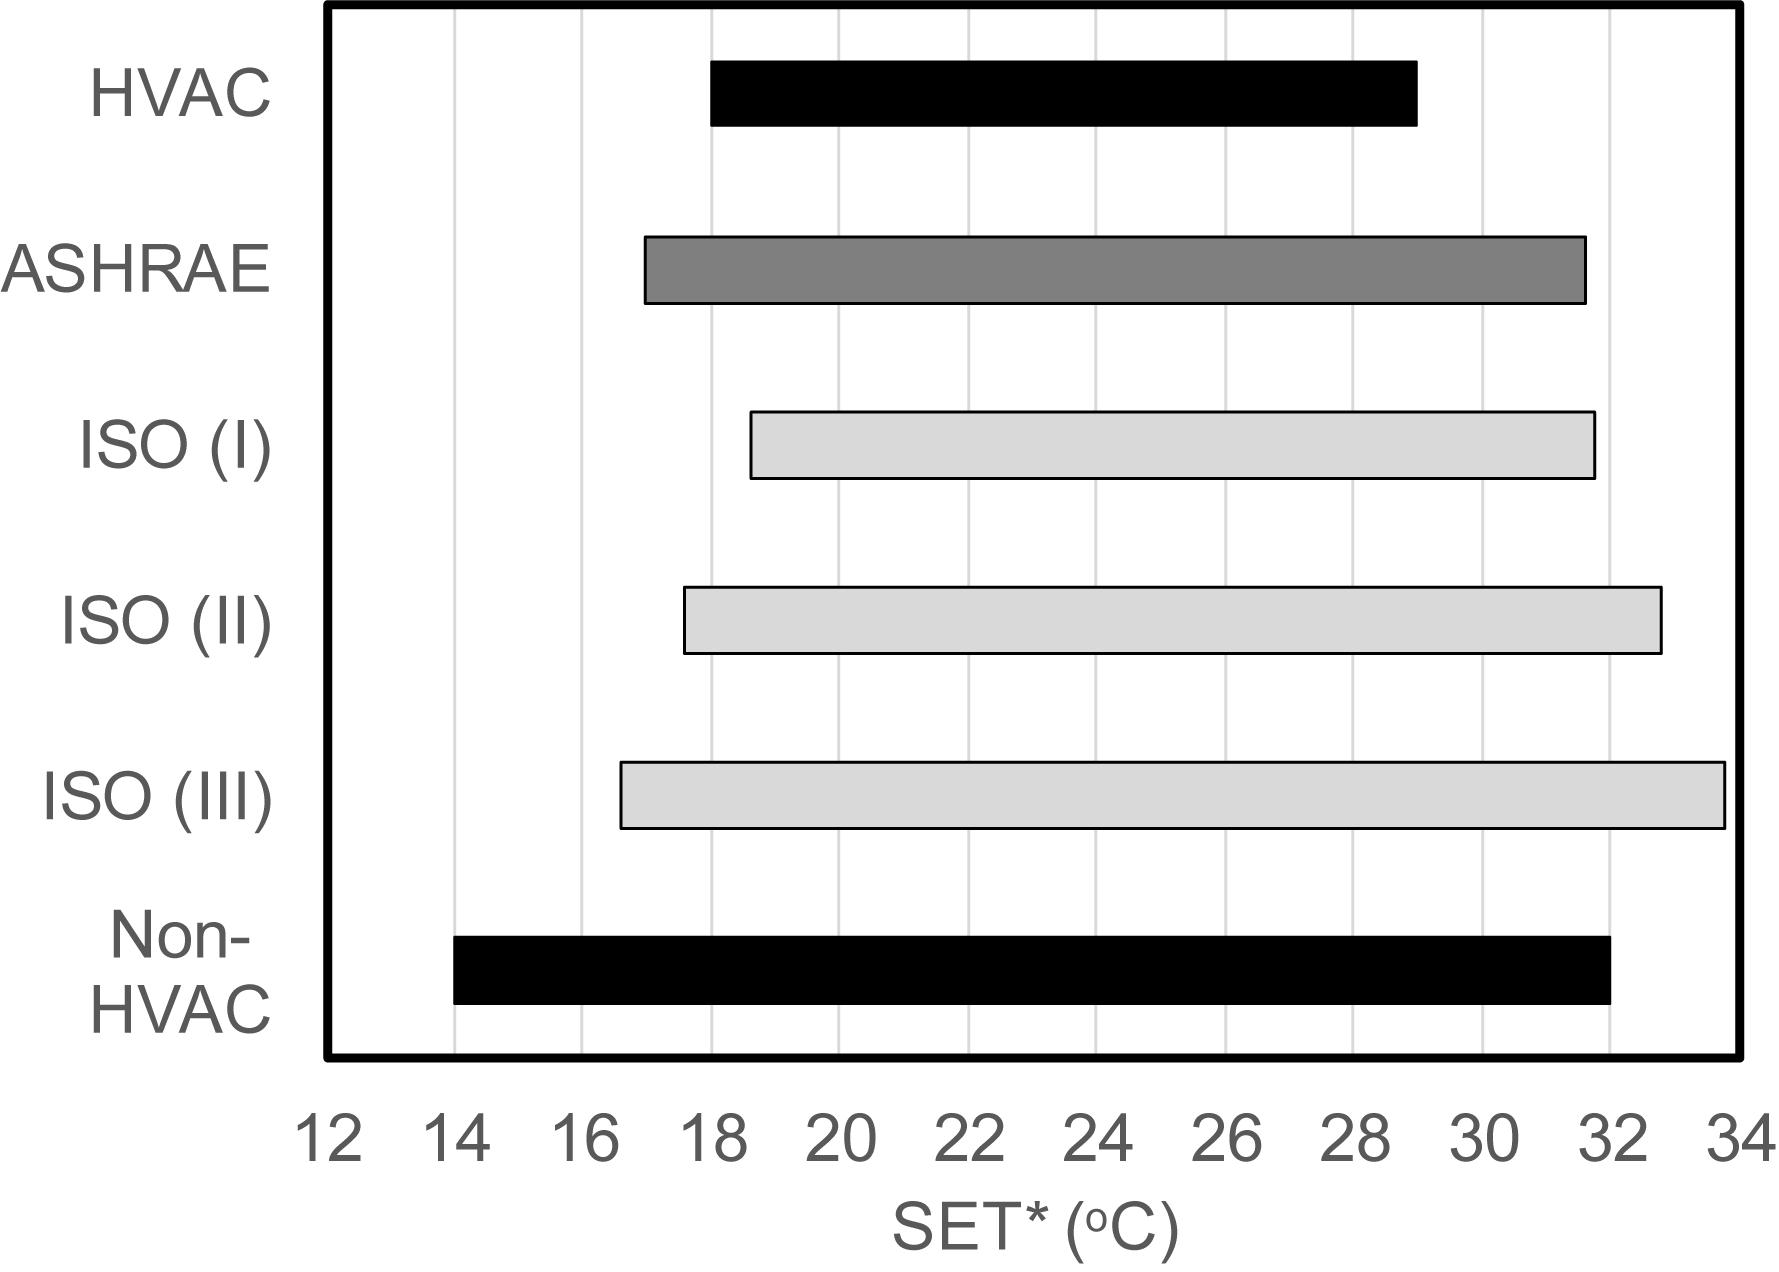
Figure 10. Comparison of comfort zones.
Although the middle range from 18.6–29.0°C was common among the six comfort zones, the upper and the lower temperature limits were uneven. For example, the upper temperature limit for ISO (III) was approximately 2°C higher than that of the non-HVAC spaces. A temperature difference of 2°C would equal to a 10% increase in thermal discomfort. Selecting the appropriate comfort zone is critical in the design and assessment of semi-outdoor environment in practice. Further data on adaptive comfort zones for various types of buildings or spaces are needed to determine the rules for selecting the appropriate comfort zone for environments with different contexts.
Discussion
Comfort temperatures and acceptability ranges in the adaptive standards are defined in OT. Thermal conditions of semi-outdoor environment are more diverse in range compared to that of NV buildings. The comfort zone analysis using SET∗ instead of OT enables to account for the behavioral adaptation of the occupants. Physiological adaptation is negligible for the short duration of stay in semi-outdoor environments. Psychological adaptation of occupants affected the perception of thermal environment, and hence the comfort zone in non-HVAC and HVAC spaces.
A metabolic rate of 1.1 met was assumed for occupants in both HVAC and non-HVAC spaces. Previous occupant activity may have affected metabolic rates at the time of survey; however, questionnaire results indicated that most occupants were engaged in moderate activities such as walking, standing, or sitting. The prior thermal environment may have also affected the occupants’ perceptions of their current environment. However, urban spaces such as the ones considered in this study need to be designed for people with varied thermal backgrounds. It is logical to analyze the thermal adaptation and derive the comfort zones based on the entire population of widely surveyed occupants.
The four areas selected for the present survey were semi-outdoor public spaces where people were free to stay or leave at their own will. The average duration of occupancy was much shorter than in the office buildings, which has been the focus for the adaptive studies. Moreover, questionnaire survey on occupants who chose not to stay could not be conducted. The comfort range may become narrower if the occupants were unable to leave the space at their will. Contextual differences on environmental control and function of the spaces need to be considered to apply the findings. Behavioral adaptation was investigated in this study for selection of occupancy environment, clothing adjustment, and occupancy conditions. The combination of behavioral characteristics would be a guide to determine the social and the architectural contexts of a given environment.
Analysis of seasonal differences in the comfort zone could not be conducted owing to the lack of data for individual seasons. Although the present analysis was based on a yearly observation, the upper and the lower limits of SET∗ are likely to be experienced in the summer and the winter months, respectively. The yearly comfort zone should suffice for the practical needs of the semi-outdoor thermal environment.
Paring votes of overall comfort and acceptability with thermal preference enabled analysis of yearly comfort zone, with the minimum effect of seasonal semantic differences in the thermal sensation scale. Separate probit curve fit on the warm side and on the cool side yielded asymmetrical curves for thermal comfort and thermal acceptability. Evident asymmetry was observed for the thermal acceptability curves, and the occupants in non-HVAC spaces were more intolerant to the cold environment. The distribution of SET∗ in Figure 8 shows that the lowest temperature in HVAC spaces was 18°C as opposed to 9°C in non-HVAC spaces. Occupants in HVAC spaces were secured from severe cold; thus, stronger intolerance was observed on the warmer side. Asymmetric comfort curve would be effective in determining the type of environment expected by the occupants.
The data analyzed in this study were collected approximately 20 years ago. The outdoor temperature in the summer is in an increasing trend for decades in Tokyo, similar to other parts of the world. It is essentials for field studies to test the applicability of their results regularly. Comparison with the latest studies will enable extraction of the invariable characteristics in thermal adaptation. The detailed documentation of each study is important for the purpose.
Conclusion
Thermal adaptation characteristics and thermal comfort zone were investigated in urban semi-outdoor environment. Four spaces with different levels of environmental control, i.e., non-HVAC spaces and HVAC spaces were selected in Tokyo, Japan. Seasonal field surveys lasting over a period of 80 days were conducted through 2001–2003 to the observe occupancy condition, the thermal environment, and the occupant responses. Mobile measurement cart and crosschecking process of clothing survey enabled the precise calculation of SET∗ for each questionnaire respondent with 2,711 sets of data were for the analysis.
Examination of thermal environment selected for occupancy showed that the occupants were adjusting themselves to fit within a certain range of SET∗. Air velocity and MRT, however, were not selected to satisfy thermal comfort conditions. Clothing adjustment was the principal form of behavioral adaptation. The dominant factor affecting the clothing adjustment was the daily mean outdoor temperature in both the non-HVAC and the HVAC spaces.
Occupants in the non-HVAC spaces were responsive to their surrounding environment and chose not to stay when the temperatures became lower. The total number of occupants and the mean occupancy period of the day had a strong linear relationship with the daily mean air temperature of the occupied zone. No correlation was found between the thermal environment and the occupancy conditions in HVAC spaces.
Instead of comfort temperatures, adaptive thermal comfort zones, were derived directly from subjective votes. Paring votes of overall comfort and acceptability with thermal preference enabled the analysis of yearly comfort zone, without the effects of seasonal semantic differences in the thermal sensation scale. Separate probit curve fit on the warm side and on the cool side yielded asymmetrical curves for thermal comfort and thermal acceptability. The comfort zone in SET∗ was found to be 23–28°C for PPD, 18–29°C for the HVAC spaces, and 14–32°C for the non-HVAC spaces. Occupants in the semi-outdoor environments were tolerant to their thermal environment in a range two to three times wider than the one predicted by PPD.
The difference in the comfort zone and the behavioral adaptation characteristics between the non-HVAC and the HVAC spaces indicated the effect of psychological adaptation resulting from the differences in the level of environmental control and the intended duration of occupancy.
These findings are expected to provide useful information for the design and assessment of urban semi-outdoor environments.
Data Availability Statement
The datasets generated for this study are available on request to the corresponding author.
Ethics Statement
Ethical review and approval was not required for the study on human participants in accordance with the local legislation and institutional requirements at the time of survey. However, the corresponding author conducted field survey based on the principles of the Helsinki Declaration.
Author Contributions
JN designed and performed the field survey. JN wrote the manuscript in consultation with ST. Both authors discussed the results and contributed to the final manuscript.
Funding
This work was supported by JSPS Grant-in-Aid for Young Scientists (B) Grant Number JP25820285.
Conflict of Interest
The authors declare that the research was conducted in the absence of any commercial or financial relationships that could be construed as a potential conflict of interest.
Acknowledgments
The authors would like to thank Goto K., Noguchi, M., Fujii, H., Shimoda, T., Morii, T., Uruno, M., Okamoto, Y., Takahashi, M. for their devoted effort to carry out the long survey and to organize the database of measured parameters.
Supplementary Material
The Supplementary Material for this article can be found online at: https://www.frontiersin.org/articles/10.3389/fbuil.2020.00034/full#supplementary-material
Footnotes
References
American Society of Heating, Refrigerating, and Air-Conditioning Engineers [ASHRAE] (2017). ANSI/ASHRAE Standard 55-2017: Thermal Environmental Conditions for Human Occupancy. Atlanda, GA: American Society of Heating, Refrigerating and Air-Conditioning Engineers.
Bauman, F. S., Carter, T. G., Baughman, A. V., and Arens, E. (1998). Field study of the impact of a desktop task/ambient conditioning system in office buildings. ASHRAE Trans. 104, 1153–1171.
Błażejczyk, K., Broede, P., Diala, D., Havenith, G., Holmer, I., Jendridzky, J., et al. (2010). Principles of the new universal thermal climate index (UTCI) and its application to bioclimatic research in European scale. Miscellanea Geographica 14, 91–102. doi: 10.2478/mgrsd-2010-0009
Brager, G. S., and de Dear, R. J. (1998). Thermal adaptation in the built environment: a literature review. Energy Build. 27, 83–96. doi: 10.1016/S0378-7788(97)00053-4
Chen, X., Xue, P., Liu, L., Gao, L., and Liu, J. (2018). Outdoor thermal comfort and adaptation in severe cold area: a longitudinal survey in Harbin, China. Build. Environ. 143, 548–560. doi: 10.1016/j.buildenv.2018.07.041
Cheung, P., and Jim, C. (2018). Subjective outdoor thermal comfort and urban green space usage in humid-subtropical Hong Kong. Energy Build. 173, 150–162. doi: 10.1016/j.enbuild.2018.05.029
Chun, C. Y., and Tamura, A. (1998). Thermal environment and human responses in underground shopping malls vs department stores in Japan. Build. Environ. 33, 151–158. doi: 10.1016/S0360-1323(97)00047-4
De Carli, M., Olesen, B. W., Zarrellaa, A., and Zecchin, R. (2007). People’s clothing behaviour according to external weather and indoor environment. Build. Environ. 42, 3965–3973. doi: 10.1016/j.buildenv.2006.06.038
de Dear, R. (1998). A global database of thermal comfort field experiments. ASHRAE Trans. 104, 1141–1152.
de Dear, R. J., and Brager, G. S. (1998). Developing an adaptive model of thermal comfort and preferences. ASHRAE Trans. 104, 145–167. doi: 10.3310/hta23520
Deutsches Institut für Normung [DIN] (2008). VDI 3787 - Environmental meteorology Methods for the Human Biometeorological Evaluation of Climate and Air Quality for Urban and Regional Planning at Regional Level - Part I: Climate. Berlin: Deutsches Institut für Normung.
Eliasson, I., Knez, I., Westerberg, U., Thorsson, S., and Lindberg, F. (2007). Climate and behaviour in a Nordic city. Landsc. Urban Plan. 82, 72–84. doi: 10.1016/j.landurbplan.2007.01.020
Feriadi, H., Wong, N., Chandra, S., Cheong, K., and Tham, K. (2002). “Redefining appropriate thermal comfort standard for naturally ventilated buildings in tropics (Singapore and Indonesia perspective),” in Proceedings of the Ninth International Conference on Indoor Air Quality and Climate (Rotterdam), 110–115.
Höppe, P. (1999). The physiological equivalent temperature - a universal index for the biometeorological assessment of the thermal environment. Int. J. Biometeorol. 43, 71–75. doi: 10.1007/s004840050118
Huizenga, C. (2011). ASHRAE Thermal Comfort Tool CD (Ver.2). Altanta, GA: ASHRAE. Available online at: https://www.techstreet.com/standards/ashrae-thermal-comfort-tool-cd-version-2?product_id=1806669#full
Humphreys, M. A. (1976). Field studies of thermal comfort compared and applied. J. Inst. Heat. Vent. Eng. 44, 5–27.
Humphreys, M. A., and Nicol, J. F. (1998). Understanding the adaptive approach to thermal comfort. ASHRAE Trans. 104, 991–1004.
Hwang, R., and Lin, T. (2007). Thermal comfort requirements for occupants of semi-outdoor and outdoor environments in hot-humid regions. Archit. Sci. Rev. 50, 357–364. doi: 10.3763/asre.2007.5043
International Organization for Standardization [ISO] (1995). ISO 9920. Ergonomics of the Thermal Environment—Estimation of the Thermal Insulation and Evaporative Resistance of a Clothed Ensemble. Geneva: International Organization for Standardization.
International Organization for Standardization [ISO]. (1998). ISO 7726. Ergonomics of the thermal environment — Instruments for measuring physical quantities. Geneva: International Organization for Standardization.
International Organization for Standardization [ISO] (2017). ISO 17772-1: Energy Performance of buildings — Indoor Environmental Quality — Part 1: Indoor Environmental Input Parameters for the Design and Assessment of Energy Performance of Buildings. Geneva: International Organization for Standardization.
Li, K., Zhang, Y., and Zhao, L. (2016). Outdoor thermal comfort and activities in the urban residential community in a humid subtropical area of China Kunming. Energy Build. 133, 498–451. doi: 10.1016/j.enbuild.2016.10.013
Lin, T. (2009). Thermal perception, adaptation and attendance in a public square in hot and humid regions. Build. Environ. 44, 2017–2026. doi: 10.1016/j.buildenv.2009.02.004
Nakano, J., and Tanabe, S. (2004). Thermal comfort and adaptation in semi-outdoor environments. ASHRAE Trans. 110, 543–553.
Nicol, J. F., and Humphreys, M. A. (2010). Derivation of the adaptive equations for thermal comfort in free-running buildings in European standard EN15251. Build. Environ. 45, 11–17. doi: 10.1016/j.buildenv.2008.12.013
Nikolopoulou, M., Baker, N., and Steemers, K. (2001). Thermal comfort in outdoor urban spaces: understanding the human parameter. Solar Energy 70, 227–235. doi: 10.1016/S0038-092X(00)00093-1
Nikolopoulou, M., and Lykoudis, S. (2006). Thermal comfort in outdoor urban spaces: analysis across different European countries. Build. Environ. 41, 1455–1470. doi: 10.1016/j.buildenv.2005.05.031
Nikolopoulou, M., and Steemers, K. (2003). Thermal comfort and psychological adaptation as a guide for designing urban spaces. Energy Build. 35, 95–101. doi: 10.1016/S0378-7788(02)00084-1
Pickup, J., and de Dear, R. (2000). “An outdoor thermal comfort index (Out_SET∗)–Part 1–The model and its assumptions,” in Proceedings of the Biometeorology and Urban Climatology at the Turn of the Millennium, Selected Papers From the ICB-ICUC’ 99 Conference (Sydney: World Meteorological Organization), 279–283.
Pitts, A. (2013). Thermal comfort in transition spaces. Buildings 2013, 122–142. doi: 10.3390/buildings3010122
Rijal, H. B. (2012). “Thermal adaptation outdoors and the effect of wind on thermal comfort,” in Ventilating Cities, eds S. Kato and K. Hiyama (Berlin: Springer Science+Business Media), 33–58. doi: 10.1007/978-94-007-2771-7_3
Salata, F., Golasi, I., del Lieto Vollaro, R., and del Lieto Vollaro, A. (2016). Outdoor thermal comfort in the Mediterranean area. A transversal study in Rome, Italy. Build. Environ. 96, 46–61. doi: 10.1016/j.buildenv.2015.11.023
Spagnolo, J., and de Dear, R. (2003). A field study of thermal comfort in outdoor and semi-outdoor environments in subtropical Sydney Australia. Build. Environ. 38, 721–738. doi: 10.1016/S0360-1323(02)00209-3
Thorsson, S., Honjo, T., Lindberg, F., Eliasson, I., and Lim, E. (2007). thermal comfort and outdoor activity in japanese urban public places. Environ. Behav. 39, 660–684. doi: 10.1177/0013916506294937
Thorsson, S., Lindqvist, M., and Lindqvist, S. (2004). Thermal bioclimatic conditions and patterns of behaviour in an urban park in Goteborg. Int. J. Biometeorol. 48, 149–156. doi: 10.1007/s00484-003-0189-8
Keywords: semi-outdoor environment, thermal adaptation, occupant behavior, clothing adjustment, occupancy condition, selected environment, comfort zone, acceptability zone
Citation: Nakano J and Tanabe S (2020) Thermal Adaptation and Comfort Zones in Urban Semi-Outdoor Environments. Front. Built Environ. 6:34. doi: 10.3389/fbuil.2020.00034
Received: 25 October 2019; Accepted: 06 March 2020;
Published: 31 March 2020.
Edited by:
Jorn Toftum, Technical University of Denmark, DenmarkReviewed by:
Hom Bahadur Rijal, Tokyo City University, JapanRicardo Forgiarini Rupp, Federal University of Santa Catarina, Brazil
Copyright © 2020 Nakano and Tanabe. This is an open-access article distributed under the terms of the Creative Commons Attribution License (CC BY). The use, distribution or reproduction in other forums is permitted, provided the original author(s) and the copyright owner(s) are credited and that the original publication in this journal is cited, in accordance with accepted academic practice. No use, distribution or reproduction is permitted which does not comply with these terms.
*Correspondence: Junta Nakano, am5ha2Fub0B0b2thaS5hYy5qcA==