 João Falcão
 Carlos Ruiz2
 Shijia Pan
 Hae Young Noh
 Pei Zhang
- 1Electrical and Computer Engineering, Carnegie Mellon University, Moffett Field, CA, United States
- 2AiFi Research, Santa Clara, CA, United States
- 3Computer Science and Engineering, University of California, Merced, Merced, CA, United States
- 4Civil and Environmental Engineering, Stanford University, Stanford, CA, United States
A common pain point for physical retail stores is live inventory monitoring, i.e., knowing how many items of each product are left on the shelves. About 4% of sales are lost due to an average 5–10% out-of-shelf stockout rate, while additional supplies existed in the warehouse. Traditional techniques rely on manual inspection, per-item tagging using RFIDs, or human-in-the-loop systems, such as Amazon Go. These approaches, while effective, either have poor accuracy, long delays between results or are cost prohibitive. In this paper, we present FAIM (Autonomous Inventory Monitoring Framework) for cashier-less stores. To the best of our knowledge, this is the first fully autonomous system that fuses multiple sensing modalities. Utilizing weight difference on a shelf, visual item recognition in customers' hands and prior knowledge of item layout FAIM monitors products picked up or returned without human-in-the-loop. We present results from a real-world setup with 85 items (33 unique products) replicating the layout of a local 7-Eleven store. To evaluate our system we characterize the similarity of the unique products across three physical features (i.e., weight, color, and location). Our results show that the fused approach provides up to 92.6% item identification accuracy, a 2× reduction in error compared to reported self-checkout stations.
1. Introduction
Traditional retail stores face significant labor costs to monitor shelf inventory regularly, often postponing this operation until off-peak hours. A delay in inventory monitoring causes high sales losses when a particular item is gone from the shelf though additional stock existed in the warehouse. An ordinary convenience store faces out-of-shelf stockout rates of 5–10%, which results in a loss of up to 4% of sales (Gruen et al., 2002). In North America alone, this accounts for ~93 billion annual losses (Li and Zhang, 2015).
In order to address this issue, current approaches focus on three ways to monitor shelf stock: manual, on-item tags, and vision-based sensing. Manual approaches are the norm and mainly rely on visual inspection of the shelves to reorganize and restock when needed. Employees bandwidth typically only allows for up to a few checks a day, leading to high cost and minimal effectiveness especially in high traffic stores.
Other approaches use sensors on every item (e.g., RFID tags) to monitor remaining stock of each product (Bottani et al., 2017; de Boer, 2018). However, the added cost of the tags together with the labor cost of labeling every item make this approach impractical other than for high-end goods, such as electronic consumer goods or apparel (de Boer, 2018; Moretti et al., 2019). More recently, cashier-less stores using a variety of sensors are being explored. Most approaches still require human operators for proper functioning and have highly constrained stocking requirements. While some stores are already operational, such as Amazon Go Amazon (2019), their automated accuracy has not been revealed and several reports point out that they heavily rely on employees watching the cameras to avoid low receipt accuracy (Coldewey, 2019; Recode, 2019).
In this paper, we present an Autonomous Inventory Monitoring system, FAIM, which tracks shelf-level stock in real-time as the customers pick up or return items. Using weight sensors on each shelf, our system identifies the item being taken based on the location and absolute weight change of an event, which is fused with visual object identification once the item is in the customer's hand. FAIM leverages physical knowledge about the customer–shelf interaction to focus the attention of the visual classifier only on the item being interacted with. We fully implemented FAIM on a five shelf setup with four cameras and 60 weight plates. To evaluate the system in a real-world setting, we used 85 items from 33 unique products and mimicked the item layout of a local 7-Eleven. Therefore, our contribution is 3-fold:
• FAIM, the first fully autonomous shelf inventory monitoring system without human-in-the-loop.
• An adaptive sensor aggregation algorithm to combine information from different sensing modalities, in particular shelf weight differential, visual in-hand item recognition, and prior knowledge of item layout (i.e., product location).
• A visual item recognition model training methodology that leverages traditional visual descriptors along with an implementation and evaluation in a real-world market setup with 33 products replicating the layout of a 7-Eleven store.
The rest of the paper is organized as follows. First, section 2 discusses related works and background. Section 3 describes the design of the FAIM system. In section 4 we present the fusion algorithm that combines location, weight and vision information. Next, section 5 provides results and analysis of the real-world evaluation in our store setup. Finally, we conclude in section 6.
2. Related Work
There exists a significant amount of work on object identification from weight as well as appearance features, though most focus on only one sensing modality. While there are solutions that can successfully identify objects solely by their weight, they fall short in tackling the inventory monitoring domain, where many sets of products weigh similarly (e.g., soft drinks, energy bars). Although vision-based object identification would be able to tackle the above cases when their packaging is different, the convenience retail market is filled with similar-looking items that have distinct content (e.g., any yogurt vs. its fat-free version). Furthermore there are works that attempt to identify the person interaction using visual and inertial fusion approaches (Ruiz et al., 2020), however these are outside the scope of the paper given that we are only addressing at most one customer interacting at a time (see section 3.2).
None of these solutions, alone, is capable of fully addressing the autonomous inventory monitoring problem due to the nature of the sensing modalities and the complexity of the environment. Sections 2.1 and 2.2 cover the state-of-the-art in weight- and vision-based object identification, respectively, and their individual limitations.
2.1. Weight-Based Object Identification
The location of an event is a key piece of information to understand what object was picked—or placed—and is used by most prior works to complement the magnitude of the total change in weight. Different hardware approaches have been proposed to measure the weight on a surface and identify objects placed on it. A common solution consists in instrumenting a platform, such as a table or a shelf, with multiple load cells to measure the total weight of the objects on the platform (Murao et al., 2015, 2017; Misra et al., 2019). While this makes it possible to identify objects by tracking changes in the total weight, it cannot handle cases where certain object weights are multiples of each other. In addition, location information can only be retrieved during an event and for that particular object.
To overcome these limitations, some stock-level monitoring approaches rely on capacitive weight-sensing mats (Metzger et al., 2007; Green, 2009; Godlewski, 2010; Rofouei et al., 2010; Meyer, 2016; Liu et al., 2018). By measuring the change in capacitance between two parallel plates, these works analyze the presence, absence or shape of individual items to identify and count them. However, such approaches become hard to utilize when the sensing material is facing the harsh environment of an operating convenience store: liquids spilling, continuous impact, friction, permanent deformations and cost dramatically constrain their practicality in a store setting. Furthermore, any weight-based only object identification method suffers from low accuracy when dealing with categories of items that contain a high variance of weight (e.g., fruits, vegetables or packaged salads). For such classes of objects other sensing modalities are required.
Finally, a small subset of prior works have attempted to complement weight sensing with vision, for applications, such as grocery re-identification in a fridge (Kamoda et al., 2012; Misra et al., 2019). Despite the small scale and highly controlled environment, these works indicate the benefits of multi-modal sensing for item identification.
2.2. Vision-Based Object Identification
There are two major approaches for visual object identification:
Traditional feature-based and descriptor-based techniques, such as Bag of Features (BoF) (O'Hara and Draper, 2011), shape descriptors for object retrieval (López et al., 2017), Local Binary Pattern (LBP) (Fronitasari and Gunawan, 2017), and Speeded-Up Robust Features (SURF) (Srivastava et al., 2019), rely on different sets of features designed to extract meaningful characteristics of regions in an image, which allows the detection and classification of objects. In practice, these approaches involve a high degree of parameter tuning, limiting their scalability and adaptability to new scenarios, such as different lighting conditions or camera angles (Loussaief and Abdelkrim, 2018).
On the other hand, Deep Learning techniques try to overcome this issue with a data-driven approach. Mask R-CNN (He et al., 2017), Faster R-CNN (Ren et al., 2015), Yolo (Redmon et al., 2016), Center-Net (Duan et al., 2019), NormalNet (Wang et al., 2019), FoveaBox (Kong et al., 2020), all leverage a big amount of data, both in 3D and 2D, to generalize the characteristics of the objects to be identified. While in theory they should not require human input, the training procedure still involves some hyper-parameter tuning. In addition, in order to achieve high accuracy levels, these models require thousands of images of each object, under different conditions, with different backgrounds and from different angles. These images require labeling of the ground-truth for training, this can either be done manually, creating a labor intensive problem, in a semi-supervised (Teng et al., 2018) or fully automated fashion (Ruiz et al., 2019c).
In the retail domain, several prior works have tackled the item identification problem (Qiao et al., 2017; Tonioni et al., 2018; Klasson et al., 2019; Wei et al., 2019) but current state-of-the-art is still limited in accuracy due to the great similarity in appearance across products (e.g., chocolate bars of the same brand with different sizes, flavors or textures). On top of that, none of these works take videos as input, meaning an added layer of scene understanding is required in order to figure out which of the detected products is the one the customer took (vs. products which remain on the shelf).
3. System Design
To the best of our knowledge, FAIM is the first fully autonomous shelf inventory monitoring system without human-in-the-loop. This section provides our system design choices and assumptions.
3.1. System Overview
Figure 2 shows FAIM's system framework. It utilizes multi-modal sensing to improve item identification accuracy. In particular, we focus on three sources of information: item layout, weight and appearance. FAIM's pipeline is triggered when a change in the total weight of a shelf is detected. From that it extracts two features: the absolute weight difference and the spatial distribution of the weight. The weight change-based prediction computes the probability of each product class by comparing the absolute weight difference to each product's average weight. The location-based prediction computes the probability of each product class by combining the spatial distribution of the weight change on the shelf with prior knowledge of item layout. The vision-based prediction leverages human pose estimation and background subtraction to focus the visual object classifier's attention to identify the object(s) in the customer's hand. Finally, FAIM fuses all three predictions by applying an adaptive weighted linear combination.
3.2. Assumptions
Handling all the intricacies and corner cases of a fully autonomous system for inventory monitoring is a very challenging task. Given the early stage of the research in this domain, we wanted to limit the scope of this paper in order to fully address the problem defined: handling pick up and put back events under normal shopping behavior. While we are aware that cultural, age, and other factors impact what's considered normal behavior, we observe some general trends on customers shopping in convenience stores. We make the following assumptions in order to scope this paper:
1. At any given time, at most one customer is interacting with a particular shelf. Unlike big supermarkets, convenience stores observe a much lower customer density albeit a higher foot traffic. In addition, most customers shop individually and respect other customers' personal space, i.e., if someone is picking an item from the same shelf they want an item from, they wait for the other customer to get their items first. This assumption is particularly true recently given the necessity of social distancing—due to COVID-19, people remain 6 feet apart. This physical separation and the typical size of a shelf (3–4 feet) make this a reasonable assumption.
2. Customers don't place outside objects on shelves. It is common for customers to enter the store carrying certain objects, such as a purse or a drink, but unless they are purposefully trying to fool the autonomous system, they rarely leave anything on a shelf that wasn't picked inside the store. Therefore, while users are free to return items they do not want anymore, FAIM can safely assume any put back event corresponds to items from the inventory.
3. Customers don't alter items' properties (weight or appearance) before putting something back. For instance, our system assumes that customers won't pick a bag of chips, eat half of them and put them back on a shelf.
4. Customers pick one item a time. When customers want multiple items from the same shelf, it is uncommon to pick different items with each hand at the same time, i.e., even if they use both hands, they usually pick a product with one first, then the other, so FAIM would correctly flag them as two separate events. Note that this assumption could be relaxed by considering all combinations of up to N items being picked up, though N should be kept small to limit computational complexity.
3.3. Hardware Design Decisions
There are many design choices involved in the instrumentation of smart retail stores for inventory monitoring. In this section, we discuss some insights we gained by implementing FAIM and working with actual retailers, as well as the impact and tradeoffs of different hardware approaches.
3.3.1. Weight Sensing
An interesting tradeoff to consider when instrumenting retail store fixtures with weight load cells is the size of each weight-sensing plate, i.e., the size of each independent platform suspended over one or more weight sensors. On the one hand, larger sensing areas—e.g., one per shelf or even one per fixture—means lower hardware cost and processing, but also lower signal resolution (the load cells need to support a larger maximum capacity) as well as lower spatial resolution (more items per plate, which increases the chances of having multiple items with very similar weights). In section 5 we explore the impact of different plate sizes on FAIM's accuracy.
Furthermore, weight plate size and design can have a big repercussion on item layout flexibility, an often desired demand by retailers. Product dimensions vary in a wide range, and so does the stock offered at convenience stores and their item layout. Therefore, limiting each product to a single sensing plate, while helping weight sensing by isolating each product, would lead to a hard constraint on the possible products on display, limiting its practical use.
Retailers' profit margins are very low and maximizing item density is of utter importance (see Figure 8 for an example of a typical fixture layout in a convenience store). We therefore adopted a flexible hardware design that can be easily mass-produced to bring costs down, as shown in Figure 1. Our single-size design consists of narrow weight plates (4″ width, divisible by the standard 48″ fixture length) laid contiguous to each other. This design has the added advantage that such small weight plates won't have as much weight on top, allowing for lower maximum capacity load cells thus higher weight resolution (sub-gram) without requiring expensive ADCs (Analog-to-Digital Converters). Moreover, section 3.4 details how FAIM handles cases where items span across multiple weight plates (the weight difference in each individual plate does not correspond to the total weight of the item, hence the product prediction has to cluster neighboring weight cells into a single event for a correct item identification).
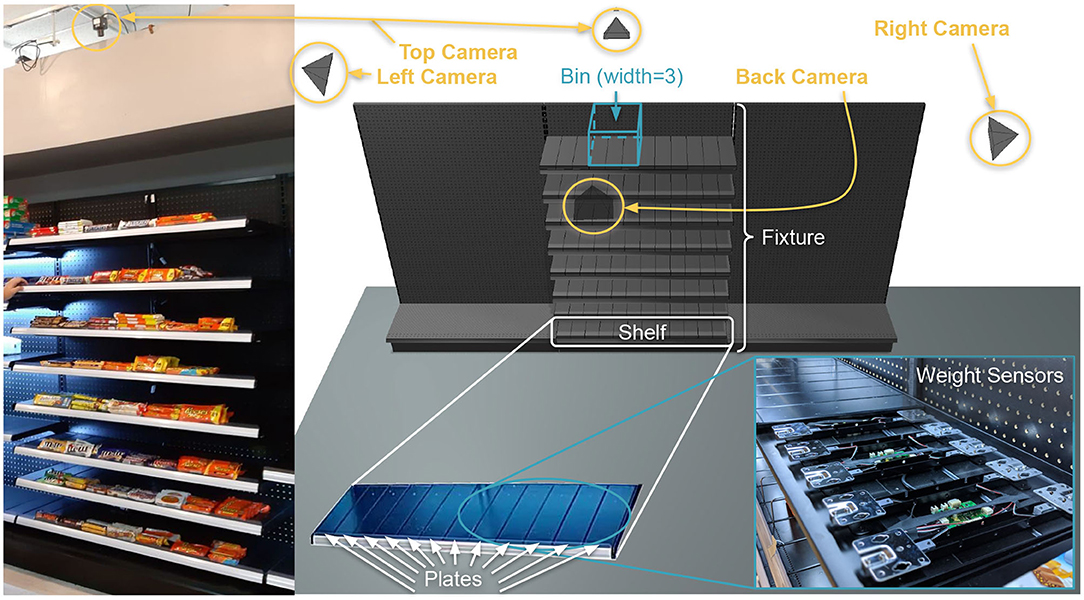
Figure 1. FAIM scenario and real implementation. Through weight sensors and cameras, the goal is to autonomously detect and identify what item(s) customers take.
3.3.2. Vision Sensing
There are also many design considerations related to installing cameras in retail stores, from camera specifications, to camera placement and even number of cameras to deploy. As vision processing improves, camera specification constraints can be relaxed. From our initial experiments, camera resolution doesn't play a huge role (in fact most deep learning networks downsize the input image to about 300–720 pixels wide for training and computation efficiency purposes). As for frame rate, we have empirically observed 25–30 fps to be enough to get at least one good frame of the item being picked. In addition, optimal lighting might help get sharper and more consistent views of the products, but that is out of the scope of this paper.
Camera quantity and placement pose trade-offs worth exploring more in depth in future work. Overall, the intuition is that by having multiple cameras spread across different viewing angles, the system can minimize the likelihood of visual occlusions. While this is true, the added hardware, setup, power and computational cost can dramatically impact the benefits of autonomous inventory monitoring. For instance, the first Amazon Go (Amazon, 2019) store in Seattle features hundreds of cameras—hanging from the ceiling, on top of each fixture and even below each shelf—and still relies on a human-in-the-loop approach to resolve uncertainties (Coldewey, 2019; Recode, 2019). From our initial experiments we empirically noticed weight sensors to be a much more robust—and cheaper—predictor of what item was picked up or put back on a shelf. Therefore, we do not consider shelf-mounted cameras in this paper. Section 5.2 however analyzes the impact of any combination among four different camera placements—top-down, sides and in front of each fixture—on FAIM's accuracy.
3.4. Customer-Shelf Interaction Detection
The first step in FAIM's pipeline is to detect when an event took place (i.e., a customer picked up or put back an item on a shelf). In our proposed system architecture, displayed in Figure 2, the processing of every change in the inventory starts with a weight change trigger. After carefully analyzing some initial experiment data, we came to the conclusion that, even during normal shopping behavior, i.e., customers not trying to fool the system, visual occlusions from hands or the body are highly likely (especially for smaller items), which makes vision much less reliable than weight for triggering events. Unless someone purposefully drops an object of similar weight as they pick an item from a shelf—which would break Assumption 2, the weight difference on the load sensors is generally enough to detect an event.
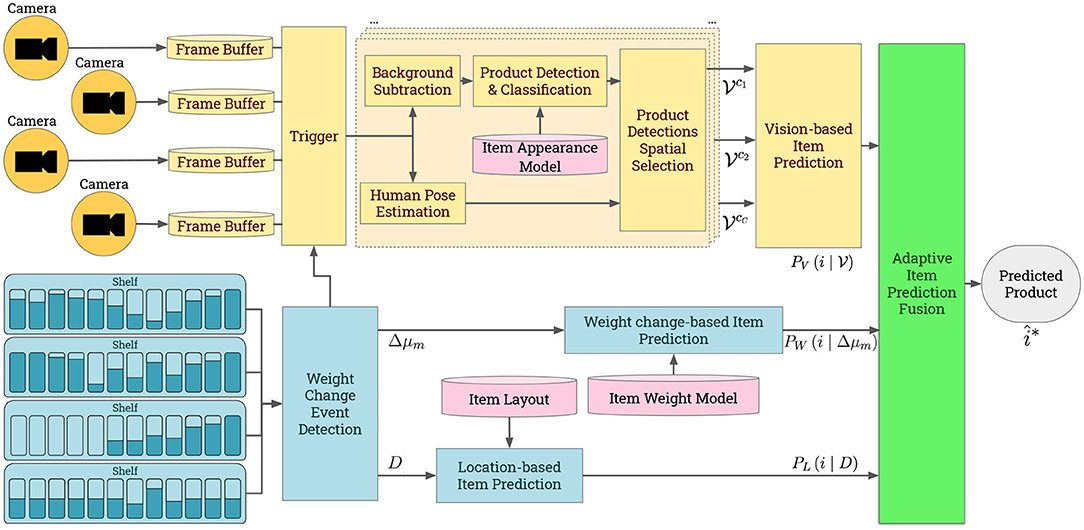
Figure 2. FAIM system overview. (Top) Vision-based pipeline (yellow). (Bottom) Location- and Weight change-based prediction pipeline (blue). (Right) Fusion algorithm (green). Prior knowledge of item layout, weight and appearance (pink).
There are numerous prior works to detect events based on weight change on a load sensed surface (Schmidt et al., 2002; Murao et al., 2017). In essence these approaches compute the mean and variance of the weight values over a sliding window, and classify the state as either stable—no interaction—or active—an interaction is taking place—by comparing the moving variance to a threshold. Once the state is back at stable, the mean weight before and after the active state is extracted and reported as the weight difference of the event, where the sign indicates whether it was a pick up or a put back.
Furthermore, inevitably—even with physical separation between the weight-sensing plates—there might be cases where items lay on more than one plate. In those scenarios, looking at the individual plate scale would yield erroneous weight difference values. Instead, we aggregate all weight plates in each shelf and detect events at the shelf level. This also makes the event detection more robust to light items laying on more than one plate—which might go undetected at each individual plate, but would still provide a big enough change on the aggregate moving variance and mean. See Figure 3, which shows the shelf aggregated weight data along with the weight moving variance, mean and the events detected.
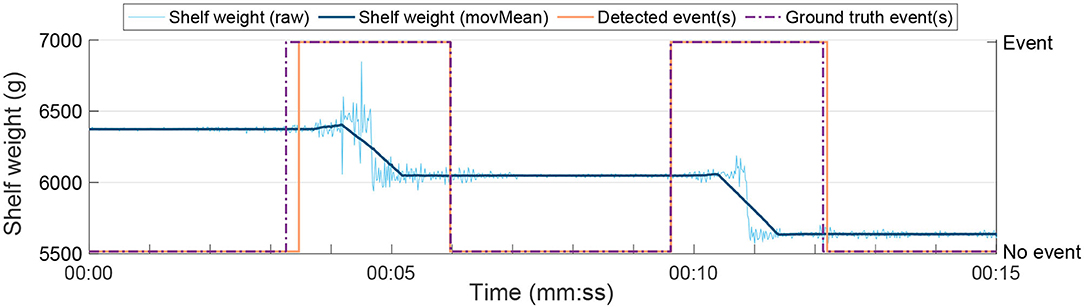
Figure 3. Aggregated weight sensed by a shelf during the first 15 s of one of our experiments (raw in light blue, filtered in dark blue), as well as the events detected by FAIM (orange) and the annotated ground-truth (purple). Two products were picked up in this section of the experiment.
Mathematically, let define the weight on the pth weight plate on shelf s at discrete time n. We compute the shelf's aggregated weight as:
Then, the shelf's aggregated moving mean and variance are, respectively, and :
where Nw is the sliding window half-length in samples, which corresponds to 0.5 s in our implementation (2Nw + 1 = 61).
An event is detected according to Equation (4):
where Nh and Nl correspond to the minimum length the weight variance has to exceed or fall short of the threshold εν in order to detect the beginning and end of an event. Based on some initial experiments we empirically set the values to Nh = Nl = 30 (0.5 s) and . Once an event has been detected, the Weight Change Event Detection module determines the event weight difference Δμ and the location—set of weight plates {ps}—according to Equation (5):
where εμ indicates the minimum weight contribution of a single plate in order to be included in the event, which we set to εμ = 5g. Once the event weight difference Δμ is determined, this module further computes the event weight distribution—set of weight contributions —according to Equation (6)
We define Equations (5a), (5b), and (6) as the output of the Weight Change Event Detection block (as seen in Figure 2). We leverage these definitions in Weight change-based item Prediction (section 4.2) and Location-based Item Prediction (section 4.1).
3.5. Vision Event Extraction
Understanding customer–item interactions and identifying the products picked from or returned to a shelf from video streams is very computationally expensive (especially for higher camera densities). For this reason, FAIM only saves a small buffer of recent history and uses the Weight Change Event Detection trigger from section 3.4 to start analyzing the images. For put back events we directly analyze the buffer as soon as an event is detected, whereas for pick up events we delay the vision analysis until the oldest frame in the buffer coincides with the event trigger, ne from Equation (4b).
The Vision Event Extraction pipeline is divided in two sequential tasks: Vision Event Preprocessing and Product Detections Spatial Selection. The former gathers different sources of visual evidence and is composed of the Human Pose Estimation, Background Subtraction and Product Detection & Classification modules. The latter then aggregates all the information and determines which object detections to keep or reject based on the customer's hand location (see Figure 4). As the output of the Vision Event Extraction pipeline, those detections together with their associated product probabilities, are fed into the Vision-based Item Identification module (section 4.3) which tries to determine what product was picked.
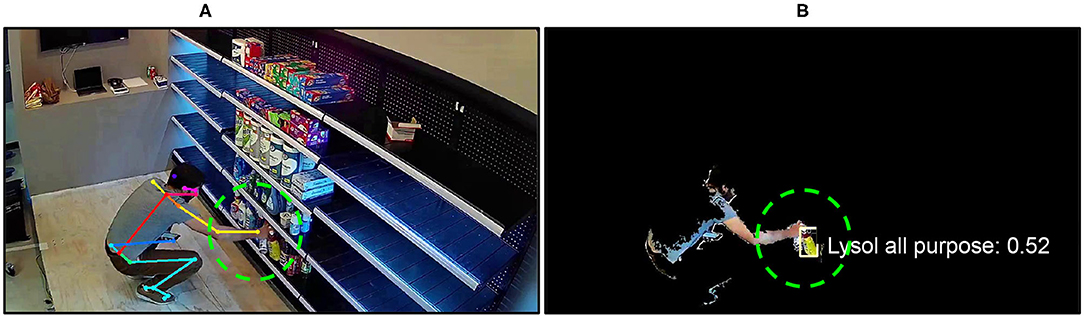
Figure 4. Human pose estimation provides us an estimate of the location of the customer's hand, where the visual classifier will look for items (A). We also apply background subtraction to the original image to remove detected items present around the hand (B), such as the objects remaining on the shelf.
3.5.1. Vision Event Pre-processing
Ideally, this step should only be comprised of Product Detection & Classification. However, visual object classifiers, such as Ren et al. (2015) and He et al. (2017), provide a set of (location, object class) for anything found on an image (i.e., they would also detect all products on the shelves). In order to focus just on the item that was picked, the Vision Event Preprocessing takes additional steps, as shown in Figure 2. On the one hand, it performs Human Pose Estimation, a popular research topic in the Computer Vision literature which tries to localize the joints of each person. There are many works in this domain, such as Newell et al. (2016), Wei et al. (2016), and Cao et al. (2017, 2018) which, through different approaches, are all quite mature and robust to varying lighting conditions, clothing and even substantial occlusion. On the other hand, leveraging the fact that cameras are stationary, Background Subtraction techniques, such as Guo et al. (2016) can be used to “hide” all the products that remain on the shelf and therefore focus the attention of the visual classifier only on the moving foreground, where it can find the item being taken or returned.
3.5.2. Product Detections' Spatial Selection
From the skeleton of the customers, the location of their wrists represents a simple-yet-effective attention mechanism: by ignoring any detections with centroids further away from the hand than a given threshold, FAIM eliminates most detections of the object classifier that do not correspond to the item the customer is picking or putting back. We call this threshold , for each camera c, and pick its value empirically based on the camera–shelf distance. This spatial selection can be very useful to complement Background Subtraction when there is more than one customer moving in the scene or when the customer interacting with the shelf has products on the other hand which they had previously picked.
3.6. Inventory Prior Knowledge
FAIM relies on three sources of information to produce an accurate estimate of what item was returned or taken from a shelf by a customer. In order to do so, the system needs to be informed about certain properties of each product. These models can be categorized based on the source of information they provide: item layout (product location), weight and appearance model.
3.6.1. Item Layout Model
Item layout is a mapping between each product and their—initial—location in the store. The granularity or resolution of this layout could dramatically vary due to different factors, such as store size, complexity of the layout or even time and cost associated with manual annotation. Let represent the set of products in the inventory and be any particular product (e.g., Scotch Brite sponge, Fabric Febreeze, etc.). In a generic way, item layout can be defined as a function that returns the set of products expected to be found at any query location. The resolution of the item layout can then be defined as the smallest change in location which yields a different value of l. Given the narrow width of our weight plates, the highest resolution considered in this paper is the plate level: we constrain the query location to a given shelf s and plate p such that l(·) can be rewritten as:
Where |ls, p| is the total number of items at plate p on shelf s. This way, we can simulate lower spatial resolutions by recording the item layout at virtual plates p′ that aggregate multiple real plates, e.g., (we call p′ a bin of width 3). We evaluate the impact of three different levels of item layout granularity—plate, half-shelf and shelf—in section 5.2. Throughout the paper, we will refer to the item layout model as:
3.6.2. Item Weight Model
In order to predict which product was picked, FAIM first needs to have some knowledge about the weight distribution of each product in the inventory, W(i). This one-time calibration step consists in weighing every item and then parameterizing the distribution, which can be approximated by a Gaussian distribution (characterized by its mean μ and standard deviation σ) as displayed in Figure 5. The item weight model is therefore just a list of μ and σ pairs:
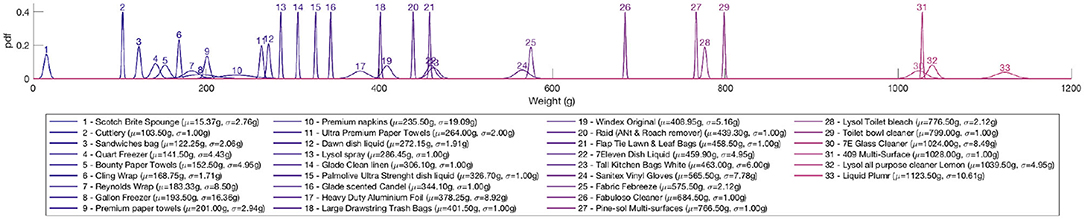
Figure 5. Weight distribution of each product used in our experiments.
Note that in general, most products have a fairly consistent weight distribution, thus once estimated, new items would not need to be weighed on restocking.
3.6.3. Item Appearance Model
There are many ways to encode a visual representation of each item, as discussed in section 2.2. Since the focus of this paper is on how to combine the different sources of information to produce an accurate product prediction and not in how to improve each source in particular, we follow state-of-the-art approaches for modeling the visual appearance. That way, FAIM is not constrained to a particular object detector and can directly benefit from any improvements in the state-of-the-art. Currently, the best visual identification results are obtained through two data-driven approaches: (1) using visual descriptors as defined by the MPEG-7 standards (Tyagi, 2017). This approach extracts contextual content associated with images, such as Color, Texture, Shape, Motion, and Location. It is most often applied in the domain of search engine for images; (2) Convolutional Neural Network (CNN) based models, such as the ones mentioned in section 2.2 (Girshick, 2015; Ren et al., 2015; Redmon et al., 2016; He et al., 2017). Either approach requires a large data collection process. We provide more details of our data generation, for both approaches, and training implementation of deep learning models to recognize different object classes—also known as instance segmentation—in section 5.1.
In this paper we applied both approaches. We trained a CNN and generated visual descriptors for all 33 products. We then used the visual descriptors to validate the training accuracy for similar looking products. To achieve this we've collected 20 s videos from multiple angles and distances of a single item of each product placed in a turntable. Then, we cropped the product using background subtraction. For each generated image we've extracted color (Manjunath et al., 2001), texture (Sandid and Douik, 2016) and shape descriptors (Bober, 2001). Through observation of the distribution of these descriptors we've noticed that each product produces, maximally, four clusters for a full 360° revolution of the product. Therefore, we've extracted the centroid of these clusters and used them to measure the mahalanobis distance between the centroids of each class (see Figure 6). We see that the products in our database are visually distinguishable from each other. This is natural as different brands continuously attempt to create their unique visual identity in order for consumers to easily pick out their products from all the similar competitors' products. Although this technique allows us to distinguish the object based on visual information, it is highly sensitive to occlusions. We therefore use this technique as an indicator of which objects are more similar to each other in order to then test and validate the performance of our trained CNN with those products.
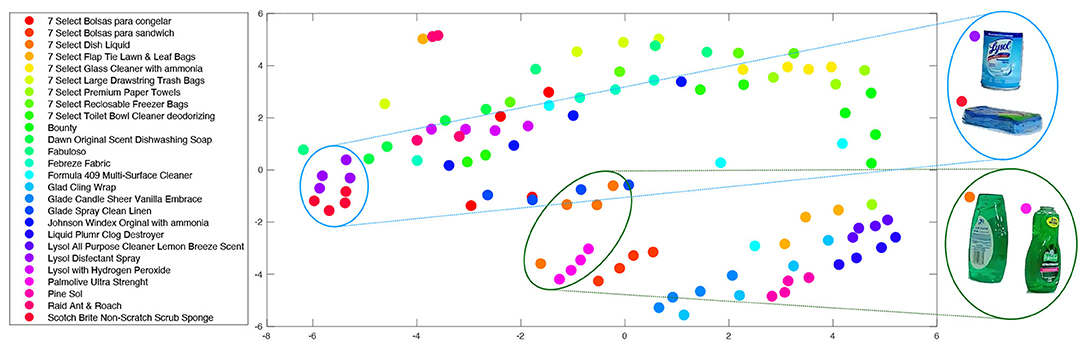
Figure 6. Dominant Color Descriptor distribution of each product trained in our model. Each dot represents a centroid of a cluster of dominant color descriptors obtained for different angles of each product. Statistical Neighboring Embedding was used to visualize the similarity between different products. Dots that are closer to each other represent products that are similar in dominant color. E.g., “Palmolive Ultra strength” and “7 Select Dish Liquid” seen on the right.
We've further used common data augmentation techniques and generated 30k multi-item images (like the ones on Figure 7D) for the network to learn a model of the visual appearance of each product.
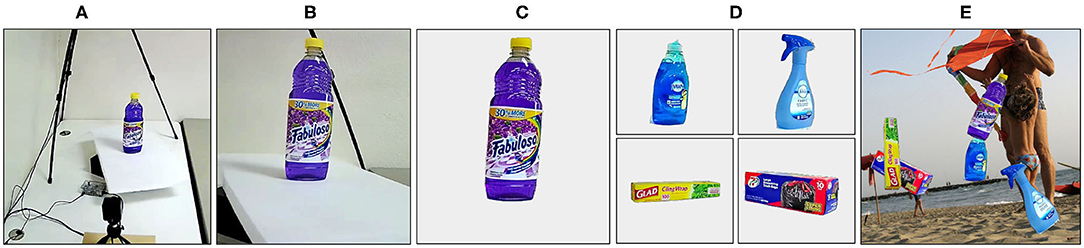
Figure 7. An example of the data generation for training. We collected videos of the items from three different angles shown in (A). (B) Illustrates the view from one of camera angles. From (B) we removed the background (C) and overlaid the multiple cropped objects (D) onto images from the COCO Dataset (Lin et al., 2014). Finally, a Faster R-CNN (Ren et al., 2015) model was trained with 30k images like (E).
4. Combining Location, Weight, and Vision
The previous section described the item layout, weight and appearance models that FAIM relies on. Here, we detail how each sensing modality estimates the likelihood of the item in the event belonging to each product class, by leveraging this inventory prior knowledge (sections 4.1–4.3), and how these sources of information are then all combined to emit the final product prediction (section 4.4).
In this paper P(I = i) is considered uniformly distributed, given that we have generated the receipts by picking randomly from each class of products, using a uniform distribution. However, this assumption can change if more information about which products are picked up more regularly is available. A better model of P(I = i) could provide better estimates of which product was picked.
4.1. Location-Based Item Identification
From the item layout model (, Equations 7 and 8) and the event location information (L = {ps}, Equation 5b), the Location-based Item Identification module estimates the likelihood of the item in the event belonging to each product class, . A simple approach would predict PL(I = i ∣ L) according to:
where indicates the number of different products stocked at the weight plates L = {ps}. Note that since a location L might be composed of multiple plates, we first need to take the union (Equation 10a). Then, any item in the resulting set would have equal probability of being picked, and any item outside of the event's location would be ignored.
However, such approach would be disregarding some useful information: some plates may have observed a much larger portion of the total weight change than others, and it is therefore more likely that the item comes from those particular plates. For this reason, FAIM uses a weight change-guided location-based item identification:
Where PL(I = i ∣ D) is computed by summing each plate's weight change, weighted by the amount each plate contributed to the total weight change of the shelf. We then use PL in our fusion computation, in section 4.4 to calculate the final product prediction.
4.2. Weight Change-Based Item Identification
Product prediction based on weight change is fairly straight-forward. The main idea is to estimate how close the event's weight change Δμ is to the distribution of each product, given by the item weight model. It is important to also account for the noise affecting the weight sensor readings, which is generally approximated by a normal distribution with zero mean and some standard deviation estimated empirically (σw = 5g in our experiments). We define then ΔM and ΔMm as random variables of the true weight displaced and the measured weight displaced in the event, respectively. And Δμ and Δμm as the values selected from these variables. Furthermore, the probability of Δμm given Δμ can be defined as a normal distribution, such that:
Then, using the Bayes's rule the probability of the item belonging to each product class is determined by:
where, in our experiments, P(I = i) is uniformly distributed and P(ΔMm = Δμm) is constant since we have the measurement. We obtain:
We include ΔM in the calculation of PW by marginalizing the joint conditional probability P(ΔMm = Δμm, ΔM = Δμ ∣ I = i), obtaining:
Given the chain rule:
We assume conditional independence of ΔMm and I given ΔM = Δμ, obtaining:
In Equation (17) the right side of the integral (fΔM∣I = i(Δμ)) follows Equation (9) and is therefore normally distributed given a particular i. In section 4.4 we combine Weight change-based Item Identification with Location-based Item identification by leveraging Equations (11)–(17).
4.3. Vision-Based Item Identification
While the Product Detections Spatial Selection module (section 3.5) already determines the set of detected objects with high probability of being on the customer's hands, these predictions need to be combined together—for all frames in the buffer—to output a single probability value for each product class. Unlike weight and location, which are very hard to occlude, visual classifiers often suffer from temporary occlusions—especially for smaller items or when customers carry multiple items in their hand. As a consequence, simply concatenating (i.e., multiplying) the logits (classification score) of all objects would lead to undesired results, since an item not detected in a frame would end with a probability of 0 regardless of how confident all other frames were. We instead propose using a noisy OR model, which in essence computes the probability PV(I = i) that each product was seen by taking the complement of the probability that the product was never seen. Mathematically, let represent the set of valid detections for the current event—output by the Product Detections Spatial Selection module—and vi ∈ [0, 1] the classification score for each product class , then:
This approach is also easy to extend to multi-camera deployments: given the detections of each camera , the overall probability .
4.4. Item Identification Combining All Sensing Modalities
FAIM's last stage of the pipeline fuses all sources of information to emit a final product prediction, and the one with the highest probability score will be selected. Following Bayesian inference, this fusion would be mathematically described as:
The main challenge in this sensor fusion arises from the difficulty of estimating the joint conditional probability , since the visual features and the weight change may not be conditionally independent on i. In this paper, we approximate this likelihood as a weighted linear combination of each individual sensor modality—weight and vision—prediction. We compute the probability that item i was picked up/put down, from the weight sensing modality, using:
Although ΔMm and D are not independent, they are however conditionally independent given I = i. This is true because once i is set, a product is selected. Thus, the location from where the product was taken is independent of its measured weight and vice-versa. We therefore obtain:
Using Bayes's Theorem for the conditional probabilities in Equation (21) we get:
As in our experiments P(I = i) is uniformly distributed and all terms in the first fraction are constant—given that we have the measurement taken Δμm and its weight distribution D. Equation (22) can therefore be combined with Equations (11)–(17), obtaining the following:
In general, information from weight modality (, i.e., Location- and Weight Change-based Item Identification) is a more robust product predictor—partially because it is less affected by occlusions, thus we assign it a higher relevance when alpha-blending (α = 0.7 gave us the best results). It is also worth noting that, as discussed in section 4.3, cameras can be occluded, lighting conditions may change, etc., therefore an object not being seen should not result in a final probability of 0. For these reasons, FAIM sums both modalities predictions instead of multiplying to fuse them. Furthermore, while our vision pipeline tries to ensure that only the item being picked or put back is seen by the Product Detection & Classification module, it may happen that several object detections get selected by the Product Detections Spatial Selection (e.g., when the customer has other items in their hand). In those cases, it doesn't make sense that probabilities add up to 1 (e.g., 25% confident that it saw four objects), but rather that each product was seen with probability 1. Consequently, FAIM does not normalize the vision product predictions before alpha blending. Therefore, Equation (19b) becomes:
where î* is the product predicted for the event.
5. Evaluation
This section presents our implementation of FAIM, the experimentation setup, the metrics used to evaluate the performance of different approaches, and the actual experiment results.
5.1. System Implementation
Our system utilizes a large array of weight and vision sensors. Below we describe the details about our hardware implementation and training procedure, followed by how the experiments were carried out and the evaluation metrics.
In order to understand the effect of having weight sensors at different spatial resolutions, we designed narrow (4″) weight plates which fit nicely on standard 48″ shelves used by many retailers. This allows us to simulate plates of different widths (which we call bins) and evaluate the bin size parameter.
For vision sensors, we utilized 720p IP cameras and wrote scripts to record all video and weight data to disk. Although we process the results offline, our algorithms run in real-time on a cluster of 3 Nvidia GeForce GTX 1080 GPUs for our vision pipeline—the computation required for the weight change- and location-based predictions is negligible.
As Figure 8 shows, in order to fully evaluate a real-world setup, we went to a local 7-Eleven convenience store, purchased all items on a fixture (Figure 8B) and arranged them in the same manner on our shelves (Figure 8A). In the process, we initialized our system by:
1. Weighed every item and fitted a Normal distribution to generate the item weight model (displayed on Figure 5).
2. Marked what items lie on what plates (e.g., 409 is stocked on plates 1 and 2 on shelf 1) to generate the item layout model.
3. Extracted general information descriptors from the frames collected for training of each product. Specifically Dominant Color Descriptor (DCD) (Talib et al., 2013) (displayed in Figure 6), Homogeneous Texture Descriptor (Sandid and Douik, 2016) and Region-based Shape Descriptor (RSD) (Kim and Kim, 2000). While these descriptors are not suited to distinguish the object during a pick-up/put-down, due to occlusions, they provide insights into the visual similarity of the products.
4. We replicated (Wei et al., 2019)'s approach for training the visual product recognition pipeline. While rotating 360° on a white turntable (facilitates background removal), three cameras at different angles and distances simultaneously recorded an item of each product class, placed on its back as well as front side. From those videos, the items could be segmented out and overlaid on top of random images in random positions, sizes, rotations, etc. (see Figure 7). We pre-trained a Faster R-CNN (Ren et al., 2015) model (using ResNet-50 and FPN) on (Wei et al., 2019)'s dataset, trimmed the last (classification) layer, changed the number of output classes to 33 + 1 (background) and trained on our dataset of 30k images generated from such cropped products.
5. Evaluated the item appearance model by collecting data on the most similar products guided by the product visual similarity obtained in Step 3.
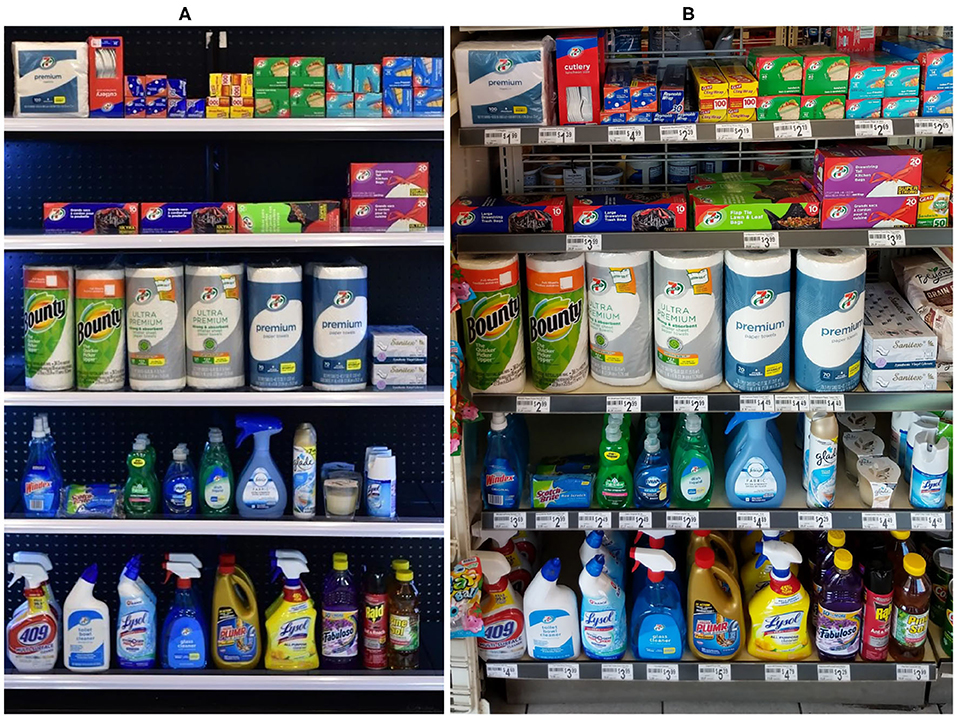
Figure 8. In order to follow a realistic item layout and understand potential failure cases in real deployments, we replicated (A) the layout of a 7-Eleven store (B).
5.1.1. Experiment Settings
We designed our experiments to try to simulate a real shopping experience where customers have a notion of what they want to purchase but may not know where items are located. Our eight participants had never seen this item layout and, at the beginning of each trial (five repetitions per person) they were given a randomly generated shopping list with 3–6 items (repetitions allowed). To incentivize the presence of some put back events, with 20% probability subjects were asked to return one of their items (without specifying where they should put it). Participants were instructed to leave the experiment area once they thought they had collected all items in their list. We set up the four cameras to cover the fixture (set of shelves) from all the main angles: top-down, in front and both sides, as shown in Figure 1.
5.1.2. Metrics
The main area this paper tackles is item identification. We define the average item identification accuracy, Avg. ID accuracy for short, as:
Its complement, the average identification error, can then be easily defined as:
It is worth noting that the whole framework relies on a successful event detection, that is, missing an event or detecting two consecutive events as a single event would have a direct negative impact in the identification accuracy. However, since event detection accuracy tends to be high and it is out of scope for this work, we focus on the evaluation of item identification (measured by the Avg. ID accuracy). In the next subsection, we analyze our experiment results and the dependency of FAIM's Avg. ID accuracy on different system parameters.
5.2. Real-World Experiments
In order to fully evaluate the system in a real-world setting, we conducted the “7-Eleven fixture” experiments described above, and present the results here. We want to understand how the resolution or amount of information on a given sensing modality affects the identification performance.
For weight sensing, one of the system parameters that impacts the spatial resolution is the bin width. As a reminder from Figure 1, we refer to a bin as a virtual plate that aggregates (sums) multiple real plates, where bin width indicates how many plates make up a bin. In Figure 9, we can see how location-based (PL, in light brown) item identification suffers the most as bins get wider—and therefore more items lie inside—dropping from 76.1% at bin width 1–11.9% when we only have one plate per shelf (bin width 12). On the other hand, weight change-based (PW, in orange) identification is independent on the bin width, since it only takes as input the total weight change on the whole shelf. Of course, some items are very close in weight to others (see Figure 5) so only relying on the absolute weight change yields an accuracy of 68.2%. By combining these two weight sensing-based sources of information (Pweight = PL · PW, in brown), the accuracy rises to 91.5% and the impact of larger bin widths is reduced, only dropping to 79.0% for bin width 12. Finally, as we investigate deeper below, fusing the weight with visual information (Pfusion, in blue) can bump the accuracy all the way to 93.2% for bin width 3 (slightly higher than bin width 1, and corresponds to the width of most of the items in the inventory).
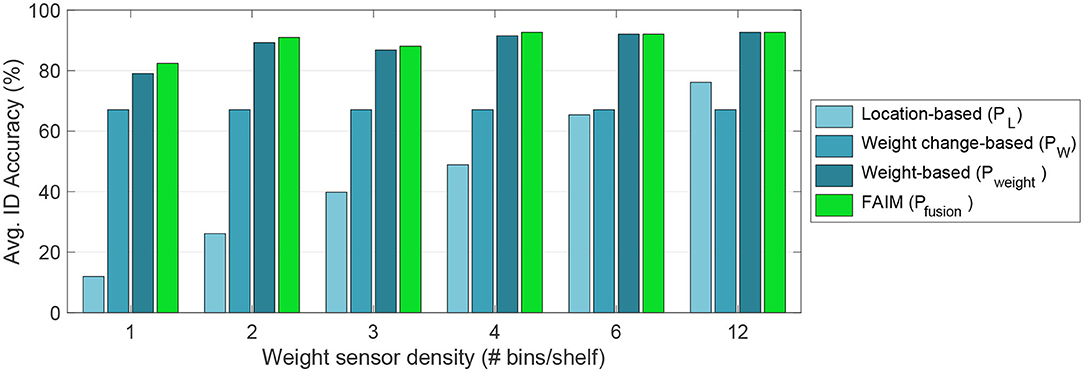
Figure 9. Item identification accuracy for weight sensor densities. As the weight sensor density increases (higher spatial resolution) performance—slowly—increases.
However, it isn't only bin width that affects weight-based predictions. The resolution of the item layout model, , can also significantly impact performance. As shown in Figure 10, we consider three different resolutions: plate-level ( contains which items could be located at each individual plate), half-shelf-level ( only records which items lie on the left 6 or right 6 plates of each shelf) and shelf-level ( only logs the product–shelf mappings). What we observe is that a half-shelf layout model is almost as good as the plate-level layout (90.9 vs. 92.0% for FAIM's fusion or 90.3 vs. 91.5% for weight-based), while requiring a lot less effort to generate and maintain. On the other hand, when the item layout resolution is at the shelf level, the accuracy drops to 80.1 and 79.0%, respectively, a likely unacceptable level for real deployments.
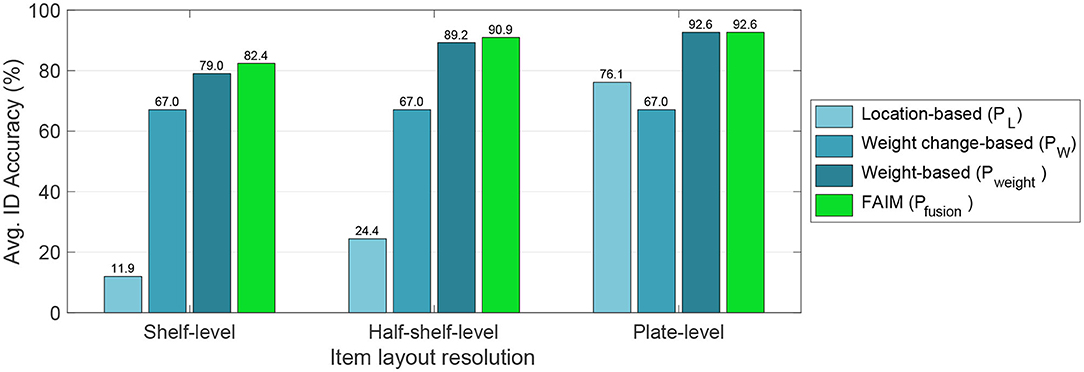
Figure 10. Item identification accuracy for different resolutions of item layout (i.e., how knowing what products are in each plate, in every half-shelf or only in every shelf affects performance). Half-shelf offers a great compromise between accuracy and hardware cost.
Figure 11 explores the benefits of using different amounts and combinations of cameras. For short, we refer to them as Left, Right, Top, and Back (their exact location with respect to the shelves can be seen in Figure 1). For this comparison, we use two different baselines for vision-based item identification:
(a) Simply taking the argmax on PV (dark red), which often contains multiple items with probability 1—and would report a lower accuracy.
(b) Thresholding on PV, e.g., considering an event was correctly identified as long as the ground-truth product had a 0.9 or higher visual score—which captures better whether vision would help the fusion or not.
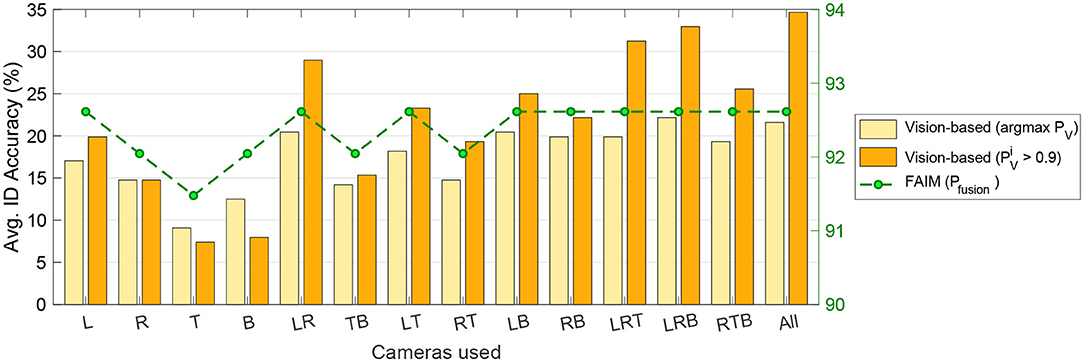
Figure 11. Item identification accuracy for different camera combinations [Left, Right, Top, Back (see Figure 1)]. With only Left+Right FAIM already achieves highest accuracy (92.6%).
From the results it is interesting to observe that just using Left and Right cameras already leads to the fusion scores up to 92.6%. It is also worth noting that the low vision-based accuracies reported here are a combination of multiple factors: the domain adaptation gap between the lighting and environmental conditions where the item appearance model was collected and the experiments were conducted, the imperfections on the background subtraction to crop the items and the difficulty of focusing the attention of the visual classifier on the item in the customer's hands, to name a few. But even with this room for improvement, FAIM's fusion approach still can extract useful visual information and achieve up to 3.4% higher accuracy than without cameras, which reduces error from 21 to 17.6% (Figure 12), a 19% reduction in error. Cameras contribute the most to the system when less sensors are used, or the knowledge of the item layout is reduced.
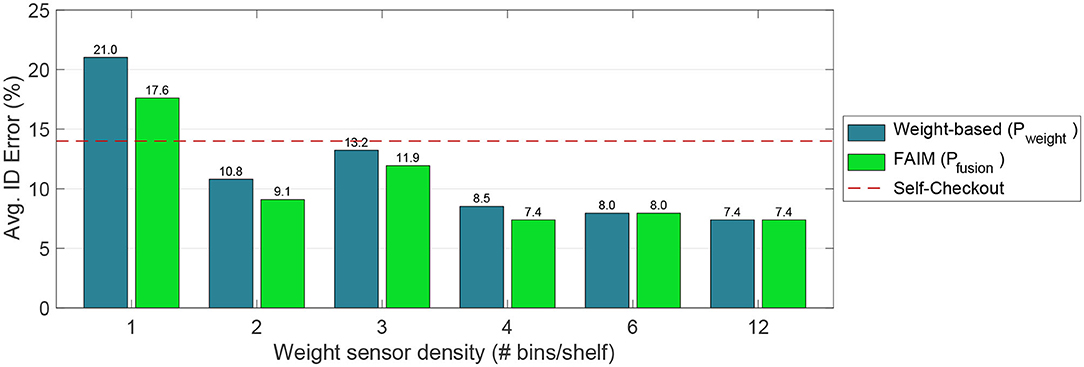
Figure 12. Item identification error for different bin widths. Note the reduction in error when vision assists weight (FAIM, beige, is consistently better than no fusion, green). Starting at 2 bins/shelf the Avg. ID Error is already smaller than Self-Checkout (Beck, 2011).
It is relevant to note that vision plays an important role as the weight sensor density and item layout resolution decrease. In other words, as the number of sensors, and the granularity of the knowledge of where the products are in the shelf, reduce, cameras compensate for the reduction in available information (see Figures 9, 10). 92.6% is also an improvement over the reported accuracy of current self-checkout systems, which can give results of only 86% (Beck, 2011) and still is widely used in retail stores.
In the real world there are other factors that contribute to the accuracy of FAIM, such as the number of people interacting simultaneously with the shelves or the density of item arrangement. Sensing signals obtained from pick ups or put downs of items in the shelves are affected by multiple people interacting simultaneously, this presents further challenges in the weight change detection module. To address this it is necessary to identify who is interacting with the shelf. This can be done with infrastructure sensing (Mirshekari et al., 2018), vision (Chen et al., 2020), or both. However, this stayed outside the scope of this paper, unfortunately due to COVID-19 it became impossible to conduct more experiments and collecting multiple people interacting simultaneously with a shelf. In our future work we intend to study the system performance in crowded scenarios and higher density stores to understand the reliability and deployability of such a system.
6. Conclusion
In this paper, we presented FAIM (Framework for Autonomous Inventory Monitoring) for cashier-less convenience stores. Utilizing weight difference, visual item recognition, and item layout (location) information, FAIM monitors products placed on or picked up from shelves without human-in-the-loop with up to 92.6% item identification accuracy, a 2 × reduction in error compared to the 86% accuracy reported for self-checkout stations. To the best of our knowledge, this is the first fully autonomous system that fuses multiple sensing modalities to identify what item(s) customers take, without relying on human-in-the-loop approaches, such as manual monitoring or Amazon Go systems.
Data Availability Statement
The raw data supporting the conclusions of this article will be made available by the authors, without undue reservation.
Ethics Statement
Ethical review and approval was not required for the study on human participants in accordance with the local legislation and institutional requirements. The patients/participants provided their written informed consent to participate in this study.
Author Contributions
JF and CR contributed to all aspects of the research, from problem definition, system and algorithm design, deployment, and data analysis through publication of the results. SP assisted with the algorithm design, data analysis, and publication of the results. HN and PZ both advised on the problem definition, data collection, deployment, data analysis, and publication for this work. All authors contributed to the article and approved the submitted version.
Conflict of Interest
The authors declare that the research was conducted in the absence of any commercial or financial relationships that could be construed as a potential conflict of interest.
Acknowledgments
The authors would like to thank AiFi Inc., especially Steve Gu, William Hendry, and Aiman Sokhal, for their help and support. This work was a continuation, by the same authors, of Ruiz et al. (2019a,b), which defines AIM3S (Autonomous Inventory Monitoring through Multi-Modal Sensing for Cashier-Less Convenience Stores). However, FAIM improves the methods to train and validate the CNN model (section 3.6.3), by using Visual Descriptors as defined by the MPEG-7 standards (Tyagi, 2017). Furthermore, this work improves the method from which to compute the Weight change-based Item Identification (section 4.2) and Location-based Item Identification (section 4.1).
References
Beck, A. (2011). Self-scan checkouts and retail loss: understanding the risk and minimising the threat. Secur. J. 24, 199–215. doi: 10.1057/sj.2011.13
Bober, M. (2001). Mpeg-7 visual shape descriptors. IEEE Trans. Circuits Syst. Video Technol. 11, 716–719. doi: 10.1109/76.927426
Bottani, E., Bertolini, M., Rizzi, A., and Romagnoli, G. (2017). Monitoring on-shelf availability, out-of-stock and product freshness through rfid in the fresh food supply chain. Int. J. RF Technol. 8, 33–55. doi: 10.3233/RFT-171780
Cao, Z., Hidalgo, G., Simon, T., Wei, S.-E., and Sheikh, Y. (2018). OpenPose: realtime multi-person 2D pose estimation using part affinity fields. arXiv 1812.08008.
Cao, Z., Simon, T., Wei, S.-E., and Sheikh, Y. (2017). “Realtime multi-person 2D pose estimation using part affinity fields,” in CVPR (Honolulu, HI). doi: 10.1109/CVPR.2017.143
Chen, L., Ai, H., Chen, R., Zhuang, Z., and Liu, S. (2020). “Cross-view tracking for multi-human 3D pose estimation at over 100 fps,” in Proceedings of the IEEE/CVF Conference on Computer Vision and Pattern Recognition (Virtual), 3279–3288. doi: 10.1109/CVPR42600.2020.00334
Coldewey (2019). Inside Amazon's Surveillance-Powered, No-Checkout Convenience Store. Virtual: TechCrunch.com. Available online at: https://techcrunch.com/2018/01/21/inside-amazons-surveillance-powered-no-checkout-convenience-store/ (accessed July 09, 2020).
de Boer, D. (2018). The impact of RFID-deployments on out-of-stocks in various apparel stores (Master's thesis), Delft University of Technology, Delft, Netherlands.
Duan, K., Bai, S., Xie, L., Qi, H., Huang, Q., and Tian, Q. (2019). “Centernet: keypoint triplets for object detection,” in The IEEE International Conference on Computer Vision (ICCV) (Seoul). doi: 10.1109/ICCV.2019.00667
Fronitasari, D., and Gunawan, D. (2017). “Palm vein recognition by using modified of local binary pattern (LBP) for extraction feature,” in 2017 15th International Conference on Quality in Research (QiR): International Symposium on Electrical and Computer Engineering (Bali: IEEE), 18–22. doi: 10.1109/QIR.2017.8168444
Girshick, R. (2015). “Fast R-CNN,” in Proceedings of the IEEE International Conference on Computer Vision (Santiago), 1440–1448. doi: 10.1109/ICCV.2015.169
Godlewski, P. (2010). Automated Inventory System and Method. San Jose, CA: U.S. Patent Office, US Patent 7,650,298.
Green, C. B. (2009). Weight Sensing Apparatus and Methods for Inventory Control. San Jose, CA: U.S. Patent Office, US Patent 7,518,068.
Gruen, T. W., Corsten, D. S., and Bharadwaj, S. (2002). Retail Out-of-Stocks: A Worldwide Examination of Extent, Causes and Consumer Responses. Washington, DC: Grocery Manufacturers of America.
Guo, L., Xu, D., and Qiang, Z. (2016). “Background subtraction using local SVD binary pattern,” in Proceedings of the IEEE Conference on Computer Vision and Pattern Recognition Workshops (Las Vegas, NV), 86–94. doi: 10.1109/CVPRW.2016.148
He, K., Gkioxari, G., Dollár, P., and Girshick, R. (2017). “Mask R-CNN,” in Proceedings of the IEEE International Conference on Computer Vision (Venice), 2961–2969. doi: 10.1109/ICCV.2017.322
Kamoda, R., Ueda, M., Funatomi, T., Iiyama, M., and Minoh, M. (2012). “Grocery re-identification using load balance feature on the shelf for monitoring grocery inventory,” in Computers Workshop (CwC) (Montpellie: Citeseer), 13.
Kim, W.-Y., and Kim, Y.-S. (2000). A region-based shape descriptor using zernike moments. Signal Process. Image Commun. 16, 95–102. doi: 10.1016/S0923-5965(00)00019-9
Klasson, M., Zhang, C., and Kjellström, H. (2019). “A hierarchical grocery store image dataset with visual and semantic labels,” in 2019 IEEE Winter Conference on Applications of Computer Vision (WACV) (Waikoloa Village, HI: IEEE), 491–500. doi: 10.1109/WACV.2019.00058
Kong, T., Sun, F., Liu, H., Jiang, Y., Li, L., and Shi, J. (2020). Foveabox: beyound anchor-based object detection. IEEE Trans. Image Process. 29, 7389–7398. doi: 10.1109/TIP.2020.3002345
Li, T., and Zhang, H. (2015). Information sharing in a supply chain with a make-to-stock manufacturer. Omega 50, 115–125. doi: 10.1016/j.omega.2014.08.001
Lin, T.-Y., Maire, M., Belongie, S., Hays, J., Perona, P., Ramanan, D., et al. (2014). “Microsoft coco: common objects in context,” in European Conference on Computer Vision (Zurich: Springer), 740–755. doi: 10.1007/978-3-319-10602-1_48
Liu, W., Liu, N., Yue, Y., Rao, J., Luo, C., Zhang, H., et al. (2018). A flexible and highly sensitive pressure sensor based on elastic carbon foam. J. Mater. Chem. C 6, 1451–1458. doi: 10.1039/C7TC05228F
López, G. L., Negrón, A. P. P., Jiménez, A. D. A., Rodríguez, J. R., and Paredes, R. I. (2017). Comparative analysis of shape descriptors for 3D objects. Multimed. Tools Appl. 76, 6993–7040. doi: 10.1007/s11042-016-3330-5
Loussaief, S., and Abdelkrim, A. (2018). “Deep learning vs. bag of features in machine learning for image classification,” in 2018 International Conference on Advanced Systems and Electric Technologies (IC_ASET) (Hammamet: IEEE), 6–10. doi: 10.1109/ASET.2018.8379825
Manjunath, B. S., Ohm, J.-R., Vasudevan, V. V., and Yamada, A. (2001). Color and texture descriptors. IEEE Trans. Circuits Syst. Video Technol. 11, 703–715. doi: 10.1109/76.927424
Metzger, C., Meyer, J., Fleisch, E., and Tröster, G. (2007). “Weight-sensitive foam to monitor product availability on retail shelves,” in International Conference on Pervasive Computing (Toronto, ON: Springer), 268–279. doi: 10.1007/978-3-540-72037-9_16
Mirshekari, M., Pan, S., Fagert, J., Schooler, E. M., Zhang, P., and Noh, H. Y. (2018). Occupant localization using footstep-induced structural vibration. Mech. Syst. Signal Process. 112, 77–97. doi: 10.1016/j.ymssp.2018.04.026
Misra, A., Subramaniam, V., and Lee, Y. (2019). SmrtFridge: Iot-Based, User Interaction-Driven Food Item & Quantity Sensing.
Moretti, E. d. A., Anholon, R., Rampasso, I. S., Silva, D., Santa-Eulalia, L. A., Igna′cio, P. S. d. A., et al. (2019). Main difficulties during rfid implementation: an exploratory factor analysis approach. Technol. Anal. Strat. Manage. 31, 943–956. doi: 10.1080/09537325.2019.1575351
Murao, K., Imai, J., Terada, T., and Tsukamoto, M. (2015). “Recognizing activities and identifying users based on tabletop activities with load cells,” in Proceedings of the 17th International Conference on Information Integration and Web-Based Applications & Services (Brussels: ACM), 39. doi: 10.1145/2837185.2837264
Murao, K., Imai, J., Terada, T., and Tsukamoto, M. (2017). Activity recognition and user identification based on tabletop activities with load cells. J. Inform. Process. 25, 59–66. doi: 10.2197/ipsjjip.25.59
Newell, A., Yang, K., and Deng, J. (2016). “Stacked hourglass networks for human pose estimation,” in European Conference on Computer Vision (Amsterdam: Springer), 483–499. doi: 10.1007/978-3-319-46484-8_29
O'Hara, S., and Draper, B. A. (2011). Introduction to the bag of features paradigm for image classification and retrieval. arXiv 1101.3354.
Qiao, S., Shen, W., Qiu, W., Liu, C., and Yuille, A. (2017). “Scalenet: guiding object proposal generation in supermarkets and beyond,” in Proceedings of the IEEE International Conference on Computer Vision (Venice), 1791–1800. doi: 10.1109/ICCV.2017.199
Recode (2019). Amazon's Store of the Future Has no Cashiers, But Humans Are Watching From Behind the Scenes, Virtual: vox.com. Available online at: https://www.vox.com/2017/1/6/14189880/amazon-go-convenience-store-computer-vision-humans (accessed July 09, 2020).
Redmon, J., Divvala, S., Girshick, R., and Farhadi, A. (2016). “You only look once: unified, real-time object detection,” in Proceedings of the IEEE Conference on Computer Vision and Pattern Recognition (Las Vegas, NV), 779–788. doi: 10.1109/CVPR.2016.91
Ren, S., He, K., Girshick, R., and Sun, J. (2015). “Faster R-CNN: towards real-time object detection with region proposal networks,” in Advances in Neural Information Processing Systems, eds C. Cortes, N. D. Lawrence, D. D. Lee, M. Sugiyama and R. Garnett (Montreal, QC: Curran Associates, Inc.), 91–99.
Rofouei, M., Xu, W., and Sarrafzadeh, M. (2010). “Computing with uncertainty in a smart textile surface for object recognition,” in 2010 IEEE Conference on Multisensor Fusion and Integration (Salt Lake City: IEEE), 174–179. doi: 10.1109/MFI.2010.5604473
Ruiz, C., Falcao, J., Pan, S., Noh, H. Y., and Zhang, P. (2019a). “Aim3s: autonomous inventory monitoring through multi-modal sensing for cashier-less convenience stores,” in Proceedings of the 6th ACM International Conference on Systems for Energy-Efficient Buildings, Cities, and Transportation (New York, NY), 135–144. doi: 10.1145/3360322.3360834
Ruiz, C., Falcao, J., Pan, S., Noh, H. Y., and Zhang, P. (2019b). “Autonomous inventory monitoring through multi-modal sensing (Aim3s) for cashier-less stores,” in Proceedings of the 6th ACM International Conference on Systems for Energy-Efficient Buildings, Cities, and Transportation (New York, NY), 395–396. doi: 10.1145/3360322.3361018
Ruiz, C., Falcao, J., and Zhang, P. (2019c). “Autotag: visual domain adaptation for autonomous retail stores through multi-modal sensing,” in Adjunct Proceedings of the 2019 ACM International Joint Conference on Pervasive and Ubiquitous Computing and Proceedings of the 2019 ACM International Symposium on Wearable Computers (London), 518–523. doi: 10.1145/3341162.3345604
Ruiz, C., Pan, S., Bannis, A., Chang, M.-P., Noh, H. Y., and Zhang, P. (2020). “Idiot: towards ubiquitous identification of iot devices through visual and inertial orientation matching during human activity,” in 2020 IEEE/ACM Fifth International Conference on Internet-of-Things Design and Implementation (IoTDI) (Sydney, NSW: IEEE), 40–52. doi: 10.1109/IoTDI49375.2020.00012
Sandid, F., and Douik, A. (2016). Robust color texture descriptor for material recognition. Pattern Recogn. Lett. 80, 15–23. doi: 10.1016/j.patrec.2016.05.010
Schmidt, A., Strohbach, M., Van Laerhoven, K., Friday, A., and Gellersen, H.-W. (2002). “Context acquisition based on load sensing,” in International Conference on Ubiquitous Computing (Sweden: Springer), 333–350. doi: 10.1007/3-540-45809-3_26
Srivastava, D., Bakthula, R., and Agarwal, S. (2019). Image classification using surf and bag of LBP features constructed by clustering with fixed centers. Multimed. Tools Appl. 78, 14129–14153. doi: 10.1007/s11042-018-6793-8
Talib, A., Mahmuddin, M., Husni, H., and George, L. E. (2013). A weighted dominant color descriptor for content-based image retrieval. J. Visual Commun. Image Represent. 24, 345–360. doi: 10.1016/j.jvcir.2013.01.007
Teng, E., Falcão, J. D., Huang, R., and Iannucci, B. (2018). “Clickbait: click-based accelerated incremental training of convolutional neural networks,” in 2018 IEEE Applied Imagery Pattern Recognition Workshop (AIPR) (Washington, DC: IEEE), 1–12. doi: 10.1109/AIPR.2018.8707375
Tonioni, A., Serro, E., and Di Stefano, L. (2018). A deep learning pipeline for product recognition in store shelves. arXiv 1810.01733. doi: 10.1109/IPAS.2018.8708890
Tyagi, V. (2017). “Mpeg-7: Multimedia content description standard,” in Content-Based Image Retrieval (Madurai: Springer), 85–100. doi: 10.1007/978-981-10-6759-4_5
Wang, C., Cheng, M., Sohel, F., Bennamoun, M., and Li, J. (2019). Normalnet: a voxel-based CNN for 3D object classification and retrieval. Neurocomputing 323, 139–147. doi: 10.1016/j.neucom.2018.09.075
Wei, S.-E., Ramakrishna, V., Kanade, T., and Sheikh, Y. (2016). “Convolutional pose machines,” in CVPR (Virtual). doi: 10.1109/CVPR.2016.511
Keywords: auto-checkout, product recognition, item identification, inventory monitoring, retail, sensor fusion, vision, weight
Citation: Falcão J, Ruiz C, Pan S, Noh HY and Zhang P (2020) FAIM: Vision and Weight Sensing Fusion Framework for Autonomous Inventory Monitoring in Convenience Stores. Front. Built Environ. 6:568372. doi: 10.3389/fbuil.2020.568372
Received: 01 June 2020; Accepted: 22 September 2020;
Published: 22 October 2020.
Edited by:
Dryver R. Huston, University of Vermont, United StatesReviewed by:
Jónatas Miguel De Almeida Valença, Investigação e Inovação em Engenharia Civil para a Sustentabilidade (CERIS), PortugalDonghyeon Ryu, New Mexico Institute of Mining and Technology, United States
Copyright © 2020 Falcão, Ruiz, Pan, Noh and Zhang. This is an open-access article distributed under the terms of the Creative Commons Attribution License (CC BY). The use, distribution or reproduction in other forums is permitted, provided the original author(s) and the copyright owner(s) are credited and that the original publication in this journal is cited, in accordance with accepted academic practice. No use, distribution or reproduction is permitted which does not comply with these terms.
*Correspondence: João Falcão, am9hb2RmQGNtdS5lZHU=