 Akira Kawai
 Izuru Takewaki
- Department of Architecture and Architectural Engineering, Graduate School of Engineering, Kyoto University, Kyoto, Japan
The critical response is investigated for a multi-story damped bilinear hysteretic shear building model under a multi impulse as a representative of long-period, long-duration earthquake ground motions. The critical response for an elastic–plastic single-degree-of-freedom (SDOF) model under a multi impulse was derived in previous papers. However, it is difficult to derive the critical response for a multi-degree-of-freedom (MDOF) model under a multi impulse because the phase lag among masses induces a complicated situation. In place of deriving an explicit critical response, a criterion on the criticality of the multi impulse for the elastic–plastic MDOF model is derived and the properties of the critical responses are clarified. In the analysis, a new concept of “Multi Impulse Pushover (MIP)” is introduced and the progressive performance evaluation for the increasing input level is conducted. The analysis of energy response (input energy, dissipated energy, etc.) and the comparison with the response to the corresponding sinusoidal wave are made to enhance the reliability and practicality of the proposed method using the multi impulse as a substitute of sinusoidal waves, which are representatives of long-period, long-duration earthquake ground motions.
Introduction
While near-fault ground motions with greater effect on building structures and infrastructure have been investigated extensively all over the world (Bertero et al., 1978; Mavroeidis et al., 2004; Kojima and Takewaki, 2015a), an interest in long-period and long-duration ground motions has not been so much. This is because such long-period and long-duration ground motions with high intensity occur very rarely and there are a few reports on recording such ground motions. A relatively short history of recording earthquake ground motions and constructing structures and infrastructure with long natural period may be another reason for such fact. The Mexico earthquake in 1985, the Tokachi-oki earthquake in 2003, the Chuetsu earthquake in 2004 and the Tohoku earthquake in 2011 are representatives of such rare ground motions. Damages and influences to building structures and infrastructure were reported, e.g., the Mexico earthquake (Beck and Hall, 1986), the Tokachi-oki earthquake in 2003 (Hatayama et al., 2004), the Chuetsu earthquake in 2004 (Furumura and Hayakawa, 2007), and the Tohoku earthquake in 2011 (Takewaki et al., 2011, 2013). In particular, a historical resonant response was recorded in a tall building over 250 m high in Osaka, Japan, during the 2011 Tohoku earthquake (Takewaki et al., 2011). Damage was concentrated to only non-structural elements, and no clear damage to structural components was observed. However, the occurrence of such phenomenon had never been predicted and the careful investigation is inevitable from the viewpoint of resilience of important structures against unpredictable risks (Takewaki et al., 2013). This incident clearly indicates the warning to the response of structures and infrastructure with long natural period under long-period and long-duration earthquake ground motions.
In the current code for ordinary buildings in earthquake-prone countries, limited plastic deformations are allowed for large earthquakes with small occurrence probability to expect the energy dissipation by structural members. To assure the seismic safety of these buildings, non-linear time-history response analysis is conducted. On the other hand, the closed-form or analytical expressions for the elastic–plastic responses to excitations equivalent to earthquake ground motions have been derived in the past only for the steady-state responses or transient responses to a simple harmonic wave (for example, Caughey, 1960a,b). Since the middle of the 20th century, in the seismic resistant design, the resonance phenomenon has been considered as a critical key issue in the damage analysis of structures and infrastructure. The resonant frequency should be analyzed for a specified input level by changing the input frequency parametrically in response to a harmonic wave (Caughey, 1960a,b; Iwan, 1961, 1965a,b). It is desirable that no computational iteration is needed in the analysis stage.
To respond to such complicated and tough problem, an innovative approach using impulses as inputs, i.e., the double impulse, was introduced by Kojima and Takewaki (2015a). The double impulse was introduced to characterize the fling-step ground motion. The magnitude was tuned with the corresponding sinusoidal wave, which is a representative of near-fault ground motions (Akehashi et al., 2018b,c). A closed-form formulation was proposed for calculating the maximum elastic–plastic response of an SDOF structure under the “critical double impulse.” It was demonstrated that, because only free vibration is induced under impulses, the energy balance theory at two key vibration states (maximum deformation state and maximum velocity state) enables one to derive an analytical expression. The accuracy of the proposed approach was investigated by comparing the derived expressions with the results of non-linear time-history response analysis to the corresponding one-cycle sine wave.
In a similar way, a long-period and long-duration ground motion can be treated appropriately by introducing the multi impulse (Kojima and Takewaki, 2015b; Akehashi et al., 2018a; Hayashi et al., 2018; Tamura et al., 2019). When using the multi impulse, the free vibration analysis can be conducted without specification of input frequency before the second impulse is applied. The analysis of the resonant case can be done utilizing an energy balance law without solving differential equations. The timing of the impulses can be obtained as the time with zero restoring force in the unloading process. To calculate the maximum elastic–plastic response after an impulse can be obtained by equating the initial kinetic energy to the combined elastic strain and hysteretic energies. This methodology can be used to determine the critical response only. However, its application to non-critical case is also possible with some modification (Homma et al., 2020). The critical resonant frequency can be found automatically for the gradually increasing input level of the multi impulse.
While the energy balance approach initiated by Kojima and Takewaki (2015a) can be applied only to SDOF models (for example, Tamura et al., 2018), Akehashi and Takewaki (2019) extended it to general multi-degree-of-freedom (MDOF) building models. Since the closed-form expressions are difficult for MDOF models due to the phase lag among masses, a criterion on the criticality of the input timing of the second impulse in the double impulse was derived and the critical response was computed by the time-history response analysis (free vibration). Furthermore, to clarify the elastic–plastic performance of MDOF models, an original procedure, called the Double Impulse Pushover (DIP), was introduced. DIP enables one to evaluate the critical performance of elastic–plastic MDOF models under resonant inputs.
Since the input energy by earthquakes is a global response parameter compared to local response parameters, e.g., displacement and acceleration, it is appropriate to capture and characterize the global response property of structures. For this purpose, many researchers tried to investigate the earthquake input energy to structures and infrastructure in the long history of earthquake-resistant design (e.g., Housner, 1959; Zahrah and Hall, 1984; Akiyama, 1985; Uang and Bertero, 1990; Léger and Dussault, 1992; Kuwamura et al., 1994; Ordaz et al., 2003; Takewaki, 2004a,b, 2005a,b, 2007a,b). In some earthquake-prone countries, the earthquake input energy has been employed as an earthquake input demand in the standard design code. Since the time-domain approach has several advantages, e.g., the availability in non-linear structures, the description of time-history response of the input energy, and the possibility of expressing the input energy rate, the earthquake input energy has usually been computed in the time domain. On the other hand, the time-domain approach is not necessarily appropriate under uncertainties (Takewaki, 2004a, 2005b) and the frequency-domain approach has been introduced (Lyon, 1975; Ordaz et al., 2003; Takewaki, 2004a,b, 2005a,b, 2007a,b). The frequency domain approach uses the Fourier amplitude spectrum of input ground accelerations and the time-invariant energy transfer functions of the structure.
In this paper, the critical response is investigated for a multi-story damped bilinear hysteretic shear building model under a multi impulse as a representative of long-period, long-duration earthquake ground motions. The critical response of an elastic–plastic SDOF model under a multi impulse was derived in the previous papers (Kojima and Takewaki, 2015b; Akehashi et al., 2018a; Hayashi et al., 2018; Tamura et al., 2019). However, it is difficult to derive an explicit critical response for a MDOF model under a multi impulse because the phase lag among masses induces a complicated situation. To overcome this difficulty, a new approach is devised based on a criterion on the criticality of the multi impulse for the elastic–plastic MDOF model and a new concept of “Multi Impulse Pushover (MIP)” is introduced.
Multi Impulse as Representative of Long-Period, Long-Duration Earthquake Ground Motion and Its Criticality
The acceleration of a multi impulse as a representative of long-period, long-duration ground motions can be expressed by
where VMI denotes the velocity except the first impulse, tj is the time interval between the jth impulse and (j+1)th impulse, NMI is the number of impulses, and δ(t) is the Dirac delta function. The amplitude of the first impulse is reduced, reflecting the reality as a ground motion. The multi impulse and the corresponding sinusoidal wave, introduced later, are shown in Figure 1. It is noted that the time intervals tj can change. Kojima and Takewaki (2015b) introduced “Input Sequence 2” and fixed the time intervals after the second impulse as a constant as shown in Figure 2. However, since the building model treated here is a MDOF, it is assumed that tj can change. While, in a SDOF model, the time intervals of impulses can be expressed explicitly by using the energy balance law, it is difficult in a MDOF model due to the phase lag of masses. To overcome this difficulty, Akehashi and Takewaki (2019) introduced a new criterion on the criticality of input timing and defined the critical timing as the time at which the energy input by the impulse is maximized. The procedure of computing the critical input timing of impulses is explained next.
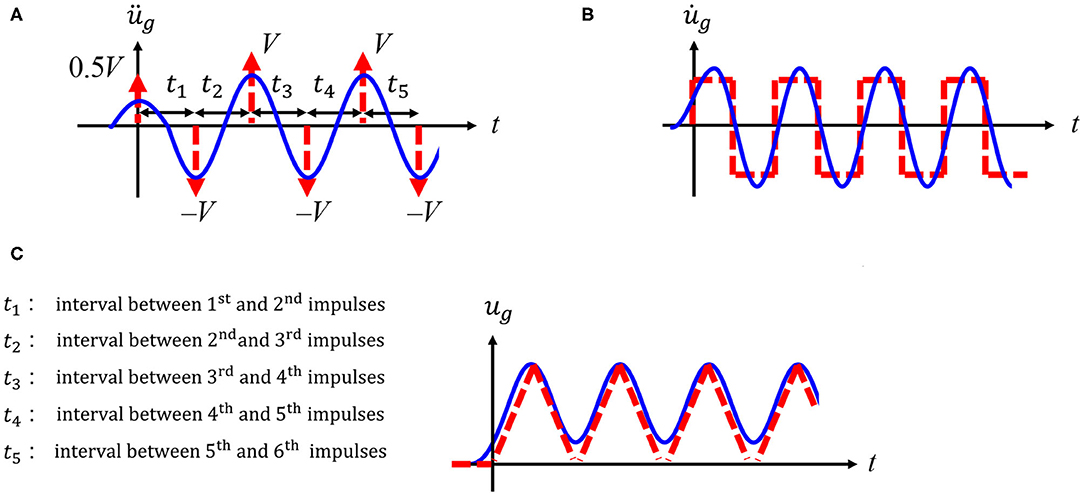
Figure 1. Multi impulse and corresponding sinusoidal wave. (A) Acceleration. (B) Velocity. (C) Displacement.
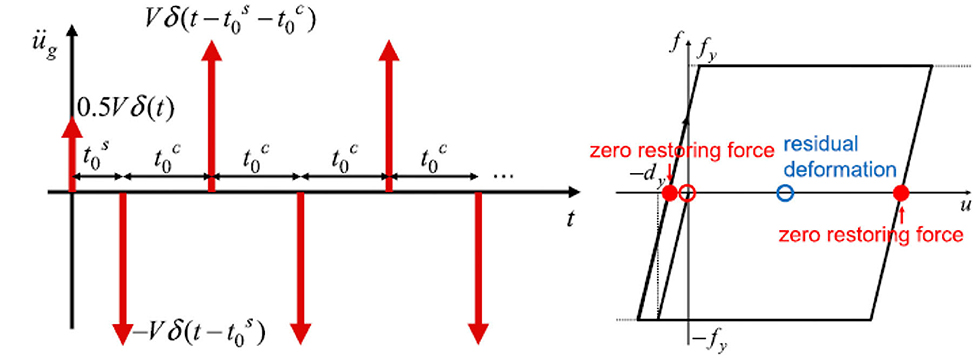
Figure 2. Critical multi impulse, Input Sequence 2, for SDOF model (Kojima and Takewaki, 2015b).
Consider an N-story damped bilinear hysteretic shear building model as shown in Figure 3. Let ui, mi, ci, fi denote the displacement, mass, damping coefficient, and the restoring force in the ith story. It should be kept in mind that only the mass velocities are changed by VMI and only the kinetic energies are changed just after the input of impulses. Therefore, the input energy by the jth impulse can be expressed by
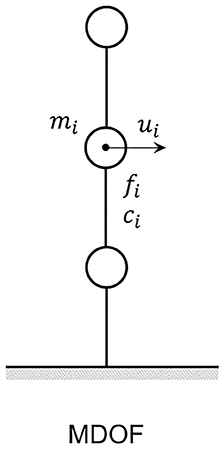
Figure 3. Multi-story damped bilinear hysteretic MDOF shear building model.
Since only the first term in Equation (2) depends on the velocities of masses, the necessary condition for the maximum energy input by the jth impulse can be described by . From the total equilibrium of the shear building model, holds. Let Tj denote the time when the first story shear force attains zero (F1 = 0). Using this notation, tj = Tj − Tj−1.
Figure 4 shows two examples (VMI/Vy = 2.0, 5.0) of the story shear force (restoring force + damping force)–interstory displacement relation in the first story together with the restoring force–interstory displacement relation for a 20-story shear building model treated later. Vy denotes the input velocity level of the multi impulse such that the maximum interstory drift angle of the model just attains the yield limit after 20 impulses. It can be observed that the impulses are input at the time when the story shear forces in the first story attain zero.
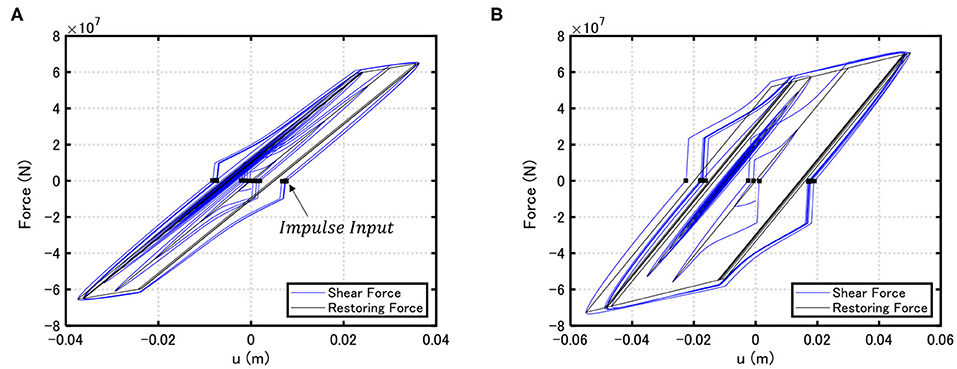
Figure 4. Story shear force–interstory drift relation in the first story [restoring force (black) and restroing force with damping force (blue)] for 20-story building model. (A) VMI/Vy = 2.0, (B) VMI/Vy = 5.0.
To demonstrate that the impulse timing determined above certainly maximizes the input energy, various timings are given in tj = 0.50[s] − 1.50[s] (e.g., t1 = 0.55[s], t2 = 0.69[s], t3 = 1.32[s], …). Figure 5 presents the relation of the accumulated input energy with the number of impulses for the critical case and non-critical case (right one) for Model 2 shown in the next section. Although an instantaneous input energy by an impulse is maximized in the criterion introduced in this paper, the accumulated quantity is shown in Figure 5 (right one). The energy response seems to be sensitive to the input timing at the critical timing. For this reason, the input energies for the critical timing and other timing appear disconnected in case of rather coarse candidates of timing. If more fine candidates of timing are used, more continuous plot will appear. This issue will be discussed in future work. For reference, the maximum interstory drift angles are also plotted (left one). It can be observed that, although the input energy is maximized by the critical input timing, the maximum interstory drift angles are not necessarily maximized by the critical timing defined in this paper. This phenomenon is remarkable as the input level becomes larger.
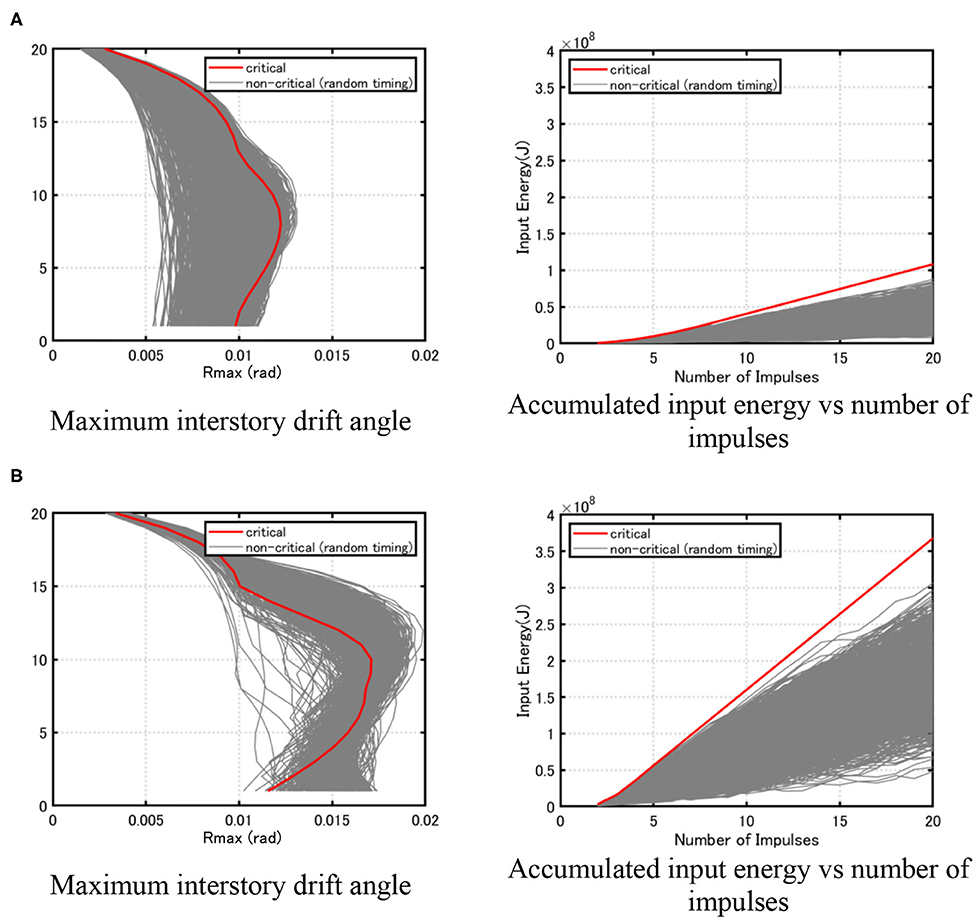
Figure 5. Maximum interstory drift angle distribution and accumulated input energy under critical input and various non-critical inputs for 20-story building model. (A) VMI/Vy = 2.0, (B) VMI/Vy = 5.0.
Multi-Story Damped Bilinear Hysteretic Shear Building Model
Consider three 20-story damped bilinear hysteretic shear building models that have different story shear stiffnesses. Model 1 has a uniform story stiffness distribution. Model 2 possesses a trapezoidal story stiffness distribution (ratio of the top to the bottom is 0.4). Model 3 is the model with an inverse triangular shape of the lowest eigenmode. The constant floor mass is 1.0 × 10⁶ (kg), the undamped fundamental natural period is 1.8 (s), and the lowest damping ratio is 0.01 (initial stiffness proportional). In addition, the common story height is 3.0 (m), the yield interstory drift angle is 0.01 (rad) and the ratio of the post-yield stiffness to the initial stiffness is 0.2. Figure 6 shows the first three eigenmodes multiplied by the participation factors for Models 1–3.
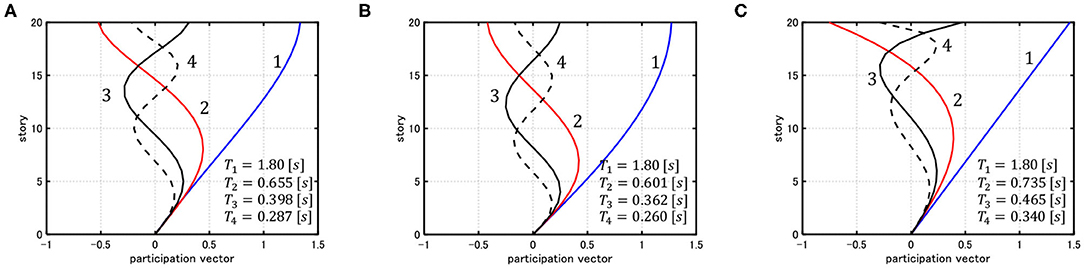
Figure 6. First three eigenmodes multiplied by participation factors for the 20-story building model. (A) Model 1, (B) Model 2, (C) Model 3.
Multi Impulse Pushover
Akehashi and Takewaki (2019) introduced a concept of “Double Impulse Pushover (DIP)” for a damped elastic–perfectly plastic MDOF shear building model. In the DIP, once the critical time interval between impulses in the double impulse is determined for an input level, the input level is increased a little bit and the new critical timing is determined. Then, this procedure is repeated. DIP is an extended version of “Incremental Dynamic Analysis (IDA)” due to Vamvatsikos and Cornell (2002). However, while IDA is conducted to a set of earthquake ground motions, DIP uses only the critical (worst) input resonant to the non-linear structures.
In this paper, DIP is extended to the multi impulse and the concept of “MIP” is newly defined. MIP is used for clarifying the properties of the critical non-linear responses of MDOF structures with respect to the increasing input level and providing useful information in determining the input level of the multi impulse for the design of MDOF structures.
Higher modes of some near-fault ground motions can play an important role on the non-linear dynamic response because a single dominant pulse can lead to non-conservative estimates of the maximum interstory drift (Lu and Panagiotou, 2013; Quaranta and Mollaioli, 2019). On the contrary, the present paper is treating the long-duration ground motion with a single mode, which can be well-simulated by the multi impulse and the sine wave. Even if the long-duration ground motion includes a single mode, the plastic response induces a higher-mode response (Akehashi and Takewaki, 2020). In order to respond to such complicated situation, the newly introduced MIP analysis can capture such peculiar response characteristics, e.g., the response amplification in restricted stories (lower, middle, and upper) as shown later in Figure 8.
Figure 7 shows the flowchart for the MIP analysis. It can be understood that the repetition is required only for the determination of convergence of the impulse interval, and this process is straightforward without any uncertain repetition. It should be remarked that, since the MIP analysis is general in the sense that the critical timing of impulses can be obtained by finding the time of zero first-story shear force through time-history response analysis, it can be applied to more complex building structures.
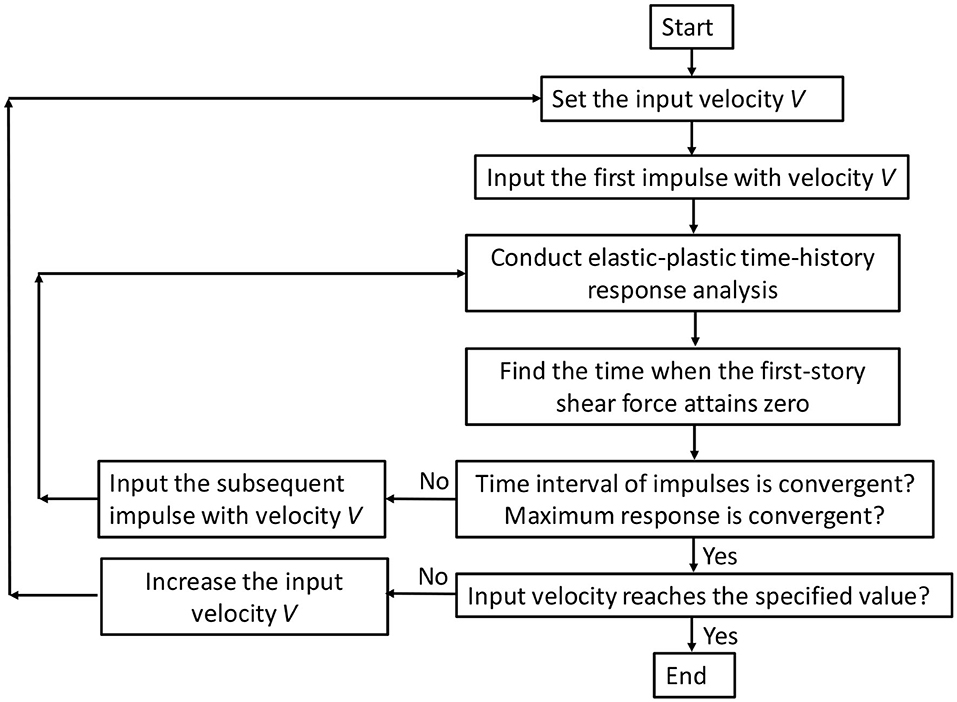
Figure 7. Flowchart for Multi Impulse Pushover (MIP) analysis.
Figure 8 presents the maximum interstory drift angles for MIP (NMI = 20) with VMI = 0.10 − 1.2 (m/s) [input level interval: 0.10 (m/s)]. For comparison, DIP with VDI = 0.10 − 1.2 (m/s) [input level interval: 0.10 (m/s)] is also conducted and shown in Figure 8, where VDI denotes the velocity amplitude of the double impulse. It can be seen that, while both responses in MIP and DIP analyses are different greatly in the small input level, those are similar in the large input level (although the upper-story distributions are different in Model 3). This may result from the fact that, while the resonance response amplification is remarkable in the elastic response range (small input level), this effect is small in the large plastic range (large input level).
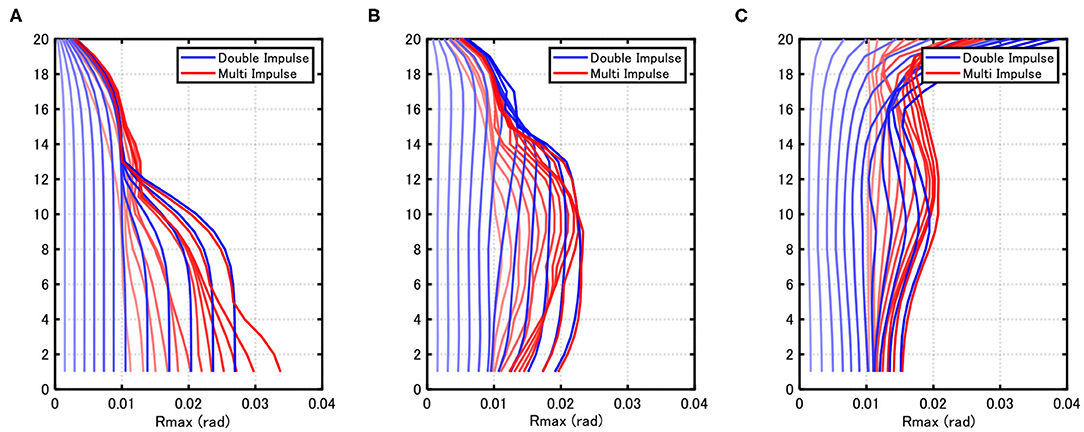
Figure 8. Maximum interstory drift angle distribution by DIP and MIP (V = 0.10–1.20 [m/s]). (A) Model 1, (B) Model 2, (C) Model 3.
Non-Linear Resonant Frequency of Multi Impulse and Energy Response Computation
In this section, the non-linear resonant frequency of the multi impulse is investigated and the energy response (input energy, dissipated energy, etc.) is discussed.
First of all, the effect of the number of impulses in the multi impulse on the convergence of impulse interval is analyzed. Based on the criterion on the criticality of impulse input timing, the impulse intervals were computed. Figure 9 shows the relation of the impulse interval with the impulse number. The input velocity levels were changed for VMI/Vy = 1–10 by interval = 1. It can be seen that NMI = 20 is sufficient for convergence independent of Models.
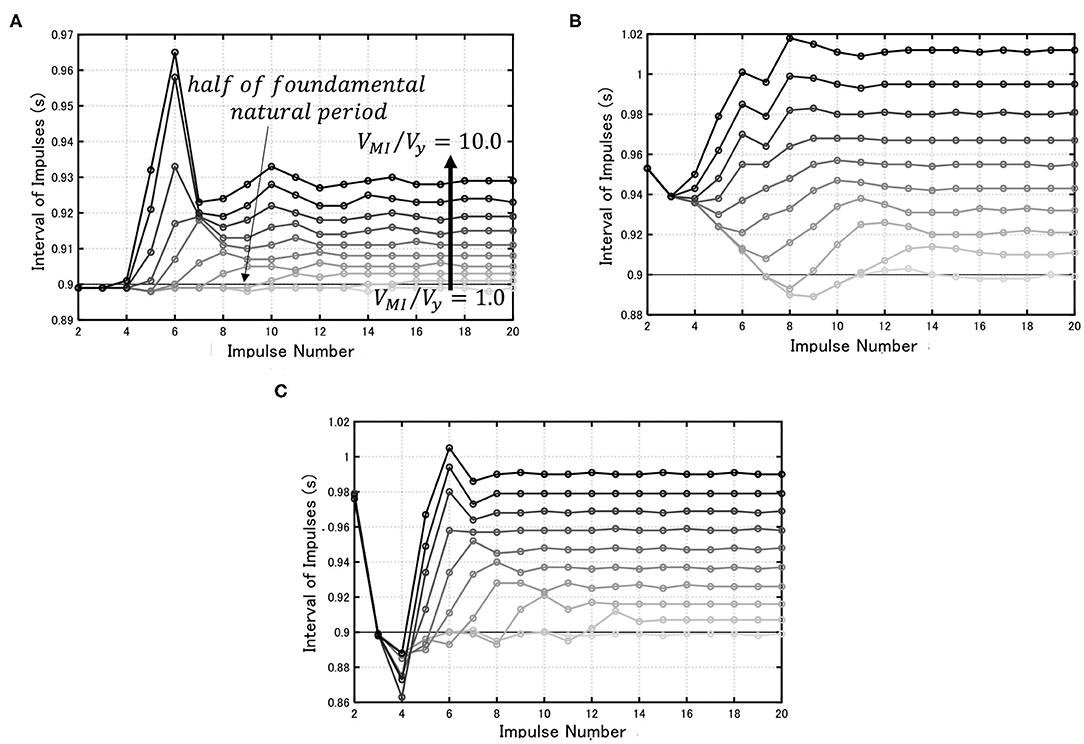
Figure 9. Impulse interval vs. impulse number for various input levels (VMI/Vy = 1–10 by the interval = 1). (A) Model 1, (B) Model 2, (C) Model 3.
Figure 10 illustrates the convergent input time interval tp with respect to input velocity level. It can be seen that, as the input level becomes larger, the plastic deformation increases and the resonant period is prolonged.
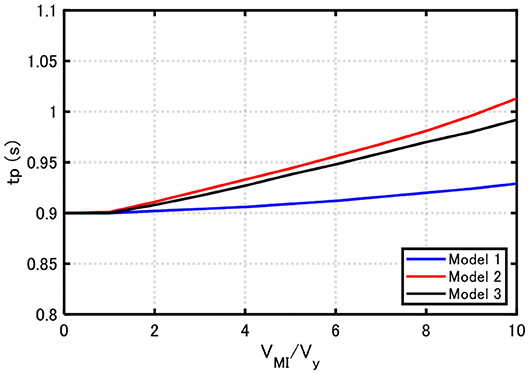
Figure 10. Critical input interval tp vs. input velocity level.
The convergence of response states can be confirmed from the viewpoint of the energy response. The energy balance equation can be expressed by
where [M] and [C] are the mass and damping matrices and {Q(t)} is the restoring force vectors. In addition, {u} = {ui} and {1} is the vector whose components are all 1. EI(t), EV(t), EC(t), EQ(t) are the total input energy, kinetic energy, accumulated damping dissipated energy, and accumulated hysteretic energy, respectively. In the jth time interval of the multi impulse, the increments of
can be expressed by
In the convergent steady state, and .
Figure 11 shows the energy response (increment) vs. impulse number. It can be understood that the convergence rate depends on the building model and NMI = 20 is required for sufficient convergence independent of the building model.
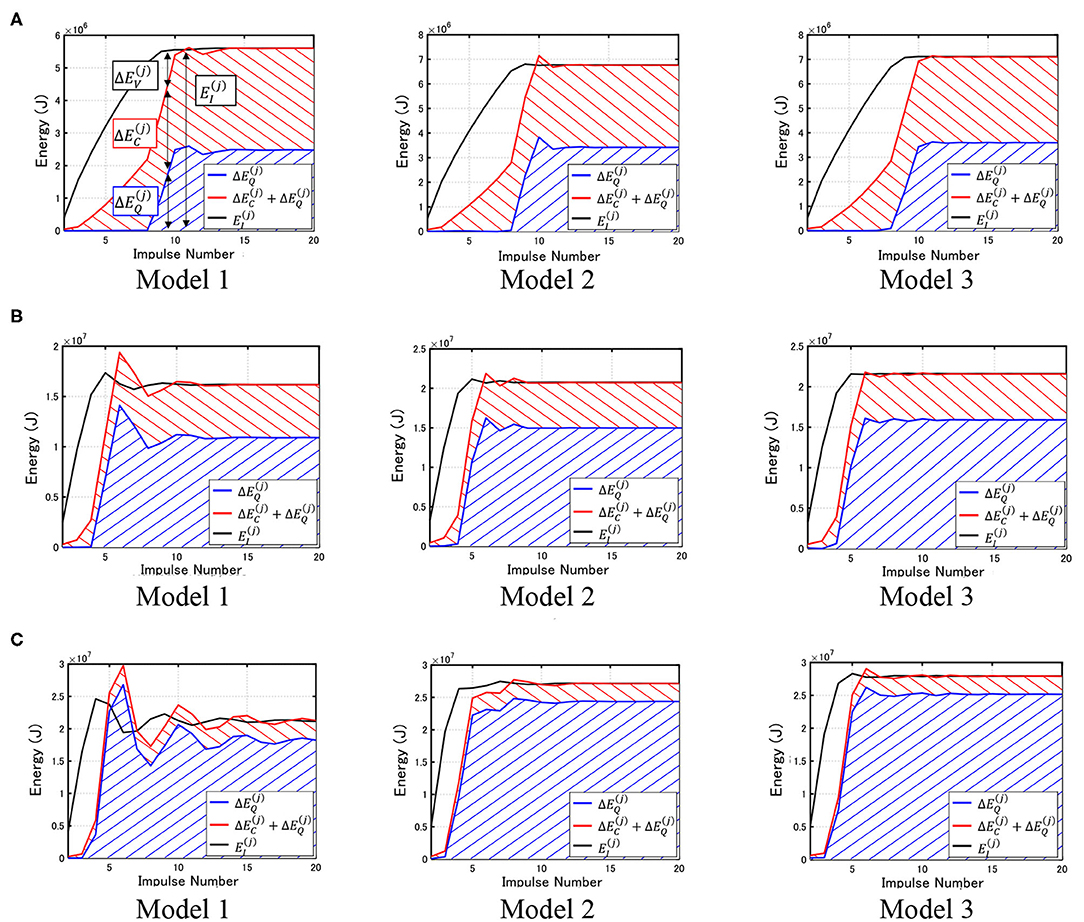
Figure 11. Energy response (increment) vs. impulse number. (A) VMI/Vy = 2.0, (B) VMI/Vy = 5.0, (C) VMI/Vy = 10.0.
Verification by Equivalent Sinusoidal Wave
To demonstrate the reliability and practicality of using the multi impulse, the comparison with the corresponding sinusoidal wave is investigated here and in the following sections.
The acceleration of the corresponding sinusoidal wave can be expressed by
The velocity amplitude VSIN can be related to the velocity amplitude of the multi impulse (Kojima and Takewaki, 2017).
In the present analysis, the velocity amplitude of the corresponding sinusoidal wave is amplified by 1.05. This is done so as to adjust the responses to both inputs in wider input levels (Kojima and Takewaki, 2017; Akehashi et al., 2018a).
Figure 12 shows the resonance curve of the total input energy El, the hysteretic energy EQ, and the damping energy EC for the elastic–plastic structures (Models 1, 2, and 3). The abscissa is the input period Tl of the multi impulse. The quantities in Figure 12 are normalized by . When the input velocity level VMI/Vy becomes large, the MDOF model exhibits a large plastic deformation. As seen in Figure 12, the energy dissipated by the plastic deformation is relatively large compared to the damping energy in the large input velocity level. It can also be observed that, as the input level increases, the peak value becomes smaller and the slender shape becomes another shape with small amplitude and wide range. It can also be seen that the peak period (resonant period) is prolonged a little bit as the input level increases. This investigation enables the understanding of robustness of input energies for variable frequencies of the input motion.
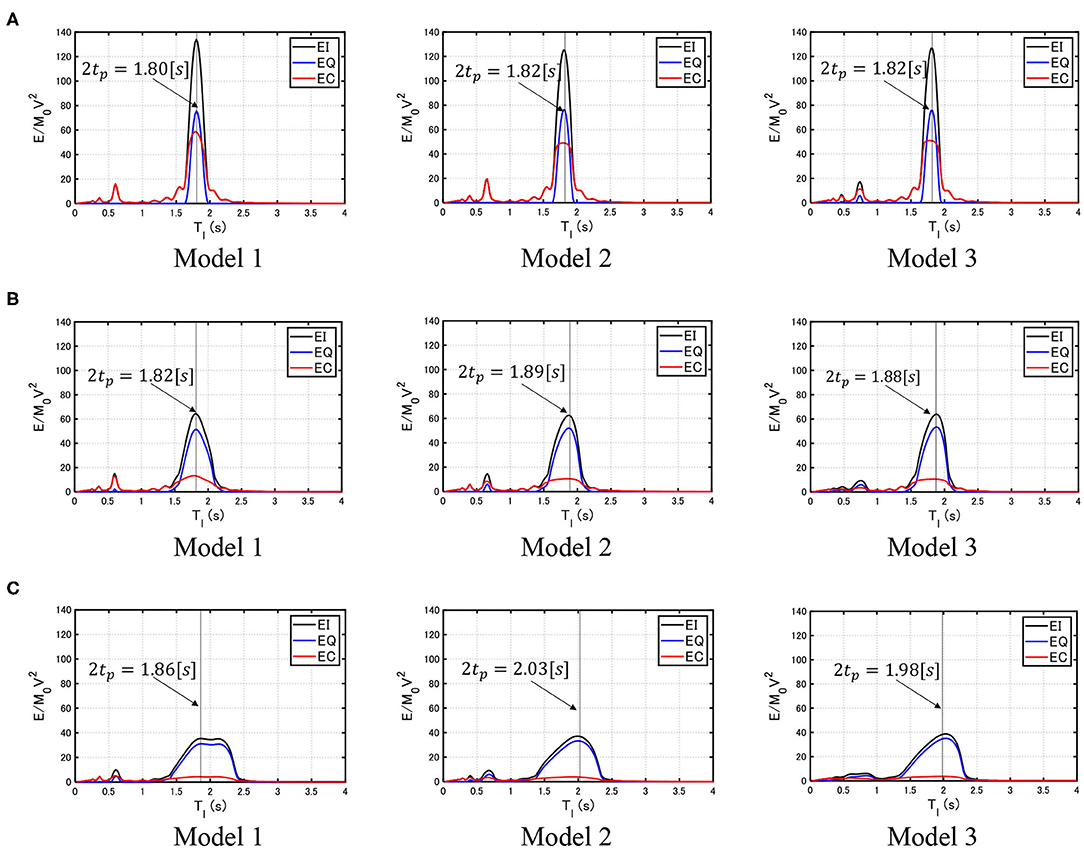
Figure 12. Resonance curve of total input energy, hysteretic energy, and damping energy for elastic–plastic structures. (A) VMI/Vy = 2.0, (B) VMI/Vy = 5.0, (C) VMI/Vy = 10.0.
Relation Between Input Level and Energy Response
The relation between the input level of the multi impulse and the energy response is discussed in this section.
Figure 13 shows the total input energy EI, the hysteretic energy EQ, and the damping energy EC of Models 1, 2, and 3 under the critical multi impulse and the corresponding sinusoidal wave. It should be noted that, since the critical input timing can be derived for the multi impulse without repetition, the approximate resonant period of the corresponding sinusoidal wave can be obtained without difficulty. If we do not use the multi impulse, we have to introduce an iterative procedure for the determination of the resonant period of the corresponding sinusoidal wave. It can be seen that Model 3 exhibits the largest values of the total input energy, the hysteretic energy, and the damping energy, Model 2 is the second, and Model 1 is the third. It can also be understood that the multi impulse exhibits a good correspondence with the corresponding sinusoidal wave. This means that the multi impulse enables the almost exact computation of those energies in place of the sinusoidal wave.
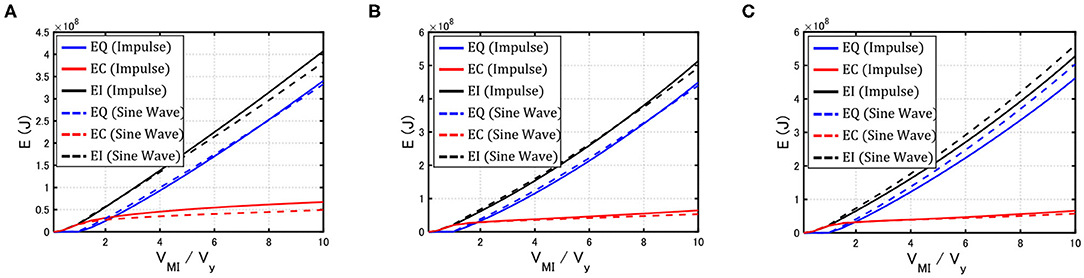
Figure 13. Total input energy, hysteretic energy, and damping energy of Models 1, 2, and 3 under critical multi impulse and corresponding sinusoidal wave. (A) Model 1, (B) Model 2, (C) Model 3.
For reference, the evaluation of the energy input to elastic structures in the frequency domain is shown here. The energy transfer function (Takewaki, 2004a,b), which is used for the computation of total input energy by integrating in the frequency domain after the multiplication with the input Fourier amplitude squared, is expressed by
where {HD(ω)} is the transfer function of horizontal displacement {u}, {1} is the influence coefficient vector with 1 in all components, and . By using the Fourier amplitude of Equation (1), the normalized input energy can be expressed by
where t0 is nearly a half of the fundamental natural period of the structure. Since the right-hand side is independent of the input level and constant, it can be understood that the input energy is proportional to the input velocity squared in the elastic range.
The normalized total input energy and damping energy can be expressed by
The detailed derivation of Equations (13), (15) is shown in Appendix 1. Equations (14) and (16) can also be derived in the same way. The coefficients a and b can be evaluated by conducting the elastic–plastic time-history response analysis for the model under the multi impulse with a predetermined input level (VMI/Vy = 5 in the following examples).
Figure 14 presents the comparison between the energy response (thin line) by the time-history response analysis and that (thick line) by the approximation explained just above (Equations 13–16) together with the energy response by the corresponding sine wave (time-history response analysis). The hysteretic energy was computed as the difference between the total input energy and the damping energy. A good correspondence can be observed with the approximation (Equations 13–16) and the corresponding sine wave. It should be noted that, in the previous research (Kojima and Takewaki, 2015b), it was found that the coefficient slightly larger than 1.0 was amplified for the sine wave for better response correspondence in a wider input level between the multi impulse and the sine wave after both the multi impulse and the sine wave were controlled so as to attain the same maximum Fourier amplitude (Fourier amplitude indicates the square root of “energy”). As a result, the input energy by the sine wave is larger by 1.1.
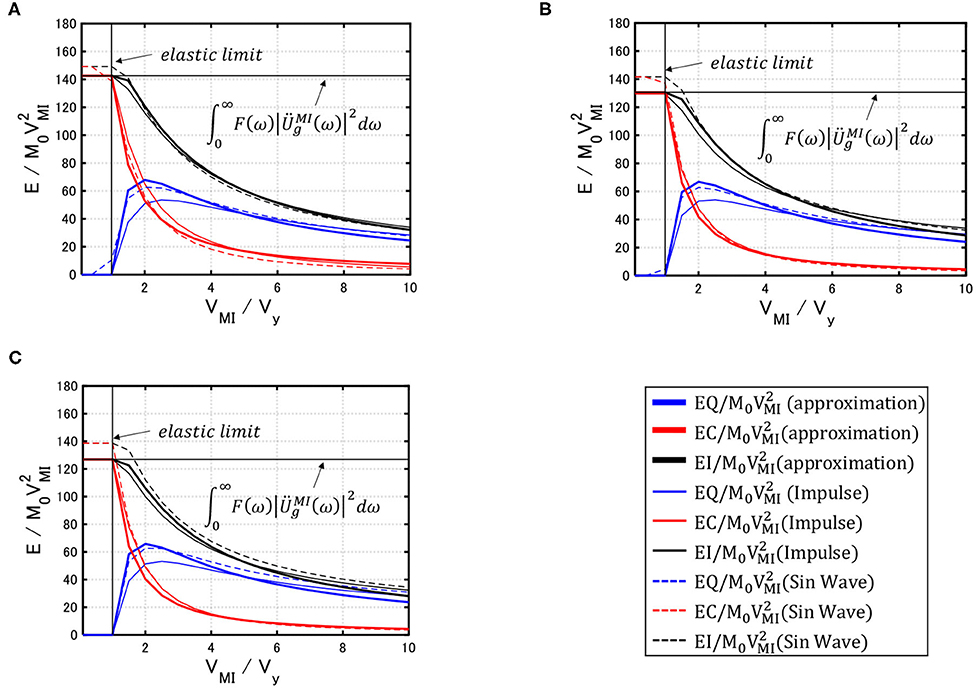
Figure 14. Comparison between energy response (thin line) by time-history response analysis and that (thick line) by approximation [Equations 13–16] together with energy response by the corresponding sine wave. (A) Model 1, (B) Model 2, (C) Model 3.
Influence of Structural Model Parameters on Energy Response
The influence of structural model parameters on the energy response is investigated in this section.
Figure 15 shows the influence of structural model parameters on the energy response (Model 3). In Figure 15A, the damping ratio was changed as h = 0.03, 0.05, and 0.10, and in Figure 15B, the post-yield stiffness ratio to the initial stiffness was varied as α = 0.0 (elastic–perfectly plastic), 0.40, and 0.60. In Figures 15A,B, the non-dimensional total input energies are shown for reference. As pointed out in the previous section, the coefficients a and b in Equations (15), (16) were obtained by conducting the elastic–plastic time-history response analysis for the model under the multi impulse with a certain input level (VMI/Vy = 5). It can be understood from Figure 13 that the relation of the total input energy with the input velocity level is linear in 1 ≤ VMI/Vy ≤ 5. In addition, the level VMI/Vy = 5 seems reasonable in a realistic situation of earthquake ground motions. For this reason, VMI/Vy = 5 was used in the determination of the coefficients a and b. Furthermore, the hysteretic energy was computed as the difference between the total input energy and the damping energy. It can be assured that the approximate evaluation of total input energies, hysteretic energies, and damping energies exhibits a fairly accurate result and those input energies for various input levels can be obtained without many time-history response analyses for various input levels. It can also be observed that, while the damping quantity reduces the total input energy, the hysteretic energy, and the damping energy greatly, the post-yield stiffness ratio does not affect those energies so much (although the hysteretic energy becomes larger slightly for the increasing post-yield stiffness ratio).
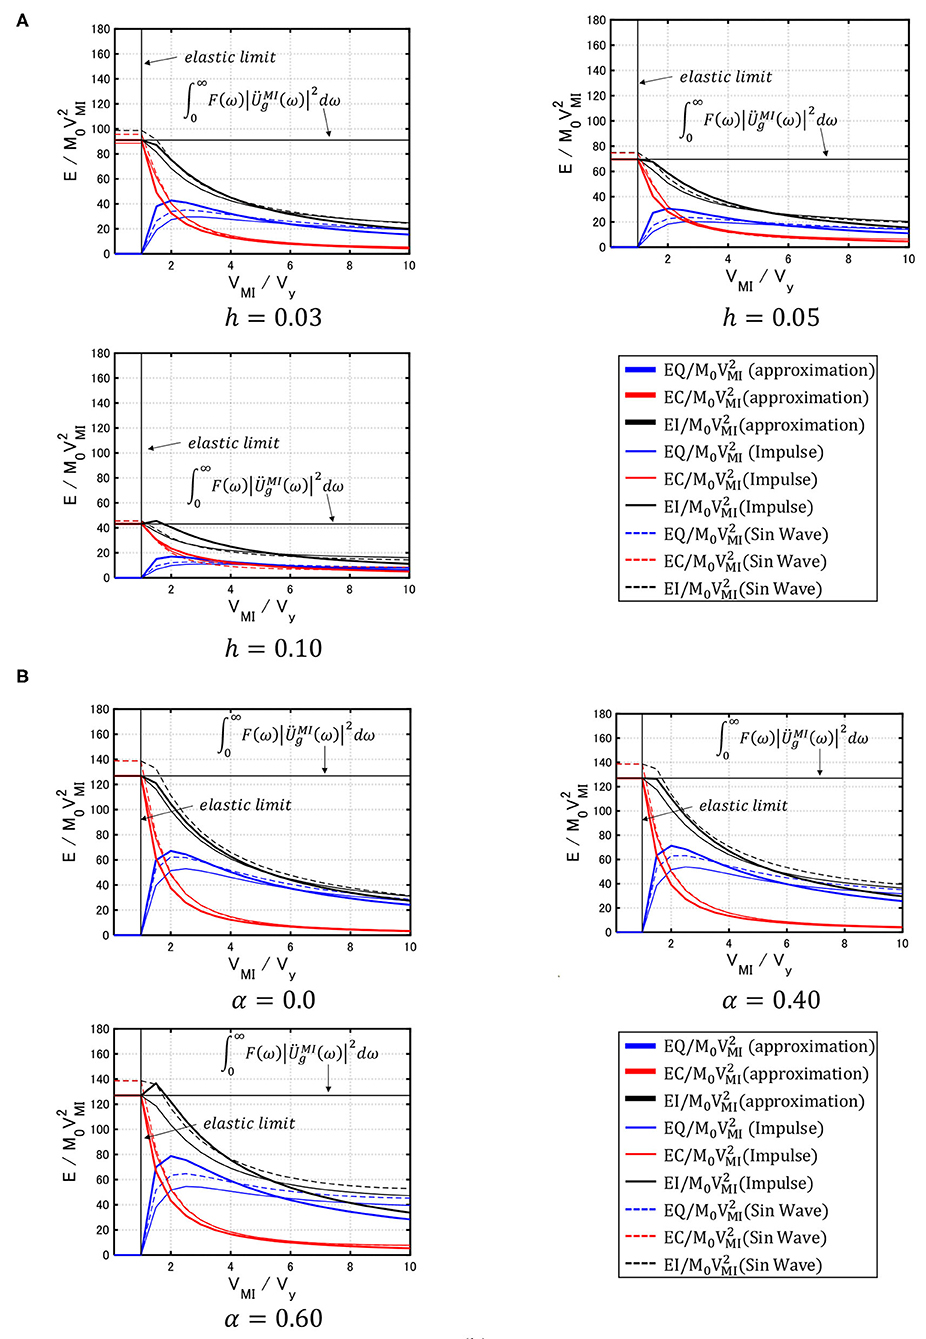
Figure 15. Influence of structural model parameters on energy response (Model 3). (A) Effect of damping ratio. (B) Effect of post-yield stiffness ratio.
Summaries and Conclusions
The critical response was investigated for a multi-story damped bilinear hysteretic shear building model under a multi impulse as a representative of long-period, long-duration earthquake ground motions. The critical response for an elastic–plastic SDOF model under a multi impulse was derived in the previous papers. However, it is difficult to derive an explicit critical response for a MDOF model under a multi impulse because the phase lag among masses induces a complicated situation. To overcome this difficulty, a new approach was devised based on a criterion on the criticality of input timing of the multi impulse for the elastic–plastic MDOF model and a new concept of “MIP” was introduced. Summaries and conclusions are as follows:
(1) The criterion on the criticality of input timing of the multi impulse for a damped bilinear hysteretic MDOF shear building model was derived, and the properties of the critical responses were clarified. The critical input timing of the multi impulse is the time at which the story shear force (sum of the restoring force and the damping force) in the first story attains zero in the unloading process.
(2) A new concept of “MIP” was introduced. In the MIP analysis, once the critical time interval between impulses in the multi impulse is determined for an input level based on the above-mentioned criterion on the criticality, the input level is increased gradually and a new critical timing is determined. Then, this procedure is repeated until the input level attains the specified level. The MIP enables the progressive performance evaluation for the increasing input level of the multi impulse.
(3) The analysis of energy response (input energy, dissipated energy, etc.) and the comparison with the response to the corresponding sinusoidal wave were made to enhance the reliability and practicality of the proposed method using the multi impulse as a substitute of sinusoidal waves, which are representatives of long-period, long-duration earthquake ground motions.
Data Availability Statement
The raw data supporting the conclusions of this article will be made available by the authors, without undue reservation.
Author Contributions
AK formulated the problem, conducted the computation, and wrote the paper. IT supervised the research and wrote the paper.
Funding
Part of the present work was supported by the Grant-in-Aid for Scientific Research (KAKENHI) of Japan Society for the Promotion of Science (No.18H01584). This support is greatly appreciated.
Conflict of Interest
The authors declare that the research was conducted in the absence of any commercial or financial relationships that could be construed as a potential conflict of interest.
References
Akehashi, H., Kojima, K., Farsangi, E. N., and Takewaki, I. (2018a). Critical response evaluation of damped bilinear hysteretic SDOF model under long duration ground motion simulated by multi impulse motion. Int. J. Earthquake Impact Eng. 2, 298–321. doi: 10.1504/IJEIE.2018.099361
Akehashi, H., Kojima, K., Fujita, K., and Takewaki, I. (2018c). Critical response of nonlinear base-isolated building considering soil-structure interaction under double impulse as substitute for near-fault ground motion. Front. Built Environ. 4:34. doi: 10.3389/fbuil.2018.00034
Akehashi, H., Kojima, K., and Takewaki, I. (2018b). Critical response of single-degree-of-freedom damped bilinear hysteretic system under double impulse as substitute for near-fault ground motion. Front. Built Environ. 4:5. doi: 10.3389/fbuil.2018.00005
Akehashi, H., and Takewaki, I. (2019). Optimal viscous damper placement for elastic-plastic mdof structures under critical double impulse. Front. Built Environ. 5:20. doi: 10.3389/fbuil.2019.00020
Akehashi, H., and Takewaki, I. (2020). Comparative investigation on optimal viscous damper placement for elastic-plastic MDOF structures: transfer function amplitude or double impulse. Soil Dyn. Earthquake Eng. 130:105987. doi: 10.1016/j.soildyn.2019.105987
Akiyama, H. (1985). Earthquake Resistant Limit-State Design for Buildings. Tokyo: University of Tokyo Press.
Beck, J. L., and Hall, J. F. (1986). Factors contributing to the catastrophe in Mexico City during the earthquake of September 19, 1985. Geophys. Res. Lett. 13, 593–596. doi: 10.1029/GL013i006p00593
Bertero, V. V., Mahin, S. A., and Herrera, R. A. (1978). Aseismic design implications of near-fault San Fernando earthquake records. Earthquake Eng. Struct. Dyn. 6, 31–42. doi: 10.1002/eqe.4290060105
Caughey, T. K. (1960a). Sinusoidal excitation of a system with bilinear hysteresis. J. Appl. Mech. 27, 640–643. doi: 10.1115/1.3644075
Caughey, T. K. (1960b). Random excitation of a system with bilinear hysteresis. J. Appl. Mech. 27, 649–652. doi: 10.1115/1.3644077
Furumura, T., and Hayakawa, T. (2007). Anomalous propagation of long-period ground motions recorded in Tokyo during the 23 October 2004 Mw 6.6 Niigata-ken Chuetsu, Japan, Earthquake. Bullet. Seismol. Soc. Am. 97, 863–880. doi: 10.1785/0120060166
Hatayama, K., Zama, S., Nishi, H., Yamada, M., Hirokawa, Y., and Inoue, R. (2004). Long-period strong ground motion and damage to oil storage tanks due to the 2003 Tokachi-oki earthquake. Jishin 57, 83–103. doi: 10.4294/zisin1948.57.2_83
Hayashi, K., Fujita, K., Tsuji, M., and Takewaki, I. (2018). A simple response evaluation method for base-isolation building-connection hybrid structural system under long-period and long-duration ground motion. Front. Built Environ. 4:2. doi: 10.3389/fbuil.2018.00002
Homma, S., Kojima, K., and Takewaki, I. (2020). General dynamic collapse criterion for elastic-plastic structures under double impulse as substitute of near-fault ground motion. Front. Built Environ. 6:84. doi: 10.3389/fbuil.2020.00084
Housner, G. W. (1959). Behavior of structures during earthquakes. J. Eng. Mech. Div. ASCE 85, 109–130.
Iwan, W. D. (1961). The dynamic response of bilinear hysteretic systems. (PhD .Thesis), California Institute of Technology.
Iwan, W. D. (1965a). The steady-state response of a two-degree-of-freedom bilinear hysteretic system. J. Appl. Mech. 32, 151–156. doi: 10.1115/1.3625711
Iwan, W. D. (1965b). “The dynamic response of the one-degree-of-freedom bilinear hysteretic system,” in Proceedings of the Third World Conference on Earthquake Engineering (Auckland).
Kojima, K., and Takewaki, I. (2015a). Critical earthquake response of elastic-plastic structures under near-fault ground motions (Part 1: Fling-step input). Front. Built Environ. 1:12. doi: 10.3389/fbuil.2015.00012
Kojima, K., and Takewaki, I. (2015b). Critical input and response of elastic-plastic structures under long-duration earthquake ground motions. Front. Built Environ. 1:15. doi: 10.3389/fbuil.2015.00015
Kojima, K., and Takewaki, I. (2017). Critical steady-state response of single-degree-of-freedom bilinear hysteretic system under multi impulse as substitute of long-duration ground motion. Front. Built Environ. 3:41. doi: 10.3389/fbuil.2017.00041
Kuwamura, H., Kirino, Y., and Akiyama, H. (1994). Prediction of earthquake energy input from smoothed Fourier amplitude spectrum. Earthquake Eng. Struct. Dyn. 23, 1125–1137. doi: 10.1002/eqe.4290231007
Léger, P., and Dussault, S. (1992). Seismic-energy dissipation in MDOF structures. J. Struct. Eng. ASCE 118, 1251–1269. doi: 10.1061/(ASCE)0733-9445(1992)118:5(1251)
Lu, Y., and Panagiotou, M. (2013). Characterization and representation of near-fault ground motions using cumulative pulse extraction with wavelet analysis. Bullet. Seismol. Soc. Am. 104, 410–426. doi: 10.1785/0120130031
Mavroeidis, G. P., Dong, G., and Papageorgiou, A. S. (2004). Near-fault ground motions, and the response of elastic and inelastic single-degree-freedom (SDOF) systems, Earthquake Eng. Struct. Dyn. 33, 1023–1049. doi: 10.1002/eqe.391
Ordaz, M., Huerta, B., and Reinoso, E. (2003). Exact computation of input-energy spectra from Fourier amplitude spectra. Earthquake Eng. Struct. Dyn. 32, 597–605. doi: 10.1002/eqe.240
Quaranta, G., and Mollaioli, F. (2019). Analysis of near-fault pulse-like seismic signals through variational mode decomposition technique. Eng. Struct. 193, 121–135. doi: 10.1016/j.engstruct.2019.05.003
Takewaki, I. (2004a). Bound of earthquake input energy. J. Struct. Eng. ASCE 130, 1289–1297. doi: 10.1061/(ASCE)0733-9445(2004)130:9(1289)
Takewaki, I. (2004b). Frequency domain modal analysis of earthquake input energy to highly damped passive control structures. Earthquake Eng. Struct. Dyn. 33:5. doi: 10.1002/eqe.361
Takewaki, I. (2005a). Frequency-domain analysis of earthquake input energy to structure-pile systems. Eng. Struct. 27, 549–563. doi: 10.1016/j.engstruct.2004.11.014
Takewaki, I. (2005b). Bound of earthquake input energy to soil-structure interaction systems. Soil Dyn. Earthquake Eng. 25, 741–752. doi: 10.1016/j.soildyn.2004.11.017
Takewaki, I. (2007a). Critical Excitation Methods in Earthquake Engineering. (Amsterdam: Elsevier). doi: 10.1016/B978-008045309-5/50013-3
Takewaki, I. (2007b). Earthquake input energy to two buildings connected by viscous dampers. J. Struct. Eng. ASCE. 133, 620–628. doi: 10.1061/(ASCE)0733-9445(2007)133:5(620)
Takewaki, I., and Fujita, K. (2009). Earthquake input energy to tall and base-isolated buildings in time and frequency dual domains. J. Struct. Design Tall Special Build. 18, 589–606. doi: 10.1002/tal.497
Takewaki, I., Murakami, S., Fujita, K., Yoshitomi, S., and Tsuji, M. (2011). The 2011 off the Pacific coast of Tohoku earthquake and response of high-rise buildings under long-period ground motions. Soil Dyn. Earthquake Eng. 31, 1511–1528. doi: 10.1016/j.soildyn.2011.06.001
Takewaki, I., Moustafa, A., and Fujita, K. (2013). Improving the Earthquake Resilience of Buildings: The Worst Case Approach. London, UK: Springer-Verlag. doi: 10.1007/978-1-4471-4144-0
Tamura, G., Kojima, K., Fujita, K., and Takewaki, I. (2018). Critical earthquake response of elastic-plastic structures with nonlinear viscous damping under double impulse as substitute for near-fault ground motion. J. Struct. Construct. Eng. 753, 1617–1627. doi: 10.3130/aijs.83.1617
Tamura, G., Kojima, K., and Takewaki, I. (2019). Critical response of elastic-plastic SDOF systems with nonlinear viscous damping under simulated earthquake ground motions. Heliyon 5:e01221. doi: 10.1016/j.heliyon.2019.e01221
Uang, C.-M., and Bertero, V. V. (1990). Evaluation of seismic energy in structures. Earthquake Eng. Struct. Dyn. 19, 77–90. doi: 10.1002/eqe.4290190108
Vamvatsikos, D., and Cornell, C. A. (2002). Incremental dynamic analysis. Earthquake Eng. Struct. Dyn. 31, 491–514. doi: 10.1002/eqe.141
Zahrah, T. F., and Hall, W. J. (1984). Earthquake energy absorption in SDOF structures. J. Struct. Eng. 110, 1757–1772. doi: 10.1061/(ASCE)0733-9445(1984)110:8(1757)
Appendix 1
Derivation of Approximate Energy Evaluation
The total input energy to the MDOF model in the elastic range (Takewaki and Fujita, 2009) can be expressed by
Based on the numerical investigation, let us assume that the total input energy in the elastic–plastic range can be expressed approximately as a linear function of VMI/Vy.
For VMI/Vy = 1 (elastic range), the following relation holds
From Equations (A2) and (A3), the total input energy can be expressed as
Let us introduce a new coefficient a defined by
Division of both sides of Equation (A4) by leads to
Keywords: critical response, bilinear hysteresis, multi-story building, multi impulse, long-duration motion, input energy
Citation: Kawai A and Takewaki I (2020) Critical Response of Multi-Story Damped Bilinear Hysteretic Shear Building Under Multi Impulse as Representative of Long-Period, Long-Duration Earthquake Ground Motions. Front. Built Environ. 6:588980. doi: 10.3389/fbuil.2020.588980
Received: 30 July 2020; Accepted: 03 September 2020;
Published: 09 October 2020.
Edited by:
Ehsan Noroozinejad Farsangi, Graduate University of Advanced Technology, IranCopyright © 2020 Kawai and Takewaki. This is an open-access article distributed under the terms of the Creative Commons Attribution License (CC BY). The use, distribution or reproduction in other forums is permitted, provided the original author(s) and the copyright owner(s) are credited and that the original publication in this journal is cited, in accordance with accepted academic practice. No use, distribution or reproduction is permitted which does not comply with these terms.
*Correspondence: Izuru Takewaki, dGFrZXdha2lAYXJjaGkua3lvdG8tdS5hYy5qcA==