 Jiaxiang Chen
 Michael Gianfelice
 Nicole Izukawa
 Ahmed Elshaer
 Haitham Aboshosha
- 1Civil Engineering Department, Ryerson University, Toronto, ON, Canada
- 2Civil Engineering Department, Lakehead University, Thunder Bay, ON, Canada
Rapid population growth and urbanization have led to the development of high-density and high-rise structures around the world. Tall structures in proximity can negatively affect pedestrian comfort by directing strong winds to the ground near the structure. Pedestrian level wind (PLW) may affect local businesses/services, pedestrian comfort and in extreme cases jeopardizes pedestrian safety. The downtown portion of the City of Toronto (∼10 km2) was chosen as the study region due to the recent development of many high-rise structures. The region was split into 10 zones and Computational Fluid Dynamics (CFD) was utilized to study the wind effects of the local building geometry and arrangements. Wind velocities were extracted from Computational Fluid Dynamics and coupled with historical meteorological data from Billy Bishop Airport. The coupled velocities from CFD were found to be within 20 and 5% RMSE, respectively, of the recorded data at the wind station for 85% of the sampled data. Wind velocities were then extracted at various elevations and coupled with meteorological weather data to generate real-time, historical, and statistical visualization of local wind fields. This study enables the prediction of real-time, historical, and statistical wind speeds, bearings at various elevations. Visualization of the flow field provides important insights for pedestrians, architects, engineers, and city planners regarding local wind speeds and identify problematic areas.
Introduction
Pedestrian Level Wind (PLW) typically refers to the wind speed at 1.5 m above the ground (i.e., typical pedestrian height). While temperature, humidity, clothing, solar radiation and exposure time are factors that affect pedestrian comfort (Soligo et al. (1998); Stathopoulos (2006)), this paper focuses purely on the magnitude of PLW wind velocity. People’s day-to-day activities and comfort can be affected by the magnitude of the PLW. For instance, a wind speed of up to 3.8m/s is considered the acceptable limit for standing, while a wind speed of 5.5 m/s is the limit for walking, running, or cycling. Wind speeds above these acceptable limits are likely to cause discomfort or unsafe conditions for pedestrians. A demonstration of this occurred in 1975 at Toronto’s Financial District, when rope lifelines had to be installed to aid pedestrians to walk in extremely windy conditions (Roberts, 2013). High wind velocities have large impacts on pedestrians and local businesses. Toronto city planner Jennifer Keesmat acknowledged that the city is aware of the issue in an article by Global News in 2014 and stated that the city was working on a solution; the same article reported complaints from local businesses regarding chairs and glasses being blown off by the high winds from tall structures, resulting in the closure of their patios. More recently, high-velocity winds in May 2018 caused property destruction, flying debris from high rise structures and downed powerlines in the city of Toronto. These hazards led to road closures which impacted businesses. Despite the precautions taken by the city, there were reports of 2 deaths and one injury caused by falling trees and downed powerlines during this strong wind event CBC News, 2018. Several incidents like these have driven engineers and policymakers to account for PLW when designing new buildings in urban areas.
Buildings are typically exposed to Boundary Layer (BL) wind, where the wind speed at the pedestrian level is less than that at higher altitudes. When a tall building is exposed to BL wind, high wind speeds at upper elevations are redirected downwards, this effect is known as “down washing” and is one of the main sources of pedestrian discomfort. Other effects, such as channelling and corner acceleration also contribute to pedestrian discomfort. This raises concerns for pedestrians in Toronto as the number of skyscrapers (i.e., buildings taller than 150 m) in the city is expected to increase by more than 30% within the next five years (Stevenson, 2019). As such, PLW studies have become commonly considered within the past few decades. The problem is when new buildings are constructed, previous PLW studies become invalid, as they do not account for new urban developments. Therefore, there is a need for continuous re-evaluation of PLW conditions corresponding to the continuous alteration of city topology (Adamek et al. (2017); Elshaer et al. (2017).
The studies relating to PLW typically consists of four subtypes: Wind comfort, Aerodynamics, CFD testing, and WT testing. Wind comfort is evaluated based on an established wind comfort criterion which generally consists of the wind speeds, temperatures, humidity, solar radiation, clothing and exposure times which may cause discomfort and/or danger to the pedestrian while performing various activities. Wind comfort criteria have been proposed within the past few decades including Davenport (1972), Gandemer (1975), Isyumov and Davenport (1975), Penwarden and Wise (1975), Hunt et al. (1976), Lawson (1978), Melbourne (1978) and Murakami et al. (1986). Since the proposed comfort indices showcased significant variations in standards of safety and parameters used, there has been a continuous debate about comfort criteria between researchers and practitioners. Williams et al. (1990), Ratcliff and Peterka (1990), Williams et al. (1992), Soligo et al. (1998), Bottema (2000), Koss (2006), and Sanz-Andres and Cuerva (2006) have analyzed and compared the established criteria to provide their input on determining “optimum” discomfort and danger thresholds that can be referenced and accepted globally. Janssen et al. (2013) compared several studies and established an overall PLW comfort index, which accounted for parameters like wind speed, temperature, and relative humidity.
The aerodynamic effect between building geometry (e.g., building corners, passage angles, and building separations) and PLW is an active field of research. Studies on this topic have been conducted by Aynsley et al. (1977), Gandemer (1978), Melaragno (1982), Stathopoulos and Wu (1995), Ferreira et al. (2002), Krautheim et al. (2014), Serteser and Karadaq (2018), Du and Mak (2018), and several others. Cochran (2004) analyzed these studies and investigated downward and horizontally accelerated flows and how they can be minimized using architectural massing alterations and landscaping modifications. Moreover, Stathopoulos and Storms (1986) carried out experiments in a boundary layer wind tunnel to investigate the channelling effect, which is the amplification of wind speed when passing between buildings at proximity, this study was performed with various building heights and wind directions to investigate the influence of these factors.
Computational Fluid Dynamics (CFD) has become extensively used in recent years for its ability to efficiently model new buildings and provide high-resolution data (i.e., data on all points of the computational domain). The scalability power of CFD elaborated its importance when comparing different wind comfort criteria. For instance, CFD-based studies have been conducted to study the wind flow around buildings by Hu and Wang (2005), Mochida and Lun (2008), Blocken et al. (2012), Mirzaei and Carmeliet (2013), Tominaga and Stathopoubs (2013), Ramponi et al. (2015), Adamek et al. (2017), Elshaer et al. (2017), Du and Mak (2018), Avini et al. (2019), Cui et al. (2019) and Weerasuriya et al. (2020). Many studies compared CFD results with Wind Tunnel (WT) data to evaluate the advantages and limitations of each method. For example, Yoshie et al. (2007) and Blocken and Stathopoulos (2013) discussed how CFD simulations allowed for larger computational domains, full-scale simulations, and more efficient changes to building designs. Adamek et al. (2017) utilized CFD and WT to study the development of pedestrian level wind in the financial district of the city of Toronto between 1940 and 2015. The study employed large eddy simulation with realistic BL and turbulence characteristics using the Consistent Discrete Random Flow Generator (CDRFG) inflow by Aboshosha et al. (2015), where the entire flow field was generated. The study was further validated using flow visualization techniques in WT and Water flume.
WT-based techniques have been the cornerstone of PLW studies before the utilization of CFD. The technique has been utilized by White (1992), Wu and Stathopoubs (1993), Kubota et al. (2008), Tsang et al. (2012), and Weerasuriya et al. (2018). White (1992) studied pedestrian-level winds in San Francisco, which coupled local meteorological data with wind-tunnel data and predicted full-scale wind speeds. Wu and Stathopoubs (1993) discussed wind-tunnel techniques to assess PLW. Discussions and comparisons were drawn for various techniques, point techniques such as thermal anemometry, pressure sensors, force indicators, laser doppler anemometry, area techniques such as erosion technique, surface-flow visualization and infrared thermography. Kubota et al. (2008) established the relationship between building density pedestrian level wind velocities. Weerasuriya et al. (2018) used WT techniques to simulate twisted winds affecting PLW in selected areas in Hong Kong. These tests often utilized probes placed at pedestrian height and around areas of interest (i.e., near the corner of buildings) along with the use of thermal anemometry, laser-doppler anemometry, particle-image velocimetry and infrared thermography, these techniques were used to visualize the wind field to understand potential problems and mitigation strategies, all of which contributed to WT-based techniques to analyze PLW effects.
Past studies such as Stathopoulos and Storms (1986), Tsang et al. (2012), Serteser and Karadaq, (2018), Du and Mak (2018), addressed wind effects around small number of buildings, while studies such as White (1992), Tominaga and Stathopoulos (2013) and Adamek et al. (2017) addressed PLW effects in a small area. The full list of discussed literature and briefs can be found in Table 1. There are four important points to note from existing studies: (I) The studies were limited in size due to the physical limitation of space in WT and the high computational requirement for high fidelity simulations using CFD. (II) Studies were often limited to ten wind directions, with a single meteorological data that does not change with real-time weather data. (III) The results from CFD were often compared with WT data but has not been compared with real-time field data. (IV) In most of these studies, the wind field was only reported at the pedestrian level height (i.e., 1.5 m), while information at other elevations may provide useful information for planning and preparation for major wind events. This study aims to address the aforementioned challenges by (I) Full-scale CFD simulation of Downtown Toronto by splitting the region into parts, the data is then combined using geo-spatial coordinates, (II) All simulations are conducted for 36 Wind directions, with the windspeeds related to the nearest airport weather station, thus the data can be scaled with real-time and historical data, (III) CFD results can be compared to local weather stations within the study zone and can be matched in real-time, and (IV) Results at various elevations can be extracted from CFD and presented. The results from this study will provide the public with hourly updated wind flow characteristics for a large section of downtown Toronto at the pedestrian level using CFD simulations combined with meteorological data. To the author’s knowledge, this type of pedestrian wind map has not been built and published before, the developed technique is novel and provides value for both the scientific community and the local populace. It is also important to reiterate that Toronto is a major city that is developing rapidly. Downtown Toronto is a densely populated area with many operating businesses and headquarters. It is therefore expected that the number of skyscrapers will increase to meet this demand. As a result of this density, there exists complex aerodynamics which will highlight the accuracy and applicability of the developed technique. Additionally, validation data from nearby weather stations that are immersed in the dense urban terrain are available. This eliminates the need to use typical wind stations as validation which are sited at airports and have not been affected by the complex aerodynamics. The qualitative nature of this research allows both non-experts and experts to understand the relationship between buildings and wind and the impacts it has on PLW at a given time. The manuscript for the study is divided into five sections. Introduction (this section) presents an introduction to PLW, a review of the literature, and the layout of the manuscript. Terrain Effect and Climate describes the procedure of considering climate and terrain effects. CFD Model focuses on the CFD modeling used to evaluate the aerodynamic wind data at the zones of interest. Linking Climates With the CFD Data and Experimental Validation focus on the integration of the CFD results with the climate data and the validation of the developed model, respectively. Sample Results and Utilization presents sample results for the city of Toronto and the resulting data. Conclusions and recommendations are given in Conclusion and Future Work.
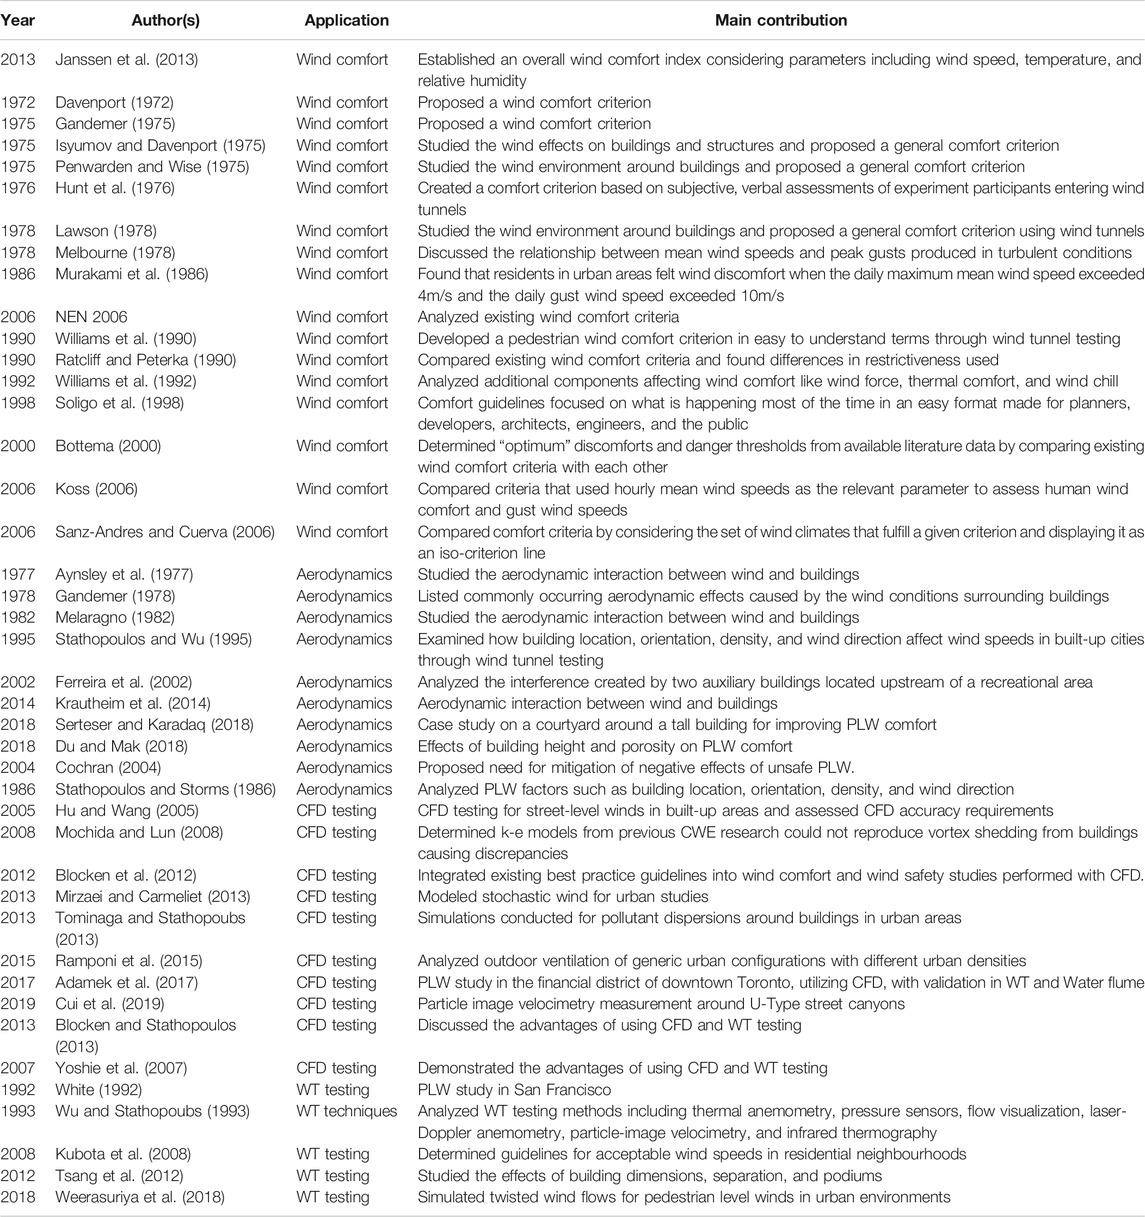
TABLE 1. Summary of previous studies.
Terrain Effect and Climate
The study area within Downtown Toronto was chosen based on population density and the presence of a large number of high-rise structures. Figure 1 highlights a plan view of the study area, located in Toronto, Ontario Canada. Terrain and building geometry in the study area were extracted from the publicly available data at the city of Toronto Urban Planning Department (Toronto City Planning, 2018). The data was available in the form of “tiles” which consists of a rectangular region (∼0.5–1 km2). The Alan G. Davenport wind loading chain was used as a reference for the evaluation of climate, surrounding terrain and aerodynamic effects, the criterion for pedestrian level wind is the hourly mean wind speeds evaluated as discussed in Introduction.
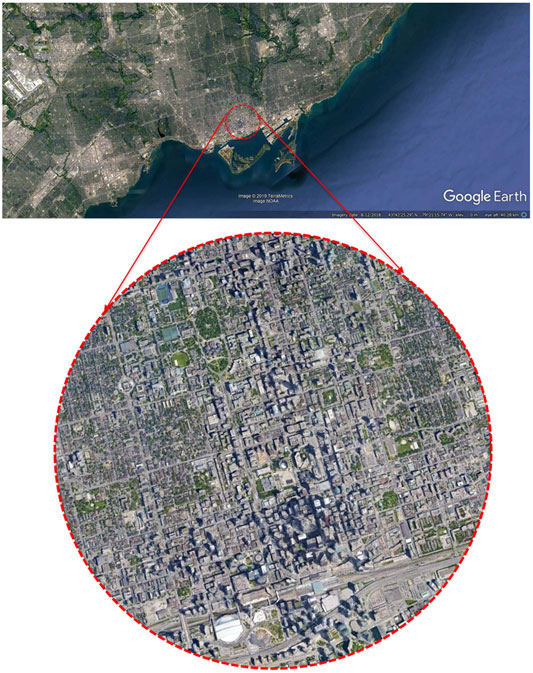
FIGURE 1. Selected study area (Google, 2019).
The metrology station located at “Billy Bishop Airport (YTZ)” was selected to obtain the required meteorological data, as it is considered the closest wind station to the study area. Climate data in terms of mean/gust wind speeds at 10 m height, as well as mean wind directions, are provided for every hour. To account for the terrain effect, it is vital to identify wind boundary layer profiles for wind from different angles of attack (AOA) at each tile, which was conducted using the engineering sciences data unit spreadsheet (ESDU).
To generate wind profiles for all tiles used in this study, an ESDU (2010) spreadsheet was used based on the Deaves and Harris atmospheric boundary layer model (1978). This model estimates the variation of wind speed as a function of height by accounting for terrain roughness changes between target and reference sites. The reference site here was selected to be the YTZ metrology station while the target site was the center of the tile of interest (i.e., 10 target sites). The inputs of the spreadsheet are the wind speed at a selected height at the reference site (chosen as 500m) and the upstream roughness conditions for both the reference and target sites at various wind AOA. These upstream roughness conditions were estimated for every 10° AOA to cover the entire 360° range. For consistency, a constant wind speed of 20m/s at 500mat YTZ was chosen for all CFD simulations in this study. However, this wind speed requires a scaling factor (
The upstream terrain roughness patches were identified as shown in Figure 2, which is a measure of the terrain roughness and may be used to estimate wind profiles. Typical zR0R values for open, suburban, and urban terrains take the values of 0.03, 0.3, and 0.7 m, respectively, (ESDU, 2002). It can be noticed that the roughness values, shown in Figure 2, decrease as it gets farther away from city centers. The first step in the PLW evaluation is to determine the climate around the study area. As mentioned previously, the nearest airport weather station YTZ was used to determine wind speeds and bearing on an hourly basis. The second step in PLW evaluation is related to the terrain effects. In that step, wind speeds from the first step measured at the airport (scaled at 500m using the
where u* is the friction velocity,
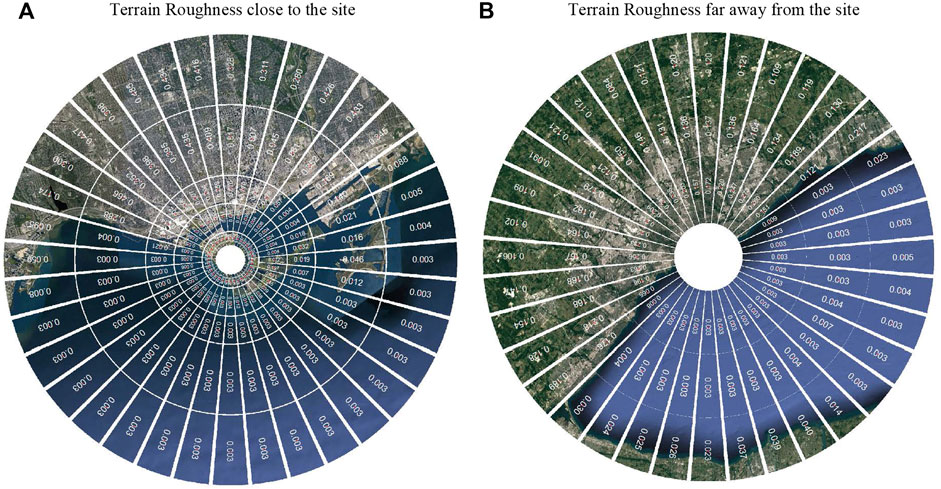
FIGURE 2. Upstream roughness for YTZ airport.
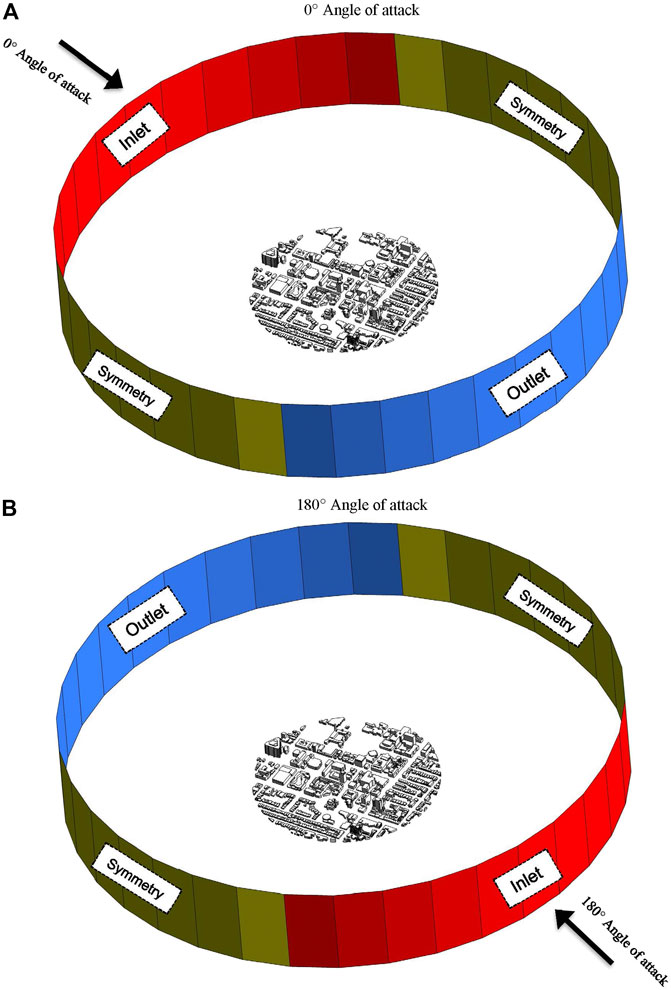
FIGURE 3. Computational Domain and Boundary conditions.
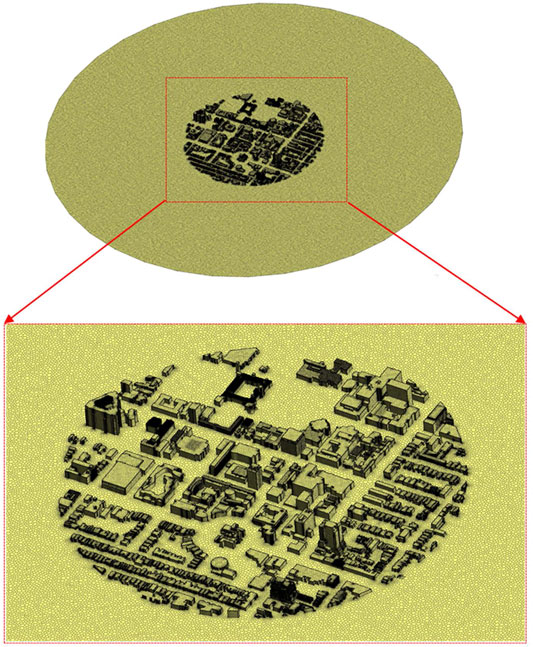
FIGURE 4. Computational domain discretization (meshing).
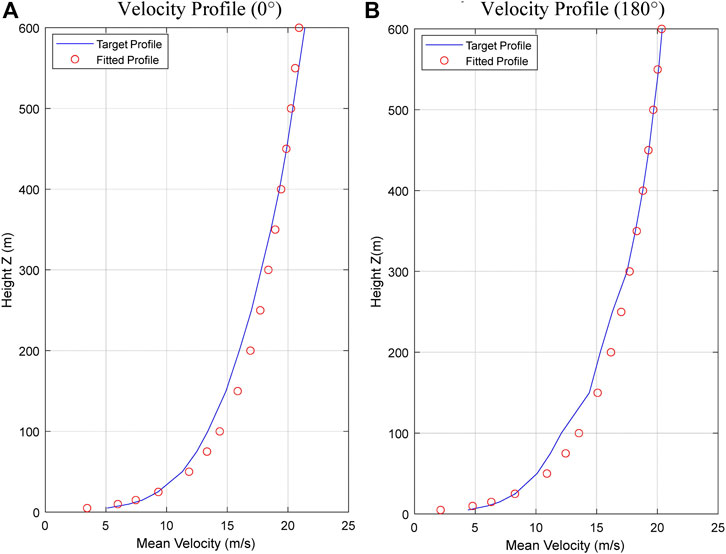
FIGURE 5. Velocity profiles and fitted logarithmic profiles (tile 50G_North2).
CFD Model
Commercial CFD package (Fluent 19.1) was utilized to solve the Reynolds-averaged Navier-Stokes equations defined by Eq. 3 and Eq. 4. The realizable k-Ɛ model by Durbin et al. (1995) was used to account for the turbulence.
Where
Where on the left-hand side of the equation,
The computational domain with boundary conditions is shown in Figure 3. The lower surface of the computational domain adopted a non-slip wall boundary condition and the distance between the inlet and the study area has been chosen (Aboshosha et al. (2015); Elshaer et al. (2016)) to ensure the stability of the developed inflow boundary condition. This distance has been previously identified by comparing the flow characteristics of the inflow to these at the study area region using an empty domain. The pressure and velocity evaluation were obtained in a coupled manner while solving the Navier-Stokes equations with an under-relaxation factor of 0.75 for pressure and momentum. Second-order discretization was performed for pressure and momentum. As mentioned in Terrain and Climate Effects, terrain and climate effects are considered by introducing an ABL flow at the inlet using Eq. 2. Turbulent Kinetic Energy (TKE) and dissipation rate (ɛ) are defined according to Blocken et al. (2012) using Eq. 5 and Eq. 6, respectively. Where
The computational domain G1 was discretized using polyhedral elements and consists of an average of 4.1 million cells, which required 27 h of computational time. A grid independence study with grid G2 was utilized for a grid independence study with a total mesh of 16 million cells requiring 68 h to be computationally simulated. The grid study found no noticeable difference in the PLW level with G1 and thus G1 was utilized by comparing the mean velocity at 10 different locations.
To account for the 36 different wind profiles generated in Terrain and Climate Effects for each tile, the inlets, outlets, and symmetry faces were rotated 10° for each CFD simulation as shown in Figure 3. Where each face represents a 10-degree slice of a polygon, and a total of 36 faces were defined to create a 360° domain. For this study, each face was named based on its corresponding wind angle of attack. For example, face 0 was always defined as the face directly north of the tile and corresponding to a wind bearing of 0°. 11 faces were defined as the inlet to ensure that the ABL flow covered the entire tile area. The inlet for case 1 included faces 310, 320, 330, 340, 350, 0, 10, 20, 30, 40, and 50. Similarly, 11 faces were defined as the outlet. To ensure that the flow traveled directly across the domain, face 180 was defined as the center of the outlet and was surrounded by five additional faces on each side. The outlet for case 1 included faces 130, 140, 150, 160, 170, 180, 190, 200, 210, 220, and 230. The symmetry was defined by the remaining 14 faces, or by defining seven faces on either side adjacent to the inlet as seen in Figure 3. The symmetry for case 1 on the east side of the inlet included faces 60, 70, 80, 90, 100, 110, and 120 while the symmetry on the west side of the inlet included faces 240, 250, 260, 270, 280, 290, and 300. As mentioned, these faces were rotated clockwise by 10° after each case was run in a CFD simulation.
Linking Climates With the CFD Data
Post Processing
In order to dynamically account for the current angle of attack and wind speeds, the velocity magnitudes, velocity in x, y and z directions, and Turbulent Kinetic Energy (TKE) was extracted as a comma-separated values (CSV) file from the solution data at various elevations (e.g., 1.5 m, 3 m, 5 m). The extracted data were organized and post-processed in MATLAB and scaled from the assumed wind speed of 20 m/s at 500 m from the local weather station (YTZ). Velocity contours for mean and gust flows are plotted according to real-time or historical data.
Meteorological Data Generation and Scaling
To obtain real-time or historical meteorological data, a publicly available API called Dark Sky API was used. This API generates meteorological data including wind bearing and the corresponding wind speed at a 10 m height. The latitude and longitude of Billy Bishop Airport were used as a fixed reference site for API data generation. It is essential to use Billy Bishop as a reference here since all CFD simulations were run with Billy Bishop as a wind speed reference site.
Using the 10 m wind speeds generated by the API, the γ factor presented in Terrain and Climate Effects was used to interpolate the wind speed at a 500 m height. This 500 m wind speed (UR500R) was then divided by the assumed 20 m/s (URrefR) used in the CFD simulations to produce a scaling factor C for the CSV data. This relationship is indicated in Eq. 5. By scaling up the data in such a way, a runtime contour for any tile can be produced.
MATLAB Code
In order to combine the CSV files for each tile, choose a specific location within the tile, and update contours based on real-time data, a MATLAB code was written. Each tile was defined in the code based on the latitude and longitude of its corner points. These points were obtained from the tilemaps as provided by TCP. The points were then connected to create a polygon in the shape of the tile. Most regions could be defined as a simple square with four latitudes/longitude pairs, however, regions such as 50G_South3 needed 20 pairs of points to be defined accurately. In addition, Figure 6 shows an accurate representation of each tile generated in MATLAB.
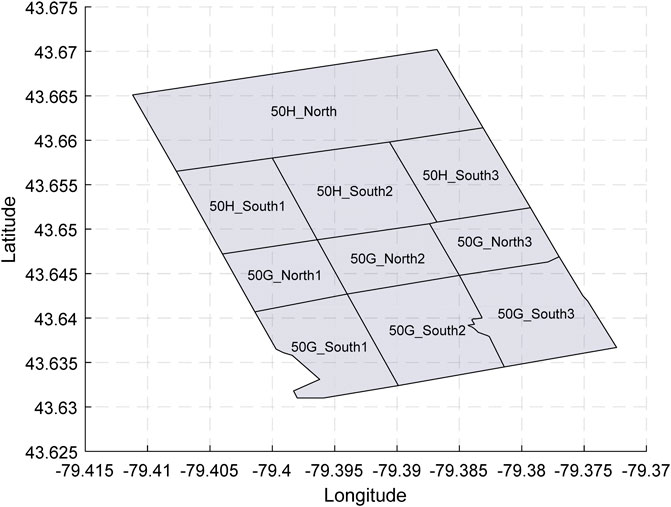
FIGURE 6. Tile boundaries naming and location.
To establish convenient access to any tile, a user input for latitude and longitude can be read by the code. With this input, the code then chooses the tile containing those coordinates and uses a separate script to read the CSV file of that tile. To retrieve real-time or historical data, the code reads a user input for date and time and imports hourly meteorological data for a full 24 h from Dark Sky API. Since wind bearing is reported to the nearest degree, it was rounded to the nearest ten degrees to match with a case from the CSV file and to match with an angle. For example, a wind bearing of 268° was rounded to 270° in order to match the available case 28 data. With this data, the correct γ factor was chosen and the reference data from the CSV file (corresponding to a reference wind speed of 20 m/s) was scaled using the C factor. A velocity contour or TKE contour was then patched accordingly. The steps followed by the MATLAB code are summarized in Figure 7.
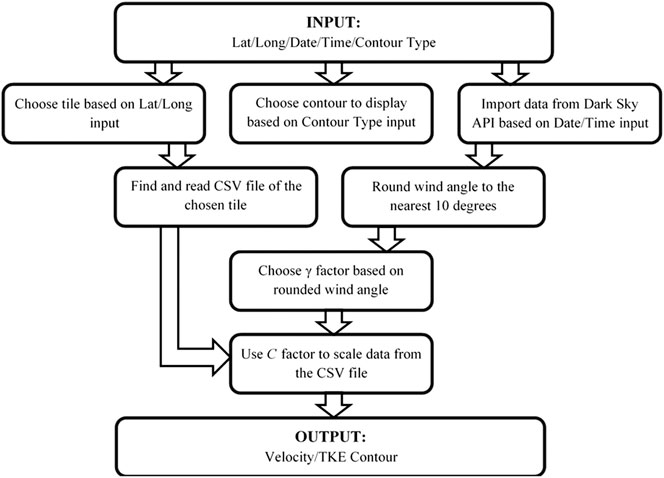
FIGURE 7. Flowchart of the developed procedure.
Experimental Validation
To ensure the solution accuracy of this study, it is important to validate the CFD data to ensure that terrain, climate and CFD modeling was conducted accurately and can be used to accurately represent the study region. Local weather stations were chosen to validate flow fields away from the reference site, the University of Toronto Atmospheric Observatory (TAO) weather station. The TAO records data at 1min intervals using a Davis Vantage Pro two weather station. The weather station is located on the 16th floor of the McLennan Physical Laboratories Burton Tower surrounded by a densely populated urban environment. The weather station is surrounded by complex aerodynamic interactions between various structures, as well as an astronomical dome. The complex aerodynamics in this region provides a heavy benchmark for the developed technique. The TAO was used to conduct long-term measurements of weather data to assess air pollution, ozone depletion and other climate change concerns. It worth mentioning that the data obtained from TAO was used in numerous published papers for various journals.
Hourly windspeeds, gust speeds and bearings from CFD are compared with the provided weather data, which correlates with the overall wind field near the study area. The TAO weather station is located at 43°39'36.0"N 79°24'00.0"W, at 174 m above sea level. Weather data from two recent dates with high wind speeds and bearing changes at YTZ airport were chosen, along with one day with calm winds. The experimental data from CFD were compared with the local data at the TAO as presented in Figure 8. The velocities and wind bearings from CFD and field measurements show strong agreements on days with low and high-velocity winds. Figure 8 shows good agreement between CFD and Wind station data, despite stronger winds at the YTZ Airport. Overall, it can be concluded that the surrounding climate, terrain, and geometry were inadequately captured to achieve this accuracy with run-time data.
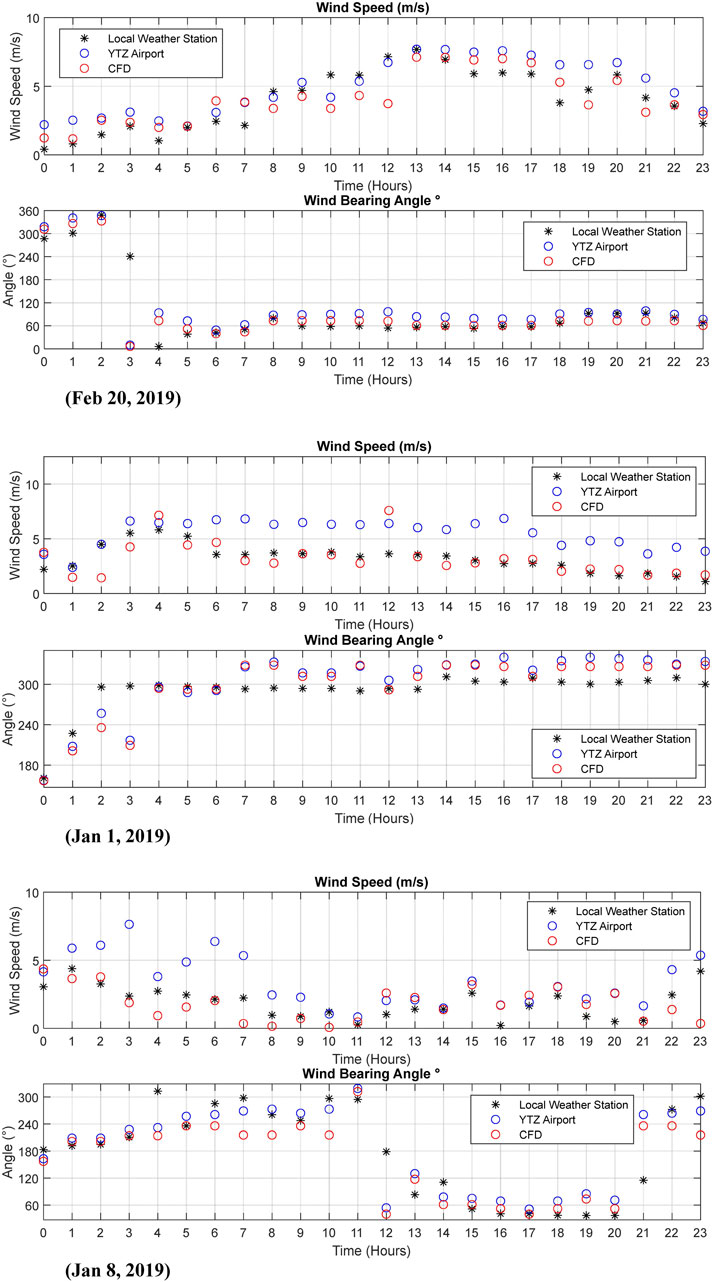
FIGURE 8. Validation of weather data with the TAO (Jan 08, 2019).
Sample Results and Utilization
This section discusses the results based on historical weather data scaled to the CFD study. The section includes two parts, CFD Results Based on Historical High Wind Velocity Events discusses results during high wind velocity events, while CFD Results Based on Statistical Wind Data discusses results based on statistical winds.
CFD Results Based on Historical High Wind Velocity Events
The wind field of the previously discussed area was simulated entirely for the described areas. Weather data between 2017 and 2019 were selected based on maximum mean hourly wind speed as listed in Table 2, the selected wind velocities were scaled using Eq. 8 and Eq. 9. Where Eq. 8 was used to obtain the mean velocity using the
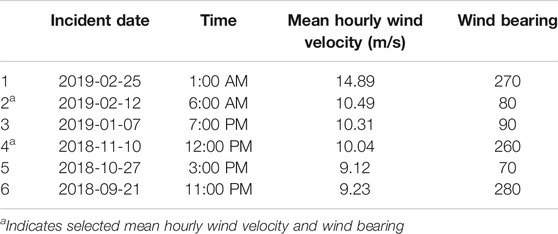
TABLE 2. Maximum hourly wind speeds (2018–2019).
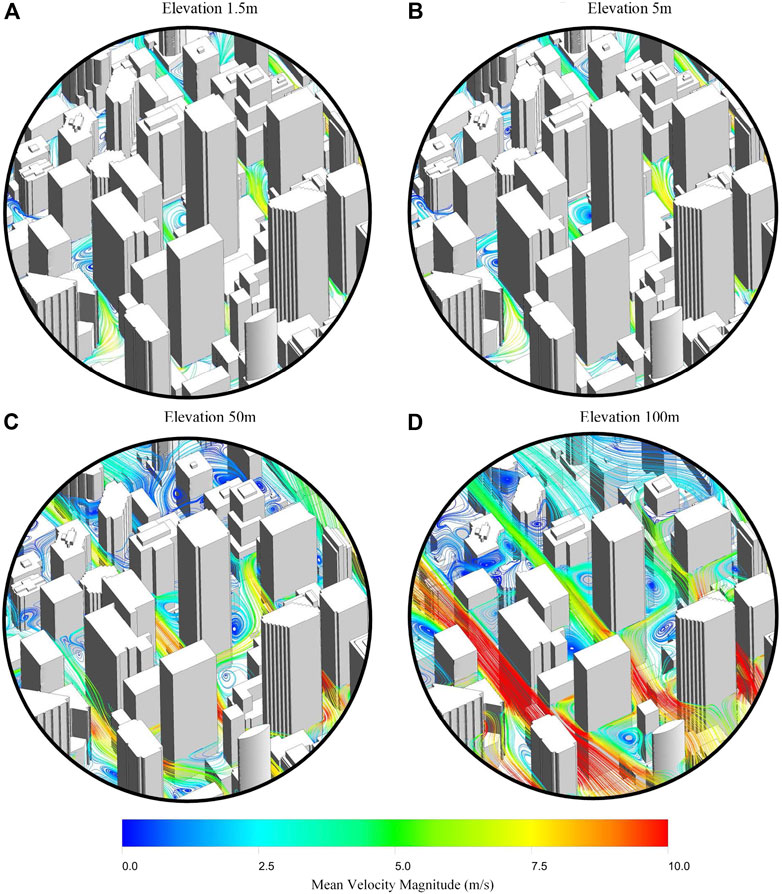
FIGURE 9. 50G_North3 Velocity Streamlines at different elevations.
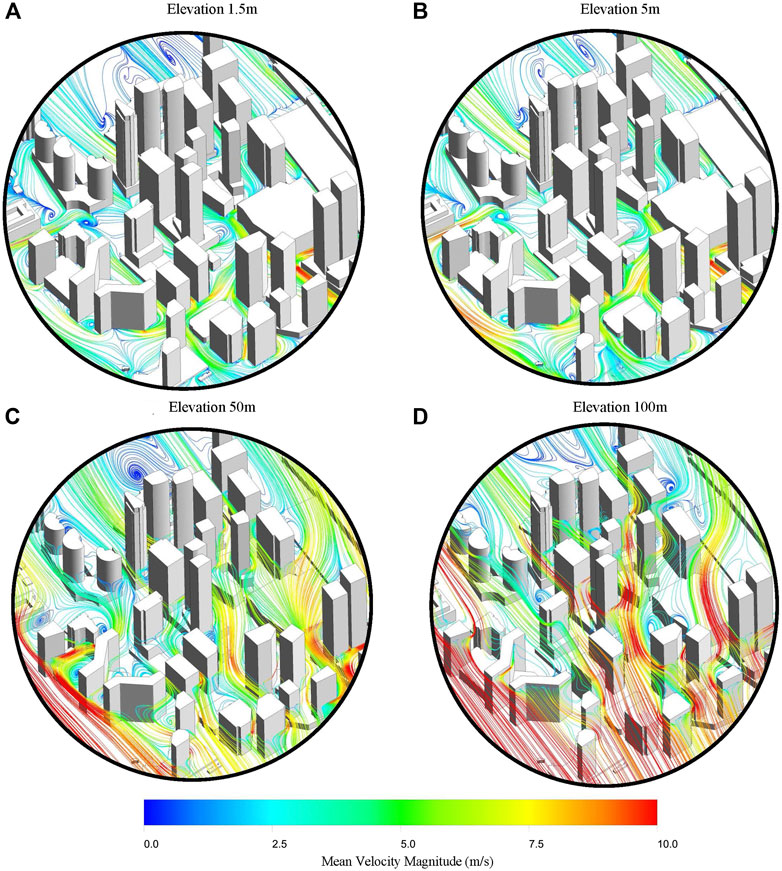
FIGURE 10. 50G_South three Velocity Streamlines at different elevations.
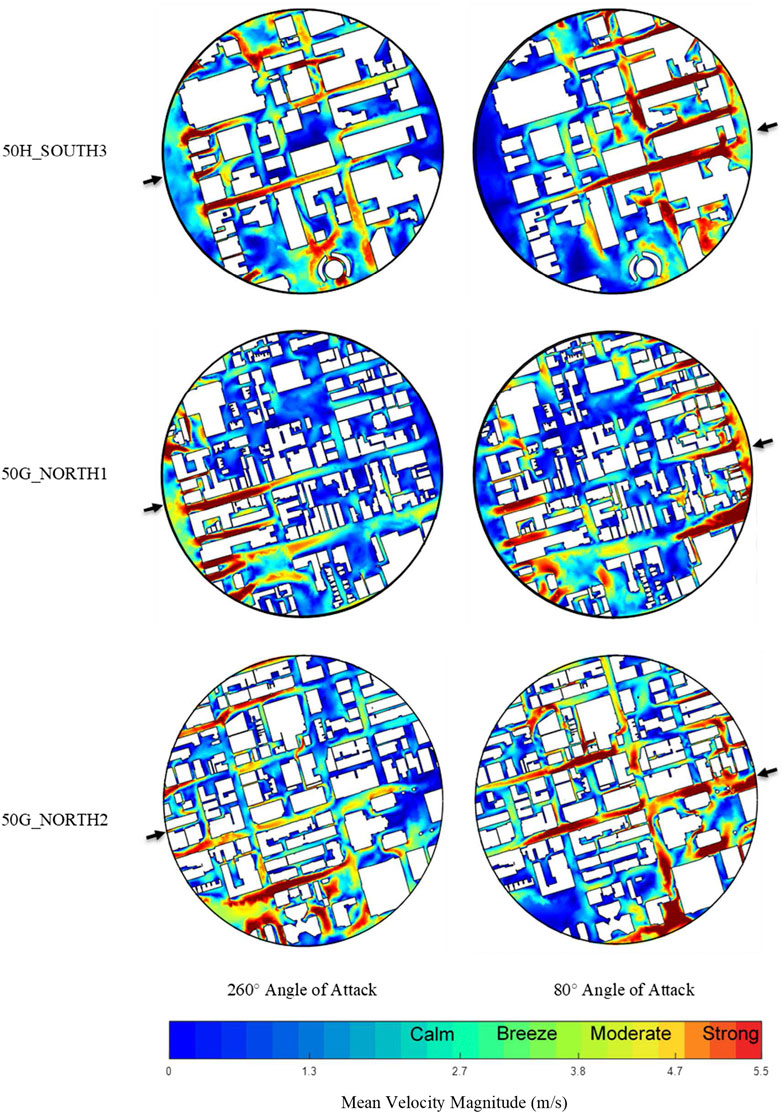
FIGURE 11. PLW Velocity Contours for real-time estimation.
For the velocity contours presented in Figure 11, regions highlighted toward the red end of the color bar represent locations with high velocities that are deemed unacceptable for pedestrians walking, these velocities were discussed in Introduction of the paper. This study provides pedestrians, planners and involved parties in the City of Toronto with crucial information regarding wind speeds at various elevations. The information provided can be used to plan trips and activities as well as provide early warning to potentially dangerous situations.
CFD Results Based on Statistical Wind Data
Statistical wind data from 1980 to 2018 are analyzed. Wind velocities are binned into segments between 0–30 m/s for every 1 m/s and a relationship between wind speed and cumulative probability is established. For the PLW application, wind speeds with a 20% probability of exceedance from all angles of attacks are selected, the distribution of wind speeds and probabilities are presented in Figure 12, with each ring representing the probability of exceedance. One-year return winds (20% exceedance) are used to generate wind-fields for all 36 Angles of Attack, the maximum velocities are used to combine and generate contour plots as shown in Figure 13.
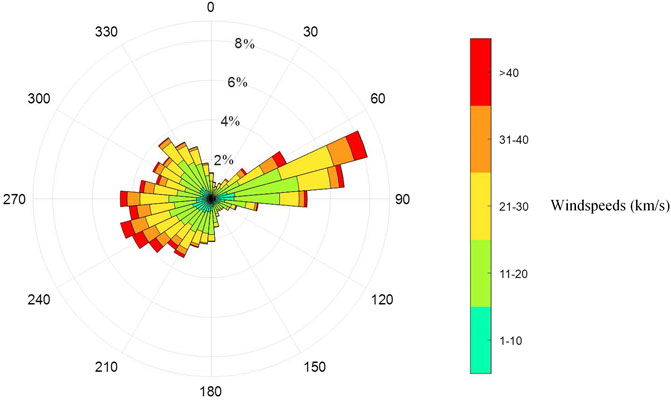
FIGURE 12. Windspeed distribution at Billy Bishop airport.
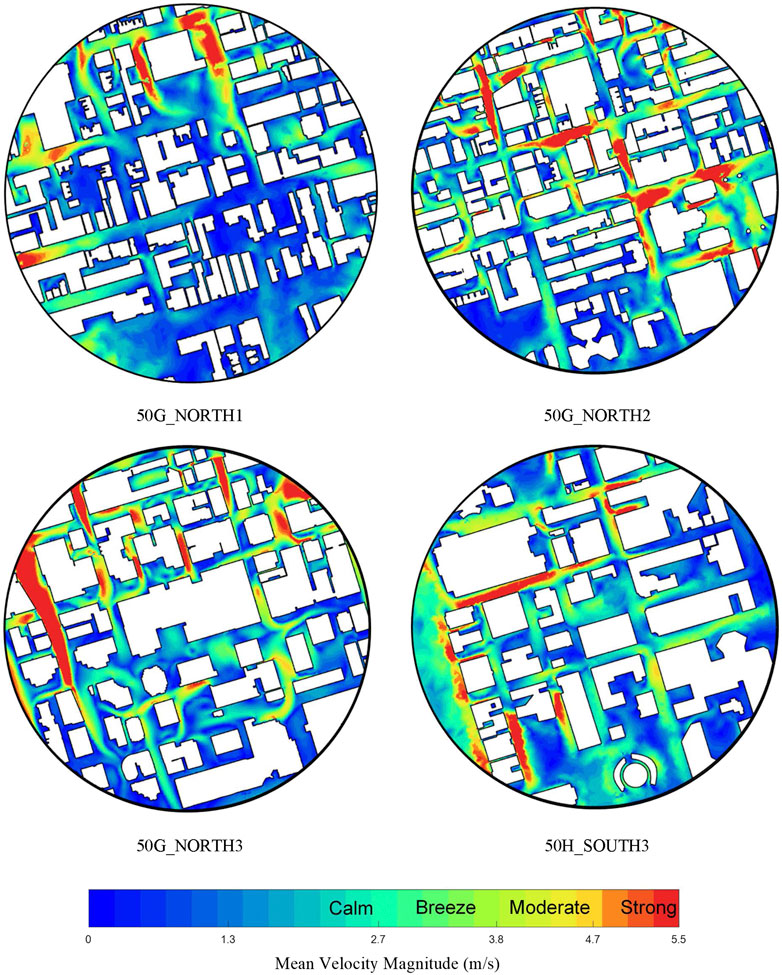
FIGURE 13. Peak PLW Velocity contours using a one-year return period.
Conclusion and Future Work
This study has analyzed a large region of the City of Toronto for pedestrian level wind as well as wind fields at other elevations. The experimental data from this study have been evaluated for 36 wind directions and were shown to provide an accurate real-time estimation of the PLW compared to a local wind station. Additionally, the data have been shown to scale with large historical wind events as well as mean statistical data. As discussed in Linking Climates With the CFD Data, the Climate, Terrain, and CFD model are highly accurate representations of the wind fields in Toronto. Experimental data from this study provide insightful information for residents, planners, architects, and engineers regarding businesses, city planning, and building design. A website is currently being developed to scale experimental data with real-time airport data to provide real-time and historical PLW for the public. The novelty of the developed technique lies in its ability to combine CFD with real-time meteorological data to estimate real-time wind statistics. Furthermore, the developed technique can be utilized to provide wind fields at higher elevations for aviation purposes (i.e., drone flights in urban areas), safety notifications for construction workers in areas of high localized winds and local wind reports for renewable energy systems such as small deployable wind turbines.
Data Availability Statement
The raw data supporting the conclusions of this article will be made available by the authors, without undue reservation.
Author Contributions
All authors listed have made a substantial, direct, and intellectual contribution to the work and approved it for publication.
Conflict of Interest
The authors declare that the research was conducted in the absence of any commercial or financial relationships that could be construed as a potential conflict of interest.
Acknowledgments
The authors would like to thank the University of Toronto’s Atmospheric Observatory and DarkSky for providing weather data and the City of Toronto for 3D massing data.
References
Aboshosha, H., Elshaer, A., Bitsuamlak, G. T., and El Damatty, A. (2015). Consistent inflow turbulence generator for LES evaluation of wind-induced responses for tall buildings. J. Wind Eng. Ind. Aerod. 142, 198–216. doi:10.1016/j.jweia.2015.04.004
Aboshosha, H. (2016). “Towards a robust wind tunnel based evaluation of extreme wind loads,” in CSCE annual conference. London, United Kingdom: CSCE, 26–27.
Adamek, K., Vasan, N., Elshaer, A., English, E., and Bitsuamlak, G. (2017). Pedestrian level wind assessment through city development: a study of the financial district in Toronto. Sustain. Cities Soc. 35, 178–190. doi:10.1016/j.scs.2017.06.004
Avini, R., Kumar, P., and Hughes, S. J. (2019). Wind loading on high-rise buildings and the comfort effects on the occupants. Sustain. Cities Soc. 45, 378–394. doi:10.1016/j.scs.2018.10.026
Aynsley, R. M., Melbourne, W., and Vickery, B. J. (1977). Architectural aerodynamics. Build. Environ. 14 (4), 275–276.
Blocken, B., Janssen, W. D., and van Hooff, T. (2012). CFD simulation for pedestrian wind comfort and wind safety in urban areas: general decision framework and case study for the Eindhoven University campus. Environ. Model. Software 30, 15–34. doi:10.1016/j.envsoft.2011.11.009
Blocken, B., and Stathopoulos, T. (2013). CFD simulation of pedestrian-level wind conditions around buildings: past achievements and prospects. J. Wind Eng. Ind. Aerod. 121, 138–145. doi:10.1016/j.jweia.2013.08.008
Bottema, M. (2000). A method for optimisation of wind discomfort criteria. Build. Environ. 35 (1), 1–18. doi:10.1016/s0360-1323(98)00065-1
CBC News (2018). High winds in southern Ontario area leave 2 dead, and more than 100,000 without power. Available at: https://www.cbc.ca/news/canada/toronto/friday-weather-strong-winds-1.4648032
Cochran, L. (2004). “Design features to change and/or ameliorate pedestrian wind conditions,” in ASCE/SEI Structures congress, Nashville, Tennessee, May 22–26, 2004 (Fort Collins: Cermak Peterka Petersen Inc.), 1–8.
Cui, D., Hu, G., Ai, Z., Du, Y., Mak, C. M., and Kwok, K. (2019). Particle image velocimetry measurement and CFD simulation of pedestrian level wind environment around U-type street canyon. Build. Environ. 154, 239–251. doi:10.1016/j.buildenv.2019.03.025
Davenport, A. G. (1972). “An approach to human comfort criteria for environmental wind conditions,” in Colloquium on building climatology, Stockholm, Sweden, September 4–6, 1972 (Stockholm, Sweden: Statens Institut för byggnadsfoskning), 306.
Du, Y., and Mak, C. M. (2018). Improving pedestrian level low wind velocity environment in high-density cities: a general framework and case study. Sustain Cities Soc 42, 314–324. doi:10.1016/j.scs.2018.08.001 |
Durbin, P. A. (1995). Separated flow computations with the k-epsilon-v-squared model. AIAA J. 33 (4), 659–664.
Elshaer, A., Aboshosha, H., Bitsuamlak, G., El Damatty, A., and Dagnew, A. (2016). LES evaluation of wind-induced responses for an isolated and a surrounded tall building. Eng. Struct. 115, 179–195. doi:10.1016/j.engstruct.2016.02.026
Elshaer, A., Gairola, A., Adamek, K., and Bitsuamlak, G. (2017). Variations in wind load on tall buildings due to urban development. Sustain. Cities Soc. 34, 264–277. doi:10.1016/j.scs.2017.06.008
Ferreira, A. D., Sousa, A. C. M., and Viegas, D. X. (2002). Prediction of building interference effects on pedestrian level comfort. J. Wind Eng. Ind. Aerod. 90 (4–5), 305–319. doi:10.1016/s0167-6105(01)00212-4
Gandemer, J. (1978). Discomfort due to wind near buildings: aerodynamic concepts. Washington: Department of Commerce, National Bureau of Standards, Vol. 13, 56.
Gandemer, J. (1975). “Wind environment around buildings: aerodynamic concepts,” in Procroceeding 4th international Conference wind effects on buildings and structures, Heathrow, London (Melbourne: Cambridge University Press), 423–432.
Hu, C.-H., and Wang, F. (2005). Using a CFD approach for the study of street-level winds in a built-up area. Build. Environ. 40 (5), 617–631. doi:10.1016/j.buildenv.2004.08.016
Hunt, J. C. R., Poulton, E. C., and Mumford, J. C. (1976). The effects of wind on people; new criteria based on wind tunnel experiments. Build. Environ. 11 (1), 15–28. doi:10.1016/0360-1323(76)90015-9
Isyumov, N., and Davenport, A. G. (1975). “The ground level wind environment in built-up areas,” in Proceedings of the 4th international conference on wind effects on buildings and structures (Heathrow), 403–422.
Janssen, W. D., Blocken, B., and van Hooff, T. (2013). Pedestrian wind comfort around buildings: comparison of wind comfort criteria based on whole-flow field data for a complex case study. Build. Environ. 59, 547–562. doi:10.1016/j.buildenv.2012.10.012
Koss, H. H. (2006). On differences and similarities of applied wind comfort criteria. J. Wind Eng. Ind. Aerod. 94 (11), 781–797. doi:10.1016/j.jweia.2006.06.005
Krautheim, M., Pasel, R., Pfeiffer, S., and Schultz-Granberg, J. (2014). Ity and wind: climate as an architectural instrument. Berlin, Germany: DOM Publishers, 207.
Kubota, T., Miura, M., Tominaga, Y., and Mochida, A. (2008). Wind tunnel tests on the relationship between building density and pedestrian-level wind velocity: development of guidelines for realizing acceptable wind environment in residential neighborhoods. Build. Environ. 43 (10), 1699–1708. doi:10.1016/j.buildenv.2007.10.015
Lawson, T. V. (1978). The wind content of the built environment. J. Wind Eng. Ind. Aerod. 3 (2–3), 93–105. doi:10.1016/0167-6105(78)90002-8
Melaragno, M. G. (1982). Wind in architectural and environmental design. New York, NY: Van Nostrand Reinhold, 684.
Melbourne, W. H. (1978). Criteria for environmental wind conditions. J. Wind Eng. Ind. Aerod. 3 (2–3), 241–249. doi:10.1016/0167-6105(78)90013-2
Mirzaei, P. A., and Carmeliet, J. (2013). Dynamical computational fluid dynamics modeling of the stochastic wind for application of urban studies. Build. Environ. 70, 161–170. doi:10.1016/j.buildenv.2013.08.014
Mochida, A., and Lun, I. Y. (2008). Prediction of wind environment and thermal comfort at pedestrian level in urban area. J. Wind Eng. Ind. Aerod. 96 (10–11), 1498–1527. doi:10.1016/j.jweia.2008.02.033
Murakami, S., Iwasa, Y., and Morikawa, Y. (1986). Study on acceptable criteria for assessing wind environment at ground level based on residents' diaries. J. Wind Eng. Ind. Aerod. 24 (1), 1–18. doi:10.1016/0167-6105(86)90069-3
Penwarden, A., and Wise, A. (1975). Wind environment around buildings. London, United Kingdom: Building Research Establishment, 52.
Ramponi, R., Blocken, B., de Coo, L. B., and Janssen, W. D. (2015). CFD simulation of outdoor ventilation of generic urban configurations with different urban densities and equal and unequal street widths. Build. Environ. 92, 152–166. doi:10.1016/j.buildenv.2015.04.018
Ratcliff, M. A., and Peterka, J. A. (1990). Comparison of pedestrian wind acceptability criteria. J. Wind Eng. Ind. Aerod. 36, 791–800. doi:10.1016/0167-6105(90)90076-o
Sanz-Andres, A., and Cuerva, A. (2006). Pedestrian wind comfort: feasibility study of criteria homogenisation. J. Wind Eng. Ind. Aerod. 94 (11), 799–813. doi:10.1016/j.jweia.2006.06.004
Serteser, N., and Karadag, I. (2018). Design for improving pedestrian wind comfort: a case study on a courtyard around a tall building. Architect. Sci. Rev. 61 (6), 492–499. doi:10.1080/00038628.2018.1492899
Soligo, M. J., Irwin, P. A., Williams, C. J., and Schuyler, G. D. (1998). A comprehensive assessment of pedestrian comfort including thermal effects. J. Wind Eng. Ind. Aerod. 77–78, 753–766. doi:10.1016/s0167-6105(98)00189-5 |
Stathopoulos, T. (2006). Pedestrian level winds and outdoor human comfort. J. Wind Eng. Ind. Aerod. 94 (11), 769–780. doi:10.1016/j.jweia.2006.06.011
Stathopoulos, T., and Storms, R. (1986). Wind environmental conditions in passages between buildings. J. Wind Eng. Ind. Aerod. 24 (1), 19–31. doi:10.1016/0167-6105(86)90070-x
Stathopoulos, T., and Wu, H. (1995). Generic models for pedestrian-level winds in built-up regions. J. Wind Eng. Ind. Aerod. 54–55, 515–525. doi:10.1016/0167-6105(94)00068-o
Stevenson, J. (2019). City adding 31 skyscrapers by 2024. Available at: https://torontosun.com/news/local-news/skyline-getting-crowded-as-t-o-adding-31-skyscrapers-by-2024 (Accessed May 5, 2019).
Tominaga, Y., and Stathopoulos, T. (2013). CFD simulation of near-field pollutant dispersion in the urban environment: a review of current modeling techniques. Atmos. Environ. 79, 716–730. doi:10.1016/j.atmosenv.2013.07.028
Toronto City Planning (2019). Toronto 3D Massing. From. Available at: https://open.toronto.ca/dataset/3d-massing/ (Accessed November 22, 2019).
Tsang, C. W., Kwok, K. C. S., and Hitchcock, P. A. (2012). Wind tunnel study of pedestrian level wind environment around tall buildings: effects of building dimensions, separation and podium. Build. Environ. 49, 167–181. doi:10.1016/j.buildenv.2011.08.014
Weerasuriya, A. U., Tse, K. T., Zhang, X., and Kwok, K. C. S. (2018). Equivalent wind incidence angle method: a new technique to integrate the effects of twisted wind flows to AVA. Build. Environ. 139, 46–57. doi:10.1016/j.buildenv.2018.05.017
Weerasuriya, A. U., Zhang, X., Lu, B., Tse, K. T., and Liu, C. H. (2020). Optimizing lift-up design to maximize pedestrian wind and thermal comfort in “hot-calm” and “cold-Windy” Climates. Sustain. Cities Soc. 58, 102146. doi:10.1016/j.scs.2020.102146
White, B. R. (1992). Analysis and wind-tunnel simulation of pedestrian-level winds in San Francisco. J. Wind Eng. Ind. Aerod. 44 (1–3), 2353–2364. doi:10.1016/0167-6105(92)90026-7
Williams, C. J., Hunter, M. A., and Waechter, W. F. (1990). Criteria for assessing the pedestrian wind environment. J. Wind Eng. Ind. Aerod. 36, 811–815. doi:10.1016/0167-6105(90)90078-q
Williams, C. J., Soligo, M. J., and Côté, J. (1992). A discussion of the components for a comprehensive pedestrian level comfort criterion. J. Wind Eng. Ind. Aerod. 44 (1–3), 2389–2390. doi:10.1016/0167-6105(92)90029-a
Wu, H., and Stathopoulos, T. (1993). Wind‐tunnel techniques for assessment of pedestrian‐level winds. J. Eng. Mech. 119 (10), 1920–1936. doi:10.1061/(asce)0733-9399(1993)119:10(1920)
Keywords: wind engineering, pedestrian comfort and safety, Computational fluid dyanamics, aerodynamics, urban development, climate
Citation: Chen J, Gianfelice M, Izukawa N, Elshaer A and Aboshosha H (2021) Run-Time and Statistical Pedestrian Level Wind Map for Downtown Toronto. Front. Built Environ. 7:603836. doi: 10.3389/fbuil.2021.603836
Received: 08 September 2020; Accepted: 04 January 2021;
Published: 04 February 2021.
Edited by:
Matthew Stephen Mason, The University of Queensland, AustraliaReviewed by:
Aly Aly, Louisiana State University, United StatesSwamy Selvi Rajan, Structural Engineering Research Centre (CSIR), India
Copyright © 2021 Chen, Gianfelice, Izukawa, Elshaer and Aboshosha. This is an open-access article distributed under the terms of the Creative Commons Attribution License (CC BY). The use, distribution or reproduction in other forums is permitted, provided the original author(s) and the copyright owner(s) are credited and that the original publication in this journal is cited, in accordance with accepted academic practice. No use, distribution or reproduction is permitted which does not comply with these terms.
*Correspondence: Ahmed Elshaer, YWVsc2hhZXJAbGFrZWhlYWR1LmNh