 Kouseya Choudhuri
 Debarghya Chakraborty
- Department of Civil Engineering, Indian Institute of Technology, Kharagpur, India
This paper intends to examine the influence of spatial variability of soil properties on the probabilistic bearing capacity of a pavement located on the crest of a fibre reinforced embankment. An anisotropic random field, in combination with the finite difference method, is used to carry out the probabilistic analyses. The cohesion and internal friction angle of the soil are assumed to be lognormally distributed. The Monte Carlo simulations are carried out to obtain the mean and coefficient of variation of the pavement bearing capacity. The mean bearing capacity of the pavement is found to decrease with the increase in horizontal scale of fluctuation for a constant vertical scale of fluctuation; whereas, the coefficient of variation of the bearing capacity increases with the increase in horizontal scale of fluctuation. However, both the mean and coefficient of variation of bearing capacity of the pavement are observed to be increasing with the increase in vertical scale of fluctuation for a constant horizontal scale of fluctuation. Apart from the different scales of fluctuation, the effects of out of the plane length of the embankment and randomness in soil properties on the probabilistic bearing capacity are also investigated in the present study.
Introduction
Soil reinforced with fibres in optimum quantity is proven to be one of the most efficient and economical means of ground improvement technique over the past few decades. Fibre reinforcement not only improves the unconfined compressive strength and shear strength properties of the soil (Cai et al., 2006; Consoli et al., 2010), it also increases the tensile strength (Tang et al., 2016; Cristelo et al., 2017). Both the natural and synthetic fibres are used as reinforcement to enhance the mechanical properties of the soil. Because of cost-effectiveness, easy availability, and eco-friendly nature, the use of natural fibres (such as jute, sisal, coir, etc.) has gained popularity over the period. Several studies are there on the soil reinforced with natural fibre (Prabakar and Sridhar, 2002; Ghosh et al., 2005; Babu and Vasudevan, 2008; Chaple and Dhatrak, 2013; Singh and Bagra, 2013). The major drawback of using natural fibre is its biodegradation caused by microorganisms in soil which may reduce the long term applicability of the reinforcement (Tang et al., 2016). Thus it gives rise to the use of synthetic fibres as soil reinforcement. Many researchers have studied the effectiveness of using synthetic fibre-reinforced soil (Michalwoski and Cermak, 2002; Kumar et al., 2007; Tang et al., 2007; Consoli et al., 2010; Chen et al., 2015; Correia et al., 2015; Ates, 2016; Bouaricha et al., 2017; Cristelo et al., 2017; Sharma and Kumar, 2017). The reinforcing effects of fibres on the behavior of soils have been investigated numerically by several authors (Babu et al., 2007; Toh et al., 2017; Arora and Kumar, 2019; Sharma and Kumar, 2019; Wang et al., 2019).
All of the studies, as mentioned above, are deterministic in which the soil is assumed to be a single homogeneous layer or a stratified medium with uniform soil properties. It is well known that soil is very much heterogeneous and random because of its different geological formation processes and mineralogical constituents. Thus considering soil as a homogeneous medium may lead to the unreliable design of civil engineering structures. Many researchers conducted the probabilistic studies assessing the randomness in the soil as well as spatial variability (Fenton and Griffiths, 2001; Griffiths et al., 2002; Fenton and Griffiths, 2005; Luo et al., 2011; Cassidy et al., 2012; Li et al., 2014; Jha, 2016; Zaskórski et al., 2017). There is a huge possibility that the mixing of fibres with soil may not be uniform, which may lead to the randomness in fibre reinforced soil. Very few probabilistic and reliability based studies are available on fibre reinforced soil (Ranjan et al., 1996; Moghal et al., 2016; Diab et al., 2017; Moghal et al., 2017; Syed and GuhaRay, 2020). Johari and Kalantari (2016) carried out a probabilistic analysis of slope stability of embankment reinforced with discrete polypropylene fibre. But spatial variability of soil properties was not considered in their study. However, it is essential to consider the spatial variability as over a certain length of soil domain the strength properties may change. In past, many literature (Griffiths and Fenton, 2004; Suchomel and Masin, 2009; Kasama and Whittle, 2015) considered the soil spatial variability in slope stability problems. Recently, Luo and Bathurst (2018); Halder and Chakraborty (2019) have carried out the probabilistic analyses on geogrid reinforced embankment considering soil spatial variability to investigate the load-settlement behavior.
The main objective of this paper is to investigate the effect of soil spatial variability on the performance of a pavement located on the top of the fibre-reinforced embankment. Different horizontal and vertical scales of fluctuation are chosen to study the influence of soil spatial variability. It is to be noted that all the probabilistic studies stated above were based on plane strain condition. To the best of authors’ knowledge, there is no probabilistic study available on the fibre-reinforced embankment considering spatially variable soil parameters. Note that, for spatially variable soil it is essential to consider the length of the model in out of plane direction as it significantly affects the mean and coefficient of variation of load-carrying capacity of the geotechnical structures (Kawa and Pula, 2019). Hence, the influence of different out of the plane lengths of the embankment on the bearing capacity of the pavement is also explored based on both deterministic and probabilistic studies. Here only the embankment soil is assumed to be fibre-reinforced. In contrast to that, the foundation soil is kept as unreinforced. The randomness and spatial variability of the soil properties are considered for both embankment and foundation soil, and their effects are included by associating the finite difference mesh and random field. Three-dimensional finite-difference software (FLAC3D) is used to carry out the numerical analyses. The probabilistic results are obtained using the Monte Carlo simulation technique. Finally, failure probabilities of the bearing capacity of the pavement are computed for different horizontal and vertical scales of fluctuation.
Problem Definition
Figure 1 depicts the embankment slope geometry considered in the present numerical analyses. The embankment having a height of 5 m and an inclination of 1.5 H:1 V is filled with fibre-reinforced soil consisting of improved cohesion (c) and angle of internal friction (ϕ); whereas, the foundation soil is assumed to be unreinforced with lower shear strength properties. A pavement of width 3.5 m (B = 3.5 m) is located at the crest of the embankment. The present work means to estimate the probabilistic bearing capacity of the pavement for a certain settlement value, which can be expressed as mean (µq) and coefficient of variation (COVq) of bearing capacity of the pavement.
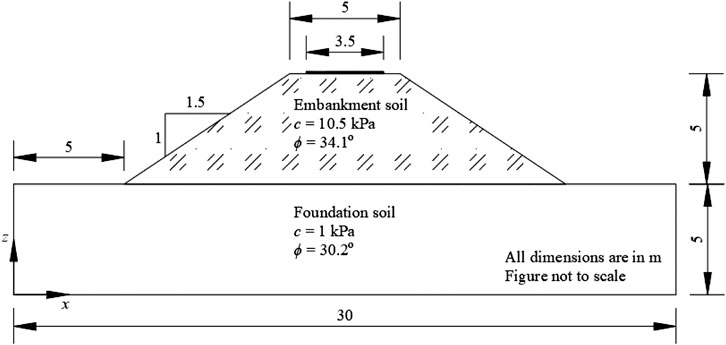
FIGURE 1. Schematic diagram of the fiber reinforced embankment.
Numerical Modeling
Three-dimensional explicit finite difference software, FLAC3D is engaged to generate the three-dimensional modeling of the embankment and to accomplish the numerical analyses. The domain size of the problem, in both horizontal and vertical direction, is chosen in such a way that there should not be any boundary effect. The displacement along the bottom boundary edge is fixed in both horizontal and vertical directions; whereas, the side boundaries are horizontally restricted in order to allow the vertical displacement only. Eight noded brick shaped elements are used for discretization of the problem domain. A comparatively finer mesh is generated to model the embankment soil; while, coarser mesh is chosen in order to model the foundation soil. The Mohr-Coulomb yield criterion is incorporated to simulate the behavior of embankment and foundation soil. However, it should be mentioned that embankment soil and foundation soil may differ in terms of type, composition and strength requirements. Hence, the use of only Mohr-Coulomb yield criterion for both type of soil may not represent the real scenario. It can be considered as one of the limitations of this study. The soil parameters of fibre-reinforced embankment soil and unreinforced foundation soil considered in the numerical analyses are taken as provided by Sharma and Kumar (2019) and given in Table 1.
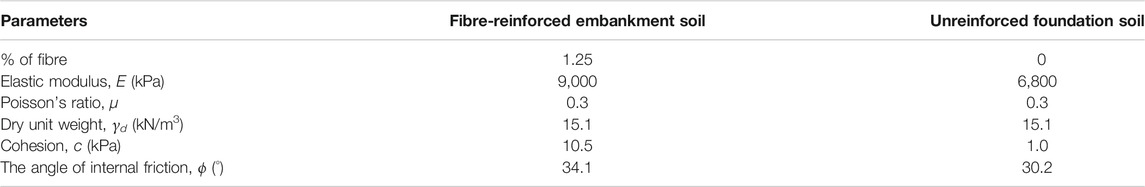
TABLE 1. Parameters used for embankment and foundation soil.
After modeling the embankment slope geometry and allocating the soil properties node wise, the loading is simulated on the nodes representing pavement width (and along with the out of the plane length of the pavement) by implementing a very small amount of downward velocity in vertical direction. An optimized velocity of magnitude 5 × 10⁻⁶ m/step is taken after few trials, as it is found to be less time-consuming as well as does not affect the pavement bearing pressure settlement response (Halder and Chakraborty, 2020). The numerical model is then run for numerous steps until the plastic steady state is achieved.
Validation of the Present Study
Before carrying out the numerical analyses, the finite difference model is validated with the available study. Since there is no probabilistic study available on fibre-rerinforced embankment considering soil spatial variability, the present result is verified with the deterministic results of Sharma and Kumar (2019). They carried out a deterministic three-dimensional numerical study on bearing capacity of ring and circular foundation resting on two-layered sand using finite element method in which top layer sand is reinforced with fibre, and the underlying layer of sand is kept as unreinforced. In the present work, only the circular footing and the two-layered soil system are modeled with identical geometry and soil properties. The bearing capacity and footing settlement curve is obtained and compared with that of Sharma and Kumar (2019). Figure 2 illustrates that the present bearing pressure-settlement response is comparatively lower than that obtained in literature which may be due to the difference in mesh generation and applied numerical scheme. The obtained result from present study is observed to be in the conservative side.
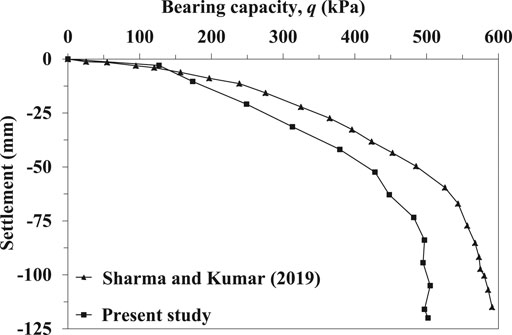
FIGURE 2. Comparison between present study and Sharma and Kumar (2019).
Deterministic Analysis
Before implementing the probabilistic analyses, deterministic analyses are carried out on the numerical model where both the foundation and embankment soil properties are considered to be uniform or homogeneous. At first, the whole system is modeled using unreinforced soil properties for different out of the plane lengths (Lop). Then only the embankment soil is modeled considering reinforced soil properties. Both the unreinforced and reinforced bearing capacity-settlement response curves obtained for different Lop are illustrated in Figure 3. It is quite obvious that the embankment soil reinforced with fibre is having a higher bearing capacity than the unreinforced soil. As an example, the bearing capacity of the pavement for Lop = 3 m is increased from 17.5 kPa to 56.6 kPa corresponding to 60 mm of settlement value when the unreinforced embankment is replaced with fibre reinforcement. The bearing capacity of the pavement for unreinforced embankment tends to increase from 17.7 kPa for Lop = 0.5 m to 17.8 kPa for Lop = 1 m, then it decreases to 17.5 kPa for Lop = 3 m and further increase to 17.7 kPa for Lop = 5 m corresponding to the same settlement value as stated earlier. In case of reinforced embankment, it decreases from 56.9 kPa for Lop = 0.5 m to 56.6 kPa for Lop = 2 m. Beyond Lop = 2 m, it remains almost unaltered. Although the differences in bearing capacity for different Lop are very negligible, it signifies the importance of carrying out the probabilistic analysis to investigate the influence of different Lop on the probabilistic bearing capacity of the pavement.
FIGURE 3. Bearing capacity-settlement response curve for unreinforced and reinforced embankment with different Lop without considering spatial variability.
Probabilistic Analysis
Random Field Generation
The variations of the properties of the in–situ soil can be represented by the mean value, coefficient of variation and scales of fluctuation (SOFs) (Haldar and Babu, 2008). Most of the studies (Griffiths et al., 2002; Haldar and Babu, 2008; Ahmed and Soubra, 2014) have considered the cohesion (c) as lognormally distributed random field represented by mean (µc) and standard deviation (σc). The lognormal distribution is chosen to avoid the generation of negative values of soil parameters. Due to the fundamental nature of the parameter tanϕ in the equation of Mohr-Coulomb yield criterion, it is modeled as a lognormally distributed random field rather than ϕ itself. A lognormal distribution of tanϕ ensures that the friction angle is bounded by 0 < ϕ < 90° (Griffiths et al., 2011).
A lognormally distributed random field can be expressed as:
where
where
The correlation function
where
Using the lower triangular matrix, the random field can be generated which is shown by
where Zj is the sequence of independent standard normal random variables.
In the present study, both the c and tanϕ for embankment soil are considered as random variables. Since the foundation soil is having very low value of cohesion (c = 1 kPa), it is considered as constant; whereas, only tanϕ is chosen as the random variable. The mean values of c and tanϕ used in the probabilistic analysis are taken as the constant property values for deterministic analysis. Typical values of coefficient of variation (COV) for tanϕ and c and the horizontal SOF (δx/B = δy/B) as well as the vertical SOF (δz/B) are selected from Phoon and Kulhawy (1999). The probabilistic parameters considered in the present study are listed in Table 2. It should be mentioned here that there is no cross-correlation considered between tanϕ and c.
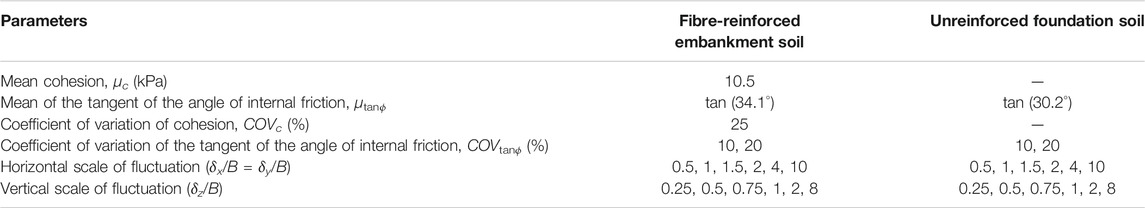
TABLE 2. Probabilistic parameters considered in the present study.
The nodal coordinates of the finite difference mesh are taken from FLAC3D and imported to MATLAB. In MATLAB, the Markov correlation function given in Eq. 7 is used to generate the random field. The randomly distributed c and ϕ values generated in MATLAB are again taken back to FLAC3D and are allocated node wise (Halder and Chakraborty, 2018; Halder and Chakraborty, 2020). In this way, the random fields are generated in FLAC3D.
Monte Carlo Simulations
For each set of statistical parameters, such as COVc, COVtanϕ and δi (where i = x, y and z), the Monte Carlo simulations are carried out in probabilistic analyses to evaluate the mean and COV of the bearing capacity (µq and COVq) of the pavement. It should be mentioned here that the number of realizations of the Monte Carlo simulations should be such that the stable solution of µq and COVq are achieved. The fluctuations between two consecutive realizations of µq and COVq should fall within a tolerable range, which is between 5% and 10% (Haldar and Babu, 2008). Each realization, while having the identical underlying statistical values, may have a quite different spatial pattern of the soil strength parameters under the pavement and hence different magnitude of bearing capacity is obtained after each realization. In the present study, FISH codes are written in FLAC3D to carry out the Monte Carlo simulations. It has been observed that 300 simulations are required to achieve a stable estimate of mean and coefficient of variation of bearing capacity. As a representative case, the variations of µq and COVq (corresponding to 60 mm settlement) as a function of the Monte Carlo simulations for fiber-reinforced embankment with Lop = 3 m, are shown in Figures 4A,B.
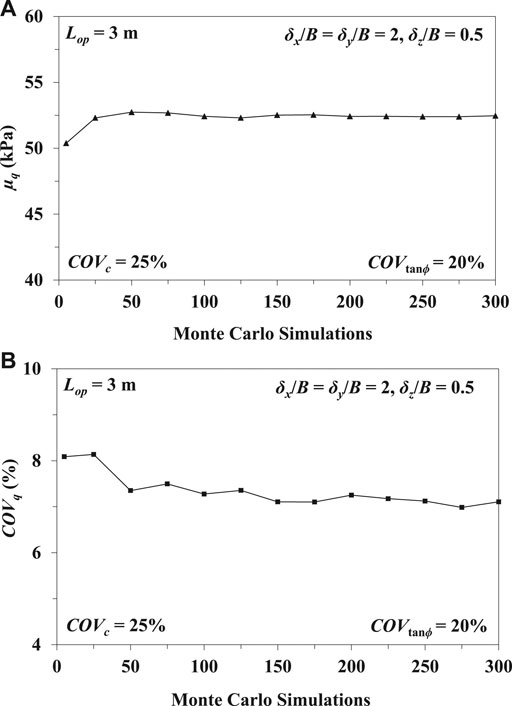
FIGURE 4. Variation of (A) mean bearing capacity of the pavement with respect to number of Monte Carlo simulations; (B) coefficient of variation of bearing capacity of the pavement with respect to number of Monte Carlo simulations.
Results Obtained in the Probabilistic Analyses
Effects of the spatial variablity, randomness in the soil properties and different out of the plane lengths of the embankment on the mean and COV of bearing capacity of the pavement are discussed in the following sub-sections. All the probabilistic analyses carried out here are only for fibre-reinforced embankment. As the variation of soil properties of natural deposit in the horizontal direction is generally quite less compared to that of the vertical direction due to the process of deposition, an anisotropic random field is generated for the present study where the vertical SOFs are chosen to be less than the horizontal one. The horizontal and vertical SOFs are varied as per Table 2. However, during the parametric study, there may be some situations where isotropic random fields are generated and vertical SOF is greater than horizontal SOF.
Effect of the out of the Plane Length of the Embankment (Lop) on Probabilistic Bearing Capacity
The effect of different Lop on µq and COVq is investigated by considering δx/B = δy/B = 2 and δz/B = 0.5 for both embankment and foundation soil, and COVc = 25% for embankment soil only. The effects of two different coefficients of variation of soil friction angle (COVtanϕ) for both embankment and foundation soil are also studied in this section. Figures 5A,B illustrate the behavior of µq and COVq for different Lop and COVtanϕ. As per Figure 5A the magnitude of µq for a particular value of COVtanϕ, at first tends to decrease with an increase in Lop from 0.5 to 1 m, then it increases and after Lop = 3 m the change in µq is found to be insignificant. As an example, µq decreases from 52.36 kPa for Lop = 0.5 m to 51.95 kPa for Lop = 1 m and then increases to 52.41 kPa for Lop = 3 m for a constant value of COVtanϕ = 20%. The increase in µq beyond Lop = 3 m is quite less. The effect of COVtanϕ on µq is quite prominent. It is evident that with an increase in COVtanϕ, there is an increase in variability in the angle of internal friction, which in turn reduces the value of µq. For a particular value of Lop = 3 m, µq decreases from 54.43 to 52.41 kPa with an increase in COVtanϕ from 10 to 20%. However, in all the cases, the magnitudes of µq are less than the deterministic bearing capacity values.
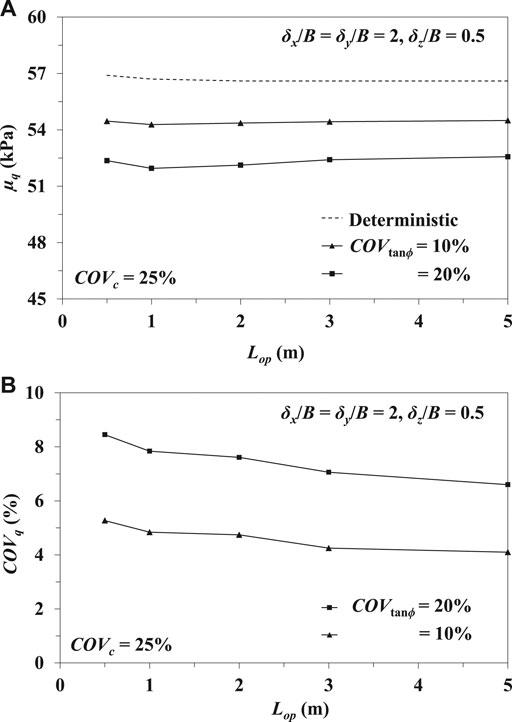
FIGURE 5. (A) Variation of µq for different values of Lop; (B) Variation of COVq for different values of Lop.
The effect of Lop on COVq is depicted in Figure 5B. In contrast to µq, COVq is decreasing with the increase in Lop. As an example, COVq decreases from 8.45 to 6.6% as Lop increases from 0.5 to 5 m for a constant value of COVtanϕ = 20%. Unlike µq, COVq increases with the increment in the magnitude of COVtanϕ as the increase in COVtanϕ causes an increasing randomness of angle of internal friction. For example, the COVq increases from 4.25 to 7.06% with the increase in COVtanϕ from 10 to 20% for Lop = 3 m.
Random Field Plots Considering Spatial Variability
The random fields are generated by implementing the aforesaid theory using FLAC3D and MATLAB. Since there is no significant difference in µq beyond Lop = 3 m, all the studies considering spatial variability are done for Lop = 3 m only. Figures 6A–D represent the random field plots of ϕ for both embankment and foundation soil with different δx/B = δy/B, δz/B, COVtanϕ = 20% and out of the plane length (Lop) = 3 m for a particular realization. Figures 6A,B show that randomness of ϕ decreases in horizontal direction with the increase in δx/B = δy/B value from 0.5 to 4 for the constant value of δz/B = 0.5. Similar observation can be made for variation of ϕ in vertical direction from Figures 6C,D where δz/B is increased from 0.25 to 2 for the constant value of δx/B = δy/B = 2. Figures 6A,D both exhibit isotropic spatial variation field where lower values of SOFs represent more erratic field of ϕ and higher values of SOFs represent almost uniform nature of ϕ. Figures 7A–D illustrate the same patterns of the random field of c for the embankment soil only with different SOFs, Lop = 3 m and COVc = 25%.
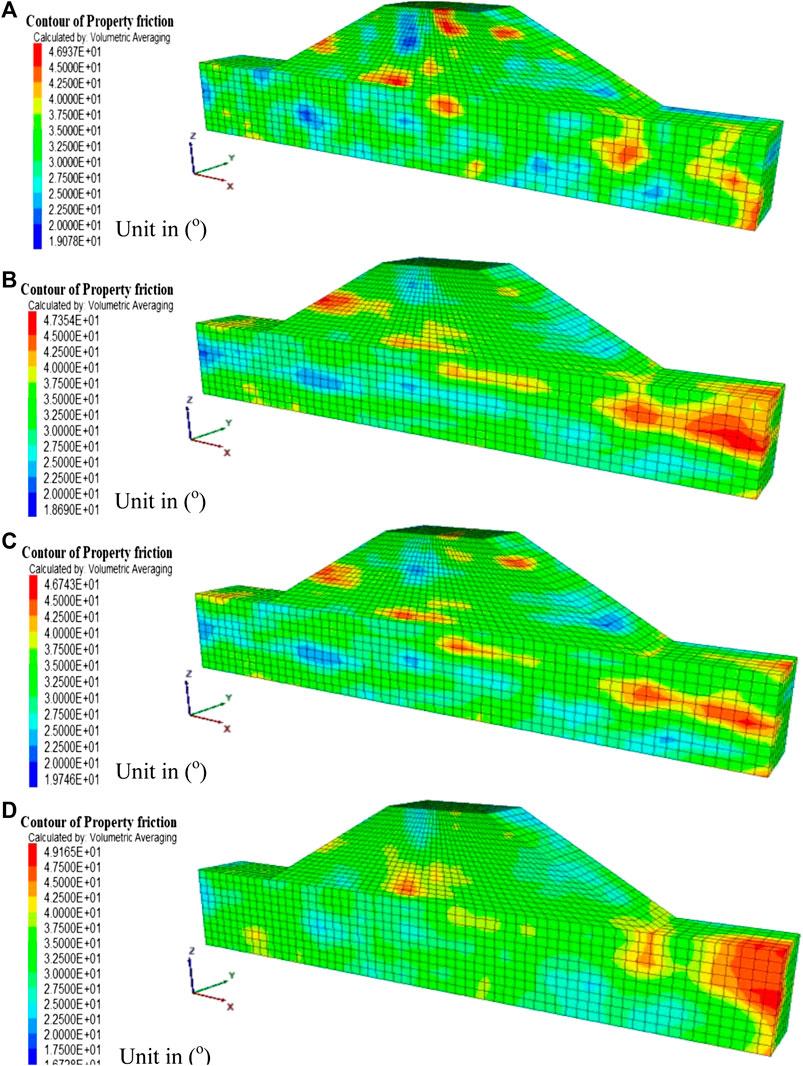
FIGURE 6. Random distribution of ϕ for both embankment and foundation soil with Lop = 3 m, COVtanϕ = 20% and, (A)δx/B = δy/B = 0.5, δz/B = 0.5; (B)δx/B = δy/B = 4, δz/B = 0.5; (C)δx/B = δy/B = 2, δz/B = 0.25; (D)δx/B = δy/B = 2, δz/B = 2.
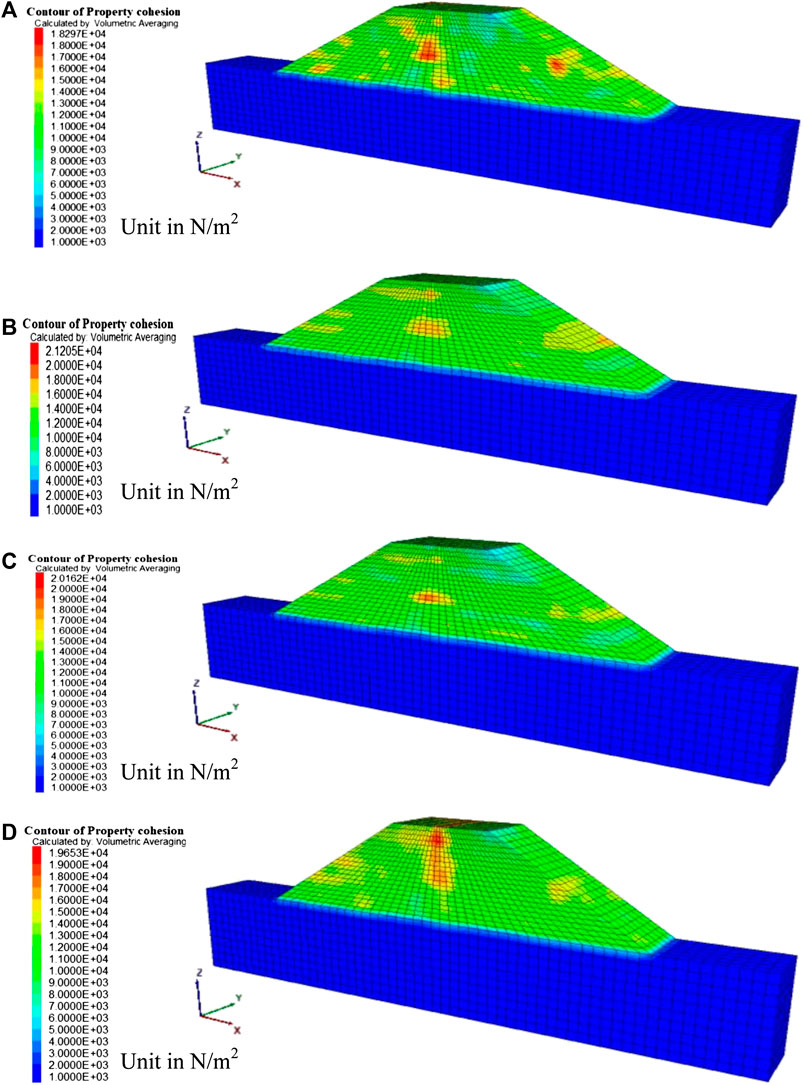
FIGURE 7. Random distribution of c for embankment soil with Lop = 3 m, COVc = 25% and, (A)δx/B = δy/B = 0.5, δz/B = 0.5; (B)δx/B = δy/B = 4, δz/B = 0.5; (C)δx/B = δy/B = 2, δz/B = 0.25; (D)δx/B = δy/B = 2, δz/B = 2.
Effect of Horizontal SOFs on the Probabilistic Bearing Capacity
Figures 8A,B demonstrate the variation in µq and COVq corresponding to different values of δx/B = δy/B for the constant values of Lop = 3 m, COVtanϕ = 20%, COVc = 25%, and δz/B = 0.5. The δx/B = δy/B, δz/B and COVtanϕ are kept as same for both embankemt and foundation soil; whereas, COVc = 25% is considered for embankment soil only. The lower value of horizontal SOF indicates that the soil friction angle field is very much erratic in horizontal directions whereas the increased value of horizontal SOF specifies the uniform nature of the soil friction angle in horizontal direction. Figure 8A depicts that the µq decreases with the increase in δx/B = δy/B values. In contrast to that, the COVq increases with δx/B = δy/B as illistrated in Figure 8B. For an instance, the values of µq decreases from 53.78 to 51.91 kPa with the increase in values of δx/B = δy/B from 0.5 to 4, the reduction in µq beyond δx/B = δy/B = 4 is quite negligible; whereas, the values of COVq increases from 3.73 to 10.55% with the increase in values of δx/B = δy/B from 0.5 to 10. However, the rate of increase in COVq beyond δx/B = δy/B = 4 is comparatively less than that of before δx/B = δy/B = 4.
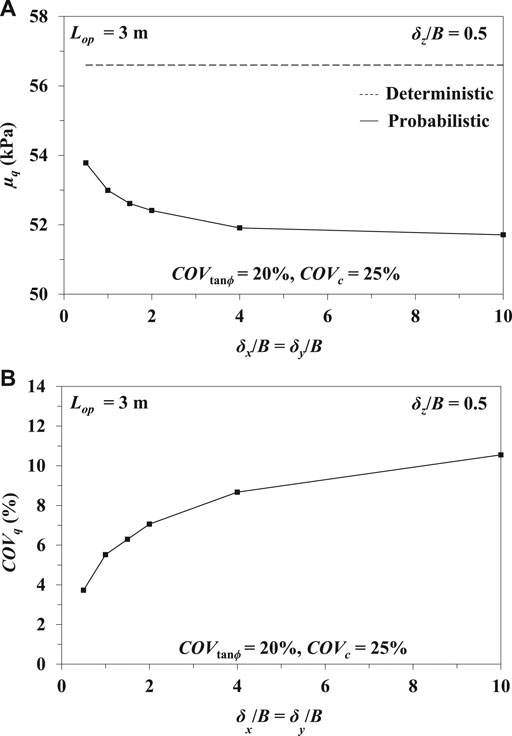
FIGURE 8. (A) Variation of µq for different values of δx/B = δy/B; (B) Variation of COVq for different values of δx/B = δy/B.
Effect of Vertical SOFs on the Probabilistic Bearing Capacity
The influences of different vertical SOFs (δz/B) on the probabilistic bearing capacity of the pavement are demonstrated in Figures 9A,B for the constant values of Lop = 3 m, COVtanϕ = 20%, COVc = 25%, and δx/B = δy/B = 2. In the present study, the values of δz/B are varied from 0.25 to 8. Unlike the horizontal SOF, the µq is found to be increasing with the increasing magnitude of δz/B. The obtained trend is also true for COVq. For an example, the value of µq increases from 52.03 to 54.57 kPa and COVq increases from 5.66 to 10.8% as the δz/B increases from 0.25 to 8. However, the rate of increase in µq and COVq beyond δz/B = 2 is considerably less than that of before δz/B = 2.
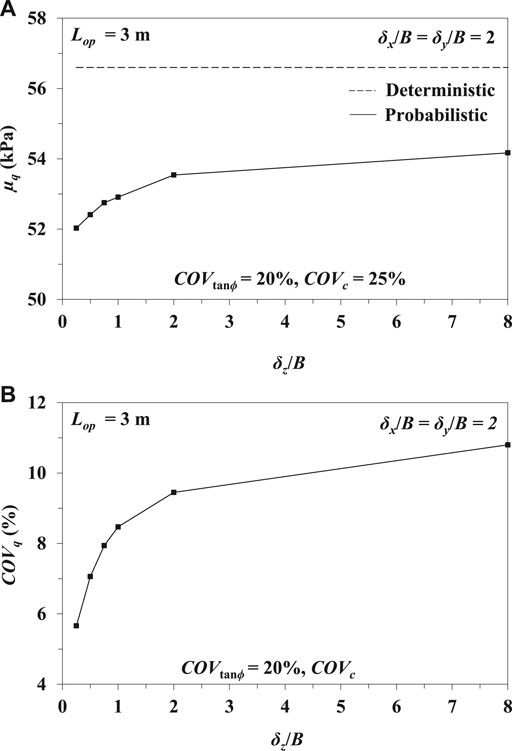
FIGURE 9. (A) Variation of µq for different values of δz/B; (B) Variation of COVq for different values of δz/B.
Effect of Soil Spatial Variability on the Failure of the System
In the present work, the failure of the pavement is presented through the maximum shear stress contour profiles. Figures 10A–C demonstrate maximum shear stress contours for the embankment as well as the foundation soil system having either homogenous soil field or spatially distributed soil field with Lop = 3 m. The ultimate state loading condition of the pavement is chosen for all the cases. Figure 10A shows the maximum shear stress profile for the deterministic analysis where the plastic zones are fully developed under the edges of the pavement and the highest magnitude of the maximum shear stress is found to be 36.22 kPa. The plastic zones are symmetric and extended to the bottom of the embankment soil; whereas, the maximum shear stress contours remain no longer symmetric when the spatial variability of the soil properties is considered. Figures 10B,C represent the maximum shear stress profile for the δx/B = δy/B = 0.5, δz/B = 0.5 and δx/B = δy/B = 2, δz/B = 2, respectively with the constant values of COVc = 25%, COVtanϕ = 20% and Lop = 3 m. It is observed that the plastic zones are not fully developed under edges of the pavement for δx/B = δy/B = 0.5, δz/B = 0.5 which may be due to the presence of higher values of shear strength properties of the soil under the pavement; whereas, they are almost developed in case of δx/B = δy/B = 2, δz/B = 2. However, in both the cases they are extended to the mid depth of the embankment. The highest values of maximum shear stress reduced from 45.28 kPa for δx/B = δy/B = 0.5, δz/B = 0.5 to 42.06 kPa for δx/B = δy/B = 2, δz/B = 2 and both the values are comparatively higher than the deterministic value.
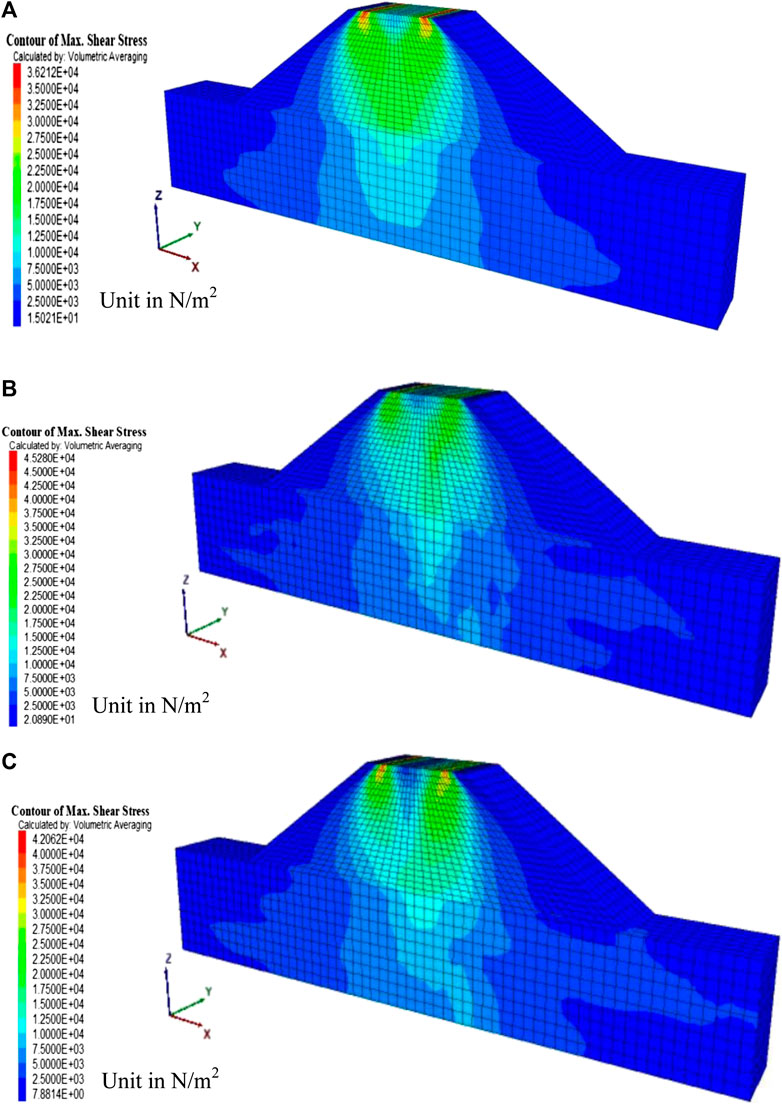
FIGURE 10. Maximum shear stress distribution for fibre-reinforced embankment with Lop = 3 m and, (A) Uniform soil properties; (B)δx/B = δy/B = 0.5, δz/B = 0.5, COVc = 25%, COVtanϕ = 20%; (C)δx/B = δy/B = 2, δz/B = 2, COVc = 25%, COVtanϕ = 20%.
Failure Probability of the Pavement
As per the design point of view, the pavement is considered as unserviceable when the applied stress on the pavement (qapp) is equal or greater than the allowable bearing capacity (qall) of the pavement. Thus, the limit state of collapse of the pavement can be expressed as qall
In the above mathematical expression
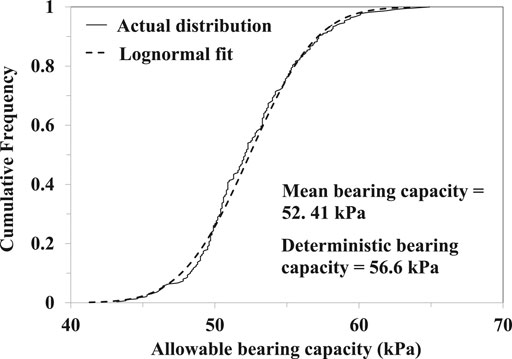
FIGURE 11. Comparison between actual distribution and the assumed theoretical lognormal distribution of allowable bearing capacity for Lop = 3 m, COVtanϕ = 20%, COVc = 25%, δx/B = δy/B = 2 and δz/B = 0.5.
Figures 12A,B indicate that the failure probability of the system decreases with the increase in FOS irrespective of horizontal SOF as well as vertical SOF, which is quite obvious. Figure 12A illustrates the variation of failure probability (pf) for different values of FOS and horizontal SOF with the constant values of Lop = 3 m, COVtanϕ = 20%, COVc = 25%, and δz/B = 0.5. For a critical value of FOS = 1, the probability of failure reduces with the increase in δx/B = δy/B. In contrast, it increases with the increasing values of δx/B = δy/B for higher factor of safety. This can be attributed as while the FOS = 1, for small values of δx/B = δy/B, the COVq is comparatively smaller than the larger values of δx/B = δy/B. Therefore, the µq tends to drop below the limiting value and the failure probability increases. However, with the increase in δx/B = δy/B, the failure probability decreases due to the increase in stability for FOS = 1. For higher values of FOS, the µq is found to be pushed above the limiting value which reduces the failure probability for small values of δx/B = δy/B. However, the increase in δx/B = δy/B causes increasing instability which in turn increases the failure probability of the system for higher FOS.
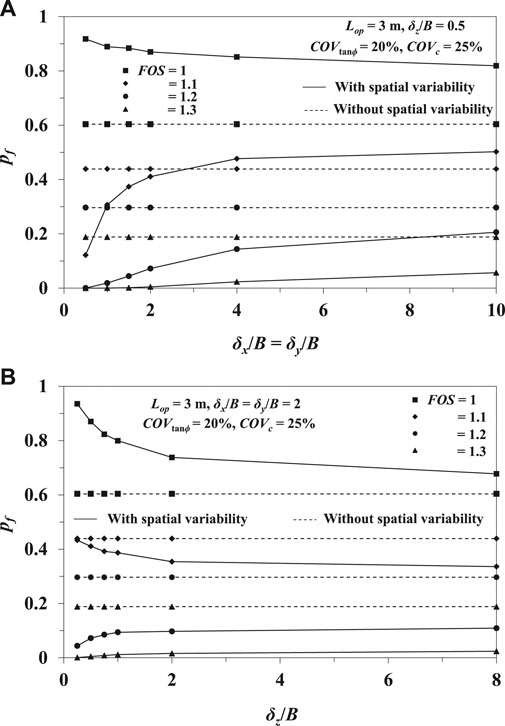
FIGURE 12. Variation of failure probability for different values of FOS with the variation of (A)δx/B = δy/B; (B)δz/B.
Similar type of response has been observed in Figure 12B which represents the variation of failure probability (pf) for different values of FOS and vertical SOF with the constant values of Lop = 3 m, COVtanϕ = 20%, COVc = 25%, and δx/B = δy/B = 2. However, in this figure, the failure probability is found to be decreasing with the increasing δz/B for FOS = 1 and 1.1. For FOS greater than 1.1, the failure probability is increasing with the increase in δz/B. Beyond a certain scale of fluctuation, the failure probability is observed to be almost insensitive with the scale of fluctuation for both the figures. The similar kind of trend has been observed by Griffiths and Fenton (2004), Chenari and Alaie (2015) and, Halder and Chakraborty (2020).
Figures 12A,B also compare the failure probability between the consideration of spatial variability and without consideration of spatial variability for different values of FOS. It is evident from the figures that the failure probability without consideration of spatial variability does not depend upon the scale of fluctuation. It is also observed in Figure 12A that for FOS = 1, the failure probability without considering the spatial variability is lower than that of considering the spatial variability. For FOS = 1.1, the probability of failure for smaller values of δx/B = δy/B is found to be lower as compared to that of without consideration of spatial variability; whereas, for higher values of δx/B = δy/B, it becomes higher than that of without considering the spatial variability. However, for FOS greater than 1.1, the failure probability without considering the spatial variability is found to be quite higher as compared to that of considering the spatial variability. For an instance, pf drops from 86.99% with the consideration of spatial variability (δx/B = δy/B = 2 and δz/B = 0.5) to 60.4% without considering the spatial variability for FOS = 1. For FOS = 1.1, the failure probability for δx/B = δy/B = 1.5 and δz/B = 0.5 becomes 37.4% which is lower as compared to 43.9% (pf corresponding to without considering the spatial variability); whereas, it increases to 50.2% for δx/B = δy/B = 10 and δz/B = 0.5. However, for FOS = 1.2, pf increases from 14.4% with the consideration of spatial variability (δx/B = δy/B = 4 and δz/B = 0.5) to 29.7% without undertaking the spatial variability. Similar kind of responses are observed in Figure 12B. However, unlike δx/B = δy/B, in case of δz/B, the probabilities of failure without considering the spatial variability are found to be higher for FOS greater than 1, as compared to that of considering the spatial variability. As an example, pf decreases from 73.8% with the consideration of spatial variability (δx/B = δy/B = 2 and δz/B = 2) to 60.4% without considering the spatial variability for FOS = 1; whereas, for FOS = 1.2, it increases from 10.9% with the consideration of spatial variability (δx/B = δy/B = 2 and δz/B = 8) to 29.7% without undertaking the spatial variability.
Conclusions
The present paper presents the three-dimensional probabilistic bearing capacity–settlement response of the pavement located on the crest of the embankment where the embankment soil is considered to be fibre-reinforced. The deterministic as well as the probabilistic studies are executed. The probabilistic parameters considered for the random field generation are taken from the previous studies. In probabilistic analyses, the effects of soil spatial variability, randomness of soil properties and different out of the plane lengths have been studied. The conclusions drawn from the study are as follows:
1. The mean bearing capacity of the pavement is found to be decreased first with increasing values of the out of the plane length of the embankment (Lop = 0.5–1 m), and after that, it starts to increase with the increase in Lop (Lop = 1–3 m). Beyond Lop = 3 m, there is no significant change in it. In contrast to that, the COVq is observed to be decreasing with the increasing value of Lop. It signifies that the consideration of different out of the plane lengths with spatial variability is quite important as it makes the problem more realistic.
2. The mean bearing capacity is found to be reducing with the increment in randomness in the soil friction angle (COVtanϕ); whereas, the COVq increases with the increase in randomness in the soil friction angle which is quite obvious as it leads to the lower strength paths for failure.
3. The mean and COV of bearing capacity of the pavement are turned up to be decreasing and increasing, respectively with the increasing values of horizontal SOF. Unlike the horizontal SOFs, the mean and COV of bearing capacity both are found to be increasing with the increasing vertical SOFs.
4. The plastic zones under the pavement edges are found to be fully developed for homogeneous soil; whereas, they are partially developed for spatially variable soil. The highest values of maximum shear stress for spatially varied soil are found to be higher than that of soil with uniform strength properties which implicates the importance of using spatial variation of the soil properties.
5. The failure probability of the pavement is found to be decreasing with the increase in scale of fluctuation for lower values of FOS; whereas, it is observed to be increasing with the increasing values of scale of fluctuation for higher values of FOS.
6. The failure probability of the pavement is observed to be 29.7% for FOS = 1.2 when the spatial variation of soil properties is not considered; whereas, it is found to be reduced to 9.73% for FOS = 1.2, δx/B = δy/B = 2, and δz/B = 2. This further signifies the importance of considering spatial variability of the soil shear strength properties.
Data Availability Statement
The raw data supporting the conclusion of this article will be made available by the authors, without undue reservation.
Author Contributions
KC generated the MATLAB and FISH codes to carry out the probabilistic study and prepared the initial draft. DC proposed the project, supervised all the works and revised the initial draft to give the final shape of the paper.
Conflict of Interest
The authors declare that the research was conducted in the absence of any commercial or financial relationships that could be construed as a potential conflict of interest.
References
Ahmed, A., and Soubra, A. -H. (2014). Reliability analysis at ultimate and serviceability limit states of obliquely loaded circular foundation. Geotech. Geol. Eng. 32, 729–738. doi:10.1007/s10706-014-9750-y
Arora, S., and Kumar, A. (2019). Bearing capacity of circular footing resting on fiber-reinforced pond ash overlying soft clay. J. Hazard. Toxic Radioact. Waste 24 (1), 04019037. doi:10.1061/(ASCE)HZ.2153-5515.0000485
Ates, A. (2016). Mechanical properties of sandy soils reinforced with cement and randomly distributed glass fibers (GRC). Compos. B. Eng. 96, 295–304. doi:10.1016/j.compositesb.2016.04.049
Babu, G. L. S., Vasudevan, A. K., and Haldar, S. (2007). Numerical simulation of fiber-reinforced sand behaviour. Geotext. Geomembr. 26, 181–188. doi:10.1016/j.geotexmem.2007.06.004
Babu, G. L. S., and Vasudevan, A. K. (2008). Strength and stiffness response of coir fiber-reinforced tropical soil. J. Mater. Civ. Eng. 20, 571–577. doi:10.1061/(ASCE)0899-1561(2008)20:9(571)
Bouaricha, L., Henni, A. H., and Lancelot, L. (2017). A laboratory investigation on shear strength behaviour of sandy soil: effect of glass fiber and clinker residue content. Studia Geotech. et Mech. 39 (4), 3–15. doi:10.1515/sgem-2017-0032
Cai, Y., Shi, B., Ng, C. W. W., and Tang, C. (2006). Effect of polypropylene fiber and lime admixture on engineering properties of clayey soil. Eng. Geol. 87, 230–240. doi:10.1016/j.enggeo.2006.07.007
Cassidy, M. J., Uzielli, M., and Tian, Y. (2012). Probabilistic combined loading failure envelopes of a strip footing on spatially variable soil. Comput. Geotech. 49, 191–205. doi:10.1061/(ASCE)GT.1943-5606.0001219
Chaple, P. M., and Dhatrak, A. I. (2013). Performance of coir fiber reinforced clayey soil. Int. J. Eng. Sci. 2 (4), 54–64.
Chen, M., Shen, S.-L., Arulrajah, A., Wu, H.-N., Hou, D.-W., and Xu, Y.-S. (2015). Laboratory evaluation on the effectiveness of polypropylene fibers on the strength of fiber-reinforced and cement-stabilized Shanghai soft clay. Geotext. Geomembr. 43, 515–523. doi:10.1016/j.geotexmem.2015.05.004
Chenari, R. J., and Alaie, R. (2015). Effects of anisotropy in correlation structure on the stability of an undrained clay slope. Georisk 9 (2), 109–123. doi:10.1080/17499518.2015.1037844
Consoli, N. C., Bassani, M. A. A., and Festugato, L. (2010). Effect of fiber-reinforcement on the strength of cemented soils. Geotext. Geomembr. 28, 344–351. doi:10.1016/j.geotexmem.2010.01.005
Correia, A. A. S., Oliviera, P. J. V., and Custodio, D. G. (2015). Effect of polypropylene fibers on the compressive and tensile strength of a soft clay, artificially stabilised with binders. Geotext. Geomembr. 43, 97–106. doi:10.1016/j.geotexmem.2014.11.008
Cristelo, N., Cunha, V. M. C. F., Gomes, A. T., Araujo, N., Miranda, T., and Lopes, M. L. (2017). Influence of fiber reinforcement on the post-cracking behaviour of a cement-stabilised sandy-clay subjected to indirect tensile stress. Constr. Build. Mater. 138, 163–173. doi:10.1016/j.conbuildmat.2017.02.010
Diab, A. A., Najjar, S., and Sadek, S. (2017). Reliability-based design of spread footings on fiber-reinforced clay. Georisk 12 (2), 135–151. doi:10.1080/17499518.2017.1398332
Fenton, G. A., and Griffiths, D. V. (2005). Three dimensional probabilistic foundation settlement. J. Geotech. Geoenviron. Eng. 131 (2), 232–239. doi:10.1061/(ASCE)1090-0241(2005)131:2(232)
Fenton, G. A., and Griffiths, D. V. (2001). “Bearing capacity of spatially random c—ϕ soils,” in Proceedings, 10th international conference on computer methods and advances in geomechanics, Tucson, AZ, 7–12 January, 2001, Vol. 1, 1411–1415.
Ghosh, A., Ghosh, A., and Bera, A. K. (2005). Bearing capacity of square footing on pond ash reinforced with jute-textile. Geotext. Geomembr. 23, 144–173. doi:10.1016/j.geotexmem.2004.07.002
Griffiths, D. V., and Fenton, G. A. (2004). Probabilistic slope stability analysis by finite elements. J. Geotech. Geoenviron. Eng. 130 (5), 507–518. doi:10.1061/(ASCE)1090-0241(2004)130:5(507)
Griffiths, D. V., Fenton, G. A., and Manoharan, N. (2002). Bearing capacity of rough rigid strip footing on cohesive soil: probabilistic study. J. Geotech. Geoenviron. Eng. 128 (9), 743–755. doi:10.1061/(ASCE)1090-0241(2002)128:9(743)
Griffiths, D. V., Huang, J., and Fenton, G. A. (2011). Probabilistic infinite slope analysis. Comput. Geotech. 38, 577–584. doi:10.1016/j.compgeo.2011.03.006
Haldar, S., and Babu, G. L. S. (2008). Effect of soil spatial variability on the response of laterally loaded pile in undrained clay. Comput. Geotech. 35, 537–547. doi:10.1016/j.compgeo.2007.10.004
Halder, K., and Chakraborty, D. (2020). Influence of soil spatial variability on the response of strip footing on geocell—reinforced slope. Comput. Geotech. 122, 103533. doi:10.1016/j.compgeo.2020.103533
Halder, K., and Chakraborty, D. (2019). Probabilistic bearing capacity of strip footing on reinforced soil slope. Comput. Geotech. 116, 103213. doi:10.1016/j.compgeo.2019.103213
Halder, K., and Chakraborty, D. (2018). Probabilistic stability analyses of reinforced slope subjected to strip loading. Geotech. Eng. J. SEAGS & AGSSEA 49 (4), 92–99.
ITASCA (2012). FLAC 3D Version 5.01 Fast Lagrangian analysis of continua in 3 dimensions. Minneapolis, MN: ITASCA Consulting Group Inc.
Jha, S. K. (2016). Reliability—based analysis of bearing capacity of strip footings considering anisotropic correlation of spatially varying undrained shear strength. Int. J. GeoMech. 16 (5), 06016003. doi:10.1061/(ASCE)GM.1943-5622.0000638
Johari, A., and Kalantari, A. R. (2016). “Probabilistic analysis of slope stability of embankment reinforced with discrete fiber,” in 5th international conference on geotechnical engineering and soil mechanics, Tehran, Iran, November 14–16, 2016.
Kasama, K., and Whittle, A. J. (2015). Effect of spatial variability on the slope stability using random field numerical limit analysis. Georisk 10 (1), 42–54. doi:10.1080/17499518.2015.1077973
Kawa, M., and Puła, W. (2019). 3D bearing capacity probabilistic analyses of footings on spatially variable c—ϕ soil. Acta Geotech 15 (6), 1453–1466. doi:10.1007/s11440-019-00853-3
Kumar, A., Walia, B. S., and Bajaj, A. (2007). Influence of fly ash, lime, and polyester fibers on compaction and strength properties of expansive soil. J. Mater. Civ. Eng. 19, 242–248. doi:10.1061/(ASCE)0899-1561(2007)19:3(242)
Li, J., Tian, Y., and Cassidy, M. J. (2014). Failure mechanism and bearing capacity of footings buried at various depths in spatially random soil. J. Geotech. Geoenviron. Eng. 141 (2), 04014099. doi:10.1061/(ASCE)GT.1943-5606.0001219
Luo, N., and Bathurst, R. J. (2018). Deterministic and random FEM analysis of full scale unreinforced and reinforced embankments. Geosynth. Int. 25 (2), 164–179. doi:10.1680/jgein.17.00040
Luo, Z., Atamturktur, S., Cai, Y., and Juang, C. H. (2011). Reliability analysis of basal – heave in a braced excavation in a 2D random field. Comput. Geotech. 39, 27–37. doi:10.1016/j.compgeo.2011.08.005
Michalowski, R. L., and Cermak, J. (2002). Strength anisotropy of fiber-reinforced sand. Comput. Geotech. 29, 279–299. doi:10.1016/S0266-352X(01)00032-5
Moghal, A. A. B., Chittoori, B. C. S., Basha, B. M., and Al-Shamrani, M. A. (2017). Target reliability approach to study the effect of fiber reinforcement on UCS behaviour of lime treated semiarid soil. J. Mater. Civ. Eng. 1, 04017014. doi:10.1061/(ASCE)MT.1943-5533.0001835
Moghal, A. A. B., Chittoori, B. C. S., and Basha, M. (2016). Effect of fiber reinforcement on CBR behaviour of lime-blended expansive soils: reliability approach. Road Mater. Pavement Des. 1, 20. doi:10.1080/14680629.2016.1272479
Phoon, K.-K., and Kulhawy, F. H. (1999). Evaluation of geotechnical property variability. Can. Geotech. J. 36, 625–639. doi:10.1139/t99-039
Prabakar, J., and Sridhar, R. S. (2002). Effect of random inclusion of sisal fiber on strength behaviour of soil. Constr. Build. Mater. 16, 123–131. doi:10.1016/S0950-0618(02)00008-9
Ranjan, G., Vasan, R. M., and Charan, H. D. (1996). Probabilistic analysis of randomly distributed fiber-reinforced soil. J. Geotech. Eng. 122 (6), 419–426. doi:10.1061/(asce)0733-9410(1996)122:6(419)
Sharma, V., and Kumar, A. (2017). Influence of relative density of soil on performance of fiber-reinforced soil foundation. Geotext. Geomembr. 45, 499–507. doi:10.1016/j.geotexmem.2017.06.004
Sharma, V., and Kumar, A. (2019). Numerical study of ring and circular foundations resting on fiber-reinforced soil. Int. J. Geotech. Eng. 1, 13. doi:10.1080/19386362.2019.1603680
Singh, H. P., and Bagra, M. (2013). Improvement in CBR value of soil reinforced with jute fiber. Int. J. Innov. Res. Sci. Eng. Technol. 2 (4), 3448–3452.
Suchomel, R., and Masin, D. (2009). Comparison of different probabilistic method for predicting stability of a slope in spatially variable c—ϕ soil. Comput. Geotech. 37, 132–140. doi:10.1016/j.compgeo.2009.08.005
Syed, M., GuhaRay, A., Agarwal, S., and Kar, A. (2020). Stabilization of expansive clays by combined effects of geopolymerization and fiber reinforcement. J. Inst. Eng. India Ser. A 101 (1), 163–178. doi:10.1007/s40030-019-00418-3
Syed, M., and GuhaRay, A. (2020). Effect of fiber reinforcement on mechanical behaviour of alkali-activated binder-treated expansive soil: reliability-based approach. Int. J. GeoMech. 20 (12), 04020225. doi:10.1061/(ASCE)GM.1943-5622.0001871
Tang, C.-S., Li, J., Wang, D. –Y., and Shi, B. (2016). Investigation on the interfacial mechanical behaviour of wave-shaped fiber reinforced soil by pullout test. Geotext. Geomembr. 44 (6), 1–12. doi:10.1016/j.geotexmem.2016.05.001
Tang, C., Shi, B., Gao, W., Chen, F., and Cai, Y. (2007). Strength and mechanical behaviour of short polypropylene fiber reinforced and cement stabilized clayey soil. Geotext. Geomembr. 25, 194–202. doi:10.1016/j.geotexmem.2006.11.002
Toh, W., Raju, K., Yeo, C. H., Goh, S. H., and Tan, V. B. C. (2017). “Experimental and numerical analysis of fiber-reinforced composite pipes subjected to underground blasts,” in 21st international conference on composite materials, Xi’an, China, August 20–25, 2017.
Wang, Y., Guo, P., Lin, H., Li, X., Zhao, Y., Yuan, B., et al. (2019). Numerical analysis of fiber-reinforced soils based on the equivalent additional stress concept. Int. J. Geo. Mech. 19 (11), 04019122. doi:10.1061/(ASCE)GM.1943-5622.0001504
Keywords: fibre-reinforced embankment, probabilistic analysis, spatial variability, finite difference method, Monte Carlo simulations, out of the plane length of the embankment
Citation: Choudhuri K and Chakraborty D (2021) Probabilistic Bearing Capacity of a Pavement Resting on Fibre Reinforced Embankment Considering Soil Spatial Variability. Front. Built Environ. 7:628016. doi: 10.3389/fbuil.2021.628016
Received: 10 November 2020; Accepted: 15 January 2021;
Published: 08 March 2021.
Edited by:
Castorina Silva Vieira, University of Porto, PortugalReviewed by:
Sanjay Shrawan Nimbalkar, University of Technology Sydney, AustraliaDeepthi Dilip, Birla Institute of Technology and Science, United Arab Emirates
Copyright © 2021 Choudhuri and Chakraborty. This is an open-access article distributed under the terms of the Creative Commons Attribution License (CC BY). The use, distribution or reproduction in other forums is permitted, provided the original author(s) and the copyright owner(s) are credited and that the original publication in this journal is cited, in accordance with accepted academic practice. No use, distribution or reproduction is permitted which does not comply with these terms.
*Correspondence: Debarghya Chakraborty, ZGViYXJnaHlhQGNpdmlsLmlpdGtncC5hYy5pbg==