 Tracy Kijewski-Correa
 David B. Roueche
 Khalid M. Mosalam
 David O. Prevatt
 Ian Robertson
- 1Department of Civil and Environmental Engineering and Earth Sciences and Keough School of Global Affairs, Integration Lab, University of Notre Dame, Notre Dame, IN, United States
- 2Department of Civil and Environmental Engineering, Auburn University, Auburn, AL, United States
- 3Department of Civil and Environmental Engineering, Pacific Earthquake Engineering Research Center, University of California Berkeley, Berkeley, CA, United States
- 4Engineering School of Sustainable Infrastructure and Environment, University of Florida, Gainesville, FL, United States
- 5Department of Civil and Environmental Engineering, University of Hawaii at Manoa, Honolulu, HI, United States
Since its founding in 2018, the Structural Extreme Events Reconnaissance (StEER) Network has worked to deepen the capacity of the Natural Hazards Engineering (NHE) community for coordinated and standardized assessments of the performance of the built environment following natural hazard events. This paper positions StEER within the field of engineering reconnaissance and the Natural Hazards Engineering Research Infrastructure (NHERI), outlining its organizational model for coordinated community-led responses to wind, seismic, and coastal hazard events. The paper’s examination of StEER’s event response workflow, engaging a range of hardware and delivering a suite of products, demonstrates StEER’s contributions in the areas of: workflow and data standardization, data reliability to enable field-observation-driven research & development, efficiency in data collection and dissemination to speed knowledge sharing, near-real- time open data access for enhanced coordination and transparency, and flexibility in collaboration modes to reduce the “overhead” associated with reconnaissance and foster broad NHE community engagement in event responses as part of field and virtual assessment structural teams (FAST/VAST). StEER’s creation of efficient systems to deliver well-documented, reliable data suitable for diverse re-uses as well as rapidly disseminated synopses of the impact of natural hazard events on the built environment provide a distinctive complement to existing post-event reconnaissance initiatives. The implementation of these policies, protocols and workflows is then demonstrated with case studies from five events illustrating StEER’s different field response strategies: the Nashville, Tennessee Tornadoes (2020) – a Hazard Gradient Survey; the Palu Earthquake and Tsunami in Indonesia (2018) – a Representative Performance Study; the Puerto Rico Earthquakes (2019/2020) – using Targeted Case Studies; Hurricane Laura (2020) – leveraging Rapid Surveys to enable virtual assessments; and Hurricane Dorian (2019) in the Bahamas – a Phased Multi-Hazard Investigation. The use of these strategies has enabled StEER to respond to 36 natural hazard events, involving over 150 different individuals to produce 45 published reports/briefings, over 5000 publicly available app-based structural assessments, and over 1600 km (1000 mi) of street-level panoramic imagery in its first 2years of operation.
Introduction
As the most faithful living laboratory for the study of the built environment’s performance, field observations play a critical role in fueling what the authors define as the Data to Knowledge (D2K) Life Cycle following natural hazard events. Depicted in Figure 1A, this feedback loop has historically responded to a hazard-affected community by (1) gathering field observations that (2) inform hypothesis-driven research, (3) operationalized through various regulatory mechanisms to generate top-down mitigation measures taking the form of policies, codes and standards to increase the requirements or restrictions on construction in response to identified vulnerabilities. Existing knowledge transfer pipelines then (4) propagate this new construction guidance back to affected communities. Thus, as the initiator of the this D2K feedback loop, field observations remain one of the most valuable means to understand the connection between geospatial hazard data, site-specific load effects and ensuing response of structures, as well as the more complex questions of how this performance in turn affects households and communities (Edge et al., 2020).
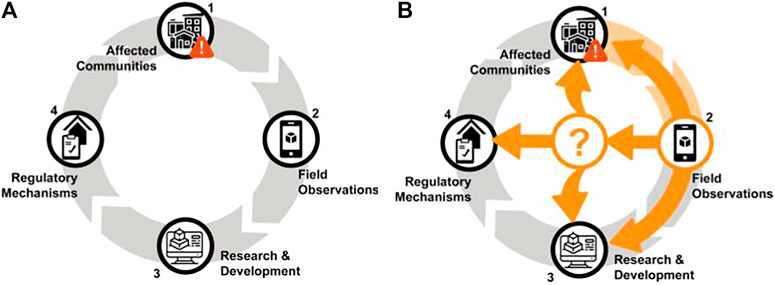
FIGURE 1. Data to Knowledge Life Cycle: (A) traditional 4-step cycle in grey and (B) opportunities for Field Observation organizations working in first quarter of the life cycle to accelerate feedback process through new conduits in orange.
However, this D2K Life Cycle in Figure 1A can take years to drive change in affected communities, opening opportunities to create new pathways that accelerate the translation of knowledge generated through field observations to various stakeholders in the D2K Life Cycle, particularly affected communities (Figure 1B). While different constituencies that respond following natural hazard events are themselves exploring ways to generate these new pathways, the authors posit that the Natural Hazards Engineering (NHE) community has a particularly unique opportunity, and arguably responsibility, given it occupies critical roles at multiple points in this cycle. In addition to collecting field observations (Figure 1, step 2), the NHE community has made considerable advances in experimental, computational and hybrid simulations informed by these field observations (Figure 1, step 3), as well as providing expert testimony to policy decisions and driving the consensus processes that revise codes and standards (Figure 1, step 4). Moreover, the NHE community is seeking to dramatically transform its capacities for these varied roles through more granular risk assessment, performance-based design and holistic evaluations of community resilience, all of which depend upon or at minimum are best informed by reliable and timely collection of field observations.
In response to these needs and desiring a more coordinated response to hazard events by the NHE community, the US National Science Foundation (NSF) issued EAGER funding for the formation of the Structural Extreme Events Reconnaissance (StEER) Network in 2018. NSF’s impetus for the creation of StEER centered on better coordinating and standardizing post-event reconnaissance of the built environment, noting that responding teams had historically worked independently with little coordination, collecting data that was often not shared with the NHE community in any reusable way. In response, StEER offered a venue where members of the NHE community could dynamically form teams in response to a natural hazard event and collectively execute standard data collection protocols to generate high-quality communal data shared openly to inform diverse lines of continued research. StEER also established new pathways to more rapidly synthesize and disseminate collective knowledge from these efforts through short-form briefings and long-form reports shared with diverse audiences. More importantly, as a hazard-agnostic organization, StEER was uniquely positioned to cross-cut and unify the hazard communities under this shared vision.
Over the past 2 years, the authors, as StEER’s initial Leadership Team, have worked to usher in this paradigm shift through an emphasis on (i) capacity building - promoting data standards, best practices, and training for field reconnaissance, (ii) coordination – facilitating early, efficient and impactful event responses, and (iii) collaboration - broadly engaging communities of research, practice and policy to accelerate learning from natural hazard events. This was made possible by building upon the long history of post-event reconnaissance by past and contemporary organizations, while capitalizing on new technologies and advances in collaborative research infrastructure. This has in turn enabled StEER to make a number of contributions in the areas of: workflow and data standardization, data reliability to enable field-observation-driven research & development, efficiency in data collection and dissemination to speed knowledge sharing, near-real-time open data access for enhanced coordination and transparency, and flexibility in collaboration modes to reduce the “overhead” associated with reconnaissance and foster broad NHE community engagement in event responses.
These contributions are demonstrated in this paper, which first positions StEER and its organizational model within the wider landscape of forensic engineering and post-event reconnaissance. The paper then steps through StEER’s event response workflow, including engaged hardware platforms, field response strategies, data enrichment and quality control processes, and resulting products: detailed reports and well-documented data suitable for diverse re-uses. The paper closes with illustrative examples of five different field response strategies, highlighting some of the notable observations and lessons learned in piloting this new initiative over the past 2 years. Before doing so, it is important to note that StEER is in its infancy. The confines of a manuscript are insufficient to capture all the details of these dynamic (and continuously evolving) organization and its decision processes, policies, protocols and workflows. Thus, throughout the discussions that follow, the authors will refer interested readers to various handbooks, guidelines and other resources whose latest versions are housed on the StEER website1.
Origins and Opportunities
The understanding of failures is central to advancing the state-of-the-art in NHE, as evidenced from the impact of Forensic Engineering to promote learning from the rare cases of building collapse and progressive collapse under service conditions (Delatte, 2008). In natural hazard events, the challenge then lies in scaling up the essential principles of Forensic Engineering to widely canvass the failure of hundreds or thousands of structures and then effectively parsing and sharing that valuable information (NRC, 2007). Building on the long-standing tradition of learning from disasters (Wartman et al., 2020), the NHE community has worked for more than half a century to achieve the effective scale up of these principles. The 1971 San Fernando earthquake is the first documented post-earthquake reconnaissance mission in the archives of the Earthquake Engineering Research Institute (EERI) Learning From Earthquakes (LFE) program (EERI, 1971), subsequently followed by a number of other notable US events (EERI, 1989; Hall et al., 1994). In that same period, the US Army Corps of Engineers (USACE), National Institute of Standards and Technology (NIST) and the Federal Emergency Management Agency (FEMA) spearheaded investigations of major hurricanes and later tornadoes (USACE, 1965; Sparks, 1990; FEMA, 1992; FEMA, 1993; FEMA, 1999; FEMA, 2005a,b; FEMA, 2006; FEMA, 2012). Internationally, major tsunamis were similarly documented by teams during this same timeframe (Shimamoto et al., 1995; CAEE, 2005). Building on these early efforts, the number of post-disaster investigations, particularly led by academics, has steadily risen (Butcher et al., 1988; O’Rourke et al., 1990; Dickenson and Werner, 1996; Miller, 1998; Sezen et al., 2000; Prevatt et al., 2011; Chen et al., 2016; Gurley and Masters 2011; Kuligowski et al., 2014; Kijewski-Correa et al., 2018; Synolakis and Kong, 2006; Kennedy et al., 2011; Yeh et al., 2013; Tomiczek, et al., 2014; Tomiczek, et al., 2017), due to both growth in the field of disaster science/engineering and the increasing frequency of damaging events. Unfortunately, while some clearinghouses and event-specific databases were established during this time, coordination and practices around data sharing were inconsistent, with many valuable datasets maintained as proprietary, for a variety of reasons, or shared selectively with colleagues and collaborators.
The Geotechnical Extreme Events Reconnaissance (GEER) Association shifted this paradigm toward community-wide coordinated reconnaissance with a governance model that placed shared data and knowledge ahead of individual research gains (GEER, 2014). While GEER set the standard for such collaboratives within the NHE community, much has changed since GEER’s founding. Emerging technologies for rapid assessment of damage, mobile platforms for collecting and sharing data, and increasingly agile modes of virtual collaboration and data fusion have dramatically transformed the NHE community’s potential modes of fieldwork. Advances in ubiquitous technologies such as mobile devices with high-resolution cameras and web-based platforms that enable the open exchange of content generated by diverse actors have radically transformed the modalities for post-event data gathering, processing and dissemination. With the global population’s increased access to smartphones and social media, the barriers to generating and sharing web content have dissolved, effectively “instrumenting” the entire planet. The seamlessness, expansiveness and efficiency of these information flows have created the potential to broaden the community that reconnaissance engages and serves. In an attempt to mainstream these new digital workflows and flexible online collaboration models, the authors’ piloted a NHE community response to the 2017 hurricane season, which initiated with a GEER-sponsored response to Hurricane Harvey (Kijewski-Correa et al., 2018; Pinelli et al., 2018; Prevatt et al., 2018; Cox et al., 2019). This helped to inform their subsequent launch of the StEER network in 2018, which formalized these digital modalities of perishable data collection and knowledge generation within the NHE community, including the potential for strategic sampling to swiftly generate large volumes of geotagged damage assessments for statistical analysis of underlying damage patterns (Roueche et al., 2018). More importantly, the arrival of the Natural Hazards Engineering Research Infrastructure (NHERI) signaled a departure from the historical silos separating hazards and disciplines by offering communal research infrastructure. Event responses could now be backed by investments in shared hardware for field data collection (Berman et al., 2020), cyberinfrastructure for streamlined data curation (Rathje et al., 2017; Pinelli et al., 2020), and opportunities for data re-use to inform backend computational simulations (Deierlein et al., 2020). With the arrival of NHERI Converge and its network of extreme events reconnaissance and research (EER) organizations (Peek et al., 2020), StEER and GEER both have new potentials for interdisciplinary investigations and longitudinal studies. Today, technology and shared infrastructure have closed the gap between citizens tweeting self-documented damage in their community, the StEER members conducting follow-up forensic assessments with their personal smartphones with RAPID EF drones overhead, and the mission agencies reviewing those assessments on NHERI DesignSafe real-time communication platforms (i.e., Slack). These experiences have affirmed that a broad community, well beyond academics, has the potential to contribute to and benefit from the information generated by Converge’s EERs.
Unfortunately, those benefits have not always reached affected communities (Kendra and Gregory, 2019), requiring an intentional effort to more efficiently channel the NHE community’s expert assessments and learnings back to affected communities and the diverse stakeholders supporting their recovery. Federally-mandated responses such as the FEMA Mitigation Assessment Teams (MATs) and NIST Disasters and Failure Studies efforts excel at conducting expert assessments that capture lessons learned from a disaster that are then shared with affected communities, policy makers, and other stakeholders to improve regulatory systems (USGS, 2000; Milano, 2015). However, the data collected in these efforts is typically not widely available to the NHE community in any standardized way, details of the data sampling methods are typically lacking, and the reports culminating from these efforts typically take months or even years to produce, although this limitation is sometimes offset with publication of intermediate advisories (e.g., FEMA, 2005c). Thus, there is an opportunity within the NHE community to more swiftly respond to events in a way that balances both the need to return practical knowledge to the affected communities and the need to generate high quality data suitable for academic research. The remainder of this paper will focus on the policies, protocols and workflows that have enabled StEER to distinctively address this two-pronged need and in a manner that is complementary to existing post-disaster reconnaissance efforts.
Organizational Model
Funded under an NSF EAGER Award, StEER has operated to date under the leadership of the authors. The first author serves as the Director overseeing StEER’s core operations and governance, liaising with other NSF-funded EERs in event responses under the NHERI Converge Leadership Corps as well as other partnering professional societies, agencies, firms and technical organizations. The last three authors serve as the respective Associate Directors for Seismic, Wind and Coastal Hazards, liaising with individuals and organizations affiliated with those hazard communities in support of event responses and guiding the technical requirements of assessment workflows tailored for these hazards. As the Associate Director for Data Standards, the second author works across these hazard communities as the architect of StEER’s data workflows and its Data Enrichment and Quality Control (DEQC) process discussed in Data Enrichment and Quality Control. While StEER’s governance is presently expanding through a formal StEERing Committee, Working Groups and other advisory bodies, these directors currently make the decisions to activate the network in response to an event.
StEER membership is open to those in the natural hazard engineering and allied fields, with enrollment simply requiring submission of an application available through the StEER website2 and acceptance of the terms of participation in StEER’s Member Guidelines (Kijewski-Correa et al., 2019a). The leadership team coordinates and supports the efforts of hundreds of StEER members worldwide, largely natural hazard engineers from academia, the private sector and government agencies, in response to a hazard event of interest. The ability to draw upon these members to swiftly form teams in response to an event, noting that these individuals may have no prior experience working together, relies in part on the robust NHERI research infrastructure that has been put in place (for example, providing access to a common Slack workspace for rapid coordination and dissemination by diverse teams centered around a common event of interest), but also in the rational way StEER evaluates members’ prior experience, assigns members to levels (described below), and builds their capacity to elevate to higher membership levels through resources managed in a Shared Google Drive accessible to all members.
Building on concepts piloted in the earthquake and post-windstorm reconnaissance communities (Womble et al., 2008; Barrington et al., 2012), StEER sought to broaden participation of its members by valuing virtual reconnaissance equal to the traditional forms of field-based reconnaissance. This included recognizing the role of virtual reconnaissance as an important education and communications tool for civil engineering students, as first demonstrated through the Wind Hazard Damage Assessment Group3 established by the fourth author in 2012. This established a model for online self-publication of forensic reports within days of wind hazard events by students using available online information sources. In 2015, Virtual Earthquake Reconnaissance Teams (VERTs)4 were formed for seismic hazards (Fischer and Hakhamaneshi, 2019), adopting a similar model serving younger EERI members preparing a slide deck briefing for the LFE Executive Committee.
Seeking to formalize this further, StEER defined two modalities for member participation: Virtual Assessment Structural Teams (VASTs) who work remotely to compile relevant data and analyze observations from the field and Field Assessment Structural Teams (FASTs) who collect data under the traditional conception of field reconnaissance. Member eligibility to participate within these VASTs and FASTs is a function of their past experience and levels of training in post-event reconnaissance, with each member assigned to one of four levels, as outlined in Table 1. Those new to the field of post-event reconnaissance enter StEER as Level 1 members, working on VASTs to build up experience necessary to advance to StEER Level 2 where they can serve as FAST trainees, mentoring under more experienced Level 3 or 4 members in the field, with the latter being seasoned reconnaissance experts capable of leading FASTs on StEER field responses. Less experienced members such as undergraduate and graduate students can accelerate their progression through the StEER qualification tiers by serving as Data Librarians, charged with executing StEER’s rigorous DEQC process, and in doing so, gain valuable experience in the principles of Forensic Engineering and StEER’s data standards. The roles of StEER’s leadership and the engagement of its VASTs, FASTs and Data Librarians in StEER’s event response workflows is discussed in the following section.
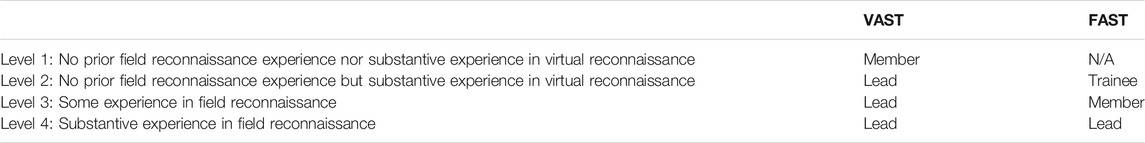
TABLE 1. Membership levels and corresponding participation levels.
Event Response
The StEER Leadership monitors for natural hazard events that would warrant a formal response, also responding to requests for activation of the network directed by its members, partners or other EERs via Converge. Given finite resources, StEER must make judicious decisions regarding when to activate the network and the associated level of response. Admittedly, this can be highly speculative and must consider StEER’s focus on evaluating the effectiveness of design practices and mitigation measures focused on the structural load path, which emphasizes hazards inducing dynamic load effects at the expense of other hazards like inland flooding or wildfires. It is thus important to position StEER’s investigations within the wider landscape of organizations responding to natural hazard events with complementary intentions to document other hazards and contributors to community resilience such as losses associated with non-structural damage, service disruption, and other human, environmental and societal impacts. While each organization has a specific mandate, these collective inquiries are now capable of creating a more complete picture of the impact of natural hazard events on our communities (Peek et al., 2020).
Given StEER’s desire to deploy quickly to capture perishable data before it is greatly disturbed by recovery activities, event response decisions must be made based on the information available immediately after the event. It is then expected that the research community can use this early-access data to inform subsequent field investigations with specific hypotheses and more focused data collection, leveraging the NSF RAPID funding mechanism or other sources. The evaluation of this evolving information considers both the intensity of the hazard, as well as the potential the event offers to generate new knowledge on the performance of the built environment. While high-intensity events such as major hurricanes (Category 3 or higher) consistently warrant consideration, even moderate-intensity events have warranted responses, particularly if they offer the ability to evaluate recent changes in construction practices, to document performance of typologies that are comparatively under-investigated, or resulted in unique compound or cumulative hazard exposure. International events, which have considerable logistical challenges and expense, also deserve careful consideration when the hazard characteristics or built environment vulnerabilities have important corollaries to US hazard exposure or construction practices. Given that StEER is still building out its organization, it has thus prioritized domestic responses to deepen its capacity and test its protocols. While engaging in only a select number of international responses to date, StEER anticipates building greater international partnerships to do so more effectively in the future. The complete catalog of StEER Event Responses is available online5.
With this context in mind, StEER has adopted a three-tier response activation protocol:
• Tier 1: hazard events that have little potential to generate new knowledge on the performance of the structural load path, yet still warrant commentary from StEER to emphasize key takeaways for policy and practice. These takeaways are communicated through an Event Briefing authored by StEER Leadership with the possible participation of a small pool of interested StEER members.
• Tier 2: hazard events with the potential to generate new knowledge on the performance of the structural load path. In such cases StEER will activate its VAST to begin assembling publicly available information, compiled in a detailed Preliminary Virtual Reconnaissance Report (PVRR) that will inform whether to further escalate the response to Tier 3.
• Tier 3: hazard events with confirmed potential to generate new knowledge on the performance of the structural load path. In such cases StEER will activate its FAST to collect field observations, culminating in an Early Access Reconnaissance Report (EARR) followed by a curated dataset.
It is important to emphasize that this tiered-response model relies heavily upon virtual reconnaissance, reiterating the VAST’s value to knowledge generation and the potential for broad NHE community engagement through this more flexible mode of participation.
The following sections offer further details on elements supporting this tiered-response model. With particular emphasis on Tier 3, Field Response Workflow explains the process of initiating a field response, with Hardware Platforms introducing the equipment that may be engaged in the different Field Response Strategies. Data Enrichment and Quality Control then describes the process applied to data collected in the field, with Event Response Products introducing the outputs of this tiered-response model.
Field Response Workflow
Figure 2 provides a visual representation of the personnel activated and participating at each phase of a Tier 3 response, as well as the products generated in each phase. Tier 3 responses still initiate with a phase of Virtual Reconnaissance, with a geographically distributed VAST working to compile information from social media, news outlets, local authorities and mission agencies to inform the PVRR, which (like all of StEER’s narrative products) is collaboratively written in real-time using Google Documents stored on the Google Drive shared with all StEER members. Participation in this VAST (and the eventual FAST) is solicited shortly after the event through a mass email to StEER members and announcements posted on multiple NHERI DesignSafe Slack channels and StEER’s website. StEER does not limit the size of the VAST, and participants customarily devote several distributed hours to the effort, as their time allows. Table 2 summarizes the roles of the StEER leadership in this first phase of the workflow, which includes the engagement of NHERI Converge to begin coordinating across other EERs also responding to the event.

FIGURE 2. Evolution of products and personnel across the three phases of a typical StEER field response.
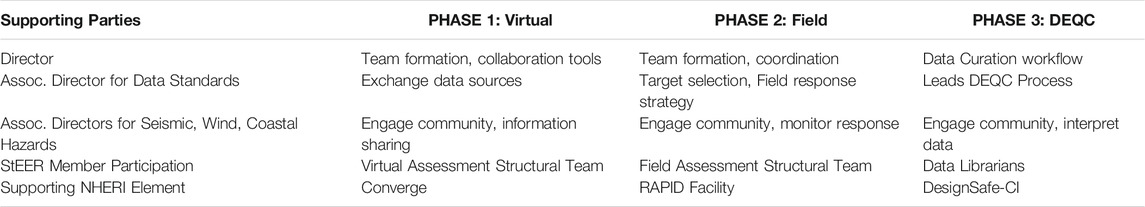
TABLE 2. Organizational structure and roles in event response phases.
As the first product of the workflow in Figure 2, the PVRR informs the design of the next phase of Field Reconnaissance. The field response may deploy multiple parallel or sequential FASTs, based on levels of access and the adopted field response strategy. The size of the FASTs is capped given the resource constraints on available rental cars/hotel rooms in the impacted area and available budget. As the number of interested StEER members often exceeds available slots, those not selected for the FAST often continue to participate on the VAST. Though rare, if there is not sufficient FAST interest, StEER will demote the response back down to Tier 2.
FAST members commit to deploy for a few days to a week (depending on the scope of the response and travel time), in addition to time spent before and after the deployment in preparations and data curation tasks. While VAST effort is not financially compensated, FASTs have all travel and equipment rental expenses reimbursed by NSF funds, receiving a per diem to offset the costs of participation for each day in the field. Drawing from the individuals responding to the aforementioned call for participation, the FAST’s composition is dictated by the required hazard/typology/methodological expertise, member availability, and balance of experience to include at least one Level 2 trainee and a Level 4 FAST lead. In many cases, the proximity of members to the affected area heavily influences team composition, as it can speed the collection of valuable forensic evidence before cleanup, debris removal, repairs or roof tarping initiates. Leveraging this proximity, StEER has been able to begin collecting data as early as hours after an event.
As outlined in Table 2, StEER leadership takes a particularly active role in designing the field response, adopting one of StEER’s five field response strategies, discussed later in Field Response Strategies. The selected strategy depends on a variety of factors related to the hazard characteristics, the built environment characteristics, FAST expertise, available equipment and site conditions. The StEER leadership will then work with the FAST to define broad objectives for the field response, generally not focusing on a specific class of construction like traditional hypothesis-driven research that may, for example, study solely unreinforced masonry buildings or metal building systems. Instead, StEER’s objectives center on canvassing performance more broadly to generate data that can be valuable to a wide range of the NHE community. The adopted strategy and its objectives are captured in a Pre-Deployment Briefing. This internal document guiding the FAST includes: team structure, objectives, itinerary (coverage, dates), equipment, logistics, maps, access/conditions, preparation instructions, standard StEER resources, third party resources, and local points of contact. As discussed later in Event Response Products, these Pre-Deployment Briefings are curated with each StEER dataset (see Roueche et al. (2020a)) Directory D0 for an example).
A key element of the Pre-Deployment Briefing is the identified targets for the FAST. Target selection initiates by cataloging any field observations of the hazards in a Google Map (see example from Hurricane Laura in Supplementary Figure S1), as well as reviewing simulations of the spatial distribution of hazard intensity, post-event satellite imagery, inventory data and notable structures/regions identified in the PVRR. While the need to mobilize quickly before forensic evidence is significantly disturbed does not permit a robust solicitation of community input as part of target selection and mission design, notable case study structures or geographic areas of interest are exchanged by the research community and practitioners on the DesignSafe Slack channels. All these sources of information are used to define FAST targets that operate within the adopted field response strategy, responsive to community-sourced targets of opportunity, and canvas the various building and infrastructure classes of interest. Targets can take the following forms: driving routes (e.g., roads that move across the hazard gradient), clusters of buildings (e.g., a specific subdivision with desired characteristics such as age or style of construction), or specific structures (e.g., a notable collapse documented in PVRR). These targets are also compiled in a Google Map as demonstrated by the case of Hurricane Dorian in Figure 3 (see additional example from Hurricane Laura in Supplementary Figure S2). This phase also works closely with the NHERI RAPID Facility (Berman et al., 2020) to obtain necessary hardware (discussed in Hardware Platforms), depending on the adopted field response strategy (discussed in Field Response Strategies).
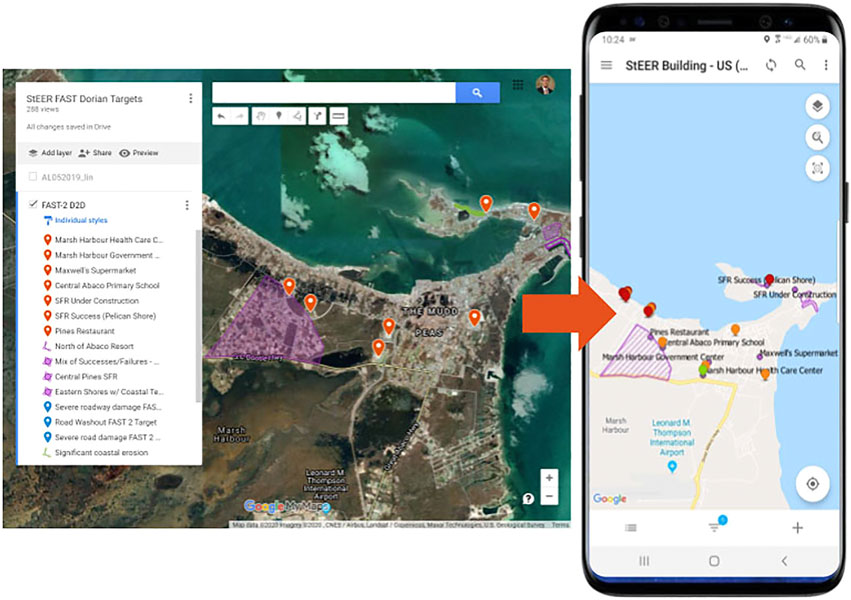
FIGURE 3. Example of Google Map with target selection for FASTs responding to Hurricane Dorian in the Bahamas, imported as a cached layer into the Fulcrum mobile app, which also visualizes via the color-coded pins the location and global damage rating of assessments conducted by the FAST.
Using the best practices in StEER’s FAST Handbook (Kijewski-Correa et al., 2019b), data collection over days or weeks is supported by regular communications with the Field Response Coordinator (typically the first author) and the Associate Director for Data Standards (the second author) to troubleshoot, resolve issues, secure site access, and share new intel. These two individuals communicate the FAST’s findings with the wider community and VAST members working on related reports using DesignSafe Slack channels. FASTs aid in these communications by sharing Daily Summaries that culminate in the second product of the workflow: the EARR. These Daily Summaries are curated with each StEER dataset (see Roueche et al. (2020a) Directory D8 for an example). It is important to note that even while the FAST is collecting data in the field, the VAST continues to work remotely to share information from other efforts on DesignSafe Slack to aid in the interpretation of the FAST’s field observations. More importantly, the VAST is able to access the FAST’s app-based structural assessments in near-real time (connectivity permitting) to support the analysis and synthesis of field observations for the EARR. These open data platforms are also available to the wider NHE community and public-at-large, as discussed further in Dissemination Pathways, reiterating the importance of creating flexible modalities for the wider community to access the data throughout the workflow.
This third and final phase in Figure 2 is focused on Data Enrichment and Quality Control. The scope of the DEQC process depends on the type of data collection methodology (hardware platform) adopted and field response strategy. The DEQC process is intended to ensure the curated dataset is complete and standardized so it can be re-used by others. This DEQC process is discussed in Data Enrichment and Quality Control. As noted in Table 2, the StEER Leadership continues to support this phase, supervising the DEQC process and leading the wider data curation workflow that organizes and documents the collected data through a comprehensive Data Report. While DesignSafe supports all phases of StEER event responses, it is particularly critical in this third phase, as its Field Research Data model ensures StEER’s curated data is discoverable (specifics of the dataset organization and the accompanying Data Report are discussed in Event Response Products). In parallel, the FAST often continues to engage in the interpretation of the field observations in the preparation of publications and presentations to communities of research, policy and practice, as well as in soliciting funding for ongoing research on observed vulnerabilities.
Hardware Platforms
The field response design includes the selection of an appropriate suite of hardware platforms, weighing the field response strategy and objectives, availability of equipment, time available for field assessment, FAST capacity and expertise, levels of access and site conditions. The standard hardware platforms used by StEER for structural performance assessment are now introduced. Note that StEER may also couple these with other discipline-specific methodologies such as hazard intensity mapping, e.g., coastal surveys and tree fall mapping, or non-destructive evaluation and material testing, as demonstrated later in Illustrative Field Responses.
Panoramic Imaging
Small teams of 1-2 persons utilizing street-level panoramic cameras can rapidly capture near continuous surface imagery of building exteriors and other aspects of the built environment. These imaging platforms have also been deployed in handheld (360-camera), drone-based, backpack-mounted and even boat-mounted implementations to generate panoramas in vehicle-inaccessible areas. StEER commonly uses a vehicle-mounted NCTech Pulsar system (available through the NHERI RAPID facility), which consists of four cameras canvassing a 360 × 145-degree field of view. Each camera has a resolution of 12.3 MP, sensor size of 3042 × 4062, and fisheye lenses with fixed focus and aperture size of f/2.6. The system includes GNSS-tracking via a U-BLOX Neo M8N receiver to geotag each image location with approximately 2.5 m accuracy. StEER typically captures frames every 4 m along the routes driven, enabling near-continuous coverage of the built environment along the route. Images collected from the multiple cameras of these systems are post-processed to create seamless 360-degree panoramas that can be uploaded into the Google Street View platform or Mapillary, as discussed in Dissemination Pathways. As the subsequent Hurricane Laura case study demonstrates (see Rapid Surveys), this efficient data capture method can reduce the size of the FAST by enabling a larger VAST to remotely view the panoramas to assess performance, although details of the structural load path and finer damage details are not likely to be discernible from this imagery. Other potential re-uses of StEER’s panoramic imaging data include automated image processing to extract damage features, documenting the performance of distributed power systems (e.g., counting the number of leaning or broken poles), or estimating the volume and distribution of curbside debris indicative of interior damage.
Unmanned Aerial Systems
Unmanned Aerial Systems (UAS) offer a complementary large-scale data collection platform that has been used in a range of implementations in StEER field responses. While LiDAR and multispectral units are available, StEER currently focuses on the acquisition of high resolution imagery in one of two use cases: (1) the capture of high-resolution nadir or oblique (off-nadir) photographs in a predefined grid, with front and side overlap, from which orthomosaics, digital surface models (DSMs), and densified point clouds are generated using Structure-from-motion (SfM) photogrammetry methods (Westoby et al., 2012; Zhou et al., 2016); (2) the acquisition of high resolution, free-flight photographs from various perspectives and elevations to provide a bird's-eye view of the structure or site in plan. StEER uses a range of UAS hardware supplied by its members or the RAPID Facility, though the DJI Mavic 2 (20.0 MP RGB camera with 1” CMOS sensor, f/2.8-f/11 aperture size) and DJI Inspire with ZenMuse 5 camera (16.0 MP RGB camera with 4/3” CMOS sensor, f/1.7-f/16 aperture size) have been most commonly deployed to date.
App-Based Structural Assessments
StEER has created a suite of mobile applications, each with a standard format and embedded guidance to aid FAST members in executing comprehensive evaluations of structural performance. The standardization in a digital app creates consistency across FASTs and field responses, helps to reduce potential for data loss/user error, and enables future re-users of the data to use automated processing to discover underlying trends and patterns. The apps have four primary components for data input: (1) a series of standardized data fields, (2) photograph upload fields that prompt the field investigator to attach high-resolution photographs, (3) an audio recording field that gives the field investigator the ability to dictate observations into an audio file, and (4) freeform text fields for additional written observations. The standardized data fields record basic details of the investigation, structural attributes organized by subsystem/component, and a direct quantification of component performance, reporting the percent damage to different component classes, which can be easily related to established damage rating systems, e.g., FEMA (2003) for windstorms, Baggio et al. (2007) for earthquakes. Since the specific fields and rating systems vary by hazard, StEER currently employs multiple apps. For windstorms it has separate apps for building and non-building structures, constructed using elements from ATC-45 (ATC, 2005a,b), the U.S. Army Corps of Engineers (Woolpert, 2006), Friedland (2012), FEMA MAT standard operating procedures (FEMA, 2008), as well as the second and fourth author’s own experiences conducting post-windstorm assessments. A third windstorm app is used to record evidence of hazard intensity such as treefall patterns or high water marks. For seismic events, StEER currently utilizes an Earthquake Rapid Evaluation form inspired by ATC-20 (Rojahn, 2005). While these four apps are regularly used by StEER FASTs, StEER has actually created nearly a dozen apps for different hazards, structural classes and assessment objectives (in-depth forensic vs. rapid evaluation) over the years. The Supplementary Materials (Supplementary Table S1) provides a list of the apps developed to date. For the four apps discussed herein, additional tables in the Supplementary Materials list the data fields (Supplementary Material SM.2-SM.5).
To reduce the complexity of the app for the user and reduce user error, the apps are programmed with field-dependent logic patterns to accordingly sequence follow up fields, e.g., once a user specifies a building typology, the app logic is structured to sequence only the component assessments relevant to that typology. To further reduce the burden on FASTs with limited time on the ground, the apps prioritize the fields that should be completed by trained experts leveraging on-site forensic data (e.g., details of the structural load path) vs. other information (e.g., year of construction, basic building geometry) more efficiently gathered afterward leveraging supplemental data sources and/or automated processes (these fields are denoted in Supplementary Material SM.2-SM.5). Utilizing this approach increases the efficiency of field data collection by allowing the FAST to focus its efforts on truly perishable data. Each app is also accompanied by a guidance document to instruct users in configuring their mobile devices, completing a field assessment, and interpreting specific fields (Roueche et al., 2019a; Roueche et al., 2020b). For example, this guidance instructs FASTs to photograph each side of a building, with additional photos capturing any important details.
All StEER apps are currently implemented in the Fulcrum data collection platform (Spatial Networks, 2018)6, a mobile data collection service that unifies the various fields, media and metadata associated with an assessment into a single geolocated record compiled into an event-response-specific database easily exportable to common formats like CSV, ESRI Shapefile, and GeoJSON for curation in DesignSafe. StEER is specifically part of an open-data initiative called Fulcrum Community7 that provides disaster response and recovery organizations open platform access at no-cost. Within Fulcrum, users can enhance the platform’s standard geospatial visualizations by uploading custom base layers: StEER specifically uses this feature to preload high-resolution aerial imagery (from mission agencies such as NOAA for domestic events or purchased from vendors for international events) or overlays of the targets selected in the field response design (exported out of Google Maps). Figure 3 provides a demonstration of the latter. Users can access Fulcrum’s geospatial visualizations in one of two ways: directly through the mobile app (Figure 3) or by logging into Fulcrumapp.com and accessing the browser-based dashboard (shown later in Figure 4B). StEER takes advantage of Fulcrum’s real time updating of damage assessments in these interfaces to coordinate the efforts of multiple FAST members working in the field simultaneously. The apps store all acquired data on the FAST member’s mobile device until connectivity allows for cloud synchronization, with the Fulcrum back end infrastructure (Figure 4B) enabling near-real-time access to VAST members preparing the EARR, Data Librarians enacting the DEQC process, or NHE community members seeking to view the data. Moreover, anyone can freely create a user account on StEER’s Fulcrum Community page to access the apps and data for use outside of StEER-sponsored events.
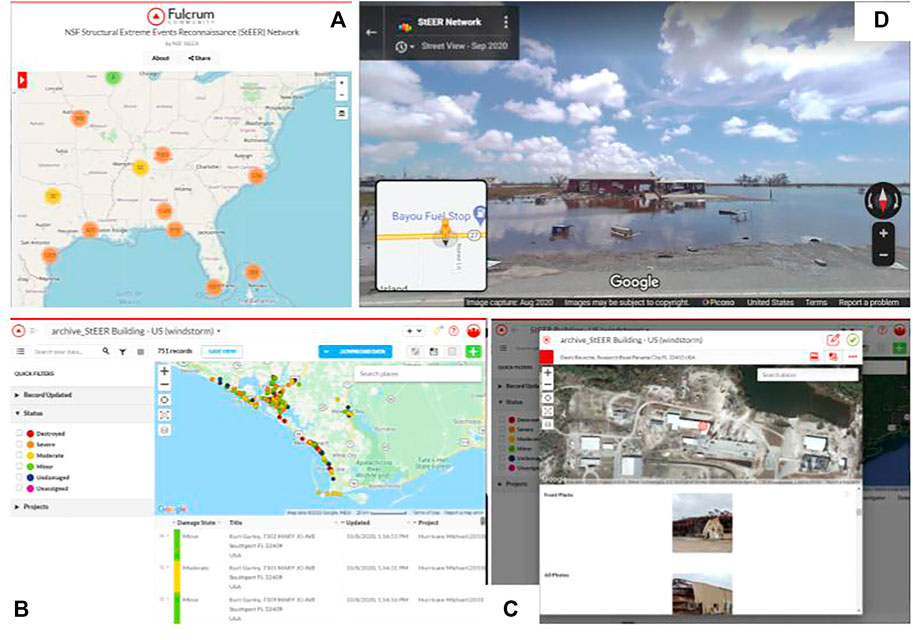
FIGURE 4. Open platforms for sharing StEER field data: (A) Fulcrum Community public map viewer for app-based structural assessments, (B) backend Fulcrum dashboard for querying and filtering app-based structural assessments with ability to click any record for (C) pop-up with all fields, metadata and collected media (example from Hurricane Michael); (D) example of StEER street-level panoramas posted to Google Maps Streetview platform (example from Hurricane Laura).
Finally, the StEER mobile app suite is still being built-out to accommodate additional hazard types (e.g., tsunami) and structure classes, and further realigned to promote greater consistency between the apps used for different hazard types. While these efforts are ongoing, and the apps described above will likely undergo future revisions accordingly, the core elements of app-based structural assessment will remain the same, promoting consistency in damage assessments across hazard events and across the various FASTs conducting these assessments.
Terrestrial Scanning
Due to its time-intensiveness and required expertise, StEER has made judicious use of terrestrial scanning technologies such as the Faro Focus LiDAR scanner, reserving it for notable case study structures. Each implementation includes careful planning to determine the optimum number of scans and their positions such that the scans can be accurately registered to maximize coverage with minimal occlusions. The selection of the scanning parameters must balance available site access (relative to both permission and safety), the structure’s geometry (ensuring line-of-sight), and time constraints. Once the protocol is defined, it is executed by the terrestrial scanner, which records the 3D information of the targeted objects (point cloud) registered to the relative coordinate system of the scanner. The data is then post-processed using standard software to register, process (colorize) and export the scan to open-source formats (e.g., .las). Kijewski-Correa et al. (2018) provides an example of the configurations and applications of this type of hardware to document hurricane damage.
Field Response Strategies
Over the first 2 years of its existence, StEER has implemented five different field response strategies: Hazard Gradient Survey, Representative Performance Study, Targeted Case Studies, Rapid Surveys, and Phased Multi-Hazard Investigations. These strategies may integrate data from multiple hardware platforms to efficiently capture and comprehensively document the structural performance and site context. These strategies are each introduced, followed by a discussion of how StEER Leadership ultimately selects the field response strategy for a given event. Note that an example of each field response strategy is introduced later in Illustrative Field Responses.
Hazard Gradient Survey
Structural damage is a function of many factors, but hazard intensity is typically assumed, and has often proven to be, the most significant predictor of damage (e.g., Egnew et al., 2018). Structures assessed in a hazard gradient survey are sampled from pre-identified clusters or along transects that cut across the hazard gradient to provide an unbiased estimate of the fundamental hazard-damage relationships, suitable for the development of fragility descriptions. As such, Hazard Gradient Surveys are one of the primary field response strategies adopted by StEER. FASTs routinely work door-to-door (D2D) on foot in a cluster of buildings or along a transect, assessing every third building to ensure a representative sample (Liang et al., 2012). This field response strategy often couples FAST members working D2D to sample buildings in a cluster for app-based structural assessments, while vehicle-mounted street-level panoramic images are collected along all streets in the cluster, and aerial imagery covering the entire cluster is captured overhead by UAS. However, this field response strategy requires a reasonable estimate of the hazard gradient as well as access to inventory data to inform target selection (transects or building clusters). To date, StEER has employed Hazard Gradient Surveys in both tornadoes and hurricanes, including sampling the performance of coastal structures across significant storm surge hazard gradients in events such as Hurricane Michael (2018) (Kennedy et al., 2020).
Representative Performance Study
This strategy is typically adopted when the conditions/logistics limit the scope of a field response or when it is advisable to deploy a small FAST to scout an impacted area as a prelude to a more in-depth field response by StEER FASTs or other groups. Depending on the event, the engaged FAST may be interdisciplinary in order to gain a more holistic impression of the effects of the event. When using this strategy, the FAST generates overall impressions of the impacts and local conditions through field notes and photographs of selected structures and facilities.
Targeted Case Studies
This strategy develops detailed photographic accounts of structural and nonstructural damage to structures. This type of field response strategy has particular value when specific structures can be identified (and accessed) for in-depth evaluation. Such targets include structures with high societal value, e.g., hospitals, structures where design details/drawings are known, structures employing notable retrofits or mitigation strategies, structures whose responses in the event have been recorded by embedded instrumentation, or structures in close proximity to sites recording the hazard intensity, e.g., strong motion stations. When using this strategy, the FAST acquires multiple high-resolution photographs of each structure, capturing specific load path details, annotated by field notes. When feasible, UAS and/or terrestrial scanning can be used to generate detailed 3D digital models for further off-site analysis. Physical samples may also be acquired for off-site testing to establish material properties.
Rapid Surveys
Hurricane Laura was just one of a series of hurricanes that made landfall in the record-setting 2020 Atlantic Hurricane season, all during the COVID-19 pandemic, creating challenging dynamics for evacuation, sheltering, recovery and reconnaissance efforts (Roueche et al., 2020c). With many universities operating under travel restrictions and the pandemic-related restrictions on shelters creating greater demand for hotels to house evacuated households, StEER was challenged to conceive of new modalities to safely respond. This resulted in a new rapid survey field response strategy that solicited participation from small, self-contained regional teams, in some cases commuting daily from their homes, to collect street-level panoramic imaging that could be shared with a larger virtual team working from their homes to conduct app-based structural assessments (using the Fulcrum backend). This strategy is capable of generating hundreds of kilometers of data using a two-person team working only 2 to 3 days, minimizing the need for interactions with the affected population and a larger multi-institutional FAST, in compliance with StEER’s COVID-19 protocols. These street-level panoramas are equally valuable to document societal impacts of disasters, damage to distributed infrastructure such as utility networks, and debris piles that can infer the level of interior losses due to rainwater intrusion or flooding. As such, StEER anticipates greater use of this strategy in the future to rapidly collect data that can be efficiently processed to document the impacts of the event with minimal intrusion on the affected community, while identifying targets for a follow up FAST employing a Targeted Case Study or Hazard Gradient Survey, if warranted.
Phased Multi-Hazard Investigations
These are the most complex StEER field response strategies, using a small scout team to assess conditions on the ground and potential targets to inform a follow-up field response by larger interdisciplinary teams that will work both to document the performance of the built environment as well as characterize the hazards. Depending on the information available and the characteristics of the inventory, this performance assessment can adopt elements of the aforementioned Hazard Gradient Survey or Targeted Case Studies, engaging a range of assessment technologies depending on transport constraints. This field response strategy configuration is particularly beneficial in events with catastrophic damage, events with limited ground support or local coordination, and/or events for which limited information on the hazard characteristics is available. As a result, this strategy is often advantageous for international field responses.
The selection of any of the above field response strategies for a given event considers the data that are likely of greatest value to the NHE community, the FAST expertise and available equipment, the characteristics of the hazard and built environment, and other contextual factors. For example, if the StEER members who expressed interest in participating in a FAST have expertise in field assessing multiple building typologies, and the hazard impacted a broad variety of building types with similar intensities, then a Representative Performance Study would likely be chosen. Whereas if the members expressing interest have little experience with detailed forensic investigations, but have close regional proximity to the event and access to vehicle-mounted panoramic imaging systems, then a Rapid Survey may be the best choice for the initial FAST, while a subsequent FAST could conduct a Hazard Gradient Survey or conduct Targeted Case Studies to add depth to the initial field response.
Data Enrichment and Quality Control
Referring back to Figure 2, the last phase of the field response is devoted to Data Enhancement and Quality Control (DEQC) by StEER’s Data Librarians. The different hardware platforms and field response strategies place varying demands on the DEQC process. As panoramic imaging, unmanned aerial systems and terrestrial scanning all benefit from automated file generation and post-processing by software native to these hardware environments, no additional enrichment of the data is required, and quality control focuses solely on ensuring all data are properly documented, organized into a logical directory structure by date and location, and completely transferred to the DesignSafe project that will serve as its long-term curation home. For field response strategies that acquire photos outside of StEER’s standard apps, the DEQC process includes a quality control review of the photos to remove any redundant, blurry or inappropriate (e.g., bystander faces) images and enrichment of the photographic data through the compilation of a photo log listing the extracted metadata/geotags from each photo, as well as a description of the photo.
The most effort intensive aspect of the DEQC process is associated with app-based structural assessment data. StEER Data Librarians work for months after the FAST returns to enrich the assessments using supplemental data sources to populate the fields that were not completed on-site by the FAST. To do so, Data Librarians work in the web-based Fulcrum backend described in App-Based Structural Assessments, using its robust version control capabilities. Data Librarians review the media (photo, audio) files captured by the FAST, other third-party imagery sources (e.g., public aerial imagery from federal or state agencies, which is automatically ingested by Fulcrum and linked to each assessment), and public databases (e.g., tax assessor data or realtor websites) to gather information needed to complete the outstanding fields in each assessment and quality control the fields completed by the FAST. Custom web-crawler scripts, GIS analysis and other tools batch process the data to reduce the burden on Data Librarians, e.g., using spatial joins between assessment locations and building footprints or parcel polygons to match available attribute data from tax assessor or realtor databases.
In addition to enriching each assessment, a multi-dimensional control process is also undertaken to ensure the datasets are suitable for advanced knowledge discovery. The quality control component of the DEQC process focuses on four key data quality dimensions as defined in Fox et al. (1994), consisting of accuracy, currentness, completeness, and consistency.
• Accuracy relates to the agreement of the various data values contained in the assessment to the true value. The DEQC process maximizes accuracy by parsing data from reliable sources such as tax assessor databases, permit databases, real estate services like Zillow, Google Streetview (for comparative pre/post-event imagery), processed imagery from the FAST (e.g., 3D models generated from UAS imagery) and mission agency aerial imagery (e.g., NOAA post-hurricane imagery websites), and referring to StEER guidance to recognize and accurately define data values from imagery.
• Currentness recognizes that most data are a static snapshot of a dynamic process, and therefore data should reference back to the same nominal time, or have an accurate time indicator. This is important in post-event reconnaissance, when the landscape changes rapidly during response and recovery operations. This requires determining if the structure’s condition at the time of FAST-assessment was significantly altered from its immediate post-event state, including disassembly, repair and/or replacement. Identification of these situations primarily relies on reviewing and comparing data from multiple timescales after the event, and using the earliest post-event data to define the damage states (e.g., structure damage visible in aerial imagery captured 24-48 h after the event takes precedence over on-site FAST data captured possibly 1-2 weeks after the event when significant differences are noted).
• Completeness relates to the percentage of populated fields, as well as interpretation of various null value indicators.
• Consistency traditionally relates to data values satisfying any known constraints. For example, if a global damage rating is defined using quantitative criteria such as component-level damage percentages, then these should be assigned consistent with the assigned global damage rating. Consistency in post-disaster assessments also relates to how various uncertainties or unique circumstances are handled. For example, StEER has protocols for how data values are to be assigned for fields that assume all sides of a structure are visible, when in reality only two sides of a structure were visible in imagery from various data sources.
This multi-dimensional quality control effort is enabled by establishing clear guidelines in the DEQC training materials, a central communication hub on DesignSafe Slack for open discussions by the Data Librarians, automated checks for missing/incompatible data values, and independent audit by at least one other Data Librarian so that all assessments involve at least two independent contributors.
The status of enrichment and quality control tasks for each assessment is tracked using codes assigned by the Data Librarians (Table 3), which indicate the DEQC stage that assessment has undergone to date. The Data Librarians’ work is progressive, advancing the entire collection of assessments for an event to DEQC Stage 1; then working back through the entire collection of assessments to achieve DEQC Stage 2. By the conclusion of this progressive process, some assessments may achieve a higher DEQC Stage (e.g., Stage 3) than others (e.g., remain at 2) due to availability of parcel-specific data. These concepts are illustrated in more detail in Roueche et al. (2019a, 2020b). Such continuous updating of these codes is critical not only for managing the collective effort of multiple Data Librarians across universities but also for users of the data who can still access assessments in real-time via the Fulcrum Community website and thus need to know the DEQC stage achieved to date on any given assessment. This then empowers the user to decide if that assessment meets their threshold for inclusion in their analysis.
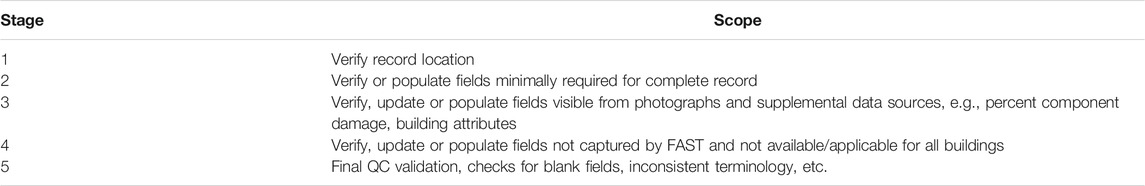
TABLE 3. Stages of DEQC Process.
Finally, StEER continues to explore human-machine interfaces for further automation given that the current DEQC process on average requires approximately 30 minutes of human effort, with each assessment progressing on average through eleven different versions before reaching its final published state. Still there is considerable value in retaining human involvement in this process, as it provides excellent opportunities for training students and prepares them for future participation in StEER field responses.
Event Response Products
The StEER event response workflow typically produces at least one of the following products for each event: (1) Event Briefing, (2) Preliminary Virtual Reconnaissance Report (PVRR), and (3) Early Access Reconnaissance Report (EARR), subsequently accompanied by a curated dataset. As summarized in Table 4, each product serves a distinct purpose and accordingly differs in scope, publication time, and authorship. This section provides a brief introduction to the structure and content of each of these products, citing an illustrative example for each. Note that a full compilation of the Event Briefings, PVRRs, EARRs, and datasets published to date on DesignSafe are available on the StEER website8. StEER has also issued a handbook (Kijewski-Correa et al., 2020a) that explains the process supporting the production of the Event Briefing, PVRR and EARR, the standard elements of these products, and associated Google Document templates. Each of these products is now briefly introduced.
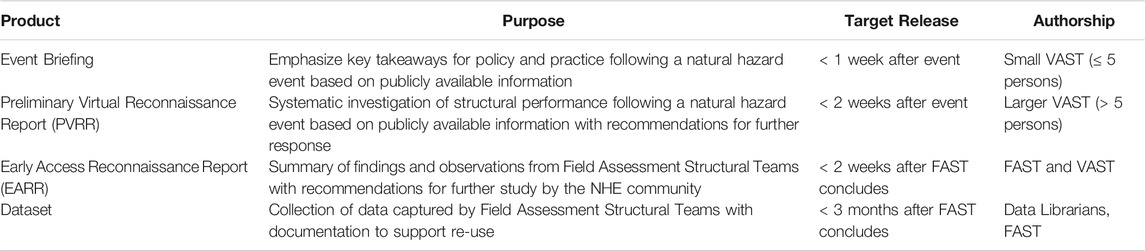
TABLE 4. Overview of primary StEER event response products.
Event Briefing
Typically issued within a week of an event, these abbreviated summaries of natural hazard events and their impacts contain standard sections: (1) introducing the event and its timeline, (2) summarizing hazard characteristics, (3) overviewing the damage to structures, (4) reporting impacts to community resilience, and (5) recommending a response strategy with topics for further investigation. These briefings are substantiated by reports shared by news and government agencies, professional societies, local collaborators and social media, using photos shared publicly by these entities. The primary contribution of the Event Briefing is the documentation of an event culminating in Key Lessons for future policy and practice based on the available observations. See Gunay et al. (2020a) for an illustrative example for the 15 December 2019 earthquake in the Philippines.
Preliminary Virtual Reconnaissance Report
Typically released within 2 weeks of the event, these reports are issued for events with magnitude and impacts that have potential to advance learning related to structural performance. PVRRs may be followed by an Early Access Reconnaissance Report (EARR) in a Tier 3 response, or stand alone in events where deployment of FASTs is not warranted or feasible (Tier 2 response). A PVRR contains a more detailed accounting of the event and includes standard sections: (1) introducing the event’s significance and impacts, (2) describing hazard characteristics, (3) defining the local codes and construction practices, (4) overviewing the damage to buildings and other infrastructure, (5) reporting geotechnical failures, (6) establishing current conditions and access, and (7) recommending a response strategy. The majority of the report focuses on structural performance, which may be organized by structure class (e.g., single-family residences, hospitals, commercial buildings), geographic region, or instigating hazard (when multi-hazard impacts are observed). As with the Event Briefing, all information is derived from public sources. The primary contribution of the PVRR is the detailed documentation of an event culminating in recommendations for possible formation of a FAST and themes emerging for further investigation by StEER or other responding groups. See Gunay et al. (2020b) for an illustrative example for the 30 October 2020 earthquake and tsunami in the Aegean Sea.
Early Access Reconnaissance Report
Typically released within 2 weeks of the conclusion of the initial FAST response, these reports are issued for events involving StEER FASTs. An EARR contains many of the same elements as a PVRR and refers to the published PVRR heavily. Thus, the EARR’s standard sections are meant to document any new understanding of the event or observations of its hazards since the publication of the PVRR: (1) introducing the event with updated estimates of impacts, (2) sharing any new quantifications of the hazard intensity, (3) describing the FAST’s response strategy, (4) expanding the understanding of local codes and construction practices based on experiences in the field, (5) detailing the methodologies used by the FAST, (6) overviewing the observed performance of buildings and other infrastructure, (7) documenting observed geotechnical failures, (8) summarizing observed evidence of hazard intensity, e.g., high water marks, and (8) recommending areas for further study. The syntheses of structural performance included in an EARR are drawn from direct observations by the FAST rather than public sources, again organized by structure class, geographic region, instigating hazard or failure mechanism. The primary contributions of the EARR are summaries of the FAST observations and key findings, in turn informing recommendations for further hypothesis-driven research. See Roueche et al. (2019b) for an illustrative example for the 3 March 2019 Tornadoes in the southeastern United States.
Datasets
StEER’s Product Curation Handbook (Kijewski-Correa, et al., 2020b) describes in detail how StEER structures its datasets to operate within the NHERI DesignSafe Field Data Research Model. The standard directory structure used in StEER datasets is organized around the different technologies described in Hardware Platforms and is defined as follows: (1) Planning Documents (including Pre-Deployment Briefing(s)), (2) Damage Assessments (e.g., app-based structural assessments), (3) Panoramic Imaging, (4) Unmanned Aerial Systems, (5) Terrestrial Scanning, (6) Other Ground-based Observations (i.e., photos acquired by FAST outside of StEER mobile apps), (7) GPS Data (routes or waypoints of data collection sites), (8) Daily Summaries (nightly briefings from FAST), and (9) Dissemination Products (presentations, publications or other derived data products). As detailed in Kijewski-Correa et al. (2020b), both raw and processed data for each of the hardware platforms used are ultimately included in the curated dataset on DesignSafe.
A Data Report is also curated with this dataset. These reports provide the necessary documentation to enable re-use of the curated data. Each Data Report has the following standard sections: (1) summary of the event and FAST configuration, (2) details of the data collection methodology (includes description of hardware), (3) chronology of field response with geographies, (4) description of post-processing for all data types, (5) dataset’s directory structure (using the standard directories defined above), (6) points of contact for user queries, (7) references, and (8) appendices summarizing fields in any app-based structural assessments and/or UAS flight parameters. Note that while StEER has standardized this directory structure and associated sections of its Data Reports, not all of these are used for all field responses, since the adopted field response strategies, hardware and FAST configurations are unique to each event. The Hurricane Michael Dataset illustrates one of the more comprehensive examples (Roueche et al. 2020a), showcased in a NHERI DesignSafe webinar9.
In total, these products have some important distinctions from the products of other efforts in the field. For example, while typically not as in-depth as some of the federally-mandated response reports (e.g., FEMA MAT, NIST Disaster and Failure Studies) or initiatives by larger professional organizations (e.g., EERI LFE), the StEER products described above complement these efforts and fill a critical need for the NHE community in that they are (1) rapid, typically being issued within days to weeks after an event, rather than months to years; (2) have authorship open to variable levels of participation from any interested members of the NHE community through the VAST/FAST; and (3) are tailored to the needs of the NHE community, signaling opportunities for ongoing analysis of the event and lines of future research. This last point is made possible through StEER’s open sharing of standardized data, a contribution unique from other federally-mandated or professionally coordinated reconnaissance efforts. In addition to the inherent value to academic researchers, these products have also been consumed by mission agencies like NIST and FEMA, segments of the insurance/reinsurance industry, code officials, practicing engineers and manufacturers, each finding a unique value-added as summarized in Table 5.
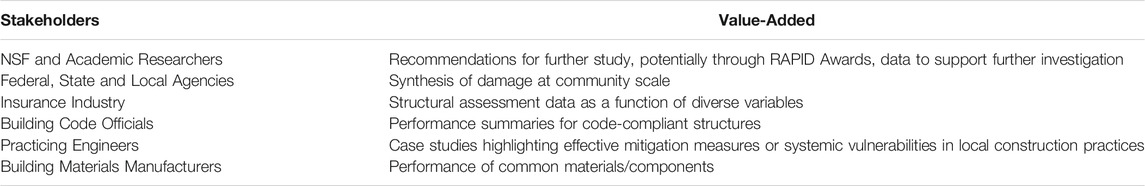
TABLE 5. StEER products value-added for different stakeholder groups.
Dissemination Pathways
All the aforementioned StEER products are long-term curated in DesignSafe, with the resulting DOIs circulated through DesignSafe Slack Channels and StEER email listservs, and archived on the StEER website. However, recent event responses described in Illustrative Field Responses have demonstrated that this data can have immediate value to response and recovery actions (well before it completes the DEQC process and is curated in DesignSafe). StEER has balanced this potential for immediate impacts with the need to create quality-assured archival data products by making two of its data classes publicly available in near-real-time. The use of the aforementioned Fulcrum Community platform opens immediate and ongoing public access to app-based structural assessments as they synchronize in the cloud, with the QC code (Table 3) providing transparency as to each assessment’s current stage of review. Fulcrum’s public-facing map provides a high-level visualization of the geospatial distribution of damage assessments (Figure 4A), while those registering for a free Fulcrum Community account have full access to the more powerful backend dashboard to query and explore records across the StEER app suite (Figure 4B), clicking on any pin to see the detailed assessment record with photos (Figure 4C). Meanwhile, StEER street-level panoramas have been uploaded to Mapillary and Google Map’s Streetview (now available as part of its time lapsed image captures), branded by StEER (Figure 4D), UW RAPID Facility, or SiteView 360, depending on who managed the post-processing and upload to the platform. The time lapsing feature native to Google makes this particularly useful for pre/post comparisons, though going forward, StEER will centralize its street-level panoramas at Mapillary to take advantage of more powerful capabilities to automate and discover community-contributed data. These and other public access points are detailed in the Data Availability Statement.
A number of the stakeholder groups engaging these products (Table 5) are themselves StEER and/or NHERI members and receive StEER’s email communications and other NHERI messages announcing the release of these products. These members have been important allies in disseminating post-event products through their professional networks and organizations. However, these members are but a small sample of potential stakeholders. StEER has in parallel built contacts in affected communities during the course of field responses, including with local media, which have been leveraged to share learnings and data access points. With that being said, StEER products are currently not tailored to audiences outside of the NHE community, making the creation of new short-form and targeted communications for different non-academic audiences a key future priority, as well as mobilizing more robust dissemination channels to convey these communications to intended audiences in policy and practice.
Illustrative Field Responses
In the 2 years since its founding, StEER has led three dozen event responses with over 400 participants, with a dozen of these events culminating in a field response (see Table 6 for breakdown by hazard and response tier). The following representative case studies provide additional details of implementations of each of StEER’s field response strategies between 2018 and 2020, across different hazards and geographies. Each case study introduces the event, the implementation of a given field response strategy, as well as some of the major learnings informed by field observations. These field responses involved over 90 individuals, who could not all be included herein due to space limits, but are recognized in the Supplementary Material (Supplementary Material SM.6). Each case study cites the associated StEER products, including reports that provide detailed accounts of the hazards, societal impacts, built environment performance, and recommendations for further study.
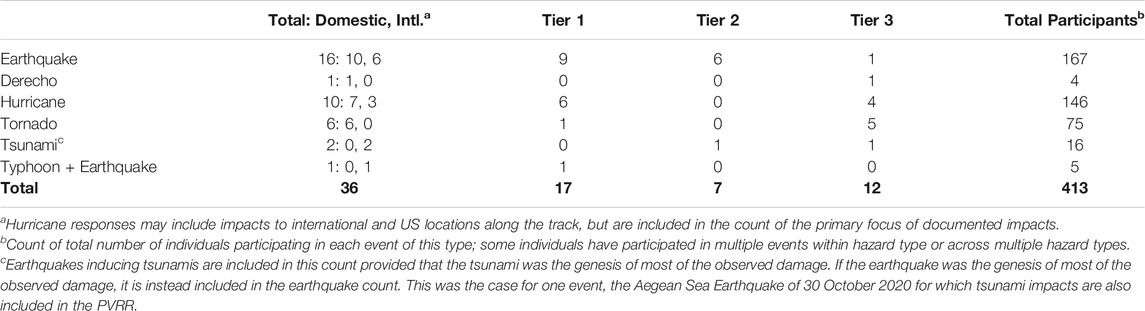
TABLE 6. Summary of StEER event responses (Sept. 2018-Dec.2020).
Hazard Gradient Survey
One example of a Hazard Gradient Survey was in response to the 3 March 2020 tornado outbreak, which included ten tornadoes in Tennessee (Roueche et al., 2020d). The most impactful tornadoes had a 97 km (60 mile) track that passed through Nashville, TN and Lebanon, TN with wind speeds estimated at 74 m/s (165 mph) and a damage width of 730 m (800 yards) at its widest point; and a tornado with a 13 km (8.3 mile) track that struck Cookeville, TN with wind speeds estimated at 78 m/s (175 mph) and a damage width of 274 m (300 yards) at its widest point. The Nashville tornadoes was rated an EF-3 on the Enhanced Fujita (EF) tornado intensity scale (McDonald Mehta, 2006), while the Cookeville tornado was rated an EF-4. Full details of the hazard characteristics can be found in Wood et al. (2020). The tornadoes in combination caused 25 fatalities, at least 309 reported injuries, and approximately $1.6B in economic losses (NOAA, 2020). StEER sampled across the width of the tornadoes within preselected clusters dispersed along the length of the tornado track (Figure 5), in order to capture intensity variations in both the transverse (highest winds at the center of the track and decaying outwards) and longitudinal (intensity cycles of the tornado itself) directions.
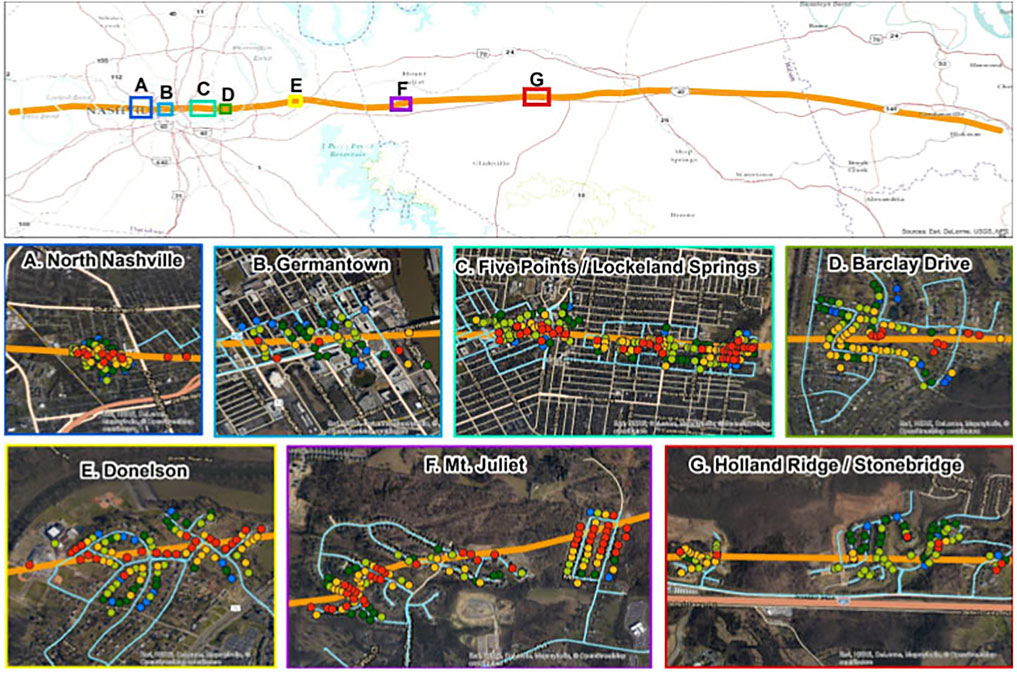
FIGURE 5. StEER FAST app-based structural assessments in response to the Nashville tornadoes in key geographic regions relative to the tornado centerline. Blue lines in the detail plots indicate routes captured with street-level panoramas. Colored circles indicate locations of app-based structural assessments, where red to blue shading indicates high to low severity of damage.
Implementation
The VAST and ensuing PVRR (Roueche et al., 2020d) summarized the impacts of the tornadoes and recommended deployment of a FAST based on several factors, including: (1) the high number of fatalities (25), with many occurring in modern residential construction, (2) the severe damage to several schools, and (3) the severe damage to many commercial buildings (as the Nashville tornado passed through downtown Nashville and two different industrial parks). Based on these recommendations, a FAST was activated as described more fully in Wood et al. (2020). The FAST consisted of engineering experts from academia and industry, led by Richard Wood from the University of Nebraska and the second author, with team members Keith Cullum, Brett Davis, Mariantonieta Gutierrez Soto, Sajad Javadinasab Hormozabad, Yijun Liao, Frank Lombardo, Mohammad Moravej, Stephanie Pilkington, and the fourth author, whose affiliations are provided in the Supplementary Materials (Supplementary Table SM.6). These individuals were supported by a wider VAST, also listed in the Supplementary Material (Supplementary Material SM.6). Team members began arriving and collecting data in the Nashville area on 8 March 2020 and continued through 12 March 2020. The FAST engaged a range of hardware platforms including app-based structural assessments, UAS, and street-level panoramic imaging. In total, the FAST conducted 1163 individual app-based structural assessments (1098 buildings, 22 non-building structures, and 43 hazard indicators), 15 UAS surveys capturing 25,100 aerial photographs and generating high-resolution orthomosaics (ground sample distance between 1.5-3 cm) covering 10.6 sq. km, and 161 km of 11-megapixel street-level panoramas, documenting nearly the entire network of roads transecting the tornado paths as part of this Hazard Gradient Survey.
Major Learnings
The FAST repeatedly observed highly vulnerable structural details that were already identified in multiple previous post-tornado reports (Prevatt et al., 2012a; FEMA, 2012; Coulbourne et al., 2015). These included schools lacking safe sheltering options, big box buildings with little load path redundancy suffering complete collapses with high life safety risk, and anchorage failure in mobile and manufactured homes. More concerning was the FAST observation that the majority of modern, code-compliant single-family homes assessed had glaring deficiencies in the load path to the foundation. Specifically, the majority of homes rested on unreinforced, and at times even ungrouted, concrete masonry block stem walls with little to no positive resistance to wind uplift forces. This load path relies primarily upon the weight of the home to resist uplift forces and as a result, fails in a structurally brittle fashion leading to rapid and catastrophic collapses that compromise life safety.
For most of these vulnerabilities, engineered solutions exist but for many reasons have simply not yet been adopted. Indeed, the current building code requirements lack any tornado-resilient criteria that could provide some resistance against tornado loads. Research has established tornado-resilient design is economically feasible and need not exceed the criteria that are popular and widely used in Florida (Prevatt et al., 2012b; Simmons et al., 2015), yet there is only one jurisdiction (Moore, OK) out of 89,000 in the US that has actually adopted tornado-resilient building design guides. This implies society has accepted the continuation of life loss and catastrophic structural damage over a large expanse of this country, annually. Retrofitting just a few houses to achieve a continuous load path or even one or two schools to include hardened rooms or corridors for adequate refuge would be insufficient to tangibly alter the deaths, injuries and building damage repeated in these tornado events.
Representative Performance Study
A 7.5 magnitude earthquake and subsequent tsunami hit Palu and Donggala in Central Sulawesi, Indonesia just after 6 pm local time on 28 September 2018, killing at least 2245 people. At the time of the FAST response, some 1075 people were missing and over 10,000 were injured, 4000 seriously. Nearly 75,000 were displaced in the three most affected areas: Donggala, Palu City, and Sigi. The earthquake was caused by movement on a strike-slip fault known as the Palu-Koro Fault (Robertson et al., 2019a). An earthquake of this type and magnitude is not generally anticipated to generate a damaging tsunami, hence the interest from international tsunami researchers. It is believed that the tsunami waves were generated by a combination of lateral movement of the steep bathymetry of Palu Bay and numerous submarine landslides around the bay (Aranguiz et al., 2020). Through the use of aerial imagery and field investigations, the FAST and its collaborators were able to identify thirteen distinct landslide locations along the bay shoreline, many of which are known to have triggered local tsunami waves (Robertson et al., 2019a).
Implementation
This earthquake and tsunami event was an early example of a Representative Performance Study, initiating with a PVRR (then referred to as a P-VAT) to gather available online data to guide the subsequent FAST (Robertson et al., 2018). Because of its remote foreign location and strict governmental controls on external investigators, it made sense for StEER, which was still in its infancy, to send only one representative (the last author) to serve as a scout embedded with a larger international multi-disciplinary team organized by tsunami researchers in Japan and Indonesia. The team collected data from 27-31 October 2018 along the entire coastline of Palu Bay. The international research team (see Supplementary Materials Table Supplementary Material SM.6 for full list of names and affiliations) was organized by Tomoya Shibayama, Miguel Esteban into four distinct survey groups:
• Tsunami Inundation Survey: Shibayama, Takahito Mikami and Tomoyuki Takabatake performed tsunami inundation elevation and runup surveys on all sides of Palu Bay and as far North as the earthquake epicenter (Mikami et al., 2019).
• Bathymetric Survey: Esteban performed sonar scans of the West and South coastal zones of Palu bay to identify potential submarine landslide evidence.
• Aerial Survey: Ryota Nakamura and Yuta Nishida performed numerous aerial surveys using a DJI Phantom 4 Pro+ quadcopter drone covering tsunami inundation regions and individual structures damaged by the earthquake and liquefaction-induced lateral spreading.
• Structural Damage Survey: The last author, Jacob Stolle and Clemens Krautwald conducted a Representative Performance Study on all sides of Palu Bay and at significant earthquake damaged buildings in Palu City.
Apart from the bathymetric survey, each group was accompanied by one of three Indonesian collaborators. While the groups performed their reconnaissance, the collaborators interviewed local residents who had witnessed the tsunami firsthand. During the 3 days they completed over 200 interviews, collecting useful data about how residents in the tsunami inundation area responded to the event.
FAST’s Representative Performance Study focused on tsunami damage along the coastline of Palu Bay for 2 days, and spent 1 day focused on earthquake damage in Palu City. The sites selected for particular attention were determined prior to the trip based on the PVRR (Robertson et al., 2018) and available aerial imagery at the time. In addition to conducting a visual inspection and capturing photographic evidence of the performance of various structures, eyewitnesses were interviewed when possible to determine the sequence of damage, particularly in structures subjected to sequential earthquake and tsunami loading.
More importantly, by teaming with international researchers interested in various aspects of the tsunami generation, inundation, damage and social consequences, the last author was able to leverage data collected by others on the team, while adding consideration of both structural and geotechnical failures caused by the earthquake, to generate a comprehensive EARR (Robertson et al., 2019a). In total, the FAST documented 68 sites in this Representative Performance Survey, interpreted in light of 3 UAS surveys conducted by the Aerial Survey Team (capturing 2520 aerial photographs generating high-resolution orthomosaics covering 1.5 sq. km). All data collected by the FAST in response to this event, including eye-witness videos and geolocated photographs, are included in the published dataset in DesignSafe (Robertson et al., 2019b).
Major Learnings
This Representative Performance Study documented significant damage to a wide cross-section of engineered and non-engineered construction as a result of the earthquake and/or tsunami. A number of multi-story reinforced concrete buildings collapsed during the earthquake, most notably the eight-story Roa-Roa Hotel which resulted in multiple deaths (Figure 6A,B). A reinforced concrete shopping center in Palu experienced partial collapse during the earthquake, and a number of mosques also suffered severe damage or even collapse. The iconic twin steel arch cable-suspended Palu Bridge IV over the mouth of the Palu River also collapsed during the earthquake. The bridge had a total span of 250 m and the steel box arches were 20 m tall (Figure 6C,D). A number of port facilities were damaged either by the earthquake or tsunami, and many ships, barges and boats were washed ashore or out to sea (Figure 6E,F). Damage to lifelines included extensive road damage due to surface faulting and liquefaction, cracks in the Palu airport runway, and loss of power and telecommunications. The tsunami caused considerable damage to light-framed wood structures, while some taller engineered structures survived, protecting those who vertically evacuated. At various locations, floating debris appeared to have induced at least part of the observed tsunami damage (Stolle et al., 2019); the damaging effect of scour on structural foundations was also documented (Krautwald et al., 2020). These observations have led to two modifications to the debris loading provisions in the latest edition of ASCE 7, 2022. Extensive lateral spreading due to liquefaction caused by the earthquake also resulted in extensive damage to residential and agricultural structures in a number of inland areas. Tragically, Indonesia has a long and painful history of earthquake and tsunami hazards, with yet another earthquake hitting this general area in early 2021 (Gunay et al., 2021), with this event reiterating vulnerabilities, potential mitigation measures and risk management strategies that can enhance resilience to future events.
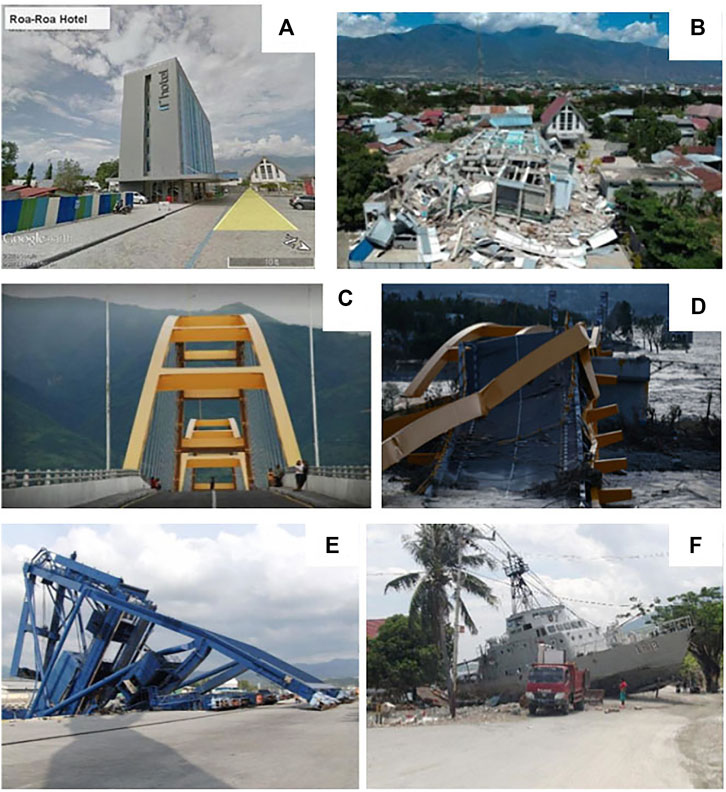
FIGURE 6. Damage induced by the Palu Earthquake and Tsunami: Roa-Roa Hotel in Palu, built in 2013, (A) before the earthquake and (B) after the earthquake, steel double arch Palu Bridge IV over the mouth of the Palu River (C) before the earthquake and (D) after the earthquake and tsunami; (E) collapse of gantry crane in the Port of Pantoloan due to earthquake shaking; (F) naval ship washed ashore at Watusampu Naval Base.
Targeted Case Studies
On 6 January 2020, at 6:32 am local time, a moment magnitude 5.8 earthquake occurred approximately 13 km SSE of Indios at a depth of 6.0 km and epicentral coordinates of 17.868°N 66.819°W. This earthquake was followed by a stronger earthquake with moment magnitude 6.4 on 7 January 2020, at 4:24 am local time, 8 km S of Indios at a depth of 10.0 km and epicentral coordinates of 17.916°N 66.813°W. These two earthquakes were part of an earthquake sequence in southwest Puerto Rico that initiated with a Mw 4.7 earthquake on 28 December 2019. Many hundreds of aftershocks occurred in the region, with the largest having a moment magnitude of 5.9. As detailed in the PVRR for this event (Miranda et al., 2020a), these earthquakes caused the collapse of at least 80 structures and damage to more than 10,000 residential units with significant societal impact. In addition to damage to buildings, bridges, roads, and other infrastructure, two thirds of the island lost power as a result of the Mw 6.4 earthquake on 7 January.
The Puerto Rico earthquakes were particularly well-suited to the Targeted Case Study field response strategy because of lags in assessments (tagging of damaged structures) by local officials and thus the need for detailed structure-by-structure evaluations given the concerns over reoccupying buildings during the aftershock sequence that resulted in notable collapses. According to data provided by the local government, over 8000 people had been displaced from their homes and were forced to move into shelters, and a significantly larger number were forced to sleep in tents in the streets or open spaces due to fear of their homes collapsing during an aftershock.
Implementation
Under the joint sponsorship of the John A. Blume Earthquake Engineering Center at Stanford University, the FAST was led by Eduardo Miranda and included Pablo Heresi, Armando Messina, Isamar Rosa, and Jorge Archbold (see Supplementary Material Table Supplementary Material SM.6 for full list of participants and affiliations). The FAST was deployed 8-12 January 2020, conducting field reconnaissance across six cities in Puerto Rico. The FAST visited instrumented buildings, bridges, and other engineered structures located near ground motion stations of the Puerto Rico Strong-Motion Program (PRSMP). The FAST also assessed structures that had been evacuated because of reported structural damage as well as a range of other typologies in the epicentral region (Guayanilla, Guánica, and Yauco). The FAST noted basic information about the structures as well as any signs of structural and nonstructural damage, largely from the exterior, but secured access to nine buildings for interior inspections. In total, the FAST documented 61 structures with a collection of over 7,250 high-resolution photographs, as part of this Targeted Case Study. A reduced subset of 744 photographs were subsequently ported into 61 app-based structural assessments by Data Librarians.
Major Learnings
As outlined in the StEER EARR for this event (Miranda et al., 2020b), the largest impact of this earthquake was on residential structures. Preliminary observations indicate that the primary deficiency in many of these structures was the presence of soft-stories created by elevated single-family residential structures supported by concrete (typical) columns, locally known as “casas en zancos.” This sequence of earthquakes also highlighted the challenges faced by regions subjected to multiple hazards, with frequent hurricane exposure promoting elevated first floors and heavier concrete roof slabs, which, unless adequately designed and detailed, make structures more vulnerable during seismic events (Kijewski-Correa et al., 2018). This is compounded in areas such as Haiti or Puerto Rico where large, damaging earthquakes had not occurred in many decades. Several school buildings throughout the region were damaged, including the Agripina Seda school in Guánica where three out of six buildings collapsed in the aftershock sequence (Figure 7). Several of the collapsed buildings in this school had captive columns whose lateral deformations were partially restrained by the presence of partial-height masonry walls in the longitudinal direction, a severe structural deficiency identified in many other school buildings in the region. At least three recently constructed reinforced concrete government buildings in the epicentral region had a floor system eccentric to the columns. In this system, bending arising in the floor system must be transferred to the columns through a combination of shear and torsion in a short beam, whose failure can lead to loss of vertical carrying capacity. This mechanism resulted in a near collapse of a government building in Guánica. A number of buildings had been retrofitted through the installation of exterior steel concentric braced frames and appeared to perform well structurally. Finally, several bridges suffered significant structural damage, possibly due to seismic joints allowing larger lateral deformations in the transverse direction, severe pounding at the abutments, large deformations at the rocker bearings, and damage to transverse shear keys.
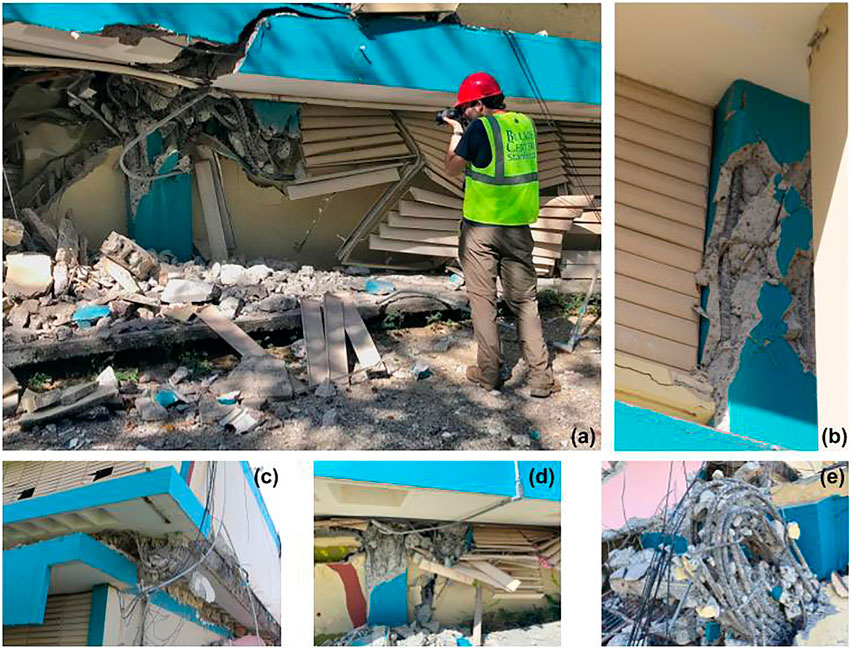
FIGURE 7. Collapsed Agripina Seda School in Guánica, Puerto Rico: (A) in-depth photographic documentation with inset examples of load path vulnerabilities to (B) captive columns, (C-D) soft-story failure and (E) mangled reinforcement from crushed column.
Rapid Surveys
As detailed in Roueche et al. (2020c), Hurricane Laura made landfall as a strong Category 4 storm near Cameron, LA in the early hours of 27 August 2020, tying the Last Island Hurricane of 1856 as the strongest land-falling hurricane in Louisiana history. Wind speeds are estimated to have reached or exceeded the design wind speeds for Risk Category II buildings and other structures, as defined in ASCE 7-16 and the 2018 International Building Code (MRI = 700 years), by as much as 8 km/h (5 mph) near Lake Charles, LA (specifically, northeastern Calcasieu Parish and the eastern half of Beauregard Parish) (NIST/ARA, 2020). Meanwhile storm surge resulted in high water marks of over 5 m (17 ft) above ground in Oak Grove, LA in Cameron Parish (USGS, 2020). These combined hazards resulted in estimated insured losses between $4B to $12B (Claims Journal, 2020), with substantial impacts to port and industrial facilities serving the oil and gas sector, widespread damages in the residential sector, and sustained outages of water and power impacting the operation of hospitals providing critical care during a pandemic. Notable damage was reported to commercial facilities, particularly to hotels, including high-rise buildings in Lake Charles associated with the casinos and resorts. As the storm’s well-predicted track facilitated coordinated, multi-entity surface measurements of wind fields and storm surge, Laura is one of the best documented storm events and thus provides novel opportunities to understand the vulnerabilities underpinning losses across a diversity of building occupancies and other critical infrastructure.
Implementation
As mentioned in Field Response Strategies, Hurricane Laura was the impetus to develop a new event response strategy using Rapid Surveys. This strategy was ultimately re-engaged when Hurricane Delta made landfall approximately 16 km (10 mi) east of Laura’s landfall site to create a rich longitudinal dataset of the compound effects of these hurricanes (Roueche et al., 2020e). The initial implementation in the Hurricane Laura response leveraged small, self-contained, regional FASTs deploying in phases with vehicle-mounted street-level panoramic imaging platforms, with select use of UAS. FAST-1 led by the second author and Justin Marshall mobilized immediately, reaching the impacted areas at 1 pm CDT on 27 August, and collected data through 29 August in Lake Charles, LA and surrounding communities, as access allowed. They were followed on 2 September 2020 by FAST-2 led by Sabarethinam Kameshwar and Naqib Mashrur, who continued to collect street-level panoramas, accessing some of the coastal areas impassable to FAST-1. A final round of panoramic imaging and UAS data collection was completed by Michael Vorce 11-12 September (see Supplementary Material Table Supplementary Material SM.6 for full team and affiliations). Routes selected for street-level imaging were based on inventory data and sites of post-Rita construction to ensure a range of building classes/occupancies, typologies, and vintages were canvassed. Given the excellent coverage of wind field observations in this event, as discussed in Roueche et al. (2020c), emphasis was placed on documenting areas in close proximity to deployed wind instrumentation, as well as documenting performance along the hazard gradient to the east and west of the storm’s track. The FASTs covered a wide geographical area from Port Arthur, TX to the west all the way to Jennings, LA to the east, Longville, LA to the north, and Holly Beach, LA to the south (Figure 8). These panoramas were uploaded to Google Maps and Mapillary, permitting rapid access to the VAST, as well as various federal mission agencies (who were not able to field deploy), remotely evaluating the storm’s impacts. In select areas where street-level panoramas and UAS orthomosaic data was available, the VAST sampled every structure to remotely complete structural assessments in Fulcrum, emulating the process normally undertaken by FAST members in the field. In total, five UAS surveys capturing 1230 aerial photographs and generating high-resolution orthomosaics (ground sample distance between 1.5-3 cm) covering 0.308 sq. km and 842 km of 1160-megapixel street-level panoramas were generated by this Rapid Survey. These data enabled 402 app-based structural assessments to be completed remotely by the VAST.
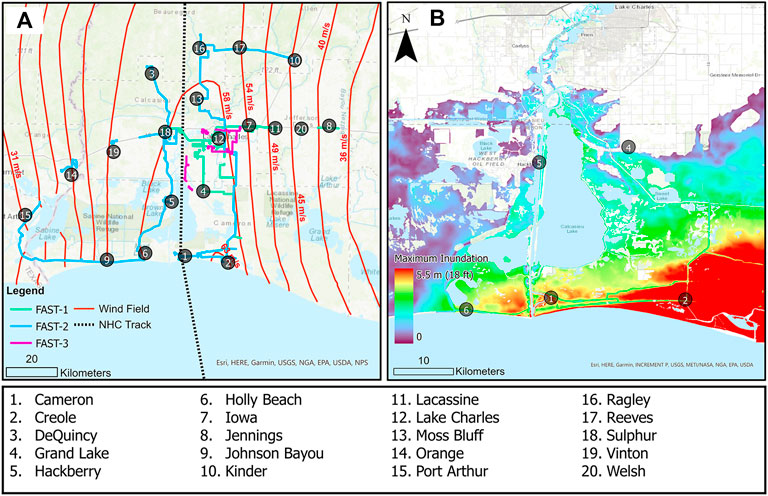
FIGURE 8. Visual summary of surveyed communities relative to (A) preliminary Hurricane Laura track from the National Hurricane Center (NHC) and standardized gust wind speed estimates (red contours showing 3-second averaging time, 10°m height, open exposure) from Applied Research Associates (Version 3 wind field), including FAST street-level panorama routes (colored blue, green and fuchsia lines); and (B) colored heatmap of maximum inundation depth above ground from ADCIRC hindcast (NHC best Track).
Major Learnings
The extensive and timely coverage of the StEER FASTs for this design-level wind event, with exceptional documentation of the windfield by surface observation networks and mobile radar, makes Hurricane Laura an ideal opportunity to advance knowledge and practice. Notably, the areas impacted by Laura were previously impacted by Hurricane Rita (2005), with many structures reconstructed or repaired and unfortunately again damaged. While there were notable successes, particularly in government buildings and other critical facilities, there were considerable losses in other building classes such as commercial (retail), hotels, religious institutions, and industrial facilities. Case studies such as the Capital One Tower in Lake Charles, LA remain important opportunities for detailed forensic investigation of buildings repaired/reconstructed post-Rita. Furthermore, a large swath of modern (post-IBC/IRC construction) single-family residential structures were impacted by design-level winds during Hurricane Laura, underscoring vulnerabilities to garage doors, which fortunately did not propagate to structural failures, and high rates of roof cover losses, particularly associated with hip and ridge cap shingles. The damage to the roofing systems may have resulted in substantive interior damage and losses due to water ingress that could not be documented by the approach and timing of StEER’s data collection. This was compounded by the mixed performance of mobile homes, including failures of even Zone II anchorages. StEER also documented damage to large fuel storage tanks under combined wind, storm surge and wave action, underscoring their susceptibility to buoyancy, buckling, and overturning.
Moreover, as a design-level wind event over a built up urban area, Hurricane Laura also presented an opportunity to evaluate the public’s perceptions around the performance of code-compliant vs. code-plus construction, akin to the post-event perception studies executed after other hazard events (Porter, 2016), as well as the decision factors driving the regrettably low rates of impact-resistant fenestration observed by the FASTs across the region. These issues in preparation for this hurricane were only compounded by the challenges of the COVID-19 pandemic, which impacted evacuation and sheltering options, spurred more sheltering-in-place over fears of infection, reduced the response capacity of charitable organizations and agencies, and increased both the economic losses and health impacts.
Phased Multi-Hazard Investigation
As detailed further in Kijewski-Correa et al. (2019c), with its three landfalls from 1–3 September 2019, Hurricane Dorian broke many records, including the highest estimated gust wind speed at 362 km/hr (225 mph) and the longest duration for a Category 5 hurricane over land, with storm surge in excess of 6 m (20 ft). The overall cost of this destruction was estimated at $7 Billion (at least), or nearly 60% of the 2017 annual GDP for this tiny nation of 386,000 people. Dorian destroyed 13,000 houses or 45% of the housing inventory on Abaco and Grand Bahama Islands in the northwest sector of the Bahamian archipelago, causing a humanitarian crisis for most of the 60,000 people living there, with 60 confirmed deaths and hundreds of others still missing at the time StEER field deployed. Most houses in informal settlements like the Mudd and Pigeon Peas were completely destroyed by storm surge. The dire post-landfall conditions only compounded the logistical challenges of traveling across a chain of islands whose port and airport infrastructure had been significantly damaged. While the losses were staggering, a number of “bright spots” presented opportunities to document successful mitigation strategies in one of the strongest Category 5 hurricanes on record. Given the parallels between construction practices in Florida, this event further offered an important validation of principles used in US hurricane zones.
Implementation
Hurricane Dorian presents a perfect example of a Phased Multi-Hazard Investigation intended to document both structural performance and characterize the multiple hazards in an international event with challenging field logistics and limited direct observations of the hazards during landfall. StEER was initially contacted by a Floridian with a vacation home on Great Abaco Island, Steve Pece, who offered to transport (by personal private plane), arrange logistics, and personally guide a StEER team across the island given the dire need for engineering assessments. FAST-1 included a small veteran team of structural engineers led by Justin Marshall with Daniel Smith and included imaging support from the RAPID EF’s Andrew Lyda. Guided by Pece, FAST-1 scouted the conditions by collecting street-level panoramas from 24-26 September 2019 across Marsh Harbour and Treasure Cay on Great Abaco Island. As time permitted, the FAST recorded app-based structural assessments on select targets in these locales (Figure 9A,B). The experiences of FAST-1, as documented in the subsequent EARR (Marshall et al., 2019), then enabled FAST-2’s more ambitious, multi-island deployment. FAST-2 was sub-organized into a Coastal Survey Team led by Andrew Kennedy with James Kaihatu, a Structural Assessment Team led by Doug Allen who liaised locally with Bahamian structural engineers Davon Edgecombe, Terran Brice and Kevin Brown to contextualize observations within Bahamian regulatory practices, and a Rapid Imaging Team led by Richard Wood with Henry Lester and Mike Vorce (see Supplementary Materials Table Supplementary Material SM.6 for supporting team and affiliations). The Coastal Survey Team and Structural Assessment Team initially returned to Great Abaco Island 5-7 October 2019 to expand upon the work of FAST-1, employing app-based structural assessments and documenting high water marks and the extent of inundation, while accessing new areas such as Man-o-War Cay. They then joined the Rapid Imaging Team on Grand Bahama Island late 7 October, which had been working since 5 October to document damage along the hazard gradients on Grand Bahama Island using street-level panoramic imaging, terrestrial scanning, and app-based structural assessments. The combined teams then conducted joint assessments of storm-surge induced damage on 8 October. In total, these FASTs were able to assess a representative sampling of engineered construction such as hospitals, government buildings, airport and port facilities, commercial buildings and hotels. Their efforts resulted in 369 individual app-based structural assessments, approximately 475 km of panoramic imaging at 5 m or less spacing, and 45 coastal surveys for this Phased Multi-Hazard Investigation. Logistically this was the most complex field response that StEER has undertaken to date, involving international travel by chartered private planes and boats to move across islands with limited access to fresh water, food and electricity.
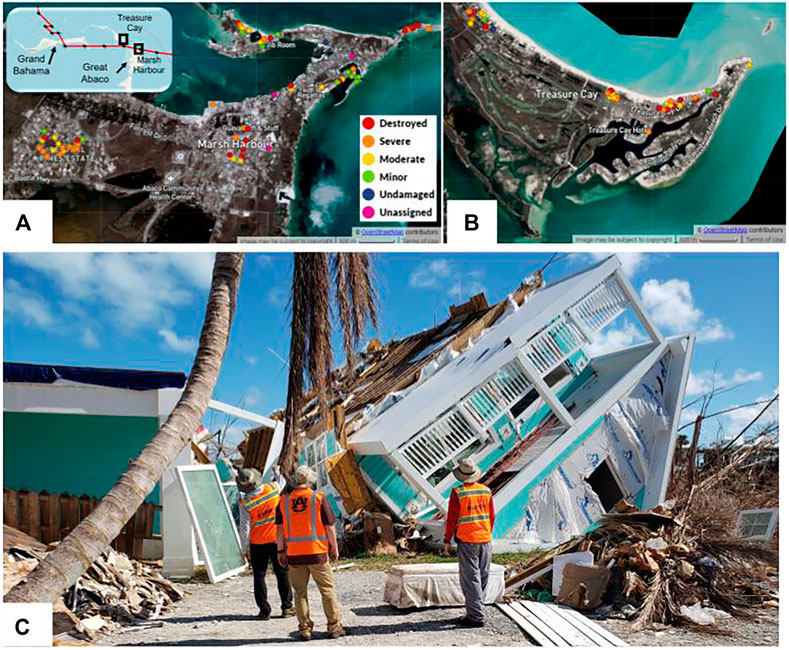
FIGURE 9. Summary of app-based structural assessments (colored circles) conducted by FAST-1 after Hurricane Dorian in the Bahamas: (A) Marsh Harbour with inset map showing locations relative to hurricane track, (B) Treasure Cay, and example of recurring failure theme: (C) use of hurricane straps at the roof/wall connection, but poor bottom plate connections.
Major Learnings
While there was significant emphasis placed upon the catastrophic losses in Hurricane Dorian, a cross-section of residential, institutional, and commercial buildings performed quite well structurally, providing critical learning opportunities for enhancing hurricane resilience. Unfortunately, buildings that survived structurally were often subjected to storm surge and rainwater ingress that destroyed interior contents. Many coastal structures were completely washed away. FAST-1 and FAST-2 observed that failures were often driven by the limited capacity of the attachment of the superstructure to the foundation (Figure 9C). FAST-2 further noted that structural roof damage in wood-framed construction were consistently accompanied by envelope failures. While FAST-2 observed the use of a number of recognized mitigation measures, such as hurricane clips or breakaway walls in elevated structures, the implementation did not result in the intended benefit due to improper installation or failure to properly execute critical details. Beyond these structural considerations, Dorian highlighted the need for disaster risk reduction interventions in informal settlements, which are a historical legacy of colonization in Latin America and the Caribbean. Moreover, this event reiterated the need to reframe disaster risk for small island nations. As was the case with Hurricanes Irma and Maria’s impacts on the US Virgin Islands and Puerto Rico (Prevatt et al., 2018), the projected losses in Hurricane Dorian were a sizeable percentage of the annual GDP of the Bahamas and thus posits if a more risk-averse approach to design is warranted in such settings. But perhaps the most critical lesson in Hurricane Dorian was the realization that early-arriving NHE reconnaissance teams can provide immediate value to the affected communities and those supporting their recovery. A number of humanitarian organizations and government officials requested access to StEER’s data, particularly the street-level panoramas for the purposes of assessing damage and coordinating recovery efforts, which the RAPID EF supported on their local servers and eventually on Google Maps Streetview platform. StEER then shared these access points, as well as the Fulcrum Community webpage and its published reports, with any interested party the FASTs engaged (see Data Availability Statement for these access points).
Concluding Remarks
Field observations play a critical role in fueling the Data to Knowledge (D2K) Life Cycle after natural hazard events, though previous limitations in technologies for capturing and broadly disseminating this data constrained the speed and reach of efforts to share these valuable observations. However, when effectively operationalized, field observations can drive fundamental research and technology transfer that ultimately results in the diffusion of mitigation measures back to affected communities. By embracing a number of recent technological advances, the Structural Extreme Events Reconnaissance (StEER) Network has been able to help streamline this life cycle further, introducing new modalities for the Natural Hazards Engineering (NHE) Community to capture, analyze and communicate our evolving understanding of natural hazard impacts on the built environment. This paper overviewed StEER’s initial suite of policies, protocols and workflows, which have enabled contributions in the areas of: workflow and data standardization, data reliability to enable field-observation-driven research & development, efficiency in data collection and dissemination to speed knowledge sharing, near-real time open data access for enhanced coordination and transparency, and flexibility in collaboration modes to reduce the “overhead” associated with reconnaissance and foster broad engagement in event responses. StEER’s creation of efficient systems to deliver well-documented, reliable data suitable for diverse re-uses as well as rapidly disseminated synopses of the impact of natural hazard events on the built environment provides a distinctive complement to existing post-event reconnaissance initiatives.
The introduction of this new model for community-led reconnaissance has underscored a number of important considerations. First, such community-facing initiatives require a commitment to transparency with clear external communications on event responses and real-time open access to collected data, in this case relying on platforms like Fulcrum Community, Mapillary and Google Maps Streetview. This real-time access is made possible by the use of completely digital workflows, which streamline data collection, reporting and curation to minimize human effort. Moreover, these rapidly-formed, geospatially distributed teams require more than just logistical support; their efficiency is reliant upon centralized knowledge management and real-time collaboration on web-based platforms like Google Drive and Slack, standardized operating procedures, and thoughtful design of event responses. This last point is achieved using five different event response strategies described in this paper, with pre-defined targets to maximize precious time in the field. StEER has also invested considerably in developing data standards, guidance documents, templates and training resources to build the capacity of its diverse member base. The consistency and reliability of structural assessments collected by dozens of different investigators is further assured through the use of mobile apps that create a consistent template focused on quantifying component-level damage, coupled with a rigorous Data Enrichment and Quality Control (DEQC) process. Finally, the valuation of virtual reconnaissance in these event responses cannot be underestimated, both for member capacity building and as a means to broaden participation across a larger portion of the NHE community.
The five case studies included in this paper: the Nashville Tornadoes (2020), the Palu Earthquake and Tsunami in Indonesia (2018), the Puerto Rico Earthquakes (2019/2020), Hurricane Laura (2020) and Hurricane Dorian in the Bahamas (2019) serve as illustrative examples of the different event response strategies StEER has employed since 2018 for 36 different hazard events, producing 28 reports and 17 briefings, and involving over 150 different individuals - approximately 50% of the over 300 individuals approved as StEER members. This success is a direct result of reducing the overhead associated with reconnaissance by offering well-structured and flexible modes of participation. StEER’s mobile data collection platform (Fulcrum) has over 5000 publicly available structural assessments and nearly 400 enrolled users, demonstrating uptake beyond StEER’s formal members to include stakeholders in the public and private sector. Furthermore, by making its mobile apps, templates and guidance documents publicly available at www.steer.network, StEER promotes best practices and data standards regardless of whether those investigations are formally affiliated with StEER. The authors look forward to a future where this impact is only deepened through the automation of its assessment processes and a more expansive engagement of communities of research, policy and practice to further accelerate the D2K life cycle.
Data Availability Statement
The datasets presented in this study can be found in online repositories. The names of the repository/repositories and accession number(s) can be found below: All StEER products, resources and policies are available at www.steer.network; App-based structural assessments are available on the StEER Fulcrum Community page: https://web.fulcrumapp.com/communities/nsf-rapid; Panoramic images hosted on Mapillary (for Hurricane Laura): https://www.mapillary.com and Google Maps: https://www.google.com/maps/ (StreetView Platform); Hurricane Dorian (street-level panoramas by vehicle) are hosted at Mapillary: https://www.mapillary.com and also hosted by the RAPID Facility on a public server: Abaco: http://streetview.rapidfacility.org/Projects/AbacoBahamas/player/; Grand Bahama: http://streetview.rapidfacility.org/Projects/Bahamas-Fast-2/player/; Curated datasets and published reports are available at DesignSafe: https://www.designsafe-ci.org/data/browser/public/ (search keyword StEER).
Author Contributions
All the authors have contributed to the content for this paper through their participation in the design, implementation and operation of StEER over the past 2 years, including varying degrees of involvement in each of the case studies in this paper (see Supplementary Material). TKC led the overall writing and revision process; all authors contributed sections to this effort through at least one case study (TKC: Hurricane Laura, DBR: Nashville Tornadoes, IR: Palu Earthquake and Tsunami, DOP: Hurricane Dorian, KM: Puerto Rico Earthquakes), as well as content for the other sections; DBR contributed major elements of Event Response; all authors contributed to the review and editing of the paper; TKC and DBR designed the images for the paper; TKC serves as corresponding author.
Funding
This material is based upon work supported by the National Science Foundation under Grant No. CMMI 1841667.
Conflict of Interest
The authors declare that the research was conducted in the absence of any commercial or financial relationships that could be construed as a potential conflict of interest.
Acknowledgments
This material is based upon work supported by the National Science Foundation under Grant No. CMMI 1841667. Any opinions, findings, and conclusions or recommendations expressed in this material are those of StEER and do not necessarily reflect the views of the National Science Foundation. A special thanks to Julio Ramirez of the NHERI NCO for making our participation in this special issue possible. StEER is grateful to Julio and the leadership of all the other extreme events reconnaissance and research organizations organized under NHERI Converge, who generously share their knowledge and experience. Among these, we particularly recognize GEER for trailblazing this path for others to follow, DesignSafe-CI for its continuous support of our workflows, and the RAPID Facility for being o partners in data collection. Special thanks also to Spatial Networks for their ongoing partnership and generous access to the Fulcrum Community mobile platform for StEER Damage Assessments. Most importantly, StEER thanks the members associated with the field responses showcased in this paper (see Supplementary Material), and all of our members, for their voluntary participation in StEER and the sacrifices they make to do this important work. Finally, StEER thanks its Student Administrator Dinah Lawan for assistance formatting this manuscript and preparing the Supplementary Materials.
Supplementary Material
The Supplementary Material for this article can be found online at: https://www.frontiersin.org/articles/10.3389/fbuil.2021.636197/full#supplementary-material
Footnotes
1https://www.steer.network/resources
2https://www.steer.network/membership
3http://windhazard.davidoprevatt.com/
4http://www.learningfromearthquakes.org/activities/vert
5https://www.steer.network/responses
7https://web.fulcrumapp.com/communities/nsf-rapid
8https://www.steer.network/products
9https://www.youtube.com/watch?v=xUyFJwZmyqM&feature=youtu.be
References
Aránguiz, R., Esteban, M., Takagi, H., Mikami, T., Takabatake, T., Gómez, M., et al. (2020). The 2018 Sulawesi Tsunami in Palu City as a Result of Several Landslides and Coseismic Tsunamis. Coastal Eng. J. 62, 445–459. doi:10.1080/21664250.2020.1780719
ASCE 7 (2022). Minimum Design Loads and Associated Criteria for Buildings and Other Structures. Reston, Virginia: American Society of Civil Engineers.under review for 2022 publication
Barrington, L., Shubharoop, G., Marjorie, G., Shay, H., Berger, J., Gill, S., et al. (2012). Crowdsourcing Earthquake Damage Assessment Using Remote Sensing Imagery. Ann. Geophys. 54, 6.
Berman, J. W., Wartman, J., Olsen, M., Irish, J. L., Miles, S. B., Tanner, T., et al. (2020). Natural Hazards Reconnaissance with the NHERI RAPID Facility. Front. Built Environ. 6. doi:10.3389/fbuil.2020.573067
Butcher, G., Hopkins, D., Jury, R., Massey, W., McKay, G., and McVerry, G. (1988). The September 1985 Mexico Earthquakes. Bnzsee 21 (1), 3–96. doi:10.5459/bnzsee.21.1.3-96
CAEE (2005). Reconnaissance Report on the December 26, 2004 Sumatra Earthquake and Tsunami. Vancouver, British Columbia, Canada: Canadian Association for Earthquake Engineering.
Chen, S. E., Leeman, M. E., English, B. J., Kennedy, A. B., Masters, F. J., Pinelli, J. P., et al. (2016). Basic Structure System Rating of Post–Super Typhoon Haiyan Structures in Tacloban and East Guiuan, Philippines. J. Perform. Constructed Facil. 30 (5), 04016033. doi:10.1061/(asce)cf.1943-5509.0000872
Claims Journal (2020). Estimates of Insured Losses from Hurricane Laura Range from $4Billion to $12 Billion. Available at: https://www.claimsjournal.com/news/national/2020/09/01/299097.htm (Accessed November 25, 2020).
Coulbourne, W. L., Prevatt, D. O., Stafford, T. E., Ramseyer, C. C., and Joyce, J. M. (2015). Moore, Oklahoma, Tornado of 2013: Performance of Schools and Critical Facilities. Reston, VA: American Society of Civil Engineers. doi:10.1061/9780784414095
Cox, D., Arikawa, T., Barbosa, A., Guannel, G., Inazu, D., Kennedy, A., et al. (2019). Hurricanes Irma and Maria post-event Survey in US Virgin Islands. Coastal Eng. J. 61 (2), 121–134. doi:10.1080/21664250.2018.1558920
Deierlein, G. G., McKenna, F., Zsarnóczay, A., Kijewski-Correa, T., Kareem, A., Elhaddad, W., et al. (2020). A Cloud-Enabled Application Framework for Simulating Regional-Scale Impacts of Natural Hazards on the Built Environment. Front. Built Environ. 6. doi:10.3389/fbuil.2020.558706
Delatte, N. J. (2008). Beyond Failure: Forensic Case Studies for Civil Engineers. Reston, VA: ASCE. doi:10.1061/9780784409732
Edge, B., Ramirez, J., Peek, L., Bobet, A., Holmes, W., Robertson, I., et al. (2020). Natural Hazards Engineering Research Infrastructure, 5-Year Science Plan. in Multi-Hazard Research to Make a More Resilient World. Second Edition (DesignSafe-CI). doi:10.17603/ds2-4s85-mc54
EERI (1989). Loma Prieta Earthquake, October 17, 1989. Oakland, CA: Earthquake Engineering Research Institute.
EERI (1971). Preliminary Engineering Findings from Los Angeles Earthquake of February 9, 1971. Oakland, CA: Earthquake Engineering Research Institute.
Egnew, A. C., Roueche, D. B., and Prevatt, D. O. (2018). Linking Building Attributes and Tornado Vulnerability Using a Logistic Regression Model. Nat. Hazards Rev. 19 (4), 04018017. doi:10.1061/(asce)nh.1527-6996.0000305
Fema, (2005a). Mitigation Assessment Team Report: Hurricane Charley in Florida-Observations, Recommendations and Technical Guidance, 488. Washington, D.C: FEMAFederal Emergency Management Agency. Department of Homeland Security.
Fema, (2005b). Mitigation Assessment Team Report: Hurricane Ivan Alabama and Florida-Observations, Recommendations and Technical Guidance, 489. Washington, D.C: FEMAFederal Emergency Management Agency. Department of Homeland Security.
Fema, (1999). Building Performance Assessment Report: Oklahoma and Kansas Midwest Tornadoes. Observations, Recommendations and Technical Guidance, FEMA 342. Washington, D.C: Federal Emergency Management Agency. Department of Homeland Security.
Fema, (1992). Building Performance: Hurricane Andrew in Florida-Observations Recommendations and Technical Guidance. Washington, D.C: Federal Emergency Management AgencyDepartment of Homeland Security.
Fema, (1993). Building Performance: Hurricane Iniki in Hawaii-Observations, Recommendations and Technical Guidance. Washington, D.C: Federal Emergency Management Agency. Department of Homeland Security.
Fema, (2003). HAZUS-MH 2.1 Technical Manual - Hurricane. Washington, D.C: Federal Emergency Management AgencyDepartment of Homeland Security.
Fema, (2006). Hurricane Katrina in the Gulf Coast: Mitigation Assessment Team Report-Building Performance Observations, Recommendations, and Technical Guidance, FEMA 549. Washington, D.C: Federal Emergency Management Agency. Department of Homeland Security.
Fema, (2005c). Hurricane Katrina Recovery Advisory: Design and Construction in Coastal A Zones. Washington, D.C: Department of Homeland Security.
Fema, (2012). Spring 2011 Tornadoes: April 25-28 and May 22. Building Performance Observations, Recommendations, and Technical Guidance, FEMA P-908. Washington, D.C: Federal Emergency Management Agency. Department of Homeland Security.
Fema, (2008). Standard Operating Procedures for Mitigation Assessment Team Process. Washington, D.C: Federal Emergency Management Agency. Department of Homeland Security.
Fischer, E. C., and Hakhamaneshi, M. (2019). The New Paradigm of Post-Disaster Reconnaissance. Geotechnics of Extreme Events. Available at: https://www.readgeo.com/geostrata/may_jun_2019/MobilePagedArticle.action?articleId=1489220#articleId1489220.(Accessed June 12, 2020)
Fox, C., Levitin, A., and Redman, T. (1994). The Notion of Data and its Quality Dimensions. Inf. Process. Manage. 30 (1), 9–19. doi:10.1016/0306-4573(94)90020-5
GEER (2014). Geotechnical Extreme Events Reconnaissance Steering Committee Manual for GEER Reconnaissance Teams. Available at: http://geerassociation.org/media/files/Important%20Docs/GEER_Recon_Team_Manual_2014_v4.pdf.
Gunay, S., Archbold, J., Hu, F., Tsai, A., Mosalam, K., Kijewski-Correa, T., et al. (2020a). StEER - 15 December 2019 Earthquake in the Philippines: Event Briefing. DesignSafe-CI. doi:10.17603/ds2-82rp-h963
Gunay, S., Mosalam, K., Archbold, J., Dilsiz, A., Djima, W., Gupta, A., et al. (2020b). Preliminary Virtual Reconnaissance Report (PVRR). StEER - Aegean Sea Earthquake. DesignSafe-CI. doi:10.17603/ds2-kmxd-gj50
Gunay, S, Hassan, W, Miranda, E, Robertson, I, Wibowo, H, Kijewski-Correa, T, et al. (2021). StEER - 15 January 2021, Mamuju-Majene Earthquake. West Sulawesi, Indonesia: DesignSafe-CI. doi:10.17603/ds2-16w0-8f16
Gurley, K. R., and Masters, F. J. (2011). Post-2004 Hurricane Field Survey of Residential Building Performance. Nat. Hazards Rev. 12 (4), 177–183. doi:10.1061/(asce)nh.1527-6996.0000044
Hall, J. F., Holmes, W. T., and Somers, P. (1994). Preliminary Report - Northridge, California, Earthquake of January 17, 1994: Preliminary Reconnaissance Report. Oakland, CA: Earthquake Engineering Research Institute.
Kendra, J., and Gregory, S. (2019). “Ethics in Disaster Research: A New Declaration,” in Disaster Research and the Second Environmental Crisis: Assessing the Challenges Ahead (Springer International Publishing), 319–341. doi:10.1007/978-3-030-04691-0_16
Kennedy, A., Copp, A., Florence, M., Gradel, A., Gurley, K., Janssen, M., et al. (2020). Hurricane Michael in the Area of Mexico Beach, Florida. J. Waterway, Port, Coastal, Ocean Eng. 146, 5. doi:10.1061/(asce)ww.1943-5460.0000590
Kennedy, A., Rogers, S., Sallenger, A., Gravois, U., Zachry, B., Dosa, M., et al. (2011). Building Destruction from Waves and Surge on the Bolivar Peninsula during Hurricane Ike. J. Waterway, Port, Coastal, Ocean Eng. 137 (3), 132–141. doi:10.1061/(asce)ww.1943-5460.0000061
Kijewski-Correa, T., Alagusundaramoorthy, Prethesha., Alsieedi, Mohammed., Crawford, S., Gartner, M., Gutierrez Soto, M., et al. (2019c). StEER - Hurricane Dorian: Preliminary Virtual Reconnaissance Report (PVRR). DesignSafe-CI. doi:10.17603/ds2-saf8-4d32
Kijewski-Correa, T., Gong, J., Kennedy, A., Womble, J. A., Cai, S., Cleary, J., et al. (2018b). Performance of Low-Rise Construction under Wind and Coastal Hazards during the Landfall of Hurricane Harvey. Proceedings of Forensic Engineering 8th Congress. Austin, TX. doi:10.1061/9780784482018.098
Kijewski-Correa, T., Lawan, D., Mosalam, K., Prevatt, D., Robertson, I., and Roueche, D. (2020a). Virtual Assessment Structural Team (VAST) Handbook: Report Preparation Version 1.4. Available at: https://www.steer.network/resources
Kijewski-Correa, T. L., Kennedy, A. B., Taflanidis, A. A., and Prevatt, D. O. (2018a). Field Reconnaissance and Overview of the Impact of Hurricane Matthew on Haiti's Tiburon Peninsula. Nat. Hazards 94 (2), 627–653. doi:10.1007/s11069-018-3410-0
Kijewski-Correa, T., Mosalam, K., Prevatt, D., Robertson, I., and Roueche, D. (2020b). Product Curation Handbook Version 3.1. Available at: https://www.steer.network/resources
Kijewski-Correa, T., Roueche, D., Mosalam, K., Prevatt, D., and Robertson, I. (2019b). Field Assessment Structural Team (FAST) Handbook Version 1.0. Available at: https://www.steer.network/resources
Kijewski-Correa, T., Roueche, D., Mosalam, K., Prevatt, D., and Robertson, I. (2019a). Member Guidelines Version 1.3. Available at: https://www.steer.network/resources
Krautwald, C., Stolle, J., Robertson, I., Achiari, H., Mikami, T., Nakamura, R., et al. (2020). Engineering Lessons from September 28, 2018 Indonesian Tsunami: Scouring Mechanisms and Effects on Infrastructure. J. Waterway, Port, Coastal Ocean Eng. 147 (2), 04020056.
Kuligowski, E. D., Lombardo, F. T., Phan, L. T., Levitan, M. L., and Jorgensen, D. P. (2014). Draft Final Report, National Institute of Standards and Technology (NIST) Technical Investigation of the May 22, 2011 Tornado in Joplin, Missouri(NIST) technical investigation of the May 22, 2011, tornado in Joplin, Missouri. National Construction Safety Team Act Reports - 3. National Institute of Standards and Technology. doi:10.6028/NIST.NCSTAR.3
Liang, D., Cong, L., Brown, T., and Song, L. (2012). Comparison of Sampling Methods for Post-Hurricane Damage Survey. J. Homeland Security Emerg. Manage. 9, 2. doi:10.1515/1547-7355.2015
Marshall, J., Smith, D., Lyda, A., Roueche, D., Davis, B., Djima, W., et al. (2019). StEER - Hurricane Dorian: Field Assessment Structural Team (FAST-1) Early Access Reconnaissance Report (EARR). DesignSafe-CI. doi:10.17603/ds2-4616-1e25
McDonald, J. R., and Mehta, K. C. (2006). A Recommendation for an Enhanced Fujita Scale (EF-Scale). Lubbock, TX: Texas Tech UniversityWind Science and Engineering Center.
Mikami, T., Shibayama, T., Esteban, M., Takabatake, T., Nakamura, R., Nishida, Y., et al. (2019). Field Survey of the 2018 Sulawesi Tsunami: Inundation and Run-Up Heights and Damage to Coastal Communities. Pure Appl. Geophys. 176, 3291–3304. doi:10.1007/s00024-019-02258-5
Milano, C. (2015). The Disaster Detectives: How FEMA's Mitigation Assessment Teams Strengthen Emergency Preparedness. Risk Manage. 62, 4.
Miller, D. K. (1998). Lessons Learned from the Northridge Earthquake. Eng. Structures 20 (4-6), 249–260. doi:10.1016/s0141-0296(97)00031-x
Miranda, E., Acosta Vera, A., Aponte, L., Archbold, J., Cortes, M., Du, A., et al. (2020a). StEER - 07 Jan. 2020 Puerto Rico Mw6.4 Earthquake: Preliminary Virtual Reconnaissance Report (PVRR). DesignSafe-CI. doi:10.17603/ds2-xfhz-fz88
Miranda, E., Archbold, J., Heresi, P., Messina, A., Rosa, I., Robertson, I., et al. (2020b). StEER - Puerto Rico Earthquake Sequence December 2019 to January 2020: Field Assessment Structural Team (FAST) Early Access Reconnaissance Report (EARR). DesignSafe-CI. doi:10.17603/ds2-h0kd-5677
Networks, Spatial. (2018). StEER Fulcrum Community Website - Crowdsourced Data Collection for Qualified Humanitarian Projects. Available at: https://web.fulcrumapp.com/communities/nsf-rapid (Accessed November 29, 2020).
NIST/ARA (2020). Hurricane Laura Rapid Response Windfield Estimate. Preliminary Windfield Release 3. National Institutes of Standards and Testing and Applied Research Associates. Available at: https://www.designsafe-ci.org/data/browser/public/designsafe.storage.community/Recon%20Portal/2020%20Hurricane%20Laura%20Cameron%20Louisiana%20USA (Accessed November 29, 2020).
NOAA (2020). Storm Events Database. National Oceanic and Atmospheric AgencyAvailable at: https://www.ncdc.noaa.gov/stormevents/eventdetails.jsp?id=883007(Accessed November 20, 2020).
NRC (2007). Tools and Methods for Estimating Populations at Risk from Natural Disasters and Complex Humanitarian Crises. Washington, DC: National Research CouncilThe National Academies Press. doi:10.17226/11895
O’Rourke, T. D., Stewart, H. E., Blackburn, F. T., and Dickerman, T. S. (1990). Geotechnical and Lifeline Aspects of the October 17, 1989 Loma Prieta Earthquake in San Francisco. National Center for Earthquake Engineering Research.Technical Report NCEER–90–0001
Peek, L., Tobin, J., Adams, R. M., Wu, H., and Mathews, M. C. (2020). A Framework for Convergence Research in the Hazards and Disaster Field: The Natural Hazards Engineering Research Infrastructure CONVERGE Facility. Front. Built Environ. 6. doi:10.3389/fbuil.2020.00110
Pinelli, J.-P., Esteva, M., Rathje, E. M., Roueche, D., Brandenberg, S. J., Mosqueda, G., et al. (2020). Disaster Risk Management through the DesignSafe Cyberinfrastructure. Int. J. Disaster Risk Sci. 11, 719–734. doi:10.1007/s13753-020-00320-8
Pinelli, J.-P., Roueche, D., Kijewski-Correa, T., Plaz, F., PrevattZisis, D. I., Elawady, A., et al. (2018). Overview of Damage Observed in Regional Construction during the Passage of Hurricane Irma over the State of Florida. Proceedings of Forensic Engineering 8th Congress. Austin, TX. November 29-December 2doi:10.1061/9780784482018.099
Porter, K. A. (2016). Safe Enough? A Building Code to Protect Our Cities and Our Lives. Earthquake Spectra 32 (2), 677–695. doi:10.1193/112213eqs286m
Prevatt, D. O., Coulbourne, W., Graettinger, A. J., Pei, S., Gupta, R., and Grau, D. (2012a). Joplin, Missouri, Tornado of May 22, 2011: Structural Damage Survey and Case for Tornado-Resilient Building Codes. American Society of Civil Engineers. doi:10.1061/9780784412503
Prevatt, D. O., Roueche, D. B., Aponte-Bermudez, L. D., Kijewski-Correa, T., Li, Y., Chardon-Maldonado, P., et al. (2018). Performance of Structures under Successive Hurricanes: Observations from Puerto Rico and the US Virgin Islands after Hurricane Maria. Proc. Forensic Eng. 8th Congress, November 29-December 2, Austin, TX. doi:10.1061/9780784482018.101
Prevatt, D. O., van de Lindt, J. W., Back, E. W., Graettinger, A. J., Pei, S., Coulbourne, W., et al. (2012b). Making the Case for Improved Structural Design: Tornado Outbreaks of 2011. Leadersh. Manage. Eng. 12 (4), 254–270. doi:10.1061/(asce)lm.1943-5630.0000192
Prevatt, D. O., van de Lindt, J. W., and Graettinger, A. (2011). Damage Study and Future Direction for Structural Design Following the Tuscaloosa Tornado of 2011. Gainesville, FL: Univ. of FloridaAvailable at: http://www.davidoprevatt.com/wp-content/uploads/2011/08/tuscaloosa-tornado-report-final.pdf.
Rathje, E. M., Dawson, C., Padgett, J., Pinelli, J.-P., Stanzione, D., Arduino, P., et al. (2017). DesignSafe: A New Cyberinfrastructure for Natural Hazards Engineering. ASCE Nat. Hazards Rev. 18, 3. doi:10.1061/(ASCE)NH.1527-6996.0000246
Robertson, I., Esteban, M., Stolle, J., Takabatake, T., Mulchandani, H., Kijewski-Correa, T., et al. (2019a). StEER - Palu Earthquake and Tsunami, Sulawesi, Indonesia: Field Assessment Team 1 (FAT-1) Early Access Reconnaissance Report (EARR). DesignSafe-CI. doi:10.17603/DS2JD7T
Robertson, I., Kijewski-Correa, T., Mosalam, K., Prevatt, D., and Roueche, D. (2019b). Palu Earthquake and Tsunami | Palu, Sulawesi, Indonesia | 09-27-2018 | Lat -0.90833 Long 119.8708267. DesignSafe-CI. doi:10.17603/ds2-r40d-m412
Robertson, I., Kijewski-Correa, T., Roueche, D., and Prevatt, D. (2018). Palu Earthquake and Tsunami, Suwalesi, Indonesia Preliminary Virtual Assessment Team (PVAT) Report. DesignSafe-CI. doi:10.17603/DS2XD5S
Rojahn, C. (2005). ATC-20-1 Field Manual: Postearthquake Safety Evaluation of Buildings. Redwood City, CA: Applied Technology Council.
Roueche, D., Ambrose, K., Kijewski-Correa, T., Micheli, L., Rawajfih, H., Rihner, M., et al. (2020d). Preliminary Virtual Reconnaissance Report (PVRR). StEER - 3 March 2020 Nashville Tornadoes. doi:10.17603/ds2-d0z8-0z73
Roueche, D. B., Lombardo, F. T., Smith, D. J., and Krupar, R. J. (2018). Fragility Assessment of Wind-Induced Residential Building Damage Caused by Hurricane Harvey (2017)Forensic Engineering 8th Conference. ASCE, Austin, TX. doi:10.1061/9780784482018.100
Roueche, D., Cleary, J., Barnes, R., Davis, B., Marshall, J., Rittelmeyer, B., et al. (2019b). StEER - 3 March 2019 Tornadoes in the Southeastern US: Field Assessment Structural Team (FAST) Early Access Reconnaissance Report (EARR). DesignSafe-CI. doi:10.17603/ds2-qav0-t570
Roueche, D., Kameshwar, S., Marshall, J., Bandaru, S., Do, T., Kijewski-Correa, T., et al. (2020e). Event Briefing. StEER - Hurricane Delta. DesignSafe-CI. doi:10.17603/ds2-y2gc-xj10
Roueche, D., Kameshwar, S., Marshall, J., Mashrur, N., Kijewski-Correa, T., Gurley, K., et al. (2020c). Hybrid Preliminary Virtual Reconnaissance Report-Early Access Reconnaissance Report (PVRR-EARR). StEER - Hurricane Laura. DesignSafe-CI. doi:10.17603/ds2-ng93-se16
Roueche, D., Kijewski-Correa, T., Mosalam, K., Prevatt, D., and Robertson, I. (2020b). StEER: Virtual Assessment Structural Team (VAST) Handbook: Data Enrichment and Quality Control (DEQC) for StEER Earthquake Rapid Evaluation Form Version 1.0. Available at: https://www.steer.network/resources
Roueche, D., Kijewski-Correa, T., Mosalam, K., Prevatt, D., and Robertson, I. (2019a). StEER: Virtual Assessment Structural Team (VAST) Handbook: Data Enrichment and Quality Control (DEQC) for US Windstorms Version 1.0. Available at: https://www.steer.network/resources
Roueche, D, Kijewski-Correa, T, Cleary, J, Gurley, K, Marshall, J, Pinelli, J, et al. (2020a). StEER - Hurricane Michael. DesignSafe-CI. doi:10.17603/ds2-5aej-e227
Dickenson, S. E., and Werner, S. D. (1996). in Hyogo-Ken Nanbu Earthquake of January 17, 1995: A post-earthquake Reconnaissance of Port Facilities (ASCE Publications).
Sezen, H., Elwood, K. J., Whittaker, A. S., Mosalam, K. M., Wallace, J. W., and Stanton, J. F. (2000). Structural Engineering Reconnaissance of the August 17, 1999, Kocaeli (Izmit), Turkey, Earthquake. Berkeley, CA: Pacific Earthquake Engineering Research Center.
Shimamoto, T., Tsutsumi, A., Kawamoto, E., Miyawaki, M., and Sato, H. (1995). Field Survey Report on Tsunami Disasters Caused by the 1993 Southwest Hokkaido Earthquake. Pure Appl. Geophys. 144 (3-4), 665–691. doi:10.1007/bf00874389
Simmons, K. M., Kovacs, P., and Kopp, G. A. (2015). Tornado Damage Mitigation: Benefit-Cost Analysis of Enhanced Building Codes in Oklahoma. Weather, Clim. Soc. 7 (2), 169–178. doi:10.1175/wcas-d-14-00032.1
Sparks, P. R. (1990). Performance of Structures in Hurricane Hugo 1989: The Carolinas. NIST Special Publication, 445–457.
Stolle, J., Krautwald, C., Robertson, I., Achiari, H., Mikami, T., Nakamura, R., et al. (2020). Engineering Lessons from the 28 September 2018 Indonesian Tsunami: Debris Loading. Can. J. Civ. Eng. 47, 1–12. doi:10.1139/cjce-2019-0049
Synolakis, C. E., and Kong, L. (2006). Runup Measurements of the December 2004 Indian Ocean Tsunami. Earthquake Spectra 22 (3), 67–91. doi:10.1193/1.2218371
Tomiczek, T., Kennedy, A., and Rogers, S. (2014). Collapse Limit State Fragilities of wood-framed Residences from Storm Surge and Waves during Hurricane Ike. J. Waterway, Port, Coastal, Ocean Eng. 140 (1), 43–55. doi:10.1061/(asce)ww.1943-5460.0000212
Tomiczek, T., Kennedy, A., Zhang, Y., Owensby, M., Hope, M. E., Lin, N., et al. (2017). Hurricane Damage Classification Methodology and Fragility Functions Derived from Hurricane Sandy’s Effects in Coastal New Jersey. J. Waterway, Port, Coastal, Ocean Eng. 143 (5), 04017027. doi:10.1061/(asce)ww.1943-5460.0000409
USACE (1965). Hurricane Betsy: September 8-11, 1965. New Orleans District: U.S. Army Corps of Engineers
USGS (2000). Geological Survey, Implications for Earthquake Risk Reduction in the United States from the Kocaeli, Turkey, Earthquake of August 17, 1999. U.S. Geological Survey.
USGS (2020). Short-Term Network Monitoring: LACAM30163, United States Geological Survey. Available at: https://stn.wim.usgs.gov/STNPublicInfo/#/HWMPage?Site=30163&HWM=39181(Accessed November 25, 2020).
Wartman, J., Berman, J. W., Bostrom, A., Miles, S., Olsen, M., Gurley, K., et al. (2020). Research Needs, Challenges, and Strategic Approaches for Natural Hazards and Disaster Reconnaissance. Front. Built Environ. 6. doi:10.3389/fbuil.2020.573068
Westoby, M. J., Brasington, J., Glasser, N. F., Hambrey, M. J., and Reynolds, J. M. (2012). 'Structure-from-Motion' Photogrammetry: A Low-Cost, Effective Tool for Geoscience Applications. Geomorphology 179, 300–314. doi:10.1016/j.geomorph.2012.08.021
Womble, J. A., Adams, B. J., Ghosh, S., and Friedland, C. J. (2008). Remote Sensing and Field Reconnaissance for Rapid Damage Detection in Hurricane Katrina. Structures Congress 2008: Crossing Borders, 1–10.
Wood, R., Roueche, D., Cullum, K., Davis, B., Gutierrez Soto, M., Javadinasab Hormozabad, S., et al. (2020). Early Access Reconnaissance Report (EARR). StEER - 3 March 2020 Nashville Tornadoes. DesignSafe-CI. doi:10.17603/ds2-2zs2-r990
Woolpert, (2006). Post Event Damage Survey Data Requirements Whitepaper. U.S. Army Corps of Engineers.
Yeh, H., Sato, S., and Tajima, Y. (2013). The 11 March 2011 East Japan Earthquake and Tsunami: Tsunami Effects on Coastal Infrastructure and Buildings. Pure Appl. Geophys. 170 (6-8), 1019–1031. doi:10.1007/s00024-012-0489-1
Keywords: StEER, reconnaissance, damage assessment, structures, hurricanes, earthquakes, tornadoes, tsunamis
Citation: Kijewski-Correa T, Roueche DB, Mosalam KM, Prevatt DO and Robertson I (2021) StEER: A Community-Centered Approach to Assessing the Performance of the Built Environment after Natural Hazard Events. Front. Built Environ. 7:636197. doi: 10.3389/fbuil.2021.636197
Received: 01 December 2020; Accepted: 10 May 2021;
Published: 31 May 2021.
Edited by:
Michael Keith Lindell, University of Washington, United StatesReviewed by:
Carol Friedland, Louisiana State University, United StatesCopyright © 2021 Kijewski-Correa, Roueche, Mosalam, Prevatt and Robertson. This is an open-access article distributed under the terms of the Creative Commons Attribution License (CC BY). The use, distribution or reproduction in other forums is permitted, provided the original author(s) and the copyright owner(s) are credited and that the original publication in this journal is cited, in accordance with accepted academic practice. No use, distribution or reproduction is permitted which does not comply with these terms.
*Correspondence: Tracy Kijewski-Correa, dGtpamV3c2tAbmQuZWR1