 Jianxiang Huang
 Phil Jones2*
- 1Department of Urban Planning and Design, The University of Hong Kong, Hong Kong, China
- 2Welsh School of Architecture, Cardiff University, King Edward VII Avenue, Cardiff, United Kingdom
- 3Key Laboratory of Tropical Atmosphere-Ocean System, Ministry of Education, School of Atmospheric Sciences, Sun Yat-sen University, Zhuhai, China
- 4Department of Environmental Health, Harvard T.H. Chan School of Public Health, Boston, MA, United States
The coronaviruses have inflicted health and societal crises in recent decades. Both SARS CoV-1 and 2 are suspected to spread through outdoor routes in high-density cities, infecting residents in apartments on separate floors or in different buildings in many superspreading events, often in the absence of close personal contact. The viability of such mode of transmission is disputed in the research literature, and there is little evidence on the dose–response relationship at the apartment level. This paper describes a study to examine the viability of outdoor airborne transmission between neighboring apartments in high density cities. A first-principles model, airborne transmission via outdoor route (ATOR), was developed to simulate airborne pathogen generation, natural decay, outdoor dispersion, apartment entry, and inhalation exposure of susceptible persons in neighboring apartments. The model was partially evaluated using a smoke tracer experiment in a mock-up high-density city site and cross-checking using the computational fluid dynamics (CFD) models. The ATOR model was used to retrospectively investigate the relationship between viral exposure and disease infection at an apartment level in two superspreading events in Hong Kong: the SARS outbreak in Amoy Gardens and the COVID-19 outbreak in Luk Chuen House. Logistic regression results suggested that the predicted viral exposure was positively correlated with the probability of disease infection at apartment level for both events. Infection risks associated with the outdoor route transmission of SARS can be reduced to <10%, if the quanta emission rate from the primary patient is below 30 q/h. Compared with the indoor route transmission, the outdoor route can better explain patterns of disease infection. A viral plume can spread upward and downward, driven by buoyancy forces, while also dispersing under natural wind. Fan-assistant natural ventilation in residential buildings may increase infection risks. Findings have implication for public health response to current and future pandemics and the ATOR model can serve as planning and design tool to identify the risk of airborne disease transmission in high-density cities.
Introduction
The coronaviruses, a group of RNA viruses of zoonotic origin (Woo et al., 2010), have inflicted global health and societal damages in recent decades. Examples include the Severe Acute Respiratory Syndrome (SARS) caused by SARS-CoV-1 (DoH, 2003), the Middle East Respiratory Syndrome (MERS) caused by MERS-CoV (WHO, 2019), and the most recent Coronavirus Disease 2019 (COVID-19) pandemic caused by SARS-CoV-2 (WHO, 2020a). The coronaviruses are believed to spread primarily through close contact with virus-laden respiratory droplets among people in close distances (DoH, 2019) or through direct contact or indirect fomites, although fomite is considered less common, and few cases of fomite transmission have been reported (Goldman, 2020).
Research evidence is emerging on airborne transmission of coronaviruses, in which viral pathogens spread via droplet nuclei, the dried residua of larger respiratory droplets (Wells, 1955), alternatively known as microdroplets (WHO, 2020b) or aerosols (CDC, 2020). Fine droplet nuclei equal or smaller than 5 μm in size (WHO, 2020b) are capable of suspending in the air and can travel over relatively long distances, although the actual size threshold is disputed (Siegel et al., 2007). Airborne SARS-CoV-2 viral copies were found in hospitals in Wuhan, China (Liu et al., 2020), and viable ones were found in aerosol samples meters away from COVID-19 patients (Lednicky et al., 2020). Mechanistic studies of particle dynamics suggest that airborne transmission is the dominant mode in near-field transmission of COVID-19 (Chen et al., 2020). The WHO initially dismissed airborne transmission of COVID-19 as a major mode of transmission (WHO, 2020b). It reconsidered in October 2020, after receiving petitions from 200+ research scientists (Morawska and Milton, 2020), acknowledging that “more studies are underway to better understand the conditions in which aerosol transmission is occurring” (WHO, 2020c).
Mitigation of coronavirus transmission is of particular urgency in high-density cities, where a growing number of COVID-19 superspreading events are found in and between high-rise residential buildings (FHB, 2020). Disease spread between neighboring apartments, often among residents who do not know each other (Ting, 2020). The airborne transmission of coronaviruses via the outdoor route is suspected to have played a role in these superspreading events in high-density cities. A well-cited event is the SARS outbreak in Amoy Gardens, Hong Kong, where large numbers of infections were reported from apartments on various floor levels of high-rise buildings and in different buildings, all traced epidemiologically to a common source without explicit evidence of personal contact or fomite transmission (SARS Expert Committee, 2003). Medical evidence suggested the nasopharyngeal viral load in patients upon hospitalization correlated inversely with distance from the apartment of the primary patient, suspecting airborne transmission played an important role (Chu et al., 2005). Evidence from numerical studies pointed at the same direction: a virus-laden plume exhausts into the reentrant space and then rises upward and spreads to other apartments in the block and to other buildings by prevailing wind and wake flow (Yu et al., 2004).
The feasibility of airborne transmission of coronaviruses via the outdoor route is disputed in the scientific community. A widely held view considers that virus-laden aerosols are quickly diluted in the outdoor air, or lose their virulence under sunlight (Ratnesar-Shumate et al., 2020) and are therefore unable to initiate or sustain infections. A majority of researchers support airborne transmission via the indoor route, which is known to spread air pollutants such as cigarette smoke to other apartments inside multiunit residences (Kraev et al., 2009). SARS virus-laden aerosols were suspected to have infiltrated between apartments in Block E of Amoy Gardens through the elevator shaft, stair cases, the gaps of doors (Li et al., 2005) and via the external building reentrant space, a narrow semi-outdoor space for the placement of air conditioning (AC) condensing units (Li et al., 2006). Other investigations suggest that flawed drainage systems, particularly the dried up U-traps connected to the floor drains in bathrooms might have lost the sealing functions, allowing contaminated fecal aerosols to enter the bathrooms from sewage pipes, driven by vertical pressure in high-rise buildings (SARS Expert Committee, 2003). Fecal aerosols through drainage systems are also suspected to have played a role in the vertical transmission of COVID-19 between apartments in a high-rise building in Guangzhou (Kang et al., 2020). Most of the simulation literature does not discuss the viral exposure achievable via airborne transmission through an outdoor route. Further studies are therefore needed that integrate methods from both engineering and medical literatures, such as first-principles numerical simulation and viral infectious dose, in order to gain a better understanding of the “apartment to apartment” external airborne transmission of coronaviruses, especially in high-density cities. Mitigation of coronavirus transmission is of a particular importance in high-density cities, with higher numbers of infected cases reported (Kadi and Khelfaoui, 2020) and outbreaks often take place earlier than other types of settlement (Carozzi et al., 2020).
This paper describes a study to examine the infection risk of outdoor airborne transmission between neighboring apartments in high-density cities. A first-principles simulation model, the airborne transmission via outdoor route (ATOR), has been developed to assess the airborne pathogen generation from primary cases: indoors, natural decay, outdoor dispersion, apartment entry, and inhalation exposure at apartment level. Predicted results were partially evaluated using a smoke tracer experiment conducted in a mock-up site with concrete bins mimicking 1:50 scale buildings. Particulate Matter <1 μm in size (PM1) were used as proxies for virus-laden droplet nuclei and compared with ATOR simulation results. Computational fluid dynamics (CFD) simulations were also compared with the ATOR predictions. Using two cases of COVID-19 and SARS outbreaks in Hong Kong, the ATOR model was used to analyze retrospectively the viral exposure in apartments. The CFD simulation was also carried out for the two cases and compared to the ATOR predictions. The relationship between disease infection and predicted viral exposure was analyzed using the logistic regression. Comparisons were made between the outdoor and indoor route transmission in explaining patterns of disease infection.
Results from this study can enhance our understanding of the transmission mode during superspreading events, identifying built environment characteristics, which offer protective factors, and informing public health responses and the design and operation of high-density cities.
Relevant Work
Numerical simulations have been used to study airborne pathogen transmission in urban environments. The most commonly used tool is the CFD simulation (Ferziger and Perić, 2002) with various turbulence models and dispersion modules for passive scalar, such as water vapor, chemical pollutants, and aerosol particles.
Another body of literature, referred to as “urban canyon models,” focuses on microscale air pollutant dispersion within street canyons (Forehead and Huynh, 2018). Zonal airflow network models, initially developed to assess indoor energy and air mass transfer (Chen and Li, 2002; ASHRAE, 2009), have been adapted to consider outdoor urban sites (Yao et al., 2011; Liang et al., 2018). Many simulation software packages have been developed with varying performance levels of precision, scale, and computational cost. Examples include Fluent, Airpak (ANSYS, 2020), PHAST (Witlox et al., 2018), the Quick Urban & Industrial Complex Dispersion Modeling System (QUIC) (Brown et al., 2016), the urban dispersion model SIRANE (Soulhac et al., 2017), the Operational Street Pollution Model (OSPM) (Kakosimos et al., 2010), CT-Analyst (Leitl et al., 2016), etc. Field measurement studies have been conducted to evaluate the performance of the above-mentioned numerical simulation models. Hanna and Chang (2015) measured tracer gas concentration in Manhattan, NY and found good agreement between measurement and predicted results using various numerical models.
Research literature remains inconclusive over the mode of coronavirus transmission between apartments in high-density cities. A conventional view considers disease spreading through the drainage systems, such is the case of the COVID-19 infection that occurred in a high-rise building in Guangzhou (Kang et al., 2020) and the SARS outbreak in Amoy Gardens (DoH, 2003). Viral aerosols are suspected to spread via drainage pipes inside buildings due to backpressure in the system and the use of bathroom exhaust fans, yet simulated results appear to disagree with the infection patterns (Li et al., 2006). Hwang et al. (2021) suspected the transmission of COVID-19 in a high-rise apartment building in Seoul, South Korea through a vertical air duct in the bathrooms, in which viral aerosols spread upward and downward through the air duct by the stack effect (Hwang et al., 2021). Niu and Tung (2008) considered the vertical spread of viral aerosols through windows in high-rise buildings, as both simulated results, and tracer gas experiment suggested that the exhaust air from an apartment on the lower floor can rise and enter into the one above. Animals have been suspected to have spread disease, such as ferrets, cats, dogs for COVID-19 (Shi et al., 2020), and mice for SARS (Wentworth et al., 2004), though these views are not widely shared. Airborne transmission via indoor and outdoor spaces has been suspected (Yu et al., 2004), while definitive evidence is rare.
Knowledge on airborne transmission of coronaviruses is still emerging. Two significant research gaps exist. First, it is unknown whether ATOR can deliver the viral exposure needed to initiate infections. The numerical simulation literature focuses on the prediction of particle trajectories, the airflow streamlines (Tsou, 2003), the dilution factors of bio-aerosols (Yu et al., 2004), patterns of plume transmission (Li et al., 2006), and air pollutant concentration (Li et al., 2005). There are no estimates on the inhalation viral exposure for susceptible persons, which may occur over an extended period of time. Second, the dose–response relationship during the apartment-to-apartment disease transmission events is poorly understood. There are no guidelines or public health response to mitigate apartment-to-apartment transmission risks in high-density cities. More studies are therefore needed to estimate the viral exposure and to establish the dose–response relationship of coronavirus ATOR.
Methods
A first-principles simulation model, the ATOR, has been developed to assess the infection risk of coronaviruses in high-density cities. The model combines (1) the first-principles simulation of CFD and zonal airflow network model to assess the viral quanta concentration from one apartment to another via the outdoor environment, and (2) the Wells–Riley (WR; Riley et al., 1978; Nardell, 2016) equation, which predicts the probability of infection as an exponential function of inhalation dose. Smoke tracer experiments were conducted in a mock-up high-density city site to partially evaluate the performance of the ATOR model in predicting the concentration of PM1. Two superspreading events of the coronaviruses in Hong Kong were retrospectively analyzed at the apartment level. Finally, the logistic regression analysis was used to determine the patterns of disease infection in relationship to the predicted viral exposure.
Simulating Airborne Transmission via Outdoor Route
The ATOR model was developed to quantitatively assess the pathogen generation, dispersion, natural decay, and inhalation exposure in a high-density city. A schematic depiction of the ATOR model is provided in Figure 1. The input data are the location and quantity of viral shedding from the primary patient(s), 3D urban and building geometries, weather conditions (wind speed and direction), and anthropogenic heat in the source apartment from occupants and small power equipment. The outputs are concentrations of infectious release per unit volume of air in the neighborhood, inside apartments, and the inhalation dose by susceptible persons in neighboring apartments. First-principle models, such as the Windows version of the CFD software AIR (WinAIR) (Jones et al., 2013) and a zonal airflow network model (Liang et al., 2018), were included as components. Steady-state conditions are assumed, and the infectious release is assumed to be instantaneously and uniformly mixed in the emission zone.
Figure 1. A conceptual framework of airborne transmission of coronavirus consisting of pathogen generation, natural decay, outdoor dispersion, and apartment entry.
Pathogen Generation
The WR approach was adopted, which uses the concept of “quanta” to measure the airborne spread of disease infection. One quantum is defined as the minimum dose of inhaled airborne organisms necessary to cause infection (Nardell, 2016). The WR approach is suitable for this study, since the precise rate of viral shedding from patients and the minimum number of infectious viral particles required to initiate new infections is unknown for coronaviruses. Instead of committing to an assumed number of viral copies or particles shed by a primary patient, the WR approach allows for quantitative assessment of the viral exposure for a susceptible population, while tacitly accounting for factors associated with viral decays under the stress of aerosolization, and dehydration. The WR equation can also be used to reversely estimate the source emission rate and the quanta concentration, if the disease infection patterns, length of exposure, and the pulmonary ventilation rate of individuals are known. In this study, the source quanta emission rate of an infected person is denoted as (), with the unit of quanta per hour (q/h). Instead of using an estimated value from existing literature, the is backcalculated using disease infection patterns (see the Appendix). In other words, we predict back from all secondary infections and obtain a value of the viral exposure needed to initiate new infections, we then establish the source quanta emission rate needed to achieve the viral exposure at secondary infection cases. The backcalculated source quanta emission rate is then checked against the literature.
Pathogen Decay
It refers to the decrease of infectious viral copies in time. The rate of decay is subject to ambient temperature, humidity (Pyankov et al., 2018; Mecenas et al., 2020), and sunlight (Ratnesar-Shumate et al., 2020). The decay function is expressed in Equation 1. For a volume of infectious release at the time ti, the viral quantity () is estimated as a function of the viral quantity () at the previous time step (tn−1), the time lag between the two (Δt), and the airborne viral survival rate kd in accordance with a disease transmission previously developed by Halloran et al. (2012),
where kd for both SARS-CoV-1 and SARS-CoV-2 has been estimated at −6.94 × 10⁻⁵ (quanta/m3 s) or −0.25 (quanta/m3 h) according to van Doremalen et al. (2020).
Outdoor Dispersion
The airborne viral concentration in a volume of outdoor air is a function of the viral decay and dilution during airborne transmission. In accordance with the WR approach, a zonal approach has been taken, assuming a small zone i of well-mixed air, with J number of neighboring zones to its downwind as the virus sink, and K number of neighboring zones to its upwind as the virus source. The airborne viral concentration for zone i at a time step tn () can be expressed in Equation 2 below,
where is the quantity of newly added pathogens from an infectious person to zone i; Vi and ρi are the volume and density of air in zone i; and are the airborne viral concentration for zone i and j at the previous time step tn−1; Δt is a small time lag between tn and tn−1; Fi,j is the outgoing airflow from zone i to j; Fk,i is the incoming airflow from zone k to i; and ρk is the density of air at zone k. The calculation of Fi,j, Fj,i, ρi, and ρk is specified in the air and energy flow simulation module as given below.
A zonal airflow network model (Liang et al., 2018; Huang et al., 2020) has been used to predict wind and buoyancy-driven airflow in the urban canopy Layer in high-density cities. The model domain consists of a network of “zones.” The volume of air and droplet nuclei within each zone is considered well-mixed in accordance with the WR approach. Interzonal airflow is assumed to be driven by pressure, temperature, and density differences. The model considers the exhaust fans and anthropogenic heat sources discharged from apartments into the ambient air. The model domain is joined by external boundaries from above, the east, south, west, and north. The vertical wind speed profile is input as a boundary condition. Zonal temperature, pressure, and airflow conditions are solved using mass continuity, energy conservation, and pressure balance equations.
The Pressure Balance and Mass Continuity
The volume of air in each zone is assumed to have a uniform temperature (Ti) and density (ρi). The zonal air pressure () at a given height (He) is expressed as (3), where is the air pressure at the geometric center of the zone i, g is the gravitational acceleration, and He is the vertical distance from the zone center. Pressure, temperature, and density observe the ideal gas law ρi = Pi/Rair Ti (4) (Rair is the gas constant for air). The airflow rate Fij from zone i to neighboring zone j is a function of pressure and density differences at the border and characteristics of the opening (Aij) and is given as:
Mass conservation is observed at each zone as
which can be simplified as:
since mass changes caused by density difference is often negligible.
The Energy Conservation
The energy conservation equation for the body of air within zone i is expressed in Equation 8, which describes heat transfer from airflows to and from neighboring zones, thermal massing, and anthropogenic heat generation, i.e., traffic and heating, ventilation, and air conditioning (HVAC) exhaust:
where A is the number of active heat sources within zone i, and λ are the power and operational coefficient of each active heat source; Fij and Fji are the airflow rates between zone i and neighboring zone j; J is the number of neighboring zones; and CP and Vi are the specific heat capacity and volume of the zonal air. Steady-state simulations were performed using the ATOR model in this study, and due to the variability of solar angle and radiation intensity, solar heat gains at building surfaces are not accounted for in this study.
Apartment Entry
The virus-laden fine particles will find their way from apartment to apartment through natural infiltration and forced ventilation where exhaust fans are used. The infiltration rates vary from apartment to apartment, depending on air leakage factors, i.e., opening windows, and ambient wind conditions. A simplified method is used to estimate the airborne viral concentration in an apartment () from an outdoor source using Equation 9,
where the value of I/O has been estimated to be 0.7, referring to studies by Dockery and Spengler (1981). A Hong Kong study found the average I/O ratio is 0.8 for fine particles and 0.6 for NOx (Chan, 2002).
Inhalation Exposure
The inhaled dose of airborne virus is estimated as a function of quanta concentration in the ambient air, the length of exposure, and the pulmonary ventilation rate of individuals, as it is expressed in Equation 10 below,
where is the inhaled viral quanta; Te is the duration of exposure; Tb the duration of breath under normal respiration rate, estimated at 1 breath in every 4 s; and VT is the tidal volume per breath, estimated at 500 cc (5 × 10⁻⁴ m3) in reference to the EPA exposure factors handbook (2011).
The risk of disease infection at apartment level (P) is estimated using the WR equation (Riley et al., 1978), in which P is a probability function of inhaled infectious viral quanta () as it is shown in Equation 11 below:
Smoke Tracer Experiment in Mock-Up High-Density City
The ATOR model was evaluated using smoke tracer experiments conducted on a mock-up site. The site mimics an array of high-rise high-density buildings at 1:50 scale. Fine particles smaller than 1 μm (PM1) were generated using a smoke tracer as a proxy for virus-laden droplet nuclei. The PM1 concentration was measured using particle mass spectrometers and compared with simulated results.
Mock-Up Site
A mock-up high-density city consisted of some 3,000 concrete bins that were built on a university campus in Guangzhou, China (23°4′ N and 113°23′ E). Each concrete bin, measuring at 0.5, 0.5, and 1.2 m in width, length, and height, respectively, resembles a high-rise building at 1:50 scale. The height of a concrete bin mimics a 20–25 story residential building, which represents the average housing stock in Hong Kong consisted of a mixture of 8–12 story apartments in older districts and 40+ story ones in newer districts (Chau et al., 2007). The concrete bins were placed in an unobstructed rectangular field facing north–south, separated from each other by mock-up street canyons of 0.5 m in width (Figure 2).
Figure 2. (A) The mock-up high-density city site and the smoke tracer experiment layout; (B) a screenshot of a video taken during the smoke tracer experiment, with the metal combustion chamber with smoke cake inside; (C) deployment of particle mass spectrometer; and (D) deployment of thermal couples on the concrete bin façade, roof, and the ground.
Experiment Procedure
Smoke was generated near ground level from the burning of smoke cakes consisting of sulfur (40% by mass), sawdust (20% by mass), and desiccants (CaCl2, 40% by mass). The combustion was contained in a perforated metal chamber, allowing mixing of aerosols within the chamber before being released (Figure 2B). The experiment was carried out on a sunny partially cloudy day during December 9, 2017. Each measurement scenario took place within small time segments of 20 s, during which the ambient wind condition and smoke concentration were relatively stable, in accordance with the steady-state assumption used in the ATOR model. Recordings were made using a video camera during the experiment for recording keeping.
Equipment
The concentration of PM1 was measured using 18 sets of particle mass spectrometers placed to the downwind direction from the source (Figure 2C), each consists of a particle photometer (OPC-N2 sensor, Alphasense Ltd., Great Notley, Essex, UK) measuring light scattered by individual particles carried in a sample air stream through a laser beam (Alphasense, 2015). Results were used to estimate mass concentration of PM1. The sensors have been evaluated extensively in the research literature (Sousan et al., 2016; Mukherjee et al., 2017). Temperature, humidity, and wind speed were measured using the Kestrel 4,500 Weather Meter sensors Kestrel, Boothwyn, PA, USA. To account for heat gains from surfaces, the temperature of concrete bin surfaces (roof, east, south, west, and north façade) and the ground were measured using the Thermal Couples (EQ-TC-K-Cali-24S), TE Wire & Cable LLC, Saddle Brook, NJ, USA attached to the Agilent 34972A data logger, Agilient, Santa Clara, CA, USA. The ambient temperature, humidity, wind speed, and direction were measured using the HOBO Weather Station, Onset Computer Corporation, Bourne, MA, USA placed at the periphery of the site. Two sets of particle mass spectrometers were also placed at the site border upwind from the smoke tracer experiment in order to measure the ambient particular matter concentration.
A cross-checking of the ATOR model was also conducted using the WINAIR CFD simulation software (Jones et al., 2013). It is a relatively simple CFD model based on a Cartesian grid, which can simulate the concentration of pollutants as a scalar, and it uses a fixed viscosity turbulence model for outdoor simulations.
Predicting Infectious Bioaerosol Transmission in Coronavirus Outbreaks
The ATOR model was used to assess airborne transmission of coronaviruses via the outdoor route in two superspreading events in Hong Kong: the SARS outbreak in Amoy Gardens and the COVID-19 outbreak in the Luk Chuen House. In both events, disease transmission was reported between apartments on different floor levels or between buildings, in the absence of definitive evidence of personal contact, fomite, or fecal transmission routes.
Logistic regression analysis was used to determine the strength of correlation between probability of disease infection and predicted viral exposure. The dependent variable was the binary infection (1 = someone in the apartment was infected and 0 = none). The independent variable was the predicted inhalation viral exposure estimated for each apartment using the ATOR model. The unit of analysis is each apartment, in order to exclude higher order infections, in this case, one potential secondary case per apartment if there is more than one occupant in an apartment. The built environment attributes of disease outbreak venue, the chain of disease transmission, and the setup of simulation inputs are specified below:
SARS Outbreak in the Amoy Gardens, Hong Kong
A well-cited superspreading event occurred in Amoy Gardens Phase I ( ), a high-density private housing estate located in Kowloon Bay, Hong Kong (Tsou, 2003). A total of 321 infected cases from 142 apartments were diagnosed with SARS between March 21 and April 15, 2003. The Phase I of Amoy Gardens consists of residential towers (Blocks A–H), each measuring 105 m high with 33 residential floors situated on top of a three-level high podium of commercial uses (Figure 3A). The towers were of the cruciform shape, each arm of the cruciform containing two apartments, with eight flats on each floor sharing the staircase and elevators (Figure 3B).
Figure 3. (A) Configuration of the Amoy Gardens Phase I during the 2003 SARS outbreak; (B) a typical building floor plan for Amoy Gardens (SARS Expert Committee, 2003); and (C) a summary of SARS infection cases by date of symptom onset in Amoy Gardens, Hong Kong.
The chain of infections is shown in Figure 3C. The primary patient visited Apt.7 on 16/F in Block E from March 14 to 19, 2003 (Riley et al., 2003; Li et al., 2005). The length of exposure can be assumed to be within a 5-day period. A total of 52 other apartments (64 individuals) had diagnosed SARS cases on or before March 24, 2003, within the 5-day incubation period for SARS (Lessler et al., 2009; DoH, 2019), which can be considered as secondary infections directly linked to the primary case. Infection cases after March 24, marked in gray color in Figure 3C, may be secondary or higher-order infections. Disease infection data were acquired from published studies (Li et al., 2006). Infected cases were epidemiologically linked to a primary patient who then stayed in Apt.7, 16/F in Block E (SARS Expert Committee, 2003). The government committee suspected that the disease spread primarily via the sewage system, close personal contact, and shared communal facilities such as lifts and staircases (DoH, 2003), while research literature suggested that the airborne transmission of both outdoor route (Yu et al., 2004) and indoor route (Li et al., 2005) was also possible.
Data from several sources were used to set up the ATOR simulation. The 3D building dataset were obtained from the Lands Department (2016). The prevailing wind in March 2003, measured by the Hong Kong Observatory, was mostly East-Southeast (110° from north) with average wind speed of 3.6 m/s at a reference height of 16 m (Tsou, 2003). The ambient air temperature was mostly in the mild range of 14–17°C during the outbreak (Li et al., 2005), therefore precluding the use of AC units. A mechanical exhaust fan was used by the primary patient during the outbreak (DoH, 2003), estimated with 7.7 W of power output and air volume flow rate (qr) of 0.21 m3/s. The anthropogenic heat generation rate from the apartment was estimated at 440 W for small power equipment, for the assumed three-person household of 40 m2 in floor area.
COVID-19 Outbreak in the Luk Chuen House
A COVID-19 outbreak took place in the Luk Chuen House ( ), a 16-floor public housing estate in Shatin District of Hong Kong. A total of nine patients were diagnosed with COVID-19 from May 31 to June 13, 2020 (DoH, 2020). The building has an elongated double-loaded floor plan with 40 apartments arranged on each floor, separated by a corridor (Figure 4a). Each apartment consists of three rooms: the living room is connected to the corridor; the toilet and kitchen are located on the other side, with window-mounted exhaust fans used for ventilation. Each apartment measure between 29.2 and 32.5 m2 in floor area and was occupied mostly by a two-person household due to its small size (Figure 4b).
Figure 4. (a) An axiomatic view of the Luk Chuen House in its urban context (Source: Google Map); (b) the floorplan of the Luk Chuen House consisting of an elongated rectangular block with the location of the primary case; and (c) a summary of COVID-19 infection cases marked on a cross section, color-coded by date of symptom onset in Luk Chuen House, Hong Kong.
The chain of COVID-19 infections is shown in Figure 4c. Most of the infected apartments were stacked vertically on top of each other (HKHAD, 2020). The primary patient, a woman residing in Apt.812, was diagnosed with COVID-19 and hospitalized on May 31, 2020 together with her husband (Tsang and Chan, 2020). Infections spread to four other apartments (Apts.710, 811, 1,012, and 1,112) before June 4, and two more apartments (Apts.810 and 812) on June 12. The infectious disease expert Yuen Kwok-yung of Hong Kong visited the site and found the exhaust fans mounted in the bathroom and kitchen were used by the primary patient during the disease transmission. He suspected that ATOR played a role in the outbreak, whereas the transmission of fecal aerosol through compromised floor drain was unlikely due to the building configuration (ON.CC, 2020). This study included five out of the six infected apartments, except for Apt.811 located across from the corridor from the primary case, which might have been caused by the indoor transmission. The timeline of disease infection in residing apartments was verified from multiple news media sources and from the Hong Kong government database (CHP, 2020). For the assumed two-person occupancy in each apartment, the length of exposure for secondary infections was estimated to be 5 days between May 26 and 31. The primary patients may have contracted the virus as early as May 26, 2020 and remained infectious before hospitalization during the incubation period of COVID-19, estimated at 5 days on average (Lauer et al., 2020; Li et al., 2020).
Weather conditions during the outbreak were recorded at the Sha Tin automatic weather station (N 22°24′09″ and E 114°12′36″), 1.5 km from the Luk Chuen House. The meteorological record at 10-min interval between May 26 and 31, 2020 was obtained from the Hong Kong Observatory and plotted in Figure 5. The weather condition had been hot and humid, AC units were probably used intermittently. In the absence of a detailed AC usage schedule, it was assumed that AC was used when the ambient air temperature exceeded 29.5°C, a threshold established empirically by Kwok et al. (2017) for households of Hong Kong. The indoor room temperature was assumed to be 2°C lower than the outdoor temperature when AC units were in use. The ambient wind speed was mostly in the range of 1–3 m/s, with period of low wind conditions (<1 m/s), usually in the evening hours between 6 p.m. and 6 a.m. the next day, during which buoyancy airflow likely has dominated over external wind. For this reason, we assumed a no- wind condition for the simulation model.
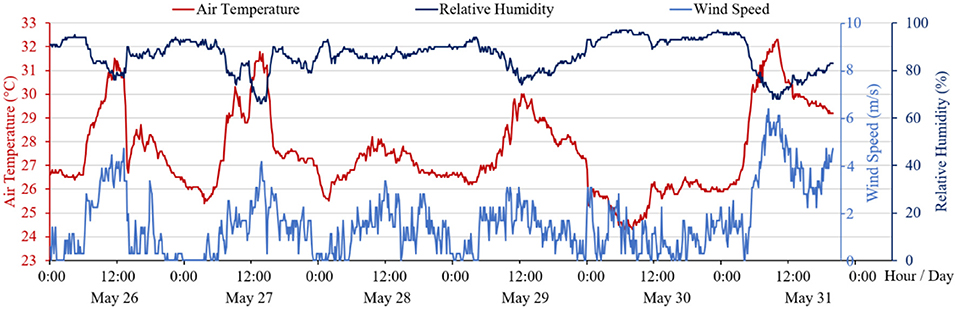
Figure 5. A summary of ambient air temperature, relative humidity, and wind speed measured at the Sha Tin Automatic Weather Station between May 26 and 31, 2020.
The 3D building dataset including contextual information, dimensions, and floor plans were acquired from the Lands Department (2016) and the Hong Kong Housing Authority (HKIA, 2019). Parameters for exhaust fans were estimated from the label to be 7.7 W of power output and air volume of 0.21 m3/s. The anthropogenic heat generation from the apartment was estimated at 220 W, or 7.5 W/m2 for the estimated size of the apartment based on a two-person household.
Results and Discussion
The results are presented as follows: (1) evaluation of the ATOR model using the smoke tracer experiment; (2) comparison of predicted results using CFD and ATOR for Luk Chuen and Amoy Gardens; and (3) simulation of Amoy Gardens using ATOR and comparison with infected people.
Evaluation of the ATOR Model Using the Smoke Tracer Experiment
For the smoke tracer experiment, a reasonably good agreement was found between measured aerosol concentration and levels predicted using ATOR. The predicted and measured PM1 concentrations on a logarithmic scale are presented in Figure 6A. The root mean square error (RMSE) is 105.94 μg/m3 and the Pearson's r correlation is 0.88. The simulated PM1 concentration using the CFD model (WINAIR) agreed reasonably well ATOR (Figure 6B). A visualization of the predicted PM1 concentration is shown in Figure 6C. The pollutants appear to have dispersed under natural wind, while spreading upward driven by the buoyancy forces.
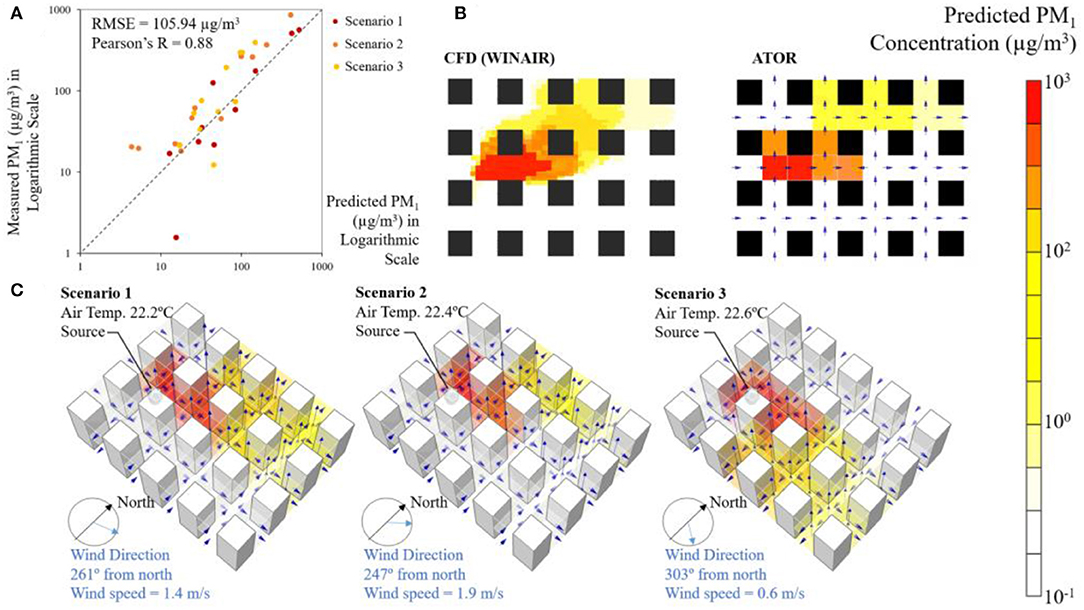
Figure 6. (A) Predicted and measured PM1 concentration during the smoke tracer experiment; (B) planar view of predicted PM1 concentration for Scenario 2 at the height of 0.9 m above ground by the CFD model (WINAIR) and the ATOR model; and (C) visualization of the predicted PM1 concentration using the ATOR model under various wind direction and speed during the smoke tracer experiment.
Comparison of Predicted Results Using CFD and ATOR for Amoy Gardens and Luk Chuen House
Simulations of viral quanta concentration in outdoor spaces were carried out using the ATOR model and CFD, and the results compared. For Amoy Gardens, the simulated viral plume spread under natural wind is shown in Figure 7A, which is in reasonable agreement with those of the CFD model WINAIR (Figure 7B). In both figures, the predicted viral plume disperses upward and downward, driven by buoyancy forces and the wind wake effects created by high-rise buildings. Airborne viruses discharged from an apartment might be captured in wake or street canyon circulations influenced by the configuration of buildings and wind patterns. These circulation patterns might limit the dispersion and lead to elevated concentrations at the boundary of the building, both above and below the apartment where the viruses emanate. The airflow through multiple high-rise buildings tends to create pockets of negative pressure in the wake of obstructing buildings.
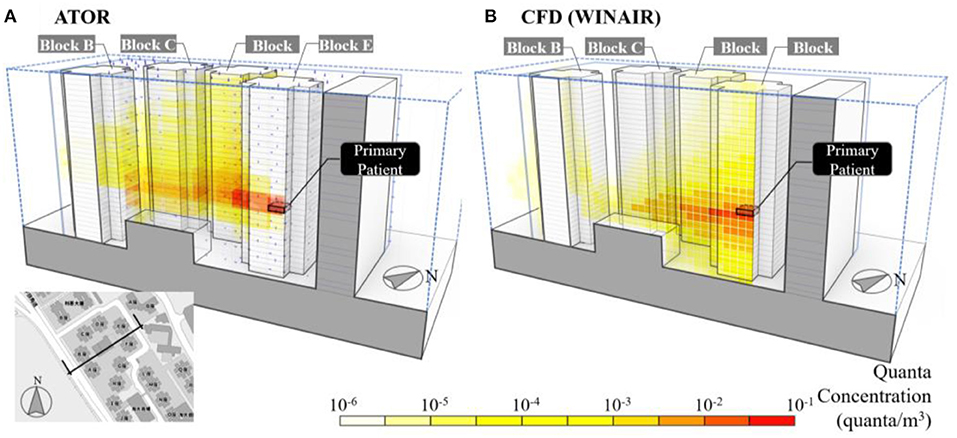
Figure 7. Cross-sectional view of the predicted quanta concentration using (A) ATOR and (B) WINAIR in Amoy Gardens, Hong Kong during the SARS outbreak in 2003.
A more detailed ATOR simulation was conducted based on a refined model geometry, including the reentrance space between Apt.7 and Apt.8, the narrow gap between the cruciform-shaped building footprint. Results were shown in Figure 8A. The refined model was able to predict the rise of viral plume in the reentrance space between Apt.7 and Apt.8 in Block E. Also, the ATOR model was able to predict the vertical and horizontal spread of viral plumes in the community. The buoyancy force was found to have contributed to the upward vertical dispersion of viral aerosols. Without such force, the viral plume appears to disperse windward by the north-easterly wind, spreading horizontally, and downward with a very minimum proportion traveling upward (Figure 8B).
Figure 8. (A) Predicted quanta concentration in Amoy Gardens, Hong Kong during the SARS outbreak in 2003 using ATOR including the reentrance space between Apt.7 and Apt.8 in Block E in the model domain and (B) simulated vial air load concentration without buoyancy force, in which the viral plume bend downward by the “wake effect.”
For the Luk Chuen House, the predicted airflow pattern and pollutant concentration using both CFD and the ATOR model are compared with each other in Figure 9. Both models predicted the virus-laden plume rising upwards from the apartment of the primary patients, driven by buoyancy force (Figures 9A,B). When the AC is in use, which is assumed to be a third of the hours during the 5-day period, the plume from the primary case apartment tends to travel to the lower floors as the relatively cool exhaust air falls due to negative buoyancy (Figure 9C). A time-weighted average value is computed for the mean viral concentration for computing inhalation exposure. The weighting is based on the assumption that the AC unit was in use during one-fifth of the 5-day period, when the ambient air temperature was above 29.5°C, the empirically determined threshold for AC use in Hong Kong (Kwok et al., 2017).
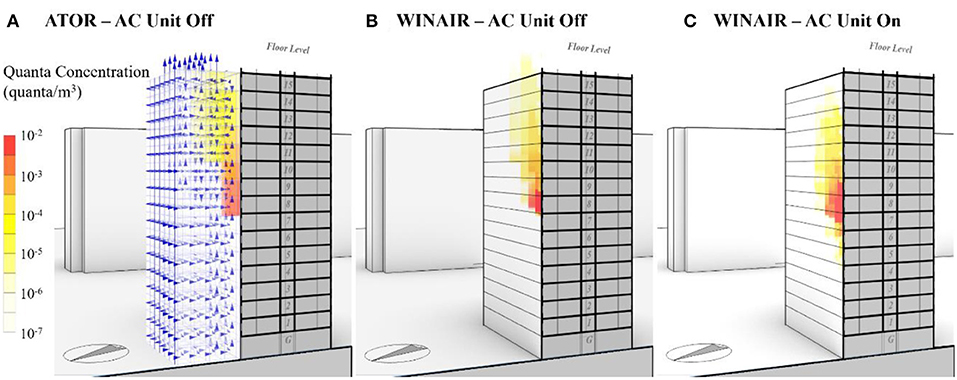
Figure 9. (A) Simulated viral quanta concentration using ATOR without air conditioning (AC) usage; (B) simulated air pollutant plume using WINAIR without AC usage; and (C) simulated air pollutant plume using WINAIR with the AC unit in use in the primary patient's apartment.
Disease Infection Pattern and Predicted Viral Exposure
The correlations between predicted viral exposure at apartment level and patterns of disease infections were analyzed for both SARS outbreak in Amoy Gardens and the COVID-19 outbreak in Luk Chuen House.
SARS: Amoy Gardens
The predicted viral inhalation exposure correlates positively with patterns of the SARS infections at an apartment level. The logistic regression results of the SARS infection and predicted viral inhalation exposure are presented in Table 1. The results are statistically significant at the 99.9% confidence level. The odds ratio for viral exposure is 3.017 (95% CI: 2.303, 3.732). The odds ratio for the intercept stands low at −2.441, suggesting a low risk factor when the predicted viral exposure is zero.
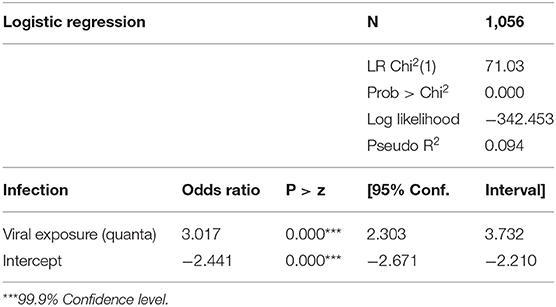
Table 1. Logistic regression of the diagnosed SARS infection vs. predicted viral exposure at apartment level, all four buildings (Blocks B–E).
A consistency check was conducted for infection cases by the building and possible higher-order infections occurred after secondary infections. Logistic regression results is shown in Table 2 for all four buildings (Blocks B–E) and Block E, respectively. The dependent variable was the SARS infection in apartments (binary), the independent variables were the predicted viral exposure (quanta) and the dummy variable of indoor route transmission, an indicator of whether an apartment is in the same building with the primary patient (1 = yes). It was found that the predicted viral exposure was positively associated with the SARS infection in all four buildings (p < 0.001) and in Block B (p < 0.001) with consistently high odds ratio. Also, being in the same building with the primary patient inflicts an additional risk of the SARS infection (p < 0.001), suggesting that intra-building transmission played a role in spreading disease infections. Consistent results are obtained for the regression analysis for a subset of 52 apartments (62 infected individuals) with early symptom onset on or before March.24, within 5 days of the disease incubation period, which is less likely to be tertiary or higher-order infections, details are included in Table A2 in the Appendix.
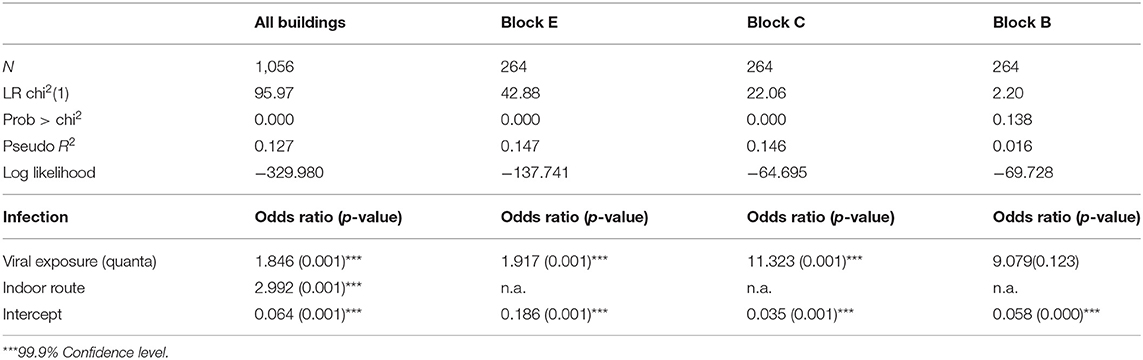
Table 2. Logistic regression of the diagnosed SARS infection in apartments vs. predicted viral exposure by building.
COVID-19: Luk Chuen House
The predicted viral exposure correlates positively with patterns of disease infection in other apartments using a logarithmic scale. Logistic regression results for COVID-19 infection cases and predicted viral exposure are presented in Table 3. The odds ratio for viral exposure is at 135.6 (95% CI: 3.950, 4,654.214), suggesting that the correlation between the predicted exposure and patterns of infection is statistically significant at 99% confidence level. The quanta values were backcalculated based on the quanta emission rates needed to inflict patterns of secondary infections shown in the Appendix. However, given the relatively small number of infected cases recorded in the COVID-19 outbreak in the Luk Chuen House, the above-mentioned findings should be interpreted with caution. Further studies such as the tracer gas experiment and additional evidence from other superspreading events are needed.
Table 3. Regressing COVID-19 infection on the predicted viral exposure in the Luk Chuen House.
Discussion
The airborne transmission of coronaviruses via the outdoor route could be a significant risk for residents in high-density cities. The viral exposure, a function of viral concentration, length of exposure, and pulmonary ventilation rate expressed by Equation 10, is shown as the blue line in Figure 10. The constant one quantum exposure is shown in the rectangular hyperbola curve. Exposure to a low viral concentration for a long period of time, in the order of days such as it may occur in a high-density residential neighborhood, can equate a short exposure to a high viral concentration as it was reported in studies on short-range airborne route (Chen et al., 2020) and airborne indoor route transmission (Miller et al., 2020).
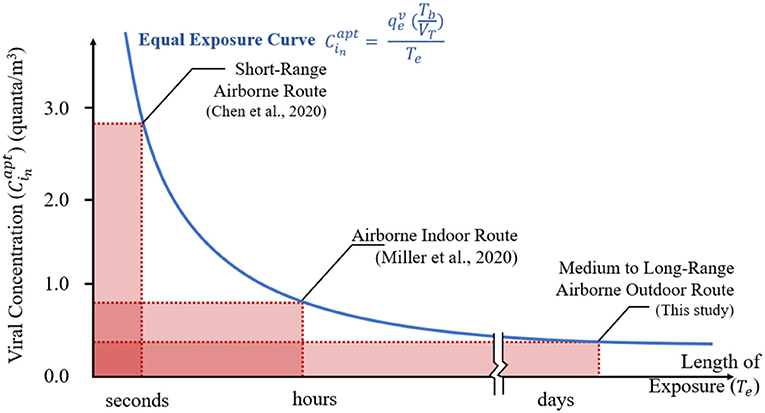
Figure 10. Modes of coronavirus transmission by viral concentration and length of exposure. The area of a rectangle is one quantum, the minimum dose of inhaled airborne organisms necessary to cause infection.
No current public health practices respond to ATOR. Wearing face masks is practiced in public spaces yet rare at home, and lockdown measures can actually increase the length of exposure for susceptible persons to virus-laden aerosols dispersed in the immediate neighborhood. Enhancing indoor air ventilation, commonly advised by public health guidelines, can increase the exposure to the infiltration of virus-contaminated droplet nuclei from nearby.
The source quanta emission rate was backcalculated based on the patterns of disease infection. For the COVID-19 outbreak in the Luk Chuen House, was estimated in the order of 60 q/h, which is comparable with findings from existing literature, ranging from 4.9 to 31 for speaking (Buonanno et al., 2020a), 460 (Prentiss et al., 2020) to 970 (Miller et al., 2020) in superspreading events. For the SARS outbreak in Amoy Gardens, was around 680 q/h, which was higher than estimates from a limited available study on SARS (Liao et al., 2005) yet within the range of estimates from the COVID-19 literature.
The close proximity of apartments to each other can elevate the infection risks, especially in the presence of superspreaders, i.e., primary patients with high quanta emission rates. Estimation of predicted infection risks in other apartments under various quanta emission rates from the primary patient are presented in the boxplot in Figure 11. Under the scenario of toilet aerosolization (quanta emission rate = 680 q/h), Apts 7 and 8 in Block E above the apartment where viruses were emanating have predicted risk of disease infection (P) above 50% (maximum at 70%), whereas there are some 30 apartments with predicted risk factors above 20%. Under the scenario in which = 100 q/h, referring to the choir outbreak of COVID-19 in which the primary patient was singing during light activities (Buonanno et al., 2020b), the maximum predicted risk is at 26%, whereas eight apartments have predicted risk factors above 10%. When reduces to below 30 q/h, such as = 28 q/h for SARS in a hospital setting according to Liao et al. (2005), or = 4.9 q/h estimated for COVID-19 patients speaking during light activities according to Buonanno et al. (2020a), there are no predicted infection risks in other apartments above 10%.
Figure 11. A boxplot of predicted infection risks at apartment level with various quanta emission rates from the primary patient in the SARS outbreak in Amoy Gardens.
The outdoor route transmission theory can explain patterns of disease infection that supplement, while not replacing, the well-established intra-building transmission theory. A virtualization of the predicted quanta concentration via the outdoor route in apartments is shown in Figure 12A. Predictions by the indoor route model, a detailed multizone airflow network model to assess air pollutant dispersion developed by Li et al. (2005), is shown in Figure 12B. Patterns of disease infection are shown in Figure 12C. Both the outdoor and indoor route models have predicted the airborne transmission driven by wind and buoyance, though predictions from the indoor route model cannot account for infection cases in the lower floors (4–13/F), but the outdoor route model can predict the downward dispersion of viral aerosols induced by the “wake effect.”
Figure 12. (A) Predicted quanta concentration via the outdoor route using the ATOR model; (B) predicted air pollutant concentration via the indoor route using a detailed multizone model by Li et al. (2005); (C) SARS diagnosis in Block E of Amoy Gardens at apartment level; (D) percentage of infected apartments in Block E of Amoy Gardens vs. the predicted mean quanta concentration for the outdoor route model; and (E) the air pollutant concentration using the indoor route model (Li et al., 2005, p. 22); values are aggregated by the lower, middle, and upper proportion of building.
A statistical comparison between the outdoor and indoor route theories for the SARS outbreak in Amoy Gardens is provided in Figures 12D,E. The Y-axis is the SARS infection rate of apartments, aggregated for the lower (4–13/F), middle (14–23/F) and upper (24–36/F) proportions of Block E by Yu et al. (2004). The X-axis is the predicted quanta concentration from the outdoor or indoor route. The outdoor route results were predicted using the ATOR model (Figure 12D). The indoor model results are from Li et al. (2005) using a detailed multizone model for indoor airborne transmission (Figure 12E). Specifics of the indoor route transmission have been included in the Appendix. The outdoor route model appears to offer a better explanation, with a slightly higher R2-value (0.92) compared with the indoor route model (0.79). To supplement the above finding based on a dearth of three points, a detailed comparison was made between the indoor and outdoor model based on values aggregated by apartments of the same number (#1–8) for the lower, middle, and upper proportion of Block E, as it is shown in Figure A1 of the Appendix. Again, the outdoor route model appears to have outperformed the indoor route model by having a higher R2-value (outdoor 0.51 vs. indoor 0.27).
This study has several limitations. It has only accounted for two superspreading events from one city. Although the correlation between patterns of disease infection and predicted viral concentration is statistically significant, more events should be studied. Further, the ATOR model should be evaluated with physical measurements in the ambient environment around building, perhaps in conjunction with tracer studies. Currently, our evaluation study covers a particular climate, notably low wind speeds, high temperatures, and tall buildings (above 10 story) in a high-density city. For instance, the exhaust heat from AC condenser was not modeled separately in this study, due to the mild weather during the SARS outbreak in Amoy Gardens and the relatively less common AC usage in public housing estates such as the Luk Chuen House. The findings should not be automatically extended to an alternative context of different climate or building types. Some input parameters for the ATOR model are based on empirical estimates, such as the viral airborne survival rate kd, which can be further improved to account for the impact of ambient air temperature, humidity, and solar radiation, should more empirical evidence become available. Instead of assuming an average source quanta emission rate during the infectious period in this study, the model can be further adapted to account for a varying source quanta emission rate, which is found to increase toward the onset of symptoms and peak for ~0.5–1.0 days (Goyal and Schiffer, 2020). Lastly, the influence of solar radiation on surfaces has not been considered in this study. We have adopted a steady-state approach in this study, which makes it difficult to account for the time-varying solar angle and radiation during the period of disease transmission.
The research has implications for the design and operation of buildings and their ventilation systems. Mitigation measures include adding air filtration devices to the exhaust fan, at the fresh air inlet, a portable air filter, or even ultraviolet disinfection devices placed in rooms. According to the WR equation in Equation 6, an ordinary portable air filter capable of removing 60% of indoor fine particles (and the viral concentration) can reduce the infection risk by a factor of 0.4–0.6. Air filters of HVAC systems, typically capable of removing 90% of indoor fine particles, can reduce the infection risk by a factor of 0.8–0.9. Centralized AC and ventilation systems can add protective effect by reducing the contribution of outdoor air pollutants to the indoor environments (Dockery and Spengler, 1981), which offers an advantage in both energy efficiency and health for high-density cities.
Lessons can be drawn to urban design and planning of high-density cities. Infection risks can be exacerbated by the proximity of apartments from each other in a high-density city. The use of fan-assistant natural ventilation can increase disease infection risks. Airborne viruses discharged from an apartment might be captured in wake or street canyon circulations influenced by the configuration of buildings and wind patterns. These circulation patterns might limit dispersion and lead to elevated concentrations at the boundary of the building both above and below the apartment where viruses emanate. Findings illustrate that transmission of SARS CoV-2 (and perhaps other infectious pathogens) might be transmitted through the outdoor air when more common transport and dilution is disrupted in a densely built-up urban area.
The public health message to increase ventilation by opening windows might not be universally useful, if it increases exposure to airborne viruses. We cannot assume that the outside air is safe. Unit air conditioners that rely on natural ventilation may increase transmission risk, and it may be beneficial to consider centralized AC for high-rise residential buildings in replacement of the existing fan-assisted natural infiltration. A centralized HVAC system, which saves energy by recovering heat from exhaust air, can also reduce disease transmission risks by drawing clean air from a rooftop location and reducing, possibly with the addition of filters, indoor air pollutants (and infectious pathogens) from discharging to the surrounding neighborhoods.
Conclusion
Air flow around buildings has been simulated to test whether it is feasible for the coronavirus transmission to occur between the neighboring apartments via an outdoor route. The ATOR model simulates the outdoor dispersion, transport, and reentry to another apartment of viruses shed from an infectious person living in the building. The model was applied to retrospectively investigate the relationship between the viral exposure and disease infection at the apartment level in two superspreading events in Hong Kong. Results suggest that the predicted viral exposure is positively correlated with the probability of disease infection at the apartment level for both COVID-19 and SARS-CoV-1. Infection risks associated with the outdoor route transmission of SARS can be reduced significantly (<10%) if the quanta emission rate from the primary patient is below 30 q/h. The outdoor dispersion patterns appear to roughly coincide with the spatial distribution of infections. The results indicate the strong probability of ATOR for the SARS outbreak in Amoy Gardens, whereas the results for the COVID-19 outbreak in the Luk Chuen House are not so well-established due to a small number of infected cases. However, precautionary measures should be taken to mitigate the risks associated with ATOR.
The ATOR model can serve as a useful tool to predict infection risks by buildings and apartments under the prevailing wind, buoyancy, and mechanical ventilation conditions. Simulation results tool can alert architects and planners of potential elevation of airborne pathogens due to street canyon effect and wake effect in the proposed development scheme and to inform necessary distances between buildings and apartments and minimum dilution factors needed to reduce risk levels. It can be further developed into software tools to support design and operation of buildings to mitigate risks of the current and future pandemics.
Data Availability Statement
The datasets presented in this article are not readily available because they involve the address and flat number of reported disease infection. Requests to access the datasets should be directed to anhodWFuZ0Boa3UuaGs=.
Author Contributions
JXH and PJ contributed to the conception and design of the study. JXH developed the simulation model, performed statistical analysis, produced the figures, and wrote the first draft of the manuscript. AZ conducted the smoke tracer experiment. SH performed CFD simulation. JH developed the mock-up high-density city site. PJ and JS contributed to manuscript revision and proof reading. All authors have read and approved the submitted version.
Funding
The research has benefited from a Seed grant from the Faculty of Architecture, the University of Hong Kong.
Conflict of Interest
The authors declare that the research was conducted in the absence of any commercial or financial relationships that could be construed as a potential conflict of interest.
Acknowledgments
The research team thank Dr. Zhi Ning of Hong Kong University of Science and Technology for lending us the particle mass spectrometers. We thank Prof. Yuguo Li of the University of Hong Kong for his suggestion on the study and Prof. Ignatius TS Yu of the Chinese University of Hong Kong for sharing the disease infection data for the SARS outbreak in Amoy Gardens. We thank Mr. Yiming Sun for developing computer code in assisting the visualization of results.
Supplementary Material
The Supplementary Material for this article can be found online at: https://www.frontiersin.org/articles/10.3389/fbuil.2021.666923/full#supplementary-material
References
Alphasense. (2015) Alphasense User Manual: OPC-N2 Optical Particle Counter. Great Notley: Alphasense.
ANSYS (2020). Ansys: Engieering Simulation & 3D Design Software. Available online at: https://www.ansys.com/ (accessed December 1, 2020).
Brown, M., Williams, M., Nelson, M., and Werley, K. (2016). QUIC Transport and Dispersion Modeling of Vehicle Emissions in Cities for Better Public Health Assessments, Vol.91
Buonanno, G., Morawska, L., and Stabile, L. (2020a). Quantitative assessment of the risk of airborne transmission of SARS-CoV-2 infection: prospective and retrospective applications. Environ. Int. 145:106112. doi: 10.1016/j.envint.2020.106112
Buonanno, G., Stabile, L., and Morawska, L. (2020b). Estimation of airborne viral emission: Quanta emission rate of SARS-CoV-2 for infection risk assessment. Environ. Int. 141:105794. doi: 10.1016/j.envint.2020.105794
Carozzi, F., Provenzano, S., and Roth, S. (2020). Urban Density and COVID-19. IZA Institute of Labor Economics.
CDC, U. (2020). Scientific Brief: SARS-CoV-2 and Potential Airborne Transmission. Available online at: https://www.cdc.gov/coronavirus/2019-ncov/more/scientific-brief-sars-cov-2.html#:~:text=Airborne transmission is infection spread, and time (typically hours). (accessed November 1, 2020).
Chan, A. T. (2002). Indoor-outdoor relationships of particulate matter and nitrogen oxides under different outdoor meteorological conditions. Atmosph. Environ. 36, 1543–1551. doi: 10.1016/S1352-2310(01)00471-X
Chau, K. W., Wong, S. K., Yau, Y., and Yeung, A. K. C. (2007). Determining optimal building height. Urban Stud. 44, 591–608. doi: 10.1080/00420980601131902
Chen, W., Zhang, N., Wei, J., Yen, H. L., and Li, Y. (2020). Short-range airborne route dominates exposure of respiratory infection during close contact. Build. Environ. 176:106859. doi: 10.1016/j.buildenv.2020.106859
Chen, Z. D., and Li, Y. (2002). Buoyancy-driven displacement natural ventilation in a single-zone building with three-level openings. Build. Environ. 37, 295–303. doi: 10.1016/S0360-1323(01)00021-X
CHP (2020). Latest Situation of Cases of COVID-19. Centre for Health Protection. Available at: https://www.chp.gov.hk/files/pdf/local_situation_covid19_en.pdf (accessed November 1, 2020). doi: 10.22233/20412495.1120.1
Chu, C. M., Cheng, V. C. C., Hung, I. F. N., Chan, K. S., Tang, B. S. F., Tsang, T. H. F., et al. (2005). Viral load distribution in SARS outbreak. Emerg. Infect. Dis. 11, 1882–1886. doi: 10.3201/eid1112.040949
Dockery, D. W., and Spengler, J. D. (1981). Indoor-outdoor relationships of respirable sulfates and particles. Atmosph. Environ. 15, 335–343. doi: 10.1016/0004-6981(81)90036-6
DoH. (2003). Outbreak of Severe Acute Respiratory Syndrome (SARS) at Amoy Gardens, Kowloon Bay, Hong Kong Main Findings of the Investigation. Hong Kong Special Administrative Region. Available online at: https://www.info.gov.hk/info/sars/pdf/amoy_e.pdf
DoH. (2019). Severe Acute Respiratory Syndrome (SARS). Available online at: https://www.chp.gov.hk/en/healthtopics/content/24/47.html (accessed September 1, 2020).
DoH. (2020). CHP Investigates Additional Confirmed Case of COVID-19 and Follows Up on Cluster in Luk Chuen House. Available online at: https://www.info.gov.hk/gia/general/202006/12/P2020061200569.htm (accessed September 1, 2020).
EPA (2011). Exposure Factors Handbook: 2011 Edition. Washington, DC: U.S. Environmental Protection Agency.
Ferziger, J. H., and Peri?, M. (2002) Computational Methods for Fluid Dynamics. 3rd ed. New York, NY: Springer. doi: 10.1007/978-3-642-56026-2.
FHB (2020). Government to Gazette Compulsory Testing Notice, Food and Health Bureau. Available online at: https://www.info.gov.hk/gia/general/202012/09/P2020120900931.htm (accessed December 21, 2020).
Forehead, H., and Huynh, N. (2018). Review of modelling air pollution from traffic at street-level - the state of the science. Environ. Pollut. 241, 775–786. doi: 10.1016/j.envpol.2018.06.019
Goldman, E. (2020). Exaggerated risk of transmission of COVID-19 by fomites. Lancet Infect. Dis. 20, P892–893. doi: 10.1016/S1473-3099(20)30561-2
Goyal, A., and Schiffer, J. (2020). Potency and timing of antiviral therapy as determinants of duration of SARS CoV-2 shedding and intensity of inflammatory response. Sci. Adv. 6:eabc7112. doi: 10.1126/sciadv.abc7112
Halloran, S. K., Wexler, A. S., and Ristenpart, W. D. (2012). A comprehensive breath plume model for disease transmission via expiratory aerosols. PLoS ONE 7:e37088. doi: 10.1371/journal.pone.0037088
Hanna, S., and Chang, J. (2015). Skyscraper rooftop tracer concentration observations in Manhattan and comparisons with urban dispersion models. Atmosph. Environ. 106, 215–223. doi: 10.1016/j.atmosenv.2015.01.051
HKHAD (2020). Database of Private Buildings in Hong Kong. Available online at: https://bmis2.buildingmgt.gov.hk/bd_hadbiex/home.jsf (accessed March 1, 2020).
HKIA (2019). Complete List of PRH/TPS Estates. Available online at: http://www.housingauthority.gov.hk/en/global-elements/estate-locator/completeList.html (accessed September 14, 2019).
Huang, J., Jones, P., Zhang, A., Peng, R., Li, X., and Chan, P. (2020). Urban building energy and climate (UrBEC) Simulation: example application and field evaluation in Sai Ying Pun, Hong Kong. Energy Build. 207:109580. doi: 10.1016/j.enbuild.2019.109580
Hwang, S., Chang, J., Oh, B., and Heo, J. (2021). Possible aerosol transmission of COVID-19 associated with an outbreak in an apartment in Seoul, South Korea, 2020. Int. J. Infect. Dis. 104, 73–76. doi: 10.1016/j.ijid.2020.12.035
Jones, P. J., Lanmon, S. C., Li, X. B., Bassett, T., and Waldron, D. (2013). “Intensive building energy simulation at early design stage,” in Proceedings of BS 2013: 13th Conference of the International Building Performance Simulation Association Chambéry.
Kadi, N., and Khelfaoui, M. (2020). Population density, a factor in the spread of COVID-19 in Algeria: statistic study. Bull. Natl. Res. Centre. 44:138. doi: 10.1186/s42269-020-00393-x
Kakosimos, K. E., Hertel, O., Ketzel, M., and Berkowicz, R. (2010). Operational street pollution model (OSPM)-a review of performed application and validation studies, and future prospects. Environ. Chem. 7, 485–503. doi: 10.1071/EN10070
Kang, M., Wei, J., Yuan, J., Guo, J., Zhang, Y., Hang, J., et al. (2020). Probable evidence of fecal aerosol transmission of SARS-CoV-2 in a high-rise building. Ann. Inter. Med. 173, 974–980. doi: 10.7326/M20-0928
Kraev, T. A., Adamkiewicz, G., Hammond, S. K., and Spengler, J. D. (2009). Indoor concentrations of nicotine in low-income, multi-unit housing: associations with smoking behaviours and housing characteristics. Tob. Control 18, 438–444. doi: 10.1136/tc.2009.029728
Kwok, Y. T., Lai, A. K. L., Lau, K. K.-L., Chan, P. W., Lavafpour, Y., Ho, J. C. K., et al. (2017). Thermal comfort and energy performance of public rental housing under typical and near-extreme weather conditions in Hong Kong. Energy Build. 156, 390–403. doi: 10.1016/j.enbuild.2017.09.067
Lands Department (2016). Digital Maps. Available online at: http://www.landsd.gov.hk/mapping/en/digital_map/intro.htm (accessed September 15, 2016).
Lauer, S. A., Grantz, K. H., Bi, Q., Jones, F. K., Zheng, Q., Meredith, H. R., et al. (2020). The incubation period of coronavirus disease 2019 (CoVID-19) from publicly reported confirmed cases: estimation and application. Ann Intern Med. 172, 577–582. doi: 10.7326/M20-0504
Lednicky, J. A., Lauzardo, M., Fan, Z. H., Jutla, A., Tilly, T. B., Gangwar, M., et al. (2020). Viable SARS-CoV-2 in the air of a hospital room with COVID-19 patients. Int. J. Infect. Dis. 100, 476–482. doi: 10.1016/j.ijid.2020.09.025
Leitl, B., Harms, F., Berbekar, E., Boris, J., Patnaik, G., Obenschain, K., et al (2016). Scale hazmat dispersion modelling for first responders based on high-resolution computational fluid dynamics - an overview of CT-analyst Hamburg. Chem. Eng. Trans. 48, 43–48. doi: 10.3303/CET1648008
Lessler, J., Reich, N. G., Brookmeyer, R., Perl, T. M., Nelson, K. E., and Cummings, D. A. T. (2009). Incubation periods of acute respiratory viral infections: a systematic review. Lancet Infect. Dis. 9, 291–300. doi: 10.1016/S1473-3099(09)70069-6
Li, Q., Guan, X., Wu, P., Wang, X., Zhou, L., Tong, Y., et al. (2020). Early transmission dynamics in Wuhan, China, of novel coronavirus–infected pneumonia. N. Engl. J. Med. 382, 1199–1207. doi: 10.1056/NEJMoa2001316
Li, Y., Duan, S., Yu, I. T., and Wong, T. W. (2005). Multi-zone modeling of probable SARS virus transmission by airflow between flats in Block E, Amoy Gardens. Indoor Air 2, 96–111. doi: 10.1111/j.1600-0668.2004.00318.x
Li, Y., Duan, S., Yu, I. T., and Wong, T. W. (2006). “Probable roles of bio-aerosol dispersion in the SARS outbreak in amoy gardens, Hong Kong,” in Population Dynamics and Infectious Diseases in Asia, ed A. Sleigh (World Scientific), 305–327. doi: 10.1142/9789812773395_0016
Liang, W., Huang, J., Jones, P., Wang, Q., and Hang, J. (2018). A zonal model for assessing street canyon air temperature of high-density cities. Build. Environ. 132, 160–169. doi: 10.1016/j.buildenv.2018.01.035
Liao, C. M., Chang, C. F., and Liang, H. M. (2005). A probabilistic transmission dynamic model to assess indoor airborne infection risks. Risk Anal. 25, 1097–1107. doi: 10.1111/j.1539-6924.2005.00663.x
Liu, Y., Ning, Z., Chen, Y., Guo, M., Liu, Y., Gali, N. K., et al. (2020). Aerodynamic analysis of SARS-CoV-2 in two Wuhan hospitals. Nature 582, 557–560. doi: 10.1038/s41586-020-2271-3
Mecenas, P., Espinosa, D. G., Cardoso, P. C., and Normando, D. (2020). Effects of temperature and humidity on the spread of COVID-19: a systematic review. PLoS ONE 15:e0238339. doi: 10.1371/journal.pone.0238339
Miller, S. L., Nazaroff, W. W., Jimenez, J. L., Boerstra, A., Buonanno, G., Dancer, S. J., et al. (2020). Transmission of SARS-CoV-2 by inhalation of respiratory aerosol in the Skagit valley chorale superspreading event. Indoor Air. 31:314–323. doi: 10.1101/2020.06.15.20132027
Morawska, L., and Milton, D. K. (2020). It is time to address airborne transmission of coronavirus disease 2019 (COVID-19). Clin. Infect. Dis. 71, 2311–2313. doi: 10.1093/cid/ciaa939
Mukherjee, A., Stanton, L. G., Graham, A. R., and Roberts, P. T. (2017). Assessing the utility of low-cost particulate matter sensors over a 12-week period in the Cuyama valley of California. Sensors 17:1805. doi: 10.3390/s17081805
Nardell, E. A. (2016). Wells revisited: infectious particles vs. quanta of Mycobacterium tuberculosis infection–don't get them confused. Mycobact. Dis. 6:1000231. doi: 10.4172/2161-1068.1000231
Niu, J., and Tung, T. C. W. (2008). On-site quantification of re-entry ratio of ventilation exhausts in multi-family residential buildings and implications. Indoor Air 18, 12–26. doi: 10.1111/j.1600-0668.2007.00500.x
ON.CC (2020). Luk Chuen House Infections Possibly Transmissed via Public Spaces. Oriental Daily News. Available online at: https://hk.on.cc/hk/bkn/cnt/news/20200602/bkn-20200602010454347-0602_00822_001.html
Prentiss, M. G., Chu, A., and Berggren, K.K. (2020). Superspreading events without superspreaders: using high attack rate events to estimate no for airborne transmission of COVID-19. medRxiv. doi: 10.1101/2020.10.21.20216895
Pyankov, O. V., Bodnev, S. A., Pyankova, O. G., and Agranovski, I. E. (2018). Survival of aerosolized coronavirus in the ambient air. J. Aerosol Sci. 115, 158–163. doi: 10.1016/j.jaerosci.2017.09.009
Ratnesar-Shumate, S., Williams, G., Green, B., Krause, M., Holland, B., Wood, S., et al. (2020). Simulated sunlight rapidly inactivates SARS-CoV-2 on surfaces. J. Infect. Dis. 222, 214–222. doi: 10.1093/infdis/jiaa274
Riley, E. C., Murphy, G., and Riley, R. L. (1978). Airborne spread of measles in a suburban elementary school. Am. J. Epidemiol. 107, 421–432. doi: 10.1093/oxfordjournals.aje.a112560
Riley, S., Fraser, C., Donnelly, C. A., Ghani, A. C., Abu-Raddad, L. J., Hedley, A. J., et al. (2003). Transmission dynamics ofthe etiological agent of SARS in Hong Kong: impact of public health interventions. Science 300, 1961–1966. doi: 10.1126/science.1086478
SARS Expert Committee (2003). SARS in Hong Kong: From Experience to Action. Hong Kong. Available online at: https://www.sars-expertcom.gov.hk/
Shi, J., Wen, Z., Zhong, G., Yang, H., Wang, C., Huang, B., et al. (2020). Susceptibility of ferrets, cats, dogs, and other domesticated animals to SARS-coronavirus 2. Science. 368, 1016–1020. doi: 10.1126/science.abb7015
Siegel, J. D., Rhinehart, E., Jackson, M., Chiarello, L., and Health Care Infection Control Practices Advisory Committee. (2007). 2007 guideline for isolation precautions: preventing transmission of infectious agents in health care settings. Am. J. Infect. Control. 35, S65–164. doi: 10.1016/j.ajic.2007.10.007
Soulhac, L., Nguyen, C. V., Volta, P., and Salizzoni, P. (2017). The model SIRANE for atmospheric urban pollutant dispersion. PART III: validation against NO2 yearly concentration measurements in a large urban agglomeration. Atmosph. Environ. 167, 377–388. doi: 10.1016/j.atmosenv.2017.08.034
Sousan, S., Koehler, K., Hallett, L., and Peters, T. M. (2016). Evaluation of the alphasense optical particle counter (OPC-N2) and the grimm portable aerosol spectrometer (PAS-1.108). Aerosol Science and Technology. 50, 1352–1365. doi: 10.1080/02786826.2016.1232859
Ting, V. (2020). Hong Kong Fourth Wave: Health Officials Warn of Spike in Untraceable Coronavirus Infections as 112 New Cases Confirmed. South China Morning Post. Available online at: https://www.scmp.com/news/hong-kong/health-environment/article/3113407/hong-kong-fourth-wave-health-officials-warn-spike
Tsang, D., and Chan, H. (2020). Coronavirus: Hongkonger Living in Public Housing at Centre of Infection Cluster Confirmed as Infected. South China Morning Post. Available online at: https://www.scmp.com/news/hong-kong/health-environment/article/3088925/coronavirus-man-living-hong-kong-public-housing.
Tsou, J. (2003). Architectural Studies of Air Flow at Amoy Gardens, Kowloon Bay, Hong Kong, and its Possible Relevance to the Spread of SARS Status report. Hong Kong. Available online at: https://www.semanticscholar.org/paper/Architectural-Studies-of-Air-Flow-at-Amoy-Gardens-%2C/f57b8211f2591dcb67803e32b2995e87b65426ed
van Doremalen, N., Morris, D. H., Holbrook, M. G., Gamble, A., Williamson, B. N., Tamin, A., et al. (2020). Aerosol and surface stability of SARS-CoV-2 as compared with SARS-CoV-1. N. Engl. J. Med. 382, 1564–1567. doi: 10.1056/NEJMc2004973
Wells, W. F. (1955). Airborne Contagion and Air Hygiene: An Eological Sutdy of Droplet Infection. Cambridge, USA: Harvard University Press.
Wentworth, D. E., Gillim-Ross, L., Espina, N., and Bernard, K. A. (2004). Mice susceptible to SARS coronavirus. Emerg. Infect. Dis. 10, 1293–1296. doi: 10.3201/eid1007.031119
WHO (2019). Middle East Respiratory Syndrome Coronavirus (MERS-CoV). Available online at: https://www.who.int/en/news-room/fact-sheets/detail/middle-east-respiratory-syndrome-coronavirus-(mers-cov) (accessed December 2, 2020).
WHO (2020a). Coronavirus Disease (COVID-19): How is it Transmitted? Available online at: https://www.who.int/news-room/q-a-detail/coronavirus-disease-covid-19-how-is-it-transmitted#:~:text=COVID-19 is caused by, speak%2C sing or breathe heavily (accessed September 1, 2020).
WHO (2020b). Modes of Transmission of Virus Causing COVID-19: Implications for IPC Precaution Recommendations. Available at: https://www.who.int/news-room/commentaries/detail/modes-of-transmission-of-virus-causing-covid-19-implications-for-ipc-precaution-recommendations (accessed November 10, 2020).
WHO (2020c). Transmission of SARS-CoV-2: Implications for Infection Prevention Precautions. Available online at: https://www.who.int/news-room/commentaries/detail/transmission-of-sars-cov-2-implications-for-infection-prevention-precautions (accessed November 1, 2020).
Witlox, H. W. M., Fernandez, M., Harper, M., Oke, A., Stene, J., and Xu, Y. (2018). Verification and validation of phast consequence models for accidental releases of toxic or flammable chemicals to the atmosphere. J. Loss Prevent. Process Indust. 55, 457–470. doi: 10.1016/j.jlp.2018.07.014
Woo, P. C., Huang, Y., Lau, S. K., and Yuen, K. Y. (2010). Coronavirus genomics and bioinformatics analysis. Viruses 2, 1804–1820. doi: 10.3390/v2081803
Yao, R., Luo, Q., and Li, B. (2011). A simplified mathematical model for urban microclimate simulation. Build. Environ. 46, 253–265. doi: 10.1016/j.buildenv.2010.07.019
Yu, I. T., Li, Y., Wong, T. W., Tam, W., Chan, A. T., and Lee, J. H. (2004). Evidence of airborne transmission of the severe acute respiratory syndrome virus. N. Engl. J. Med. 350, 1731–1739. doi: 10.1056/NEJMoa032867
List of Symbols
Keywords: Coronavirus, airborne transmission, outdoor route, numerical simulation, high-density city
Citation: Huang J, Jones P, Zhang A, Hou SS, Hang J and Spengler JD (2021) Outdoor Airborne Transmission of Coronavirus Among Apartments in High-Density Cities. Front. Built Environ. 7:666923. doi: 10.3389/fbuil.2021.666923
Received: 11 February 2021; Accepted: 24 March 2021;
Published: 04 May 2021.
Edited by:
Bin Yang, Xi'an University of Architecture and Technology, ChinaReviewed by:
Andrew Wright, De Montfort University, United KingdomJiying Liu, Shandong Jianzhu University, China
Copyright © 2021 Huang, Jones, Zhang, Hou, Hang and Spengler. This is an open-access article distributed under the terms of the Creative Commons Attribution License (CC BY). The use, distribution or reproduction in other forums is permitted, provided the original author(s) and the copyright owner(s) are credited and that the original publication in this journal is cited, in accordance with accepted academic practice. No use, distribution or reproduction is permitted which does not comply with these terms.
*Correspondence: Phil Jones, am9uZXNwQGNhcmRpZmYuYWMudWs=