 Francesco Pomponi
 Maria Luque Anguita
 Michal Lange1,3
 Bernardino D’Amico
 Emma Hart
- 1Resource Efficient Built Environment Lab (REBEL), Edinburgh Napier University, Edinburgh, United Kingdom
- 2Cambridge Institute for Sustainability Leadership (CISL), University of Cambridge, Cambridge, United Kingdom
- 3School of Computing, Edinburgh Napier University, Edinburgh, United Kingdom
The construction and operation of buildings account for significant environmental impacts, including greenhouse gas (GHG) emissions, energy demand, resource consumption and waste generation. While the operation of buildings is fairly well regulated and globally considered in the pathways to net-zero mid-century targets, a different picture emerges when looking at the other life cycle stages, which incur the so-called embodied impacts. These cover raw material extraction and product manufacturing through to construction and end of life activities. Only a handful of examples exist where such embodied carbon (EC) emissions are enshrined in law with most of the ongoing debate still around estimating and understanding where such emissions occur and how to mitigate them. Building structures account for a significant share of a building’s embodied emissions and they also are the building element with the longest service life, thus presenting potential lock-in challenges for choices made today. To support the ongoing global effort to mitigate embodied carbon and equip engineers and designers worldwide with easy-to-use and robust calculation tools, we describe a real-time decision-support tool to aid building design that leverages machine learning (ML) methods from computer science to speed-up the computationally expensive process of finite element analysis (FEA) traditionally exploited in structural engineering. We demonstrate that replacing FEA calculations with a model learnt using ML from a large dataset offers real time decision support while guaranteeing the same level of confidence and accuracy that a traditional FEA-based method would offer at the design stage. The tool has been developed both as a standalone version and as a plugin for Trimble SketchUp to maximise its usability and diffusion. It offers results correlated with uncertainty analysis in the form of probability density functions to account for the inherent variability of input data that characterises early stages in the design process. This research contributes to the ongoing global efforts to decarbonising the built environment and offers an immediately implementable method and tool for doing so.
Introduction and Previous Work
Buildings account for a very significant share of greenhouse gas (GHG) emissions, consumption of raw materials and finite resources, and waste generation. Such impacts are not immediately visible because buildings are often ideologically divided into their operation (the energy system) and their components (the industrial system) (Pomponi et al., 2020a). The two are finally being reconciled with significant advances made in the past decade also thanks to the development of globally applicable methodologies (BSI, 2011) and voluntary initiatives (LETI, 2020).
However, while the operation of buildings (and its corresponding energy demand) has been highly regulated and has received decades of academic, industrial and political attention, the other stages in a building’s life cycle (e.g. manufacturing, transportation, installation, and end of life demolition/deconstruction and waste disposal), which incur the so-called embodied impacts, have only recently begun to being seriously considered by all the stakeholders involved. In fact, one might say that this stage is yet to be reached since these embodied emissions remain vastly unregulated with the exception of a handful of countries or sub-national states and local authorities (De Wolf et al., 2017; Röck et al., 2020). The importance of embodied impacts, and in particular embodied GHG emissions (so called “embodied carbon” (EC) and measured in mass of carbon dioxide equivalent–CO2e), is twofold. Firstly, they occur on global grids that are far from being fully decarbonised and heavily reliant on fossil fuels thus releasing powerful greenhouse gases that will contribute to warming the planet in decades (e.g. methane) and centuries (e.g. carbon dioxide) to come. Secondly, and partly as a consequence, they occur now thus further eroding the remaining carbon budget for meeting the mid-century climate targets (Röck et al., 2020). This has profound social implications because each 1 kg of CO2e emitted unnecessarily in developed economies “steals” the right of developing economies to emit 1 kg of CO2e to lift themselves out of poverty or to provide basic services such as sanitation to their peoples.
The construction of buildings is flooded with such unnecessary emissions, and this is particularly true for building structures where the reason seems to boil down to two main causes. First, structural systems in buildings generally account for the largest share of the building’s mass (De Wolf et al., 2015; D’Amico and Pomponi, 2020), thus any inefficiency is quickly magnified. Second, due to the history of structural design there is an inherent tradition of using rules of thumb which result in over-design and over-dimensioning of building structures and their constituting elements (Moynihan and Allwood, 2014; D’Amico and Pomponi, 2018a). While this has often been defended under the “safety” argument, it should be noted that we do not adopt such an approach in other areas where safety is equally, if not more, crucial (e.g. airplane design).
The issue is exacerbated by the sometimes tenfold variability surrounding underlying data and input values for the calculation (Pomponi and Moncaster, 2017; Moncaster et al., 2018) and the nearly complete lack of any uncertainty analysis in the assessments produced (Pomponi et al., 2017; Mendoza Beltran et al., 2018). The resulting situation is that even the latest guidance from the United Kingdom’s Institution of Structural Engineers (IStructE, 2020) merely encourages to be open about sources of uncertainty but numerically still produces single-value estimates that are often used to either inform or make decisions. Figure 1 shows the importance of characterising the uncertainty surrounding such single-value estimates. With single value estimates it is in fact impossible to do anything other than comparing the two and the often well-meant decision leads to choosing the alternatives with the lowest impact. However, that single value could be characterised by high uncertainty and therefore a high variability in the likely final impact that could lead to sub-optimal decisions. This is why understanding first, and transparently reporting then, uncertainty information is vital to allow decision makers to access data more meaningfully so that decisions can be better informed.
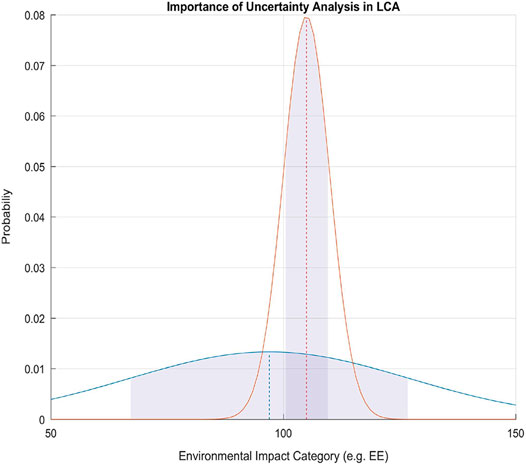
FIGURE 1. Importance of uncertainty characterisation in life cycle assessment (LCA). A mere comparison between the average of the orange curve and the average of the blue curve could lead to thinking that the “blue” value is “better” but the complete characterisation of uncertainty reveals a much more ambiguous evidence to choose from. Shaded areas represent ±1 standard deviation from the mean (dashed lines). Source: (Pomponi et al., 2017).
These methods can be greatly informative in comparative analyses as they show where overlaps are and allow one to determine with (statistical) confidence if and to what extent a solution is better than another. They have been recently applied to the whole life carbon assessments of the three main structural systems used in the world (steel, reinforced concrete, and engineered timber) demonstrating for the first time the significant overlap that exists between the three (Hart et al., 2021) and thus the lack of a clearly superior choice but rather the importance of rooting decisions in an understanding of the different building projects, local contexts and supply chains.
In fairness, however, despite such simplified methods for uncertainty analysis within a life cycle assessment of buildings and their products do exist (e.g. Pomponi et al., 2017), they are not of straightforward implementation. These have been in turn embedded in existing and publicly available design software tools (D’Amico and Pomponi, 2018b), which nevertheless still require some manual implementation and basic technical knowledge. As a result, nothing currently exists that can beat the simplicity of multiplying two cells in a spreadsheet–the current state of the art (IStructE, 2021). There are in addition other tools that offer the possibility of analysing buildings from an LCA perspective. The most prominent are OneClickLCA (Bionova, 2021), H\B:ERT\, ECCOlab, Tally, the Carbon Planning Tool, and the Carbon Emissions Calculator (Pomponi et al., 2020b for a detailed review). These tools are however either proprietary and covered by commercial licenses or developed for specific areas of applications (e.g. infrastructure). By building on previous fundamental research (D’Amico and Pomponi, 2018a), this paper addresses such a gap. We present an innovative tool that uses a surrogate-modelling technique from the field of machine learning to replace expensive FEA calculations; this enables estimation of the embodied carbon in a design in real-time, allowing a user to explore multiple designs. The results are validated against traditional finite element analysis approaches that produce estimates equipped with probability density function and uncertainty information in real-time.
A surrogate-model is a learned statistical model that can be used as a replacement of a detailed simulation model, providing an approximation of the outcome of a simulation at low computational cost. Surrogates have been used to replace FEA in a number of domains, ranging from modelling biomechanics of human tissues (Liang et al., 2018) to the steering of tunnel boring machines (Ninic, 2017). In the building domain, Westerman (2019) provides a recent and thorough review of the use of surrogate models in sustainable building design, noting that they can benefit four design aspects: conceptual design (e.g. design space exploration); sensitivity analysis; uncertainty modelling (e.g. fast building performance probability distribution derivation) and accelerating optimisation processes). Our work contributes to this growing literature in proposing a surrogate-model to replace FEA calculations of embodied carbon at the building design, when considering a range of potential building materials. The model is embodied in a freely and publicly available tool designed as a plug-in for the popular Trimble SketchUp platform to maximise its diffusion and usefulness.
The paper unfolds as follows. Methods Section presents the methods used, followed by the results in Result Section. These are discussed in Integration of Models Into User-Friendly Tools Section, which also concludes the articles highlighting the main limitations of this work and suggesting avenues for further research.
Methods
This research builds on previous work (D’Amico and Pomponi, 2018a), where a tool was developed to evaluate the embodied whole life carbon of steel framed building structures. This tool, called BEETLE2 (Built Environment Efficiency Tool for Low Environmental Externalities), requires a small set of input parameters and allows the user to explore how variations of the frame geometry and magnitude of applied loading would affect the overall structural steel mass and embodied carbon intensity. The aim is to promote material efficiency as early as possible in the design stage when the opportunity for reduction is maximal and impact on costs minimal. Reducing material usage early on not only minimises resource extraction today but also reduces the amount of waste created when buildings reach the end of their useful life.
The tool included an internal Finite Element Analysis (FEA) “engine” to perform structural analysis and design (i.e., dimensioning of structural members) compliant with existing standards, therefore allowing the same level of computation provided by commercial software alternatives (e.g. SAP 2000). However, in doing so, the tool was computationally expensive and while simple structures could be assessed in a matter of seconds more complex ones required minutes. Trying out different input parameters and design options could quickly scale up the amount of time required, thus limiting the usefulness and applicability of the tool. Moreover, it was limited to steel framed structures only. In order to address such limitations, we propose to train a surrogate-model—specifically a regression model—to predict the output of the FEA for a given design. This is described in detail in the following sections.
Surrogate Models
We aim to learn a surrogate-model capable of predicting embodied carbon instead of running an FEA process. Specifically, we evaluate the use of three types of regression model as potential surrogates: an Artificial Neural Network, a Random Forest model and a Support Vector Regressor (Fernández- Delgado, 2019). These methods are chosen as the literature demonstrates that they are capable of achieving high-performance on similar tasks (for example, Hart et al. (2019) demonstrate that these techniques can successfully be used to replace a wind-flow simulator in an application to forestry). A brief description of the methods is given below.
Artificial neural networks (ANN) are loosely based on an analogy to the function of neurons in the human-brain and are chosen as they are capable of learning non-linear relationships between a set of input values and one or more outputs. Given a network architecture composed of a set of inputs and outputs defined by the data connected via a number of hidden layers, training a model consists of learning appropriate values for a set of weights connecting individual neurons. Random Forests (Breiman, 2001) are an example of an ensemble learning method in which the results of multiple regression trees trained using different data samples and features are aggregated to form a prediction: this is shown to result in a reliable estimator that is robust to noise. Finally, Support Vector Machines (SVM) (Steinwart and Christmann, 2008) are selected due to their prevalence in the literature. Table 1 summarises the relative pros and cons of each method.
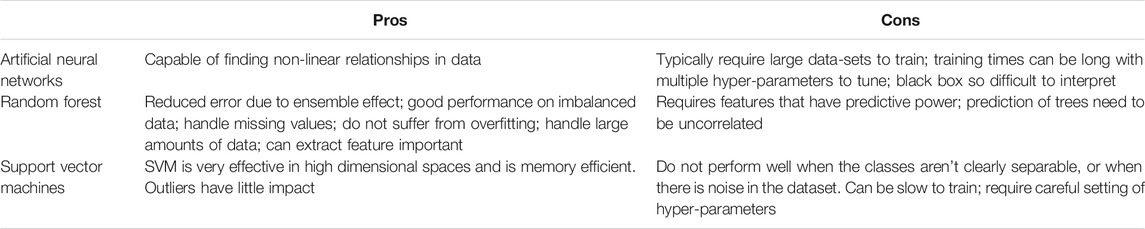
TABLE 1. Summary of main pros and cons of each of the methods.
Data Generation
To train a model, a large set of representative data is required. We generated a dataset of structural design samples that contained examples of three main structural typologies (steel frames, reinforced concrete frames, and engineered timber frames). For each design, we record 44 different variables describing the primary inputs for the structural design, some easily derivable inputs and the FEA calculated outputs. This “raw” dataset contains 10,000 entries for individual structural systems and is made freely available with the paper.
Data is generated for structures that use three different materials (steel, glulam and reinforced concrete). This is done using the previous FEM-based implementation of the tool to generate the dataset of ground truth datapoints for training. For each structure, we extract a fixed set of variables to be used as input to the regression models. Input data falls into two categories: geometry of the building and loads. The geometry inputs included primary span (in metres), secondary span (in metres), inter-storey height (in metres), number of primary spans, number of secondary spans and number of storeys. The load inputs include the variable floor load (in kilonewtons per metre squared), the finishes, ceiling, services and partitions load (in kilonewtons per metre squared) and the envelope walls load (in kilonewtons per metre).
For each material type, we train a model to predict a single dependent variable. For steel, models are trained to predict 1) optimised total mass of frame and 2) rationalised mass. For concrete, five models are trained to predict: 1) the total mass columns (optimised); 2) total mass columns (rationalised); 3) total mass frames (optimised); 4) total mass frames (rationalised); 5) total mass concrete floors of beams and slabs. For glulam, four models are trained: 1) total mass (rationalised) for columns alone, 2) total mass columns (rationalised); 3) total mass columns plus beams and timber frames; 4) total mass of timber floors with glulam beams and CLT slabs.
In the above description, the term “optimised” variant refers to a structural design where maximal material efficiency has been used (i.e. structural elements perform exactly the load-bearing function required of them without overengineering or over-dimensioning occurring). The “rationalised” structure, instead, aims to represent current engineering practice where rules of thumb (carried over from decades of standard approaches to structural design) or cost considerations dominate the choice of viable structural solutions, which regularly result in being over-dimensioned and materially inefficient. Full details on the structural configurations that underpin the results of this study are given in the supplementary data that accompanies this article and is freely and publicly available.
The models were trained to predict the structural masses output rather than the embodied carbon outputs because the latter is obtained with minimum computational effort from the former (via a Monte Carlo method). Conversely, significant computational power is required to compute the FEM-related structural masses, hence the motivation to replace this calculation with a surrogate model.
Model Training
Models were implemented in Python using the open-source software library scikit-learn. Hyper-parameters of the SVM and RF models were simply left as the defaults from the model library. The ANN architecture was tuned using grid-search (Bergstra and Bengio, 2012). The final parameters used are given in the accompanying supplementary material. All data was normalised before training using a Standard Scaler by sklearn (Pedregosa et al., 2011) which removes the mean and scales to unit variance. We report results from 10-fold cross-validation applied to training each model: that is, the dataset is split into 10 equal sizes subsets. Training is performed on 90% of the data and tested on the remaining fold. The process is then repeated, holding out each fold in turn. The performance metric is averaged over the 10 folds. The following metrics are used to report performance:
1) Explained variance score: Best possible score is 1.0, lower values are worse.
2) Max error: the maximum error from the test set. The best possible score is 0.
3) Mean Absolute Error (MAE): best score is 0. Computes mean absolute error, a risk metric corresponding to the expected value of the absolute error loss or l1-norm loss.
4) Mean Squared Error (MSE): best score is 0. Computes mean square error, a risk metric corresponding to the expected value of the squared (quadratic) error or loss.
5) Mean Absolute Percentage Error (MAPE): best possible score is 0%. Also known as mean absolute percentage deviation (MAPD), this metric is sensitive to relative errors. It is for example not changed by a global scaling of the target variable.
As explained in the previous section, for each material type a number of separate models are trained to predict the overall mass of a relevant structural component (from which EC can be calculated). All models use exactly the same set of input variables.
Results
Results are summarised in Tables 2-4, broken down by material (steel, concrete, glulam) and mass type. The best result for each metric is highlighted in bold for row. For RF, we also give results from a minimal model that contains an ensemble of 10 trees rather than the default 1,000, as this has advantages in terms of reduced computational storage.
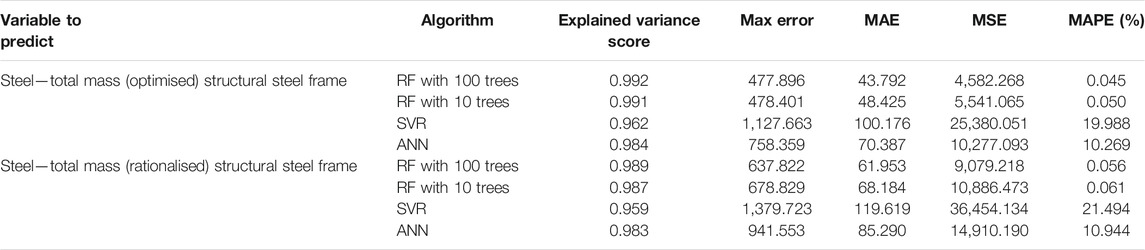
TABLE 2. Average cross-validation error for results on steel.
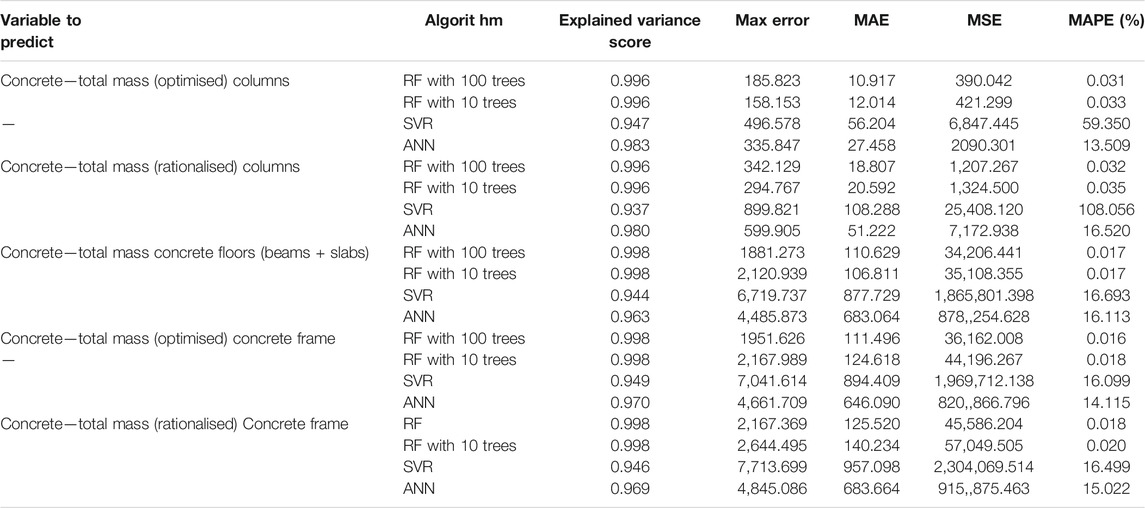
TABLE 3. Average cross-validation error for results on concrete.
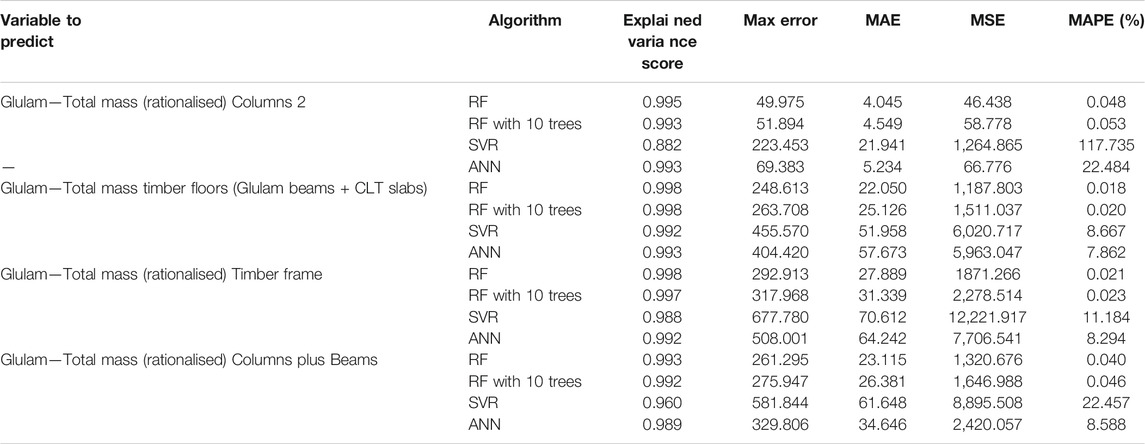
TABLE 4. Average cross-validation error for results on glulam.
It is clear that RF produces the best performing model. The ANN performs well for steel and glulam, with MAPE <= 10%, and <17% for concrete. Given the suggested use of the tool at very early stages in the design process these represent usable figures to support design choices. Figure 2 plots an example of the predicted values against the true values obtained from the FEM model for each material for the total mass variable. It is clear that there is generally good correspondence, although for all materials, there is a tendency to underpredict at the upper end of the input range.
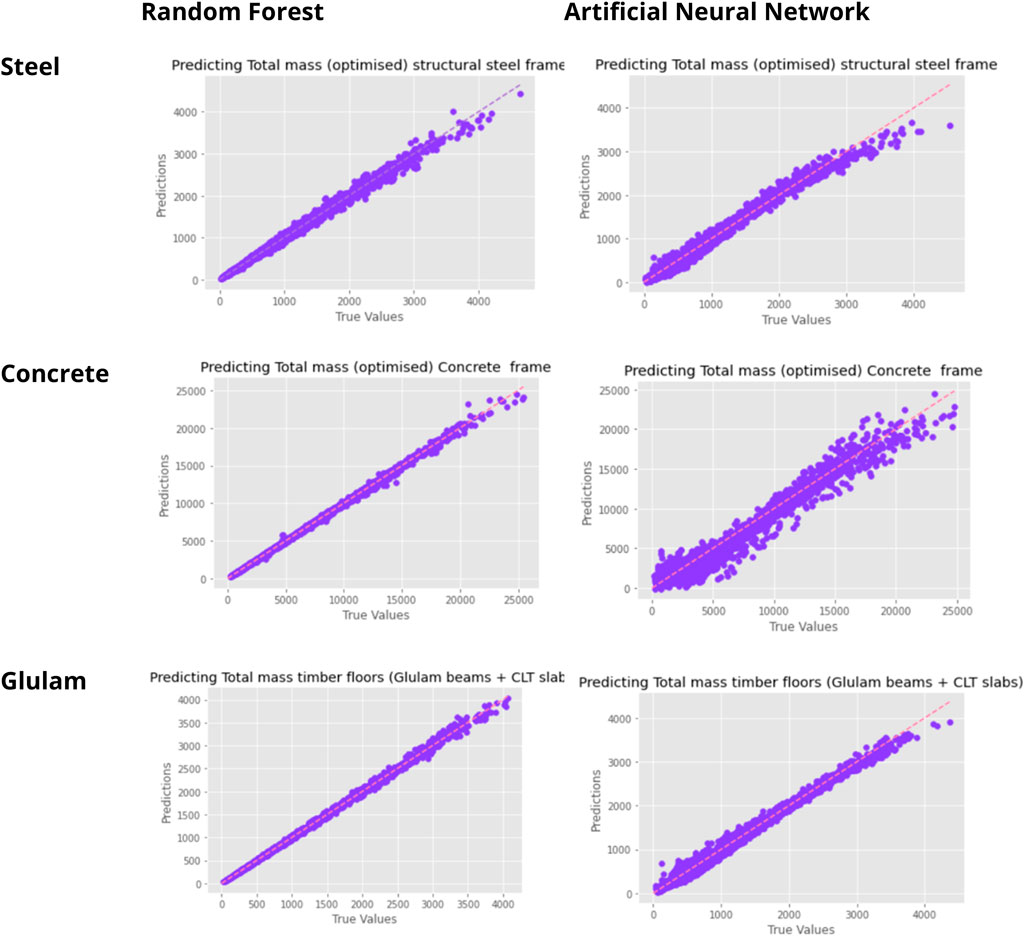
FIGURE 2. Actual vs predicted plots for total mass for each of the three materials.
Integration of Models Into User-Friendly Tools
The results in the previous section have demonstrated that it is possible to use an ML model to accurately predict EC in a structure. This represents a contribution of the paper in its own right, and similar surrogate-models could be used in other contexts to speed up computationally expensive FEM simulations. Our aim here is specifically to integrate the models into freely available tools. As well as model accuracy, we also consider the ease of integration of the methods into existing software platforms in order to make them easily accessible and lower memory requirements. Selecting the most appropriate model requires considering the trade-off between the above factors.
Tool Description
Two tools are developed: a plug-in for SketchUp (mainly intended for architects and designers) as well as a standalone software (mostly aimed at structural engineers). The stand-alone tool is written in Python in which it is straightforward to implement the RF. In order to minimise the software footprint of the tool, we use the minimal RF model using only 10 trees. This saves considerable space at the expense of reducing accuracy only by a very small amount as demonstrated in Tables 1-3. The SketchUp tool requires plugins to be developed using Ruby interface. The RF model created using sklearn cannot be imported directly into Ruby. Although it would be in theory possible to hard-code each decision tree in the learned RF by hand using Ruby, for practical reasons we chose to instead incorporate the ANN as the prediction module: the ANN can easily be implemented within Ruby/Sketchup and although not as accurate as the RF, its output is sufficiently accurate to be of use to designers.
The Graphical User Interface (GUI) for the SketchUp plugin is shown in Figure 3 (inputs) and Figure 4 (outputs). As it can be seen, the input interface requires a set of geometric and loading parameters, as well as the carbon coefficient. This latter is inputted by the user as a probability distribution rather than as a single value. Indeed, if a single value is to be entered, this can be done by setting the standard deviation to zero. The choice for inputs linked to probability distributions is to address the single-value issue presented in the introduction. The options to choose from in terms of distribution are triangular (low, high and most likely values are required), uniform (max and min values are required), and normal (mean and standard deviation are required). This does create the need for the user to search for appropriate data that best reflect the context they are examining. Data sources and appropriate choice of distribution will vary depending on the contexts but as a general rule of thumb:
1) A uniform distribution is used when only a range of variation is known and potential sources could be two Environmental Product Declarations (EPDs)—one for the low and one for the high value;
2) A triangular distribution is used when in addition to a range also a more likely value within that range is known and potential sources could still EPDs but after having reviewed a few and having determined in addition to low/high values also the most likely one;
3) a normal distribution requires the characterisation of many samples within a given population and potential sources could be academic papers, reports from professional bodies and organisations covering specific materials (e.g. concrete/steel associations, the timber industry).
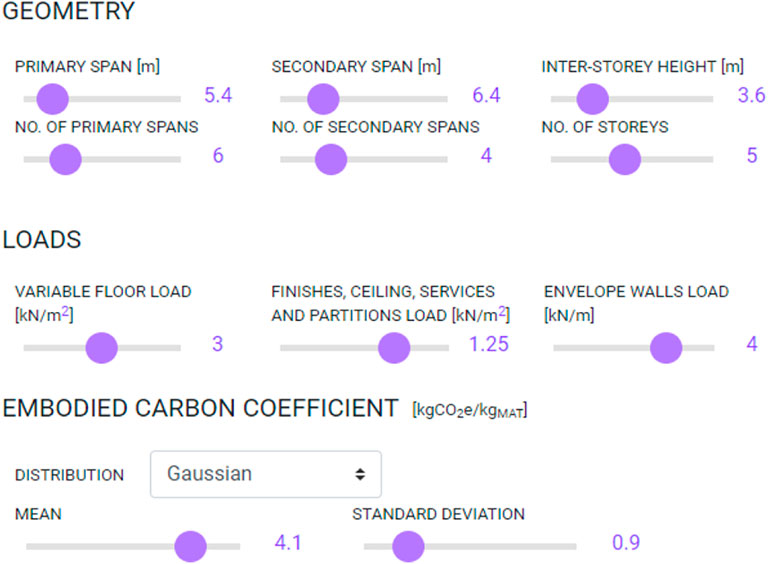
FIGURE 3. Graphical user interface of the plugin implemented for SketchUp. Input parameters are organised in three main categories: geometric, loading and embodied carbon coefficients. The input sliders allow the user to select a specific value in a range that has been previously defined by subject matter experts (FP and BD), which was used to train the ML algorithms.
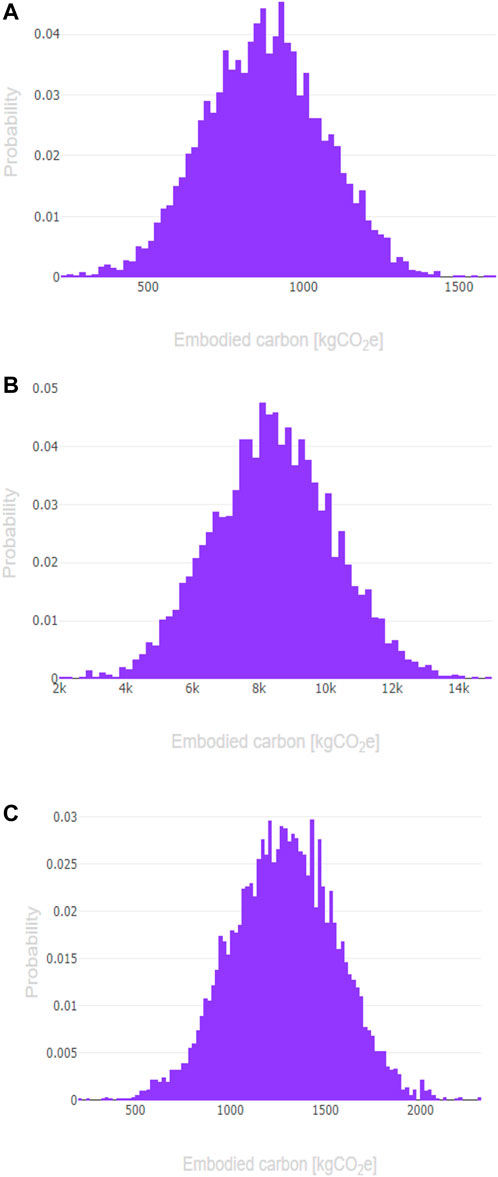
FIGURE 4. Outputs of the plugin implemented for SketchUp. Histograms of the overall embodied carbon estimates are plotted for each of the three structural types, namely: (A) Steel frame; (B) Reinforced Concrete frame and (C) Engineered timber frame. Please note the plots do not refer to the same structure or underlying assumptions so numbers on the x-axis do not represent a comparison between the three structural materials. These are only shown to exemplify the potential outputs users would get and the possibility of the tool to assess structures with very low [e.g. panel (A)] as well as very high [e.g. panel (B)] embodied carbon.
Outputs are plotted in the form of histograms representing the probability distribution of total embodied carbon for all three main structural types (steel, reinforced concrete and engineered timber). Although these histograms may appear similar in shape, their scales can be very different, depending on the predicted structural masses and the carbon coefficient distributions inputted by the user for each of the three main structural materials. This is achieved through the implementation of standard stochastic approaches (Monte Carlo simulation) tailored to the purpose of estimating embodied carbon in buildings (Pomponi et al., 2017).
Time Performance
In order to highlight the real-time nature of the tool, 100 different instances with randomly chosen parameters were run and measured for both the plugin and the standalone versions of the tool. The testing machine contained an Intel Core i5-6500 CPU. Three separate times (measured in milliseconds) were recorded:
1. The time taken to read in the parameters, calculate the output for the rationalised and optimised structural masses and run monte carlo simulation (TOTAL).
2. The time taken to calculate the output for the optimised structural masses (OPTIMISED).
3. The time taken to calculate the output for rationalised structural masses (RATIONALISED)
Results are shown in Table 5. Most of the time is spent on performing the Monte Carlo simulation (TOTAL). This is required to combine the predicted output range of structural masses (whose lower/upper limits are the optimised/rationalised mass estimates) with the distributions of embodied carbon coefficients in order to obtain the TOTAL output, namely, the embodied carbon histograms of the whole structure as shown in Figure 5. Regardless of its implementation as a SketchUp plugin or standalone, the programme generates outputs in under 0.03 s, which is deemed more than sufficient to enable real-time user interaction.
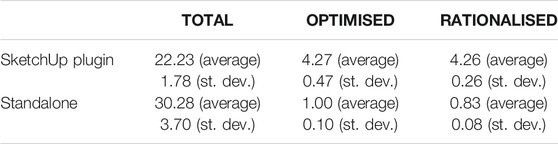
TABLE 5. Computing times of the SketchUp plugin and standalone version implementations.
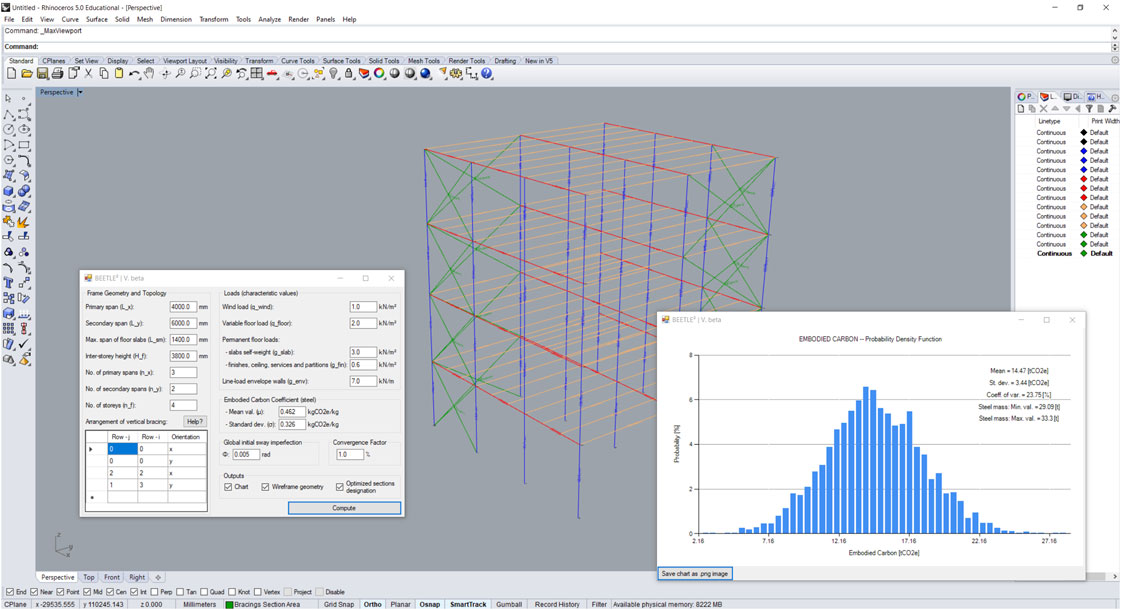
FIGURE 5. Graphical User interface of the FEM-based tool, implemented as a plugin for Rhinoceros 3D.
Comparison With Previous Version
In addition to implementing a ML model–using the previous FEM-based implementation of the tool to generate the dataset of ground truth datapoints for training–a new GUI was also programmed. This is shown in Figure 6, whereas Figure 5 shows the original GUI. This latter was implemented as a plugin for the CAD software Rhinoceros 3D.
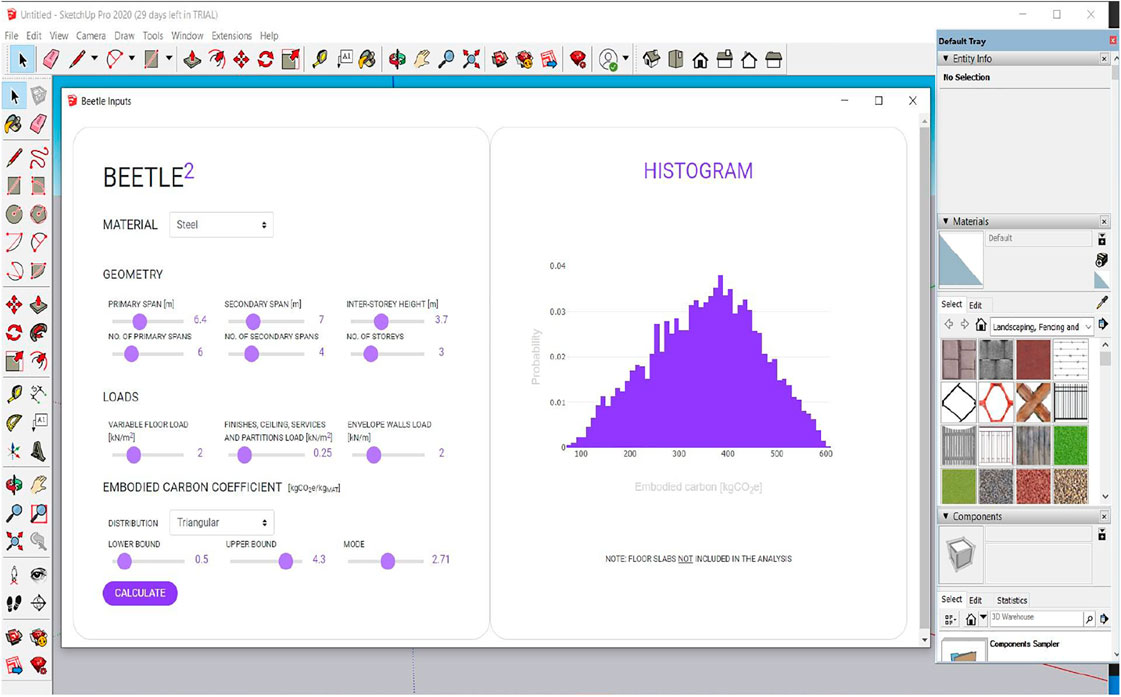
FIGURE 6. Graphical User interface of the newly implemented tool as a plugin for SketchUp.
Aesthetically, the new version is simpler, more elegant and more user friendly, as it is easier to move sliders to select the values than manually inputting each value, hence risking inputting values in the wrong format (e.g., text characters instead of numbers).
The histogram in the second version is didactic and displays information about it as the cursor is moved above it, while the previous version of the tool generates a static image of the embodied carbon histogram.
In terms of functionality, the previous version of the tool relies on a FEM algorithm to compute structural masses and hence it requires a few seconds time to output the results, whereas this second version of the tool uses the pre-trained machine learning model, therefore enabling it to make instant predictions. It should be noted however that since this ML based version of the tool has been trained on a dataset generated from the previous (FEM-based) version, its output suffers from the inherent estimation error, as described in Section 3.
Discussion and Conclusion
Mitigating embodied carbon emissions is one of the greatest challenges that lies ahead to decarbonise built environments globally and progress towards mid-century climate goals. With a projected increase of over 75 billion m2 in floor area through to 2050 it is imperative to accelerate our capability to accurately estimate and effectively mitigate the embodied emissions linked to building structures.
While many tools currently exist, these are either based on simplified spreadsheets that rely on single-value multipliers for different construction products and building materials or are laborious to run and use due to both computational and time requirements. In this article we present a novel method, and accompanying tools, based on machine learning (ML). This enables real-time support at early design stages to estimate the embodied carbon emissions of building structures for three different typologies: reinforced concrete, steel frames, and engineered timber. Results obtained from the tool have been validated against commercial finite element analysis (FEA) software packages–showing good agreement. The embodied carbon estimates are presented in the form of probability density functions, to show the variability and uncertainty associated with material choices and global supply chains. Additionally, the tool also offers a valuable 3D representation of the structural frame to allow the user to quickly check that the variation of the input parameters in the user interface produces the desired result.
To maximise usability and practicality to the professions the tool has been developed in two versions: as a plug-in for Trimble SketchUp and as a standalone tool for designers that operate on different platforms. As such it can cater for multiple professional entities in the complex and multi-faceted domain of the stakeholders involved in the design process of a building.
As noted in the introduction, previous research has adopted the use of surrogate-modelling in various phases of building design. However, most of this research has directed the use of such models towards estimating performance of a building, for example with respect to energy demand (e.g. Ritter, 2015; Østergård, 2017) rather than estimating the mass of embodied carbon in the structure itself. Hence to the best of our knowledge this is the first use of such as technique to speed up the estimation of embodied carbon in the design phase, accommodating a range of building materials. This can aid an architect/engineer in providing a real-time real-time decision-support tool.
Data Availability Statement
The datasets presented in this study can be found in online repositories. The names of the repository/repositories and accession number(s) can be found in the article/Supplementary Material.
Author Contributions
FP, EH, and BD’A conceptualised the research. BD’A developed the original FEA script in Python. MA and ML developed and applied the machine learning models. All authors wrote different parts of the manuscript and contribute to the final version.
Conflict of Interest
The authors declare that the research was conducted in the absence of any commercial or financial relationships that could be construed as a potential conflict of interest.
Publisher’s Note
All claims expressed in this article are solely those of the authors and do not necessarily represent those of their affiliated organizations, or those of the publisher, the editors and the reviewers. Any product that may be evaluated in this article, or claim that may be made by its manufacturer, is not guaranteed or endorsed by the publisher.
Acknowledgments
FP gratefully acknowledges the funding from the Royal Academy of Engineering Grant No. IAPP18-19\215.
References
Bergstra, J., and Bengio, Y. (2012). Random Search for Hyper-Parameter Optimization. J. machine Learn. Res. 13 (2), 281–305. https://www.jmlr.org/papers/volume13/bergstra12a/bergstra12a.pdf.
Bionova (2021). OneClickLCA - World's Fastest Building Life Cycle Assessment Tool. Available at: https://www.oneclicklca.com/.
BSI (2011). BS EN 15978:2011. Sustainability of Construction Works — Assessment of Environmental Performance of Buildings — Calculation Method. United Kingdom: BSI.
D’Amico, B., and Pomponi, F. (2018a). Accuracy and Reliability: A Computational Tool to Minimise Steel Mass and Carbon Emissions at Early-Stage Structural Design. Energy and Buildings 168, 236–250. doi:10.1016/j.enbuild.2018.03.031
D’Amico, B., and Pomponi, F. (2018b). BEETLE2, (Built Environment Efficiency Tool for Low Environmental Externalities). Available at: www.food4rhino.com/app/beetle2 (Accessed 06 04, 2021).
D’Amico, B., and Pomponi, F. (2020). On Mass Quantities of Gravity Frames in Building Structures. J. Building Eng. 31, 101426. doi:10.1016/j.jobe.2020.101426
De Wolf, C., Pomponi, F., and Moncaster, A. (2017). Measuring Embodied Carbon Dioxide Equivalent of Buildings: A Review and Critique of Current Industry Practice. Energy and Buildings 140, 68–80. doi:10.1016/j.enbuild.2017.01.075
De Wolf, C., Yang, F., Cox, D., Charlson, A., Hattan, A. S., and Ochsendorf, J. (2015). Material Quantities and Embodied Carbon Dioxide in Structures. Proc. ICE - Eng. Sustainability. doi:10.1680/jensu.15.00033
Fernández-Delgado, M., Sirsat, M. S., Cernadas, E., Alawadi, S., Barro, S., and Febrero-Bande, M. (2019). An Extensive Experimental Survey of Regression Methods. Neural Networks 111, 11–34. doi:10.1016/j.neunet.2018.12.010
Hart, E., Sim, K., Kamimura, K., Meredieu, C., Guyon, D., and Gardiner, B. (2019). Use of Machine Learning Techniques to Model Wind Damage to Forests. Agric. For. meteorology 265, 16–29. doi:10.1016/j.agrformet.2018.10.022
Hart, J., D'Amico, B., and Pomponi, F. (2021). Whole‐Life Embodied Carbon in Multistory Buildings: Steel, concrete and Timber Structures. J. Ind. Ecol. 25, 403–418. doi:10.1111/jiec.13139
IStructE (2020). How to Calculate Embodied Carbon. Available at: https://www.istructe.org/resources/guidance/how-to-calculate-embodied- carbon/. (Accessed May 31, 2021).
IStructE (2021). The Institution of Structural Engineers - the Structural Carbon Tool. Available at: https://www.istructe.org/resources/guidance/the-structural-carbon-tool/. (Accessed May 31, 2021).
LETI (2020). London Energy Transformation Initiative - Embodied Carbon Primer - Supplementary Guidance to the Climate Emergency Design Guide. Available at: https://www.leti.london/ecp. (Accessed July 10, 2021).
Liang, L., Liu, M., Martin, C., and Sun, W. (2018). A Deep Learning Approach to Estimate Stress Distribution: a Fast and Accurate Surrogate of Finite-Element Analysis. J. R. Soc. Interf. 15 (138), 20170844. doi:10.1098/rsif.2017.0844
Mendoza Beltran, M. A., Pomponi, F., Guinée, J. B., and Heijungs, R. (2018). “Uncertainty Analysis in Embodied Carbon Assessments: What Are the Implications of its Omission?,” in Embodied Carbon in Buildings: Measurement, Management, and Mitigation, Editors F. Pomponi, C. De Wolf, and A. Moncaster (Cham: Springer International Publishing), 3–21. doi:10.1007/978-3-319-72796-7_1
Moncaster, A. M., Pomponi, F., Symons, K. E., and Guthrie, P. M. (2018). Why Method Matters: Temporal, Spatial and Physical Variations in LCA and Their Impact on Choice of Structural System. Energy and Buildings 173, 389–398. doi:10.1016/j.enbuild.2018.05.039
Moynihan, M. C., and Allwood, J. M. (2014). Utilization of Structural Steel in Buildings. Proc. R. Soc. A. 470, 20140170. doi:10.1098/rspa.2014.0170
Ninić, J., Freitag, S., and Meschke, G. (2017). A Hybrid Finite Element and Surrogate Modelling Approach for Simulation and Monitoring Supported TBM Steering. Tunnelling Underground Space Technol. 63, 12–28. doi:10.1016/j.tust.2016.12.004
Østergård, T., Jensen, R. L., and Maagaard, S. E. (2017). Early Building Design: Informed Decision-Making by Exploring Multidimensional Design Space Using Sensitivity Analysis. Energy and Buildings 142, 8–22. doi:10.1016/j.enbuild.2017.02.059
Pedregosa, F., Varoquaux, G., Gramfort, A., Michel, V., Bertrand, T., Grisel, O., et al. (2011). Scikit-learn: Machine Learning in Python. J. machine Learn. Res. 12, 2825–2830. doi:10.5555/1953048.2078195
Pomponi, F., Crawford, R., Stephan, A., Hart, J., and D'Amico, B. (2020a). The 'building Paradox': Research on Building-Related Environmental Effects Requires Global Visibility and Attention. Emerald Open Res. 2, 50. doi:10.35241/emeraldopenres.13838.1
Pomponi, F., D’Amico, B., and Moncaster, A. (2017). A Method to Facilitate Uncertainty Analysis in LCAs of Buildings. Energies 10, 524. doi:10.3390/en10040524
Pomponi, F., Giesekam, J., Hart, J., and D’Amico, B. (2020b). Embodied Carbon - Status Quo and Suggested Roadmap. Report prepared for Zero Waste Scotland and the Scottish Government through the European Regional Development Fund. Available at: https://zerowastescotland.org.uk/sites/default/files/Embodied_carbon_spreads%20final.pdf. (Accessed July 20, 2021).
Pomponi, F., and Moncaster, A. (2018). Scrutinising Embodied Carbon in Buildings: The Next Performance gap Made Manifest. Renew. Sustain. Energ. Rev. 81, 2431–2442. doi:10.1016/j.rser.2017.06.049
Ritter, F., Geyer, P., and Borrmann, A. (2015). "Simulation-Based Decision-Making in Early Design Stages," in Proceedings of the 32nd CIB W78 Conference, Eindhoven, Netherlands, October 26-29, 2015.
Röck, M., Saade, M. R. M., Balouktsi, M., Rasmussen, F. N., Birgisdottir, H., Frischknecht, R., et al. (2020). Embodied GHG Emissions of Buildings - the Hidden challenge for Effective Climate Change Mitigation. Appl. Energ. 258, 114107. doi:10.1016/j.apenergy.2019.114107
Steinwart, I., and Christmann, A. (2008). Support Vector Machines. New York, NY: Springer Science & Business Media.
Keywords: embodied carbon, life cycle assesment, machine learning, sketchup, tools, sustainable buildings and cities
Citation: Pomponi F, Anguita ML, Lange M, D’Amico B and Hart E (2021) Enhancing the Practicality of Tools to Estimate the Whole Life Embodied Carbon of Building Structures via Machine Learning Models. Front. Built Environ. 7:745598. doi: 10.3389/fbuil.2021.745598
Received: 22 July 2021; Accepted: 28 September 2021;
Published: 15 October 2021.
Edited by:
Ben Amor, Université de Sherbrooke, CanadaReviewed by:
Alexander Hollberg, Chalmers University of Technology, SwedenMassimiliano Manfren, University of Southampton, United Kingdom
Copyright © 2021 Pomponi, Anguita, Lange, D’Amico and Hart. This is an open-access article distributed under the terms of the Creative Commons Attribution License (CC BY). The use, distribution or reproduction in other forums is permitted, provided the original author(s) and the copyright owner(s) are credited and that the original publication in this journal is cited, in accordance with accepted academic practice. No use, distribution or reproduction is permitted which does not comply with these terms.
*Correspondence: Francesco Pomponi, Zi5wb21wb25pQG5hcGllci5hYy51aw==