- 1Institute for Materials Science and Max Bergmann Center for Biomaterials, TU Dresden, Dresden, Germany
- 2Chair of Theoretical Chemistry, Institute of Physical Chemistry, Friedrich Schiller University Jena, Jena, Germany
- 3Dresden Center for Computational Materials Science (DCMS), TU Dresden, Dresden, Germany
The aim of this work is to demonstrate a computational workflow for the generation of cross-linkable viscoelastic polymers and the determination of elastic and hyperelastic properties by means of all-atoms classical molecular dynamics simulations, using polydimethylsiloxane (PDMS) as an example. To improve the computational efficiency of the workflow, a phenomenological description of the cross-linking process is chosen instead of a quantum mechanical description of the cross-linking mechanism. The structures produced differ in their conversion degree of cross-linking (cdc) of 60, 70, and 80 percent and their quantity ratio between polymer chains and cross-linking units of 2 to 1 and 5 to 1. In order to exclude finite size effects of the molecular systems as much as possible, large systems of about 40,000 atoms are considered. Furthermore, for each possible configuration from the combination of cdc and the ratio of polymer chains to cross-linking units, six structures different from each other are used. Tensile and compression tests are performed to determine mechanical properties. A dependence of stresses in the deformation direction on strain rate is found for strain rates 107, 108, and 109 1/s. As the cdc increases, an increase in the stress values is observed in the tensile tests. To determine the viscoelastic material properties, relaxation tests are performed following the tensile tests. Thereby, the determined relaxed stresses after the tensile test rise with the increase of the cdc. Furthermore, no large stress deviations, .34 MPa maximum, between structures differing by chain to linker ratio are observed with the Ogden model. The computational workflow shows that classical all-atom molecular dynamics simulations can be a suitable method for structure generation and subsequent characterization of elastic and hyperelastic properties of cross-linked polymers.
1 Introduction
Cross-linked polymers can be in the form of thermosets or elastomers. Polydimethylsiloxane (PDMS) is a widely used elastomer possessing various features such as its optical transparency, low manufacturing costs and thermal stability, which makes it suitable for a wide range of applications, including biomedical substrates, water treatment and microelectromechanical systems (MEMS) Johnston et al. (2014); Chen et al. (2015); Mousavi et al. (2021); Maddah (2019); Schneider et al. (2009).
As a result, the mechanical properties of this hyperelastic elastomer have been extensively studied experimentally Tansel et al. (2020); Nunes (2011); Kim et al. (2011); Liu and Chen (2007); Bernardi et al. (2017). In tissue engineering, for example, PDMS microchannels can be used to investigate the mechanics of vascular diseases. Here, one focus is on determining the mechanical properties of the PDMS Hardy et al. (2009). For example, when used as a substrate in microelectronics, PDMS can be exposed to temperatures of 250–300°C during fabrication Tansel et al. (2020). To understand the mechanical properties of such cross-linked polymer systems, it is helpful to address their molecular properties. System-describing quantities such as the degree of cross-linking, the monomer distribution, and the directionality of the system under consideration can play an essential role. The modeling of cross-linking reactions on the molecular level can be achieved, e.g., with the help of quantum mechanical methods Alemán et al. (2008); Meißner et al. (2020) or classical molecular dynamics (MD) approaches Li and Strachan (2010); Vashisth et al. (2018); Gissinger et al. (2017); Gissinger et al. (2020).
For the physical description of cross-linking reactions on the molecular level, quantum chemical modeling is one of the fundamental tools Alemán et al. (2008); Meißner et al. (2020). This can be used to describe bond breaking and formation in detail. However, calculating the cross-linking behavior of large polymer systems at this fundamental level can become very computationally expensive. Even multi-scale description approaches, in which only part of the polymers are described using quantum chemical methods, are often still too time-consuming. The use of empirical reactive force fields in combination with molecular dynamics methods leads to further computational time savings compared to the previously mentioned approaches Vashisth et al. (2018). Another possibility to reduce the computational time is offered by the phenomenological description of the cross-linking process. For this description, classical molecular dynamics methods, using distance-based cross-linking methods, can be employed Gissinger et al. (2017). In a distance-based cross-linking process, it is only possible for the atoms to react to form a bond when a defined distance value is reached. Depending on the definition of the distance-based cross-linking process, this distance value can be a necessary or sufficient criterion for the formation of a bond. In addition, when generating a new bond, it is possible to break other bonds between bonding atoms and to adjust existing bond parameterizations. In this work, the distance-based cross-linking method implemented in LAMMPS by Gissinger et al. is used Gissinger et al. (2017); Gissinger et al. (2020); Thompson et al. (2022). The advantage of using this method is the reduction of computing time. Moreover, the aim of this work is not the physical description of the cross-linking reactions but the structure generation depending on the ratio between polymer chains and cross-linking units and the conversion degree of cross-linking (cdc). Then, the partially cross-linked polymer structures are subjected to tensile and compression tests. Since the compression and tension tests in the present work are strain-controlled, the strain rate has a decisive influence on the simulation time. To compensate for viscoelastic effects, relaxation tests are connected to the tensile tests. The final deformation state is maintained for the duration of the relaxation and the system is equilibrated during this time. The focus of this work is to present a workflow describing the cross-linking, deformation, and relaxation of polymer structures using different PDMS structures as examples, which differ in terms of the cdc and the composition of the polymer chains and cross-linking elements.
2 Computational setup
In the following, the process for the preparation of the cross-linked polymer systems is described first. Following this, the analysis methods will be described. Finally, the implementation of the compression and tensile tests and the relaxation tests will be presented.
2.1 Setup of cross-linked systems
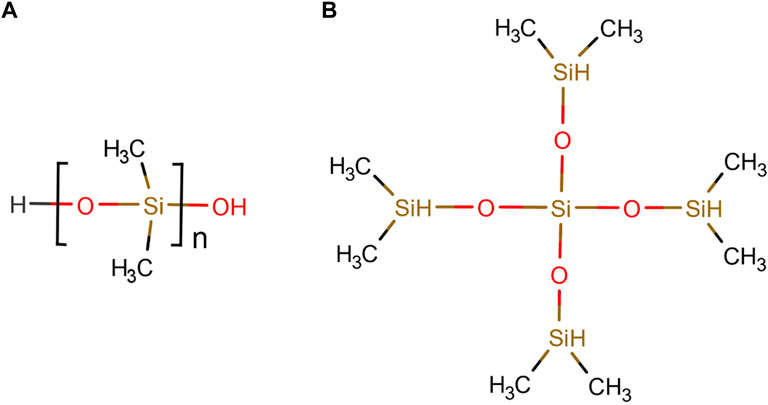
At the beginning, the uncross-linked system is divided into two types of molecules, the linker and the polymer chain according to Figure 1. The linkers represent the only option for cross-linking of the polymer chains and vice versa. The cdc refers to the maximum possible number of cross-links between chains and linkers. The chemical reaction between polymer chain and linker is described by
where R denotes the linker and R′ the polymer chain Heine et al. (2004). The structure of the PDMS monomer and the linker molecule can be seen in Figure 1A and Figure 1B, respectively. The cross-linking atoms of the polymer chain are the oxygen atoms saturated with hydrogen in Figure 1A at the head and at the end of the polymer chain. In Figure 1B, the four outer silicon atoms of the linker molecule are the cross-linking atoms. When one of the outer silicon atoms of the linker is within a previously defined distance of 5 Å of an oxygen atom located at the end or tail of the polymer chain, a bond is created between the oxygen and silicon atom. At the same time, the bonds between the hydrogen atoms at the corresponding oxygen atom and silicon atom are broken and the hydrogen atoms are removed from the system.
The initial three dimensional distribution of the polymer chains and linkers are generated with the software package GROMACS Hess et al. (2008). Here, the number of chains NC and linkers NL are captured within a cubic simulation box. An initial minimum spacing between different molecules of 3.5 Å is chosen. The distribution and the orientations of the individual molecules are random. For the MD simulations, the DREIDING force field Mayo et al. (1990) is used, with specifically parameterised bonds, angles and dihedrals. The parametrisation of the system is done in two steps. The bonds, angles and dihedrals of the linker and polymer chain types used are determined with the software package “LAMMPS Interface” Boyd et al. (2017). As a result, the parametrisation of one chain type and linker type each becomes available. Subsequently, in a second step, the parameterized linkers and chains are mapped to the initial structures previously generated with GROMACS Hess et al. (2008). The systems considered have chain to linker ratios according to Table 1. Six different initial geometries are cross-linked according to the flow chart shown in Figure 2A. The systems achieve a cdc of 60, 70, and 80 percent. In the present work, large systems are used, i.e., about 40,000 atoms. After the system is initialized and initial velocities are set, the system is heated from 30 to 400 K for 40 ps at a constant atomic number, specified volume, and specified temperature (NVT ensemble). The system is then first equilibrated at a temperature of 400 K for 20 ps with an NVT ensemble and then equilibrated at a constant atomic number, a temperature of 400 K, and a pressure of 0 Pa (NPT ensemble) for 8 ps. Subsequently, the system is further equilibrated within the NVT ensemble for 25 ps. During this equilibration process, cross-linking reactions are allowed. After this simulation time has elapsed, a check is made to see whether the 60 percent cross-linking level has been reached. If this condition is met, the structure is stored and an equilibration phase without cross-linking reactions follows at 400 K and zero pressure for 5 ps. This is followed by another equilibration phase with allowed cross-linking reactions with the NVT ensemble at 400 K for 10 ps. The reduction of the simulation times of the equilibration phases with NPT and NVT ensembles occurs after a cdc of 60 percent is reached, because the equations of motion display numerical instabilities with longer simulation times of the equilibration phases in the NVT and NPT ensembles. The two equilibration phases that occur after the structure is stored with a cdc of 60 percent are repeated until first a cdc of 70 percent is reached, the structure is stored, and cross-linking is completed to a cdc of 80 percent. According to Table 1 the system groups differ in the ratio of polymer chains to linkers, so system group A has a ratio of 2 to 1 and system group B has a ratio of 5 to 3. After the cross-linking simulations are completed, each system group contains six configurations for a cdc of 60, 70, and 80 percent, respectively.
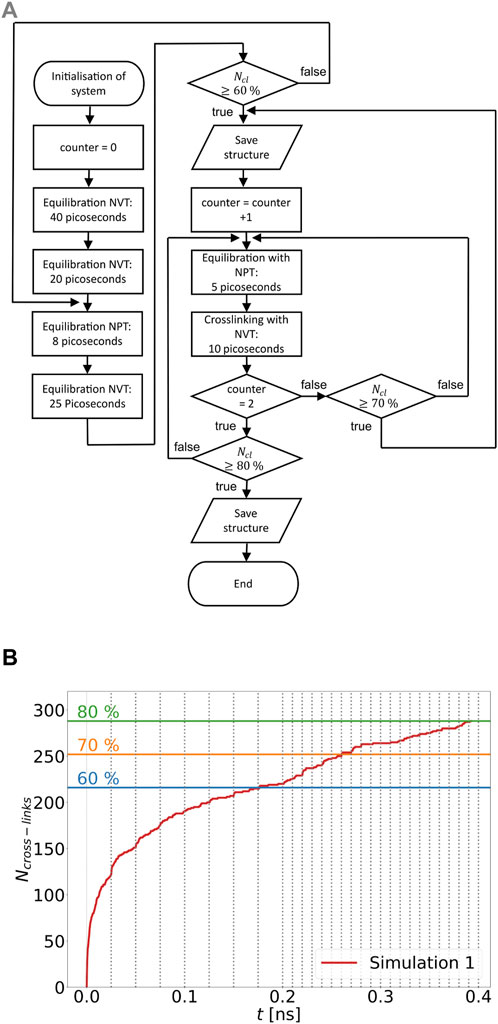
FIGURE 2. (A) Flowchart of distance based cross-linking procedure; (B) Progress of cross-linking over time for a simulation run of a system with a chain to linker ratio of 5 to 3: Three threshold values of number of cross-links are displayed for 60%, 70%, and 80% cdc. The grey dotted lines mark the start and end points of the cross-linking phases.
2.2 Constitutive equations
To describe the mechanical behavior of hyperelastic materials, the Ogden model Ogden. (1951) and the Mooney Rivlin model Mooney. (1940) are widely used in the literature Kim et al. (2011); Sasso et al. (2008); Gamonpilas and McCuiston (2012); Kim et al. (2012); Khajehsaeid et al. (2014). Here, the energy density Ψ is calculated as a function of the three principal stretches λ1, λ2 and λ3 according to
where μp are shear moduli, αp are dimensionless constants and N is the number of summation terms Holzapfel. (2010). Assuming incompressible material behaviour, the stresses σii for different deformation states, such as for uniaxial strain, can be derived as
From Eq. 1, where λi is the principal stretch in direction of deformation Bernardi et al. (2017). In the literature, two and three summation terms are used for the experimental data Kim et al. (2011); Treloar (1944); Kanyanta and Ivankovic (2010); Bernardi et al. (2017). To describe the viscoelastic behavior, relaxation tests are performed in experimental studies to determine the time-dependent relaxation modulus Kanyanta and Ivankovic (2010). In the first step, a tensile test is performed at constant strain rate. In the second step, the final state of the tensile test is then sustained during the relaxation time tr and the decreasing stress curve is recorded. Using the Prony series
where E∞ is the relaxed modulus, the relaxation modulus E(tr) within the Wiechert model can be calculated Brinson and Brinson (2015). This model is based on the generalized Maxwell model, therefore the components Ei and τi represent the elastic and time-constant parameters of the Maxwell model. The relaxed modulus describes the slope of the linear regression line of the different values of relaxed stresses σ∞ as a function of the total strains applied in each case Kanyanta and Ivankovic (2010); Heine et al. (2004).
To include the initial stress from the relaxation test, we use
where pi are fitting parameters and σ0 is the initial stress Heine et al. (2004). In order to calculate the relaxed stress, it is assumed on the basis of the determined stress-time behavior for the fit with Eq. 4 that this fit function converges to a stress value in the infinite time domain. From this assumption follows
2.3 Deformation and relaxation tests
After the partially cross-linked systems are generated according to Section 2.1, they are equilibrated using an NPT ensemble at a temperature of 400 K and zero pressure for 7 ns. The equilibrated systems are the initial systems for the compression and tensile tests where, using a NPT ensemble, principal stress components σyy and σzz are set equal to zero. The temperature is 400 K as before for equilibration. The deformation is strain controlled and strain rates of 107, 108 and 109 1/s are used, with final strains being .1, .175, .25, and .325. The selected maximum hyperelastic strain range of 32.5 percent is relatively small compared to the literature Shim et al. (2004); Bernardi et al. (2017). For the all-atom MD simulations considered in this work, the lowest strain rate is 107 1/s so that the computational cost for 10 ns with an MPI parallelization on 48 cores (Hasswell architecture) does not exceed 3 days on average. Finally, after the tensile tests have been completed and the deformed partially cross-linked systems have been stored, the systems are equilibrated with another NPT ensemble while maintaining the deformation state. In these relaxation tests, the main stress components σyy and σzz are again set to zero. Since computational power is limited, relaxation times used in practical relaxation experiments, which are on the order of 103 s, cannot be simulatively realised in the present work Kanyanta and Ivankovic (2010). The systems are equilibrated at a temperature of 400 K for 25 ns.
To fit the relaxed stress data to the Prony series according to Eq. 4 the non-linear least square method is used. In this case τi is a fitting parameter. In addition, it should be noted that for one fit, the data points of six simulated relaxation tests, i.e., 1,500,012 data points, are used.
3 Results and discussion
The results are classified into two categories. Firstly, the structures of the polymer systems are analysed and secondly, the mechanical properties of these systems are considered.
3.1 Cross-linking and structure
As previously described, polymer systems initialized with GROMACS Hess et al. (2008) are subjected to a distance-based cross-linking process. In order to describe the cross-linking according to the sequence shown in Figure 2A, only the equilibration phases that enable a cross-linking reaction are shown in Figure 2B. The difficulty in the cross-linking of the considered systems, consists in the number of atoms. The complexity addressed here could have been reduced by choosing a coarse grained model Heine et al. (2004). In this work, however, an all-atom MD is used to visualize the complexity of the cross-linking with a large cdc. In Figure 2B, it can be seen that the increase in cross-linking is highest in the first 25 ps, as the number of cross-linking opportunities decreases with the formation of new cross-links and their mobility is reduced. Due to the increasing cdc and the consequent increasing numerical instability of the equations of motion, the cross-linking phases are shortened from the previous 25 to 5 ps starting from 60 percent cdc. In addition, it can be seen in Figure 2B that the increase in cross-links on average decreases as the number of cross-links increases for the first .2 ns. Figure 3A, created with the software OVITO Stukowski (2010), shows an example of a representative volume element (RVE). Connected chains and linkers are shown in a common color and will be referred to as unit chains in the following. In addition, Figure 3B shows the average number of unit chains as it depends on the number of their units. The term units can mean either chains or linkers. It is noticeable that as cdc decreases, the number of unit chains that have one to nine chain units decreases. In addition, it is shown that one out of six RVEs that have a cdc of 70 percent and five out of six RVEs that have a cdc of 80 percent have the longest occurring unit chain lengths, which range from 100 to 250 units. In Figure 3C, the average chain to linker ratio per unit chain is presented for an overall ratio of 2 to 1. In addition, it should be mentioned that single chains or linkers are not included in the statistics shown in Figure 3C. In Figure 3C, it can be seen that most unit chains have chains to linker ratios of 1.75 to less than 2.5. The initial overall chain to linker ratio of 2 to 1 is also in this ratio range. At least as many linkers as chains in a unit chain occur only once in one of six RVEs with a cdc of 60 percent and 70 percent.
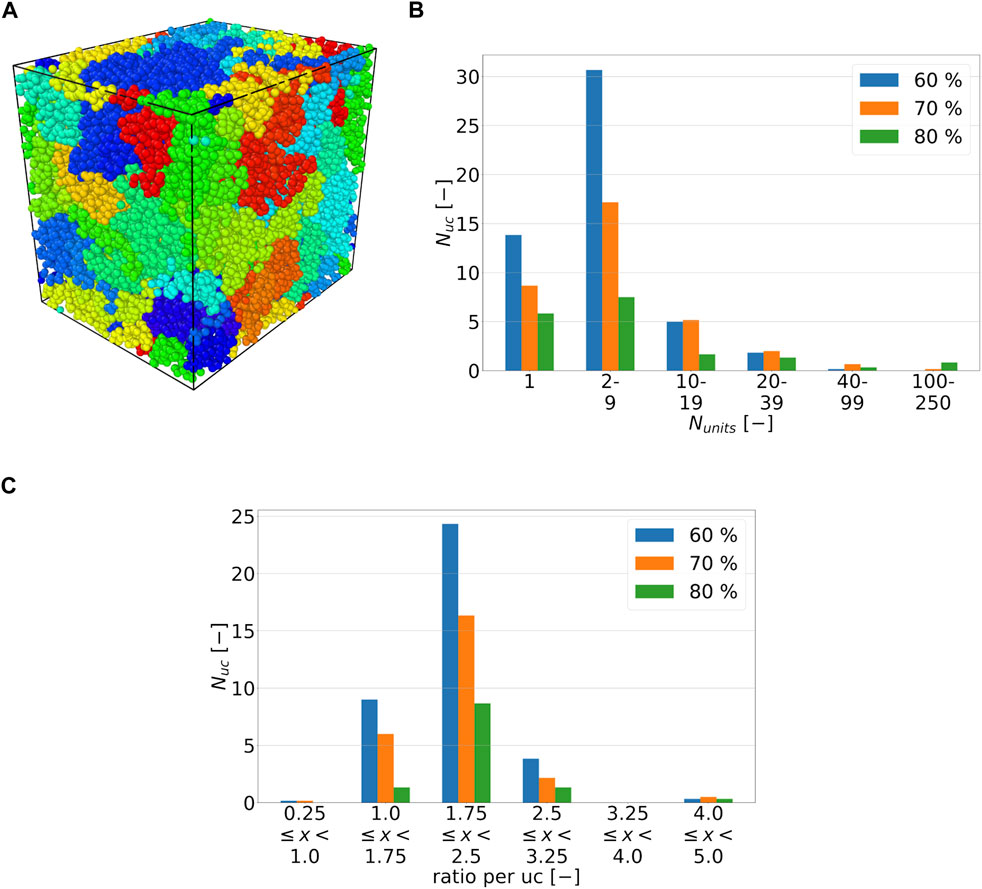
FIGURE 3. (A) RVE with cdc of 80 percent for chain to linker ratio of 2 to 1. The different colors of the atoms define the cross-linked polymer chains and linkers and are referred to as unit chains in the following. In this example, 42 different unit chains exist. (B) Average histogram plot of number of units Nunits, chain or linker, per unit chain (uc) for ratio of 2 to 1. A chain unit consists of connected chains and linkers. The standard deviations of the number of units per unit chain are 5.75, 12.86, and 39.55 for a cdc of 60, 70, and 80 percent, respectively. (C) Average histogram plot of chain to linker ratio per unit chain for ratio of 2 to 1. The standard deviations of the chain to linker ratios are .5, .53 and .52 for a cdc of 60, 70, and 80 percent, respectively.
3.2 Mechanical properties
First, the cross-linked structures from Table 1 are deformed for 10, 17.5, 25, and 32.5 ns at constant strain rates of 107, 108 and 109 1/s. Strain rates in experimental studies for tensile tests with relaxation tests of viscoelastic materials range from 10–8 to 10–4 1/s Siviour and Jordan (2016). The relaxation times are set to 25 ns in order not to set the computational effort too large.
3.2.1 Uniaxial compression and tension
The uniaxial compression and tension tests are selected as deformation cases. Deformation in compressive and tensile directions occurs at the same absolute strain rate. The final strain ranges are also identical in absolute value. In a first step, the noise of the components of the Cauchy stress tensor is considered as a function of the simulation time after applying the Butterworth low-pass filter with a cutoff frequency of 10–6 Hz Stephen (1930). The filtered fluctuations of the stress response are exemplary shown in Figure 4A.
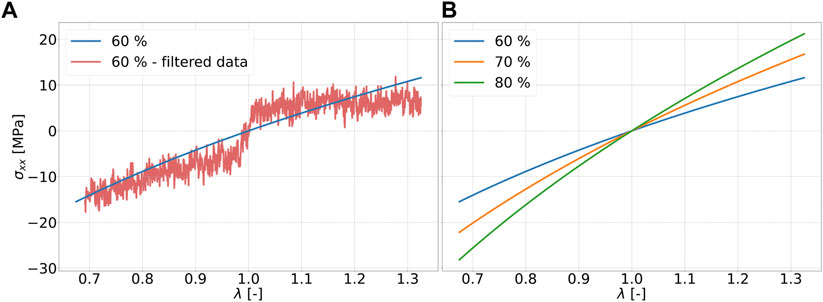
FIGURE 4. Stress-strain data of strain rate of 107 1/s for ratio 2 to 1: (A) Fit of stress-strain data with the Ogden model of for 60 percent (blue) cdc and filtered stress-strain data for 60 percent (red) cdc; (B) Fit of stress-strain data with the Ogden model of for 60 percent (blue), 70 percent (orange), 80 percent (green) cdc.
The strain range of ±32.5 percent considered in this work can be regarded rather small as a fitting range for classical hyperelastic material models such as those according to Ogden (1951) or Mooney-Rivlin Mooney (1940), if fitting ranges from literature are used for comparison Kanyanta and Ivankovic (2010); Kim et al. (2011); Bernardi et al. (2017). The stress-strain data for the six specimens per cross-linking degree are fitted using the Ogden model according to Eq. 2 with two summation terms. For this purpose, all data points from all six simulation runs, i.e., 3,900,084 data points, are used. The fitting parameters for the Ogden model can be found in Table 2. It can be seen in Figure 4B that the stress values resulting from the fit with the Ogden model, which are in compression and tension, increase in magnitude with increase in cdc at the same strain state in each case. For these examples, this means that an increase in cross-links leads to a higher stiffness of the material. The deviations of the fits with a ratio of 2 to 1 and 5 to 3 amount to a maximum of .34 MPa. The effects of the chain to linker ratios can be considered small in these examples. Figure 5A and Figure 5B show the fits to Eq. 2 for the tension and compression tests at a strain rate of 108 1/s and a strain rate of 109 1/s, respectively. Compared to Figure 4B, it can be seen that the maximum stress (at λ = 1.325) in the fit at a strain rate of 109 1/s is larger by factors 9.22, 7.29, and 6.16 for the cdc of 60, 70, and 80 percent, respectively. In the systems considered in this work, strain rate dependence can thereby be described.
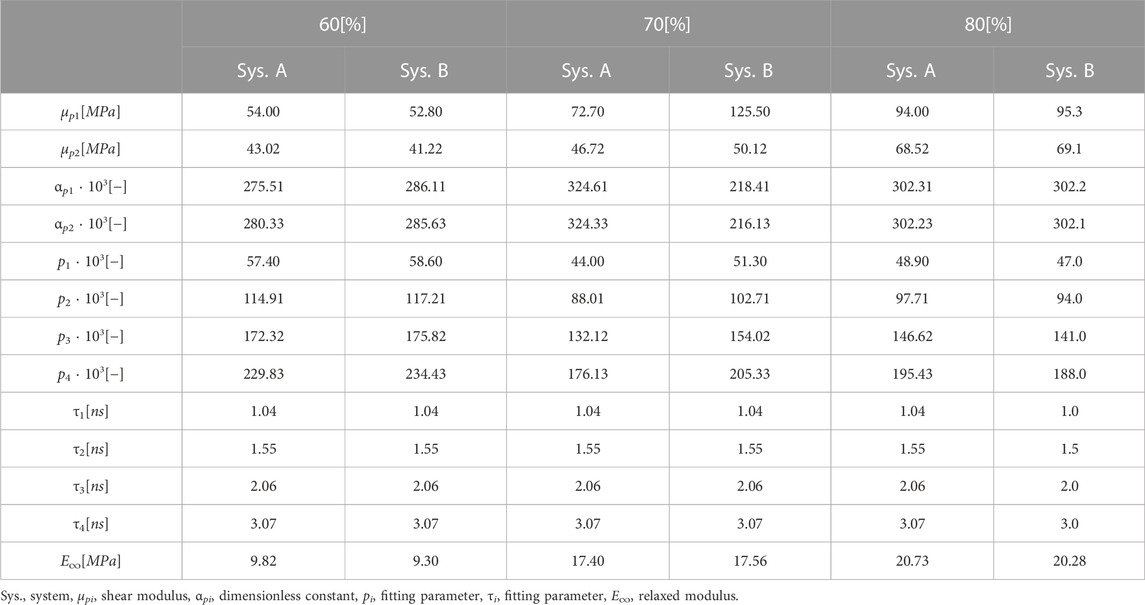
TABLE 2. Parameters for fits with Prony series and linear regression of relaxed stress for strain rate of 107 1/s.
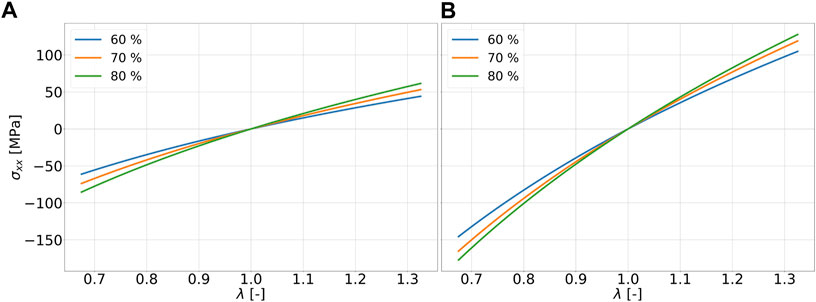
FIGURE 5. Fit of stress-strain data with the Ogden model of for 60 percent (blue), 70 percent (orange), 80 percent (green) cdc for ratio 2 to 1 and strain rates (A) 108 1/s and (B) 109 1/s.
Comparing the values for the coefficients μp1 and μp2 from Table 2 with the literature, it is noticeable that the values in the literature vary between rounded 3.4*10–4 MPa and 63.45 MPa Kim et al. (2011). Furthermore, it has to be noted that stresses up to 32.5 percent are below .5 MPa Kim et al. (2011). It has to be mentioned that the test temperature has to be assumed at 273.15 K in Tansel et al. (2020) and Kim et al. (2011). The higher temperature of 400 K used in this work should, as expected, result in lower stress values than the test temperature in the literature.
3.2.2 Relaxation
In order to be able to determine the relaxation moduli, in a first step limit values of the stress for t → ∞ in the range of equilibration have to be found. To capture viscoelastic effects, the stress relaxation follows after the tensile test. Since relaxation times on the order of 103 s, as described in the literature, would be far beyond the time scales achievable with MD simulations for the simulations performed here, a relaxation time of 25 ns, which is on the order of magnitude used in the literature, is chosen in these simulations for all end structures of the tensile tests at the strain rate of 107 1/s Kanyanta and Ivankovic (2010); Heine et al. (2004). In order to be able to calculate a final value from the fluctuating stress values during relaxation, the Prony series according to Eq. 4 is used. Here, for σ0 the stress value at maximum strain is used with respect to the tensile tests performed. In Figure 6A and Figure 6B, the relaxing stresses of the cross-linked polymer systems with a chain to linker ratio of 2 to 1 are shown for the total strains of .1 and .325 applied in the tensile test, respectively. The fitting parameters used can be found in Table 2. According to Eq. 5, the relaxed stress σ∞ is obtained. The maximum deviation between the systems with chain to linker ratios of 2 to 1 and 5 to 3 is 5.7 percent. At a final elongation of 17.5 percent, the relaxed stress value for a cdc of 80 percent is below the cdc of 70 percent at a chain to linker ratio of 2 to 1 and at a ratio of 5 to 3. This behavior is not shown in Figure 4 because the fit is constructed over the entire strain range of 32.5 percent. The construction of the fits according to Eq. 4 is also based on the stress values of the Cauchy stress tensor component in the loading direction and thus does not necessarily take into account the stress-strain curve over the entire strain range as do the fits according to the Ogden model. Considering Figure 6A and Figure 6B, it is obvious that the relaxed stresses increase with increasing cdc, which is in line with expectations related to the trend in tensile tests. The relaxed stress values are plotted in common graphs in Figure 7 as a function of the maximum strain of the system under consideration. The determined stress values are then linearly regressed as a function of the applied strain by σ equal to 0 MPa and ɛ equal to zero. The slope thus determined corresponds to the relaxed modulus E∞ in Eq. 3. The moduli for the systems with different ratios and cdc can be found in Table 2.
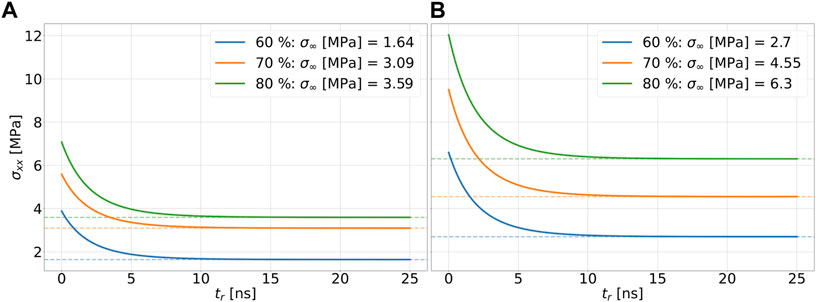
FIGURE 6. Fit of stress-strain data from relaxation tests for a strain rate of 107 1/s using the Prony series for the systems with a polymer chain to linker ratio of 2 to 1. The dashed lines are plotted on the stress values of the relaxed stresses of the respective systems. The total strain of the systems is .1 in (A) and .325 in (B).
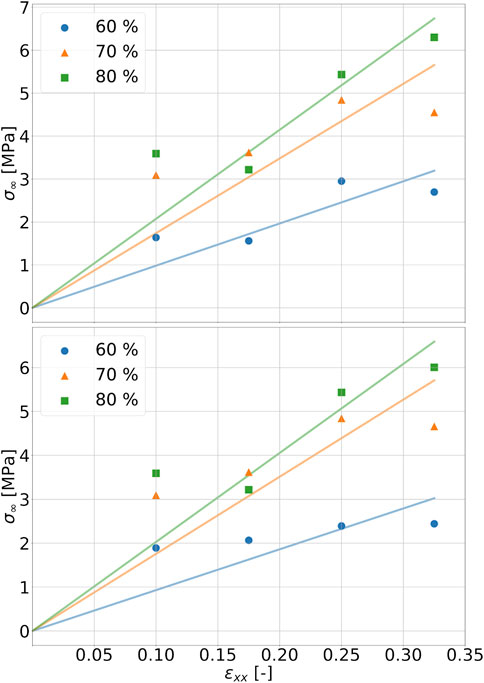
FIGURE 7. Linear regression of relaxed stresses in dependency of final strain of tension tests for strain rate of 1071/s. The ratio of polymer chain to linker is 2 to 1 in the top figure and 5 to 3 in the bottom figure.
4 Conclusion
In this work, a workflow for the generation and mechanical analysis of cross-linked polymer-based systems is presented using polydimethylsiloxane (PDMS) as an example. For the cross-linking process of different PDMS structures, which differ in the ratio of chains to linkers and in amount of cdc and contain approximately 40,000 atoms, a workflow is defined for the MD simulations. It is also observed that the longest occurring unit chains, ranging from 100 to 250 units in length, were most probable to occur in the highly cross-linked systems with 80 percent cdc. Increasing the cdc at strain rates of 107, 108 and 109 1/s in tensile tests leads to an increased stiffness. In addition, it is evident from the fits to the Ogden model that inclusion of the compression tests can result in higher stress values compared to the filtered data in tension. Furthermore, an increase in strain rate also leads to an increase in the average magnitude of the stress values of the PDMS structures tested. Thus, a dependence of stress values on strain rate in the tensile direction is observed at strain rates of 107, 108, and 109 1/s. In the further investigations, the lowest strain rate, 107 1/s, is used. It can be observed that increasing the cdc from 60 to 70 percent and from 70 to 80 percent leads to higher stress values of the Ogden model. The maximum difference between the stress values obtained with the Ogden model for a chain to linker ratio of 2 to 1 and 5 to 3 is negligible at .34 MPa. In the relaxation tests, it is found that an increase in cdc leads to an increase in the relaxation stresses calculated with the Prony series. From the relaxation stresses, the relaxation moduli E(tr) and the relaxed modulus E∞ can be calculated. Compared to the experimental results, the relaxed moduli are too high by at least a factor of 15 and 14 for chain-to-linker ratios of 2 to 1 and 5 to 3, respectively Kanyanta and Ivankovic (2010). It should be noted that the strain range considered for the relaxation modulus was chosen up to 32.5 percent in this work and up to 100 percent in the literature. Other reasons for this deviation could be either a too short relaxation time (25 ns) or a too high strain rate in the tensile test. Therefore the strain rate dependence of the stress values has to be tested for strain rates lower than 107 1/s. At the same time, it is necessary that the strain ranges do not become too small so that the influence of fluctuations in the stress-strain data can be reduced on average.
The present work demonstrates that the determination of the mechanical properties of cross-linkable viscoelastic hyperelastic polymers, can be performed using molecular dynamics simulations in a unified workflow.
Data availability statement
The raw data supporting the conclusions of this article will be made available by the authors, without undue reservation.
Author contributions
SK: Investigation, methodology, conceptualization, visualization, writing—original draft, writing—review and editing. AC: Supervision, methodology, writing—review and editing. AD: Supervision, methodology, writing—review and editing. GC: Funding acquisition, supervision, writing—review and editing.
Acknowledgments
The authors gratefully acknowledge the Dresden Center for Intelligent Materials (DCIM) and the Center for Information Services and High Performance Computing (ZIH) of TU Dresden.
Conflict of interest
The authors declare that the research was conducted in the absence of any commercial or financial relationships that could be construed as a potential conflict of interest.
Publisher’s note
All claims expressed in this article are solely those of the authors and do not necessarily represent those of their affiliated organizations, or those of the publisher, the editors and the reviewers. Any product that may be evaluated in this article, or claim that may be made by its manufacturer, is not guaranteed or endorsed by the publisher.
References
Alemán, C., Casanovas, J., Torras, J., Bertrán, O., Armelin, E., Oliver, R., et al. (2008). Cross-linking in polypyrrole and poly(N-methylpyrrole): Comparative experimental and theoretical studies. Polymer 49, 1066–1075. doi:10.1016/j.polymer.2007.12.039
Bernardi, L., Hopf, R., Ferrari, A., Ehret, A., and Mazza, E. (2017). On the large strain deformation behavior of silicone-based elastomers for biomedical applications. Polym. Test. 58, 189–198. doi:10.1016/j.polymertesting.2016.12.029
Boyd, P. G., Moosavi, S. M., Witman, M., and Smit, B. (2017). Force-field prediction of materials properties in metal-organic frameworks. J. Phys. Chem. Lett. 8, 357–363. doi:10.1021/acs.jpclett.6b02532
Brinson, H. F., and Brinson, L. C. (2015). Polymer engineering science and viscoelasticity. Boston, MA: Springer US. doi:10.1007/978-1-4899-7485-3
Chen, D., Chen, F., Hu, X., Zhang, H., Yin, X., and Zhou, Y. (2015). Thermal stability, mechanical and optical properties of novel addition cured PDMS composites with nano-silica sol and MQ silicone resin. Compos. Sci. Technol. 117, 307–314. doi:10.1016/j.compscitech.2015.07.003
Gamonpilas, C., and McCuiston, R. (2012). A non-linear viscoelastic material constitutive model for polyurea. Polymer 53, 3655–3658. doi:10.1016/j.polymer.2012.06.030
Gissinger, J. R., Jensen, B. D., and Wise, K. E. (2017). Modeling chemical reactions in classical molecular dynamics simulations. Polymer 128, 211–217. doi:10.1016/j.polymer.2017.09.038
Gissinger, J. R., Jensen, B. D., and Wise, K. E. (2020). Reacter: A heuristic method for reactive molecular dynamics. Macromolecules 53, 9953–9961. doi:10.1021/acs.macromol.0c02012
Hardy, B. S., Uechi, K., Zhen, J., and Pirouz Kavehpour, H. (2009). The deformation of flexible PDMS microchannels under a pressure driven flow. Lab. Chip 9, 935–938. doi:10.1039/B813061B
Heine, D. R., Grest, G. S., Lorenz, C. D., Tsige, M., and Stevens, M. J. (2004). Atomistic simulations of end-linked poly(dimethylsiloxane) networks: Structure and relaxation. Macromolecules 37, 3857–3864. doi:10.1021/ma035760j
Hess, B., Kutzner, C., van der Spoel, D., and Lindahl, E. (2008). Gromacs 4: Algorithms for highly efficient, load-balanced, and scalable molecular simulation. J. Chem. Theory Comput. 4, 435–447. doi:10.1021/ct700301q
Johnston, I. D., McCluskey, D. K., Tan, C. K. L., and Tracey, M. C. (2014). Mechanical characterization of bulk Sylgard 184 for microfluidics and microengineering. J. Micromechanics Microengineering 24, 035017. doi:10.1088/0960-1317/24/3/035017
Kanyanta, V., and Ivankovic, A. (2010). Mechanical characterisation of polyurethane elastomer for biomedical applications. J. Mech. Behav. Biomed. Mater. 3, 51–62. doi:10.1016/j.jmbbm.2009.03.005
Khajehsaeid, H., Arghavani, J., Naghdabadi, R., and Sohrabpour, S. (2014). A visco-hyperelastic constitutive model for rubber-like materials: A rate-dependent relaxation time scheme. Int. J. Eng. Sci. 79, 44–58. doi:10.1016/j.ijengsci.2014.03.001
Kim, B., Lee, S. B., Lee, J., Cho, S., Park, H., Yeom, S., et al. (2012). A comparison among Neo-Hookean model, Mooney-Rivlin model, and Ogden model for chloroprene rubber. Int. J. Precis. Eng. Manuf. 13, 759–764. doi:10.1007/s12541-012-0099-y
Kim, T. K., Kim, J. K., and Jeong, O. C. (2011). Measurement of nonlinear mechanical properties of PDMS elastomer. Microelectron. Eng. 88, 1982–1985. doi:10.1016/j.mee.2010.12.108
Li, C., and Strachan, A. (2010). Molecular simulations of crosslinking process of thermosetting polymers. Polymer 51, 6058–6070. doi:10.1016/j.polymer.2010.10.033
Liu, M., and Chen, Q. (2007). Characterization study of bonded and unbonded polydimethylsiloxane aimed for bio-micro- electromechanical systems-related applications. J. Micro/Nanolith. MEMS MOEMS 6, 023008. doi:10.1117/1.2731381
Maddah, H. A. (2019). Industrial membrane processes for the removal of VOCs from water and wastewater. Int. J. Eng. Appl. Sci. (IJEAS) 6. doi:10.31873/IJEAS/6.4.2019.09
Mayo, S. L., Olafson, B. D., and Goddard, W. A. (1990). Dreiding: A generic force field for molecular simulations. J. Phys. Chem. 94, 8897–8909. doi:10.1021/j100389a010
Meißner, R. H., Konrad, J., Boll, B., Fiedler, B., and Zahn, D. (2020). Molecular simulation of thermosetting polymer hardening: Reactive events enabled by controlled topology transfer. Macromolecules 53, 9698–9705. doi:10.1021/acs.macromol.0c02222
Mooney, M. (1940). A theory of large elastic deformation. J. Appl. Phys. 11, 582–592. doi:10.1063/1.1712836
Mousavi, M., Ghaleh, H., Jalili, K., and Abbasi, F. (2021). Multi-layer PDMS films having antifouling property for biomedical applications. J. Biomaterials Sci. Polym. Ed. 32, 678–693. doi:10.1080/09205063.2020.1856300
Nunes, L. (2011). Mechanical characterization of hyperelastic polydimethylsiloxane by simple shear test. Mater. Sci. Eng. A 528, 1799–1804. doi:10.1016/j.msea.2010.11.025
Ogden, R. W. (1951). Large elastic deformations of isotropic materials VII. Experiments on the deformation of rubber. Philosophical Trans. R. Soc. Lond. Ser. A, Math. Phys. Sci. 243, 251–288. doi:10.1098/rsta.1951.0004
Sasso, M., Palmieri, G., Chiappini, G., and Amodio, D. (2008). Characterization of hyperelastic rubber-like materials by biaxial and uniaxial stretching tests based on optical methods. Polym. Test. 27, 995–1004. doi:10.1016/j.polymertesting.2008.09.001
Schneider, F., Draheim, J., Kamberger, R., and Wallrabe, U. (2009). Process and material properties of polydimethylsiloxane (PDMS) for Optical MEMS. Sensors Actuators A Phys. 151, 95–99. doi:10.1016/j.sna.2009.01.026
Shim, V. P. W., Yang, L. M., Lim, C. T., and Law, P. H. (2004). A visco-hyperelastic constitutive model to characterize both tensile and compressive behavior of rubber. J. Appl. Polym. Sci. 92, 523–531. doi:10.1002/app.20029
Siviour, C. R., and Jordan, J. L. (2016). High strain rate mechanics of polymers: A review. J. Dyn. Behav. Mater. 2, 15–32. doi:10.1007/s40870-016-0052-8
Stukowski, A. (2010). Visualization and analysis of atomistic simulation data with OVITO–the Open Visualization Tool. Model. Simul. Mater. Sci. Eng. 18, 015012. doi:10.1088/0965-0393/18/1/015012
Tansel, D. Z., Brenneman, J., Fedder, G. K., and Panat, R. (2020). Mechanical characterization of polydimethylsiloxane (PDMS) exposed to thermal histories up to 300 °C in a vacuum environment. J. Micromechanics Microengineering 30, 067001. doi:10.1088/1361-6439/ab82f4
Thompson, A. P., Aktulga, H. M., Berger, R., Bolintineanu, D. S., Brown, W. M., Crozier, P. S., et al. (2022). Lammps - a flexible simulation tool for particle-based materials modeling at the atomic, meso, and continuum scales. Comput. Phys. Commun. 271, 108171. doi:10.1016/j.cpc.2021.108171
Treloar, L. R. G. (1944). Stress-strain data for vulcanized rubber under various types of deformation. Rubber Chem. Technol. 17, 813–825. doi:10.5254/1.3546701
Keywords: polymer, cross-linking, PDMS, polydimethylsiloxane, mechanical properties, relaxation test, hyperelasticity, viscoelasticity
Citation: Kampmann S, Croy A, Dianat A and Cuniberti G (2023) Workflow for computational characterization of PDMS cross-linked systems. Front. Built Environ. 8:1070045. doi: 10.3389/fbuil.2022.1070045
Received: 14 October 2022; Accepted: 23 December 2022;
Published: 02 February 2023.
Edited by:
Franco Milicchio, Roma Tre University, ItalyReviewed by:
Arun Prabhu Rameshbabu, Harvard Medical School, United StatesMohammad Arefi, University of Kashan, Iran
Copyright © 2023 Kampmann, Croy, Dianat and Cuniberti. This is an open-access article distributed under the terms of the Creative Commons Attribution License (CC BY). The use, distribution or reproduction in other forums is permitted, provided the original author(s) and the copyright owner(s) are credited and that the original publication in this journal is cited, in accordance with accepted academic practice. No use, distribution or reproduction is permitted which does not comply with these terms.
*Correspondence: Gianaurelio Cuniberti , Z2lhbmF1cmVsaW8uY3VuaWJlcnRpQHR1LWRyZXNkZW4uZGU=
 Steffen Kampmann
 Alexander Croy2
 Arezoo Dianat