- 1School of Engineering, The University of Birmingham, Birmingham, United Kingdom
- 2Precast Advanced Track (PCAT) Ltd., Birmingham, United Kingdom
This study aims to evaluate the whole life cycle performance of Precast Advanced Track (PCAT) light rail systems in a digital twin environment, which is time-saving, flexible, and highly accurate. Two sustainability aspects of the system are addressed: environmental and economic impacts. In the life cycle assessment (LCA), energy consumption and CO2 emissions are calculated, whereas costs at each stage were calculated and converted to present values in the life cycle costing assessment (LCC). Revit is used for assessment. It enables the bill of quantities in the models to provide quantitative data for sustainability assessments. In the PCAT light rail systems, all structures and components have been considered, including subbase, concrete slab, rail fastening, rails, bituminous layer, rubber pad, and grease lubrication. Results exhibit that concrete slabs for street and off-street systems have a minor contribution to minimizing energy consumption, CO2 emissions, and costs. Rail fastenings and rails can be recycled, but the energy consumption is relatively enormous. Unrecyclable materials such as bitumen and grout account for a large portion of lifecycle CO2 emissions and costs. Surprisingly, these two materials are quite sensitive to parametric change. Accordingly, the digital twin confirms that PCAT concrete slabs demonstrate a good performance throughout the whole life cycle. However, there is still room for improvements, for example, re-designing a concrete slab with less grout while showing good waterproof performance. These structural modifications can be updated on the digital twin to enact positive changes for the sustainable development of light rail systems.
1 Introduction
The world population increased from 3.68 billion in 1970 to 7.79 billion in 2020, drastically accelerating the consumption of natural resources (The World Bank, 2020). In this regard, awareness of the importance of sustainable development has been significantly increased. Therefore, traditional ideas and concepts are gradually being replaced. For example, the idea of the life cycle is transferring from “cradle to grave” to “cradle to cradle,” aiming to reincorporate waste materials into new products to reduce the impacts on the environment.
The construction industry has long been labeled as non-sustainable due to the high carbon emissions and energy consumption (Lu et al., 2020). However, recent studies show that adopting state-of-the-art technologies in the construction sector and integrating those technologies with sustainable methodologies enable the construction industry to change the current situation of low energy efficiency (Santos et al., 2020). Building information modeling (BIM) could be an ideal technology to be developed in the future. BIM simulates the project in a digital representation environment. Also, BIM provides a collaborative environment, enabling users to monitor the asset throughout the whole life cycle.
Part of the relevant extended research is to conduct the whole life cycle analysis in a BIM environment. Life cycle assessment (LCA) is a way to evaluate the global warming potential, and life cycle costing (LCC) is a way to calculate the cost of each step. They quantify the assessments and enable the designers to improve the performance of the asset at the early stages of the project. However, traditional LCA and LCC analyses have limitations, which might lead to inaccurate prediction and evaluation (Michalski and Krueger, 2015). For example, quantity surveyors might not be able to provide an accurate bill of quantity, including double count or disregarding any material, leading to an inaccurate cost estimation (Semtrio, 2021). In this regard, integrating LCA and LCC into BIM solves the problem and reduces the time and effort required (Soust-Verdaguer et al., 2017). As BIM is a computer-aided technology, mistakes are avoided at a significant rate. In addition, BIM has a great potential for the railway projects, such as providing evidence for decisions, mastery of the implementation phases, and assistance for management (Borrmann et al., 2016; Kaewunruen et al., 2015, 2016, 2021).
This study focuses on novel light rail slabs (street and off-street slabs) in collaboration with Precast Advanced Track Ltd. (PCAT) as a case study to conduct the interactive BIM-based LCA and LCC analyses. Rail construction is generally time-consuming and labor-intensive. Especially for the light rail in cities, the construction also significantly impacts the daily living of the local resident. Now, PCAT kindly provides a perfect solution and technical assistance to solve the problems. It firstly completes high-quality precast slabs on the manufacturing plant and then delivers them to the site, where slabs are installed with the latest fast-track installation techniques (PCAT, 2016). This approach brings many benefits, such as a short time limit, but there is a concern about environmental impacts, which are mainly associated with the excessive use of cement (Kiani et al., 2008; Kaewunruen and Xu, 2018; Kaewunruen and Lian, 2019). Therefore, the results of LCA and LCC can provide clear guidance for design perfection in real time. In this assessment, only the maximum service life was considered, while excluding the exterior impacts such as motor vehicles and transportation of components from the scope of the study.
In order to conduct the assessment, Autodesk Revit embedded with Excel Spreadsheet has been used. According to the critical literature review, Revit is the most used BIM tool (Lu et al., 2020). It has a similar user interface to Autodesk CAD and allows users to input more information into the model, such as material types. After finishing the model, a bill of quantity can be created from it, and the format can be adjusted to be suitable for LCA and LCC calculations (interactive to BIM modifications in real time). Finally, the relationships between different parameters have been assigned in the spreadsheet. The methodology of LCC is similar to that of LCA. The values of the energy consumption and CO2 emissions were calculated via LCA, and the costs for different life cycles have been calculated and converted to the present value via LCC.
2 Literature Review
2.1 Building Information Modeling
The usage of BIM was revolutionary to the architecture-engineering-construction (ACE) industry. It quickly transformed the management of the whole lifecycle of an asset (Hardin and McCool, 2009). Figure 1 illustrates the two different construction processes: traditional and BIM (note: level of details: A: architecture, C: construction, E: engineering; M: materials; S: schedule). The earliest research on parametric modeling can be traced back to the 1980s, but the ACE industry did not use it until the mid-2000s (Azhar et al., 2012). In 2011, fully collaborative 3D BIMs were asked to be developed by the United Kingdom (Cabinet office, 2011). According to the survey conducted by Statisca (2020), 73% of the construction project in the United Kingdom used the BIM tool in 2020, two times more than in 2012.

FIGURE 1. Traditional (A) and BIM process (B) (adopted from Azhar et al. (2012)).
BIM is currently evolving toward an international standard. In ISO 19650, BIM is defined as a method using a shared digital representation of a built asset to conduct the processes of design, construction, and operation (BIM Wiki, 2021). Developing a successful BIM model requires the collaboration of different stakeholders at different stages. The more information the stakeholders share, the more accurate the decisions are made. Therefore, BIM is not just software to visualize the construction structure but also a process that enables all team members to collaborate more efficiently.
BS 1192 is an old version of the BIM standard in the United Kingdom. It was replaced by ISO 19650 in 2019. The new standard introduced more details and dimensions to the BIM development. However, due to the limited access to the new standard, BIM maturity levels (Figure 2) based on the old version are explained in the following section. BIM maturity levels illustrate the different levels of shared cooperation in a project. At level 0, the project’s construction is based on unmanaged 2D drawings, and the information exchange is mainly through paper and electronic messages. The entire processes lack a common standard as every stakeholder works based on their personal preference. At level 1, standardized structures and formats are widely accepted, and a common data environment (CDE), an online shared repository, is created. All data of the project are collected and managed here. At level 2, two new dimensions are introduced: 4D: time and 5D: cost. Also, collaborative working is stressed to a new level. The model with all project information is shared using a standard file type. Finally, level 3 is the ultimate objective for the construction industry and what the new standard primarily focuses on: obtaining a complete integration of data in a cloud-based environment. When BIM progresses to level 3, it becomes digital twins. Digital twins are a virtual model or digital replica of physical entities that span their lifecycle. It is updated from real-time data and uses simulation, machine learning, and reasoning to help decision-making (Maggie Mae Armstrong, 2020).
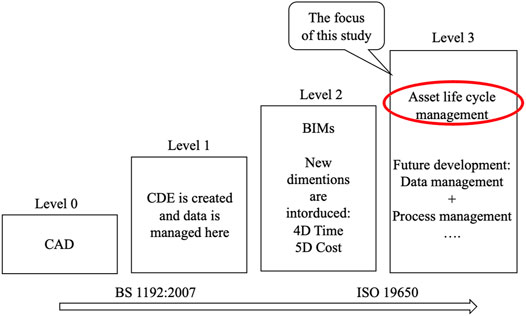
FIGURE 2. BIM maturity levels (adopted from Bew and Richards (2008)).
2.2 Life Cycle of Assets
Figure 3 shows an overview of PCAT light rail construction procedures. In the construction phase, all components are manufactured in the plant, transported to the site, then installed using fast slab track installation techniques. In the operation phase, there are two main tasks: maintenance and renewal. The components used in the light rail have a different service life. Each concrete slab has a maximum service life of 120 years, whereas rails and rail fastening may only have 30 years of economic life. Therefore, regular maintenance is needed throughout the whole life cycle to reach the maximum service life. Recyclable components such as rails and rail fastenings can be used for other purposes. This step is vital in reducing CO2 emissions and costs. Finally, non-recyclable components such as the concrete slabs are to be transported to the landfill or utilized as fragmented concrete.
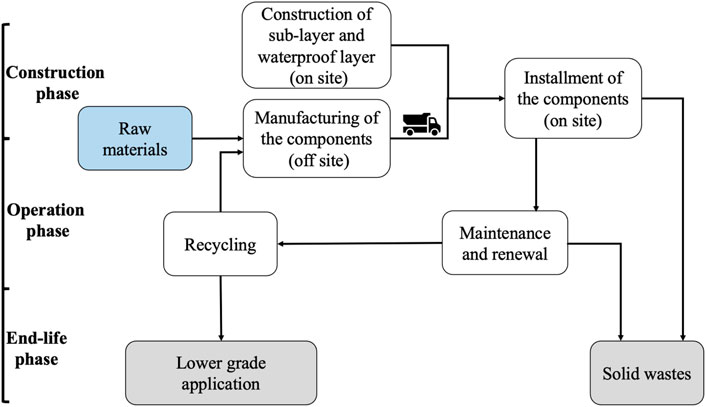
FIGURE 3. Life cycle stage (adopted from Kiani et al. (2008)).
2.3 Building Information Modeling-Based Life Cycle Assessment
Sustainable development in the construction sector depends on creating the lowest possible environmental impacts while promoting social and economic development (Díaz and Antón, 2014). LCA and BIM have a great potential to achieve that goal (The American Institute of Architects, 2010; Díaz and Antón, 2014). Currently, there are two main approaches to integrating LCA and BIM, which are connecting the bill of quantity (BOQ) from BIM with an LCA database to calculate the total environmental impacts, including the LCA information in BIM (Antón and Díaz, 2014; Díaz and Antón, 2014).
2.3.1 Life Cycle Assessment
According to the ISO 14040, LCA studies the environmental impacts throughout the whole life cycle of an asset, comprising acquisition, production, use, and disposal stages (Klöpffer and Grahl, 2014). It offers the ability to compare the products and strategic decisions regarding systemic inputs and outputs. Also, it can develop and incorporate end-of-life design strategies (Pryshlakivsky and Searcy, 2013).
LCA analyses can be divided into four steps: 1) define the goals and boundaries; 2) export BOQ and select LCI (life cycle inventory) database; 3) carry out environmental impact assessment; and 4) carry out analysis and conclude suggestions (Lee et al., 2018; Gardezi and Shafiq, 2019; Najjar et al., 2019).
2.3.2 Environmental Impact Indicators
Only the energy consumption and CO2 emission were focused on in this study. Other indicators such as solid wastes and renewable energy are not within the scope of this study.
2.3.2.1 Energy Consumption
In this study, energy consumption includes the manufacturing components and machines used throughout the construction, maintenance, renewal, and demolition phases. The data in the supplementary document (Supplementary Tables S1, S2) illustrate the average energy consumption used to manufacture different components and operate the equipment for main activities (including construction and maintenance phases).
2.3.2.2 Greenhouse Gas Emissions
The main types of gases causing global warming are carbon dioxide (CO2), methane (CH4), and nitrous oxide (N2O). CO2 and CH4 have a relatively low global warming potential (GWP), but the large human-caused increase accelerates the rate of the warming process (Center for climate and energy solutions, 2021). For easy calculation and comparison, the emissions of CH4 and N2O were converted into equivalent quantities as that of CO2. The coefficients of converting into CO2 are 21 and 310, respectively (Howard et al., 1999). More information can be found in the supplementary document (Supplementary Table S3 illustrates the quantitative relation between greenhouse gas and energy sources or raw materials; Supplementary Table S4 shows the fuel mixture percentages anticipated to be utilized in cement, steel, aggregate, and rubber manufacturing). For rubber manufacturing, all thermal energy was assumed to be from burning coal. “Other” energy sources include nuclear power, hydropower, and solar power.
2.3.3 Building Information Modeling Integration With Life Cycle Assessment
As mentioned above, there are two main approaches to integrating BIM and LCA. The first approach resorts to external software for analyses. Jrade and Jalaei (2013) used this approach to assess the environmental impacts of a building. A BIM model was firstly built and exported a quantity take-off from it, which is then connected with an external database that contains the environmental data. The second approach is to develop a build-in LCA tool, where a framework has been proposed by shin and Cho (2015). This interactive integration framework forms the digital twin of infrastructures aimed at real-time environmental load considerations.
Each approach has various advantages and disadvantages. The first approach has higher flexibility in the database, where the user can edit the information using external software. The LCA results are greatly influenced by the type of data: specific, average, or generic data (Santos et al., 2019). For example, products produced by different manufacturers may have different qualities and attributes. Therefore, results become more accurate as the materials are classified more thoroughly. However, its limitation is also evident. All its data are stored in a separate document, which requires specific software and a license to access it. This increases the difficulty of managing the documents and data. Also, every model change is to repeat the following assessment procedures: exporting the bill of quantity, connecting to the database, and calculating the result. For the second approach, the LCA tool is a part of the BIM software. All data are stored together. Any changes to the model are to be updated automatically. However, the second approach cannot run without a suitable working environment (Santos et al., 2019).
2.4 Building Information Modeling-Based Life Cycle Costing
In general, LCC is a process that compiles all the costs from an asset’s cradle to grave, including construction, operation, maintenance, and demolition stages. For infrastructure, the service life is usually very long. Thus, it is necessary to consider the time value of money. In the green book (HM Treasury, 2020), three different discount rates are proposed for the construction industry in the United Kingdom (as shown in Supplementary Table S5). The way of integrating BIM and LCC assessment is similar to integrating BIM and LCA. The difference is that the prices of the materials are to be applied to the quantities.
Currently, there are two widely used cost databases: RS Means and Spon. However, due to the limitation of accessing the databases, market prices found on the internet were utilized in this study.
2.5 Knowledge Gap
Traditional LCA and LCC analyses have been conducted for many construction sectors in published articles. In the railway construction sector, Kiani et al. conduct the LCA for three types of railway track beds, showing that the concrete slab track bed has the lowest environmental impacts and energy consumption throughout the whole life cycle. Based on the critical literature review of over 50 related articles in the open literature, LCC- and BIM-based analyses of light rail systems have never been addressed before. Thus, environmental and economic impacts were emphasized in this research. There is still one element that has not been explored too much in the railway construction, namely, that of solid wastes. According to a study conducted by several researchers, construction and demolition waste bring severe environmental pollution (Yuan and Shen, 2011; Ajayi and Oyedele, 2017; Bakshan et al., 2017; Yuan, 2017; Jin et al., 2019). Therefore, it is necessary to provide a complete database for the environmental assessments.
3 Methodology
Both environmental and economic impacts of the PCAT slabs are the main focus of this study. The study aims to develop an interactive BIM with multiple dimensions of added-value information, creating a paradigm digital twin framework for light rail track slab systems. This digital twin can perform real-time lifecycle assessments (for cost, carbon emission, and energy consumption), which can be updated by new maintenance and repair activities in real time. This digital twin framework will help the rail industry become more efficient and sustainable across all stakeholders. The core software for the BIM-based assessment is Revit 2021. CO2 emissions and the whole life cycle costings were obtained using Excel Spreadsheet. The BOQ from Revit can be imported to the Spreadsheet, where different calculation methods can be applied.
3.1 Revit Modeling Approach
According to the critical literature review, Revit is used the most in BIM-relevant articles (Lu et al., 2020). It has a similar interface and operation style to AutoCAD. Thus, it can be learned in a short period of time. The difference is that Revit is a design and documentation software that works with all phases and disciplines of a construction project (Autodesk, 2020).
A light rail system has many components comprising rails, rail fastenings, and concrete slabs. Therefore, “families” were firstly created for each component. Before drawing the models, system default units were examined and adjusted, ensuring they were the same as they are on the technical drawings. The drawing processes were as follows:
• Firstly, a reference layer was selected, and a cross-section of the components was drawn on it.
• Then, the lengths of the components are assigned by setting an “extrusion start” and “extrusion end.”
• Finally, a suitable material type is assigned to each component.
Once the “families” were created, they were imported and assembled in a “project” file.
Two models were built for this study, which were the basis of the further assessment works. Raw data regarding the material types and the volumes of the components were created via “new schedule/quantities” in Revit.
3.2 Life Cycle Assessment Methodological Approach
The ISO 14044: 2006 guidelines on LCA methodologies were followed. There are four steps to conducting the LCA.
3.2.1 Goals and Scope Definition
Determining the assessment goal and scope is vital as it decides the way of evaluation. First, there are two types of analysis: streamlined and complete LCA. The streamlined analysis only covers the manufacture stage of products. The complete analysis includes not only the manufacture stage but also the transportation, construction, operation, and demolition stage. Moreover, there are many environmental impact indicators, including acidification potential (AP) and eutrophication potential (EP). Thus, assessment results are only helpful to the stakeholder when the indicators are chosen correctly. Third, assumptions need to be made based on previous project experience and site surveys. As for the construction project, not all the information is available at the early stage of the design. Therefore, a complete LCA analysis was conducted in this study, and carbon emission and energy consumption could thus be evaluated. The functional unit of the case study was 60 m.
3.2.2 Inventory Analysis
Exporting the BOQ from BIM and choosing an LCI database were essential at this stage as BOQ in Revit does not classify the component with its material type. Thus, the raw data from BIM shall be adjusted before being used for analysis. The next step was to choose a suitable database based on the region and industry. For example, Athena’s database is only suitable for the construction industries in Canada and North America, and Eco-Invent is an inventory database suitable for Swiss and Western Europe. Some authors also use data from published papers relevant to their research. This study collected data from Kiani et al. (2008) study and some second-hand resources.
3.2.3 Impact Assessment
The calculations determining the environmental impact indicators are as follows. The environmental accounting was conducted using Excel Spreadsheet, which was linked with Revit. The mass of each material was multiplied by the unit weight and the quantity before having the results applied to Eq. 1 to determine the total energy consumption. The unit weight of some of the materials used in this study is shown in Supplementary Table S6:
For the GHG calculation, two methods were used. One was based on the CO2 emission of different energy sources and the mixture percentage of the fuel for manufacturing materials, as shown in Eq. 2. Coal and tires used this method. Another method multiplied the value of CO2 emissions with unit weight by the mass of the components, as shown in Eq. 3. This method was used mainly for the calculation of bitumen and synthetic fibers in this study:
CO2 emissions from the equipment and the machines were also considered. The construction speed and fuel consumption of each component are shown in Supplementary Table S7. Different machines are to be used in different phases, as shown in Supplementary Table S8. The equipment used in the demolition phase was not specified, but the fuel consumption and construction speed were assumed to be the same as rail laying machines.
3.2.4 Result and Analysis
The tasks done at this stage were as follows:
• Materials are compared to determine which has the most significant environmental impact throughout its lifecycle.
• The stage that emits the most CO2 is determined.
• Parametric studies were conducted to determine which element is more sensitive to the change.
• Suggestions for the project were given.
3.3 Life Cycle Costing Methodological Approach
The assessment of LCC followed the ISO 15686-5:2017 guidelines. The steps were similar to the LCA methodologies, with the only difference of the cost as the economic indicator. LCC is used to estimate all relevant costs in a whole life cycle, including the costs for construction, maintenance, renewal, and demolition.
The prices of the energy and materials were collected from the internet and only represent the current market prices. The LCA Excel Spreadsheets developed by the author can automatically form the new annual and the total costs by changing the prices of the materials in real time.
The cost of each year was calculated using Eq. 4, and any income from recycling materials was deducted. Labor and equipment lease costs were excluded from the calculation due to the lack of valid and reliable data:
In order to make a comparison, the cost for each year needs to be converted into the present value (PV) by using Eq. 5. The discount rate was selected differently according to the number of years. The reason for using a discount rate is that a certain amount of money in the present is more valuable than money in the future. Thus, the costs of the products over different periods of time could be compared:
The total cost of 120 years was calculated by integrating Eq. 4 and Eq. 5, as shown in Eq. 6. Cn is the cost of a single year and d is the discount rate:
4 Case Selection and Data Description
4.1 Precast Advanced Track Slab Description
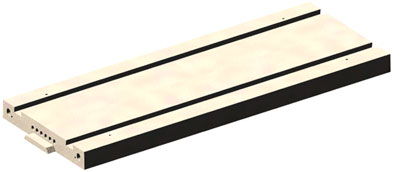
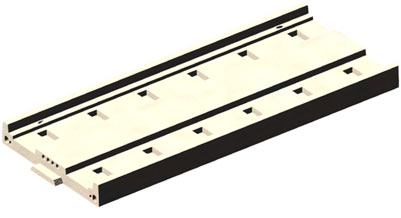
PCAT is a new concept of railway construction that compensates for the drawbacks of the traditional way of construction. The track slab innovation has been developed to facilitate faster and greener construction and maintenance. It provides a much more time-saving and cost-effective solution. However, the interactive and detailed LCAs have not been fully established for the innovative slab systems. This study has thus been in collaboration with PCAT to establish a digital twin that can interactively assess LCAs for PCAT slab systems. Currently, there are two available forms of PCAT light rail slab: street slab and off-street slab. Figures 4, 5 show the models of the two forms of slab built using Revit. Both slabs feature drainage ducts and service ducts. The jointing method is also unique. High-strength steel cables are used to connect two slabs. Thus, slabs can be easily removed or replaced if required. The slabs are made of high-strength macro synthetic fiber reinforced concrete, so they have a maximum design life of 120 years (PCAT, 2016).
4.2 Specification for Main Components
Light rails usually have the following components: concrete slab, rails, rail fastenings, and rail rubber pad. They all comprised within the assessment. The service life of each component is shown in Supplementary Table S9. In this case, the maximum service life for each component is considered. A concrete slab has the most extended service life of 120 years (PCAT, 2016). Therefore, during the whole service life of the concrete slab track, other components are to be renewed three times.
4.2.1 On-Street Light Rail
4.2.1.1 Concrete Slab
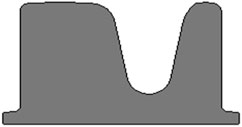
Each slab has a length of 6 m and a width of 2.25 m. The cross-sectional diagram is shown in Figure 6. Six circular holes, each with a diameter of 75 mm in the middle of the slab, are cable ducts. Under the ducts is a matching conclusion. Two big circular holes, each with a diameter of 110 mm on both sides, are the drainage ducts. The concrete material used by the slab has a strength of C50/60, and the synthetic fibers are mixed (about 0.1% of the slab volume). The volume of each concrete slab is 3.33 m3. According to the case study by Kiani et al. (2008), the percentage of aggregate and cement in the slab is 80% and 20%, respectively.
4.2.1.2 Rail
Figure 7 shows the cross-sectional diagram of the rail for street slabs. Each rail has a length of 20 m and is made of steel. The volume of each steel rail is 0.16 m3. In order to fix the rails, rail fastenings are installed with an interval of 500 mm in between each set. They are made of spring steel material.
4.2.2 Off-Street Light Rail
4.2.2.1 Concrete Slab
The slab is 6 m long and 2.5 m wide. Its volume is 2.89 m3. Figure 8 shows the off-street slab cross-sectional diagram. Material usages and other specifications are the same as the on-street slab.
4.2.2.2 Rails and Rail Fastenings
Figure 9A shows the rail profile for an off-street slab with a length of 20 m and a volume of 0.16 m3. Figure 9B illustrates a set of the simplified rail fastening model; it is mainly made of steel and placed on the on-street slab with an interval of 1 m. As the assessment of this part was mainly based on assumptions, the results might be inaccurate.
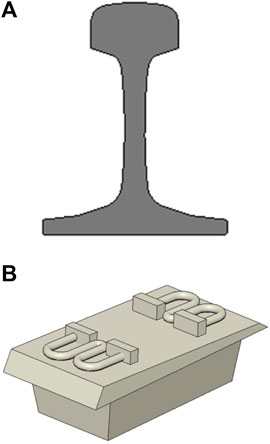
FIGURE 9. Rail and fastening components for off-street slabs. (A) Off-street rail cross-section. (B) Rail fastening for the on-street system.
4.3 Other Details
4.3.1 Subbase
The subbase is structural support to the concrete slab, mainly made of aggregate and cement. Their contents in the ratio of subbase are 0.88:0.12 (Kiani et al., 2008). The depth of the subbase is either 150 or 210 mm (Govan et al., 2015). In this regard, a 150 mm subbase is used to assess street and off-street slabs. Assume the width of the subbase is the same as that of the slab. After tamping several times, a bituminous waterproof layer with a thickness of 5 mm was paved above it. The volume of the subbase was manually calculated in the Excel Spreadsheet.
4.3.2 Rail Track Maintenance
Application of grease lubrication onto the gauge corner surface of the curved rails (high rails) is needed every year. This can decrease the wear rate and rolling contact fatigue thresholds. The amount of grease used for rail lubrication varies between 0.7 and 2.5 kg/km per year (Reddy et al., 2007). In this study, 2.5 kg/km has been adopted in the calculation for both light rail systems.
4.4 Building Information Modeling Models for Light Rail
Figure 10 shows the on-street light rail system and off-street light rail system. Street lights, motorways, and pavements are only decorations and not assessed.
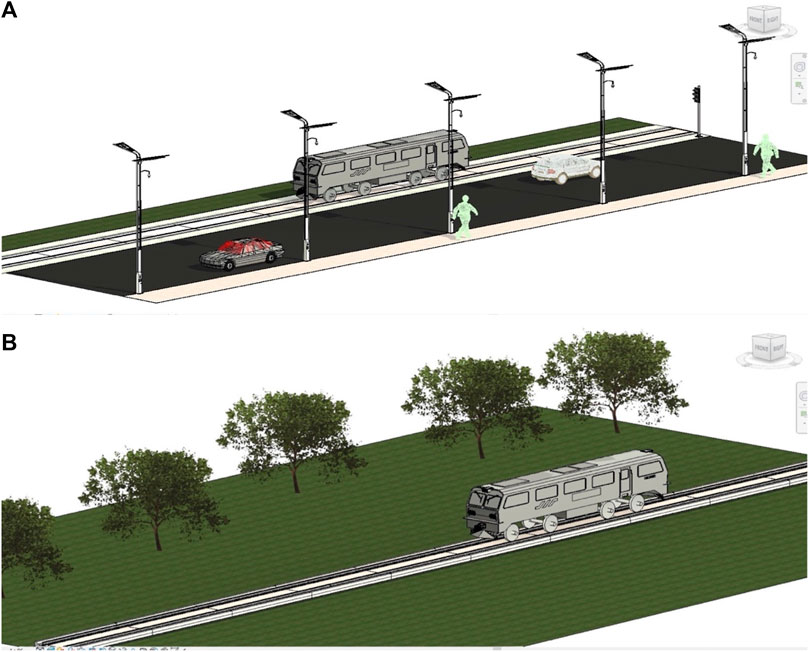
FIGURE 10. BIM models of on-street and off-street light rail systems. (A) On-street light rail 3D. (B) Off-street light rail 3D.
5 Result and Discussion
5.1 Result Analysis
Supplementary Tables S10, S11 show the detailed energy consumption (MJ) and CO2 emission (g) of the PCAT slabs: off-street slab and on-street slab, respectively. These results are based on the interactive determinations using the digital twins of the PCAT slab systems. Note that the calculations are based on the specific design of the components. The result shows that the carbon emission and energy consumption of the PCAT slabs are comparatively lower than the track slabs designed for high-speed rail networks (Kaewunruen et al., 2020).
5.1.1 Comparison of Life Cycle Assessment Results
5.1.1.1 Energy Consumption
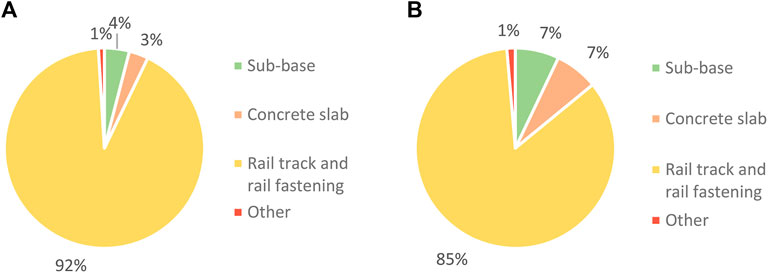
Figure 11 illustrates the energy consumption of each component for light rail construction during the whole life cycle. Manufacturing concrete slabs consumes less energy, accounting for 3% (off-street) and 7% (on-street), respectively. Moreover, energy consumption only occurs in the construction period. Steel products such as rails and rail fastenings consume a large portion of the energy, exceeding 85% of the total energy consumption. There are two possible reasons for the high energy consumption: firstly, the short service life, where throughout the whole life cycle, these two components are to be replaced three times, and, secondly, inefficient production process.
5.1.1.2 Carbon Emission
Figure 12 demonstrates the CO2 emissions for two light rail systems. Carbon emissions of concrete slabs account for less than 20% of the total emissions. Also, it can be drawn from the figure that grouting carries significant weight in terms of carbon emissions. It contributes to half of CO2 emissions for street types. In contrast, there is no usage of grout in the off-street type. Therefore, the rails and rail fastenings account for the most significant portion of the total emission.
5.1.2 Comparison of Life Cycle Costing Results
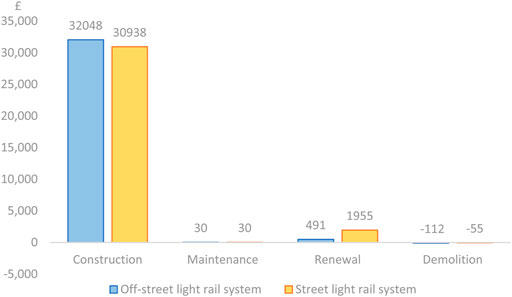
Figure 13 illustrates the life cycle costs for two light rail systems. More than 90% of the costs occurred in the construction phase for both cases. During the whole life cycle, the off-street type costs £540 per meter, and the street type costs £547 per meter, including the prices of concrete slabs, £50.3 and £57.9, respectively. In the demolition phase, recycling steel products bring additional income.
Figure 14 illustrates the cost percentage for each component in the construction phase. The bituminous waterproof layer is the most expensive structure, accounting for more than 70% of the initial cost. The cost of concrete slabs is relatively small. For the off-street light rail, the sum of diesel oil and grease lubrication costs account for 0.3% of the initial cost, which is too small to be shown in the pie chart.
5.2 Parametric Analysis
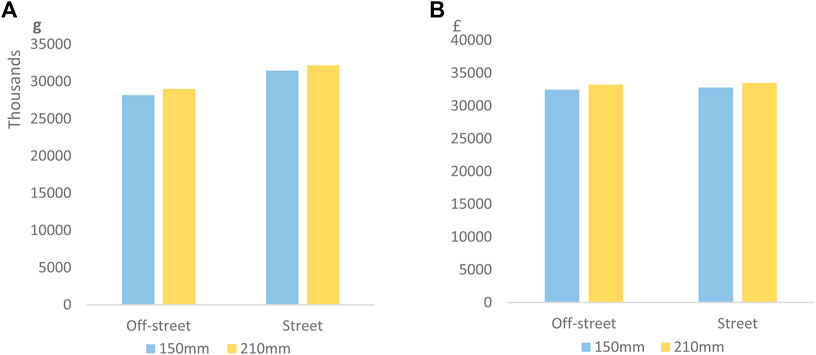
A parametric analysis was conducted to quantify the extent to which design change could lower the environmental impact throughout the whole life cycle. Rail fastenings used for street-type light rail and subbase were selected for analysis. The current design sees a rail fastening installed every 500 mm. If the interval is increased by 20% to 600 mm, the total carbon emissions and costs will be decreased by 0.5% and 0.02%, respectively. Thus, the changes are negligible. The same conclusion can also be drawn from the subbase. Figure 15 shows the results of increasing the thickness of the subbase to 210 mm, which is the maximum thickness of the subbase demonstrated in the PCAT light rail design.
5.3 Discussion
In light rail construction, the concrete slab has minor impacts on every aspect because of the long service life and fewer maintenance works. In contrast, much attention should be put on the grouts and bituminous waterproof layer, as they carry a significant impact in terms of carbon emissions and costs. Also, according to the parametric study, these two elements are sensitive to changes in the parameter. Changing the design or replacing them with low cost or low-environmental-impact materials can improve the light rail system’s whole life cycle performance. Rails and rail fastenings emit a large amount of CO2, in which 87% of the decrease could be accomplished by recycling. However, the steel manufacturing process requires a large amount of energy, mainly because the equipment used in this process has low energy efficiency.
Therefore, slabs using less grout while being able to prevent water from penetrating into the foundation through gaps between the concrete slabs shall be designed. Also, it is better to procure steel products from manufacturers with the latest technologies as energy efficiency is higher.
6 Conclusion
This study used digital twin technology to evaluate the PCAT concrete slab track systems in environmental and economic aspects. The core of this assessment is a complete bill of quantities of material, whereas the traditional way of creating BOQ heavily relies on quantity surveyors, which might miscount material qualities, leading to inaccurate results. This problem could be solved by interactive BIM. To support BIM-based LCA and LCC, Revit 2021 and Excel Spreadsheet have been utilized. First, light rail system models were built, and BOQs were exported from them. Then, a Spreadsheet was used to calculate the impact indicators.
The results reveal that PCAT concrete slabs have a minor contribution to reducing greenhouse gas emissions and costs. Steel products such as rails and rail fastenings have relatively minor impacts primarily because they are recyclable materials. In contrast, unrecyclable components such as rubber pads, bituminous layer, and grout not only have a significant impact on the environment but also are expensive. Hence, the method of minimizing the usage of unrecyclable materials is to be considered at the design stage for concrete slabs. Future work will investigate railway demolition wastes to fully reflect the impacts on the environment.
Data Availability Statement
The original contributions presented in the study are included in the article/Supplementary Material. Further inquiries can be directed to the corresponding author.
Author Contributions
Conceptualization: AB, JS, SK, and JH. Investigation: AB, JS, SK, and JH. Data Analysis: AB, JS, and SK. Visualization and validation: AB and JS. Funding: SK. Supervision: SK. Writing and review: AB, JS, SK, and JH.
Funding
The authors are grateful to the European Commission for the financial sponsorship of the H2020-RISE Project no. 691135 “RISEN: Rail Infrastructure Systems Engineering Network,” which enables a global research network that tackles the grand challenge in railway infrastructure resilience and advanced sensing in extreme environments (www.risen2rail.eu). In addition, this project was partially supported by the European Commission’s Shift2Rail, H2020-S2R Project no. 730849 “S-Code: Switch and Crossing Optimal Design and Evaluation.” The APC has been sponsored by the University of Birmingham Library’s Open Access Fund.
Conflict of Interest
JH was employed by the company Precast Advanced Track (PCAT) Ltd.
The remaining authors declare that the research was conducted in the absence of any commercial or financial relationships that could be construed as a potential conflict of interest.
Publisher’s Note
All claims expressed in this article are solely those of the authors and do not necessarily represent those of their affiliated organizations or those of the publisher, the editors, and the reviewers. Any product that may be evaluated in this article, or claim that may be made by its manufacturer, is not guaranteed or endorsed by the publisher.
Supplementary Material
The Supplementary Material for this article can be found online at: https://www.frontiersin.org/articles/10.3389/fbuil.2022.796388/full#supplementary-material
References
Adisa, A., Amienyo, D., and Cuéllar Franca, R. M. (2013). Carbon Footprints of Recycled Solvents Study for the European Solvent Recycler Group (ESRG). Available at: www.esrg-online.eu.
Ajayi, S. O., and Oyedele, L. O. (2017). Policy Imperatives for Diverting Construction Waste from Landfill: Experts' Recommendations for UK Policy Expansion. J. Clean. Prod. 147, 57–65. doi:10.1016/j.jclepro.2017.01.075
Antón, L. Á., and Díaz, J. (2014). “Integration of Life Cycle Assessment in a BIM Environment,” in Procedia Engineering (Elsevier), 85, 26–32. doi:10.1016/j.proeng.2014.10.525
Autodesk (2020). What’s the Difference between Revit and AutoCAD? Available at: https://www.autodesk.com/solutions/revit-vs-autocad (Accessed: July 7, 2021).
Azhar, S., Khalfan, M., and Maqsood, T. (2012). Building Information Modeling (BIM): Now and beyond.
Bakshan, A., Srour, I., Chehab, G., El-Fadel, M., and Karaziwan, J. (2017). Behavioral Determinants towards Enhancing Construction Waste Management: A Bayesian Network Analysis. Resour. Conservation Recycl. 117, 274–284. doi:10.1016/j.resconrec.2016.10.006
BIM Wiki (2021). Building Information Modelling BIM. Available at: https://www.designingbuildings.co.uk/wiki/Building_information_modelling_BIM (Accessed: June 23, 2021).
Borrmann, A., Hochmuth, M., and König, M. (2016). Germany’s Governmental BIM Initiative-Assessing the Performance of the BIM Pilot Projects.
Building Research Establishment (1994). Thermal Insulation: Avoiding Risks - A Good Practice Guide to Supporting Building. 2nd ed. London, United Kingdom: Stationery Office Books.
Cabinet office (2011). Government Construction Strategy. Available at: https://assets.publishing.service.gov.uk/government/uploads/system/uploads/attachment_data/file/61152/Government-Construction-Strategy_0.pdf (Accessed: June 22, 2021).
Center for climate and energy solutions (2021). Main Greenhouse Gases. Available at: https://www.c2es.org/content/main-greenhouse-gases/(Accessed: July 6, 2021).
Daily civil (2021). Unit Weight of Building Materials. Available at: https://dailycivil.com/unit-weight-building-materials/(Accessed: July 7, 2021).
Department of alternative energy development and efficiency (2007). Disseminated Document Project on Studying of Energy Efficiency Index in Rubber Industry Contents Project on Studying of Energy Efficiency Index in Rubber Industry.
Department of the environment, transport and the regions (2000). Energy Use in the Minerals Industries of Great. London: Britain—Best Practise Programme.
Díaz, J., and Antón, L. Á. (2014). Sustainable Construction Approach through Integration of LCA and BIM Tools.
Epa, U. and for Corporate Climate Leadership, C. (2006). Emission Factors for Greenhouse Gas Inventories. Available at: http://www.epa.gov/ghgreporting/reporters/subpart/c.html.
Gardezi, S. S. S., and Shafiq, N. (2019). Operational Carbon Footprint Prediction Model for Conventional Tropical Housing: a Malaysian Prospective. Int. J. Environ. Sci. Technol. 16 (12), 7817–7826. doi:10.1007/s13762-019-02371-x
Govan, C., Brough, M., and Director, O. (2015). Pre-Cast Advanced Track-Avoidance of Bridge Reconstruction-PCAT Assessment Report.
Hammond, G., Jones, C., and Lowrie, F. (2011). Embodied Carbon : The Inventory of Carbon and Energy (ICE). London, United Kingdom: BSRIAIA.
Hammond, G. P., and Jones, C. I. (2008). Embodied Energy and Carbon in Construction Materials. Proc. Institution Civ. Eng. - Energy 161 (2), 87–98. doi:10.1680/ener.2008.161.2.87
Hardin, B., and McCool, D. (2009). BIM and Construction Management: Proven Tools, Methods, and Workflows. 2nd ed. Indianapolis: John Wiley & Sons.
Howard, N., Edwards, S., and Anderson, J. (1999). BRE Methodology for Environmental Profiles of Construction Materials, Components and Buildings. London, United Kingdom: BREPress.
International iron and steel institute (2002). IISI Life Cycle Inventory Study for Steel Industry Products; Worldwide LCI Database for Steel Industry Products. Brussels, Belgium: IISI.
Jin, R., Yuan, H., and Chen, Q. (2019). Science Mapping Approach to Assisting the Review of Construction and Demolition Waste Management Research Published between 2009 and 2018. Resour. Conservation Recycl. 140, 175–188. doi:10.1016/j.resconrec.2018.09.029
Jrade, A., and Jalaei, F. (2013). Integrating Building Information Modelling with Sustainability to Design Building Projects at the Conceptual Stage. Build. Simul. 6, 429–444. doi:10.1007/s12273-013-0120-0
Kaewunruen, S., and Lian, Q. (2019). Digital Twin Aided Sustainability-Based Lifecycle Management for Railway Turnout Systems. J. Clean. Prod. 228, 1537–1551. doi:10.1016/j.jclepro.2019.04.156
Kaewunruen, S., Sresakoolchai, J., Ma, W., and Phil-Ebosie, O. (2021). Digital Twin Aided Vulnerability Assessment and Risk-Based Maintenance Planning of Bridge Infrastructures Exposed to Extreme Conditions. Sustainability 13, 2051. doi:10.3390/su13042051
Kaewunruen, S., Sresakoolchai, J., and Peng, J. (2020). Life Cycle Cost, Energy and Carbon Assessments of Beijing-Shanghai High-Speed Railway. Sustainability 12 (1), 206. doi:10.3390/su12062436
Kaewunruen, S., Sussman, J. M., and Einstein, H. H. (2015). Strategic Framework to Achieve Carbon-Efficient Construction and Maintenance of Railway Infrastructure Systems. Front. Environ. Sci. 3, 6. doi:10.3389/fenvs.2015.00006
Kaewunruen, S., Sussman, J. M., and Matsumoto, A. (2016). Grand Challenges in Transportation and Transit Systems. Front. Built Environ. 2, 4. doi:10.3389/fbuil.2016.00004
Kaewunruen, S., and Xu, N. (2018). Digital Twin for Sustainability Evaluation of Railway Station Buildings. Front. Built Environ. 4, 77. doi:10.3389/fbuil.2018.00077
Kalliala, E. M., and Nousiainen., P. (1999). Environmental Profile of Cotton and Polyester–Cotton Fabrics. Autex Res. J. 1, 8–20.
Kiani, M., Parry, T., and Ceney, H. (2008). Environmental Life-Cycle Assessment of Railway Track Beds. Proc. Institution Civ. Eng. - Eng. Sustain. 161 (2), 135–142. doi:10.1680/ensu.2008.161.2.135
Klöpffer, W., and Grahl, B. (2014). Life Cycle Assessment (LCA): A Guide to Best Practice. John Wiley & Sons.
Lawson, B. (1996). Building Materials—Energy and the Environment: Towards Ecologically Sustainable Development. A.C.T: Royal Australian Institute of Architects, Red Hill.
Lee, J., Tae, S., and Kim, R. (2018). A Study on the Analysis of CO2 Emissions of Apartment Housing in the Construction Process. Sustainability 10 (2), 365. doi:10.3390/su10020365
Lu, K., Jiang, X., Yu, J., Tam, V. W. Y., and Skitmore, M. (2021). Integration of Life Cycle Assessment and Life Cycle Cost Using Building Information Modeling: A Critical Review. J. Clean. Prod. 285, 125438. doi:10.1016/j.jclepro.2020.125438
Maggie Mae Armstrong (2020). Cheat Sheet: What Is Digital Twin? Available at: https://www.ibm.com/blogs/internet-of-things/iot-cheat-sheet-digital-twin/(Accessed: August 19, 2021).
Mantoam, E. J., Romanelli, T. L., and Gimenez, L. M. (2017). Energy Demand and Greenhouse Gases Emissions in the Life Cycle of Coffee Harvesters. Chem. Eng. Trans. 58, 175–180. doi:10.3303/CET1758030
Michalski, W., and Krueger, R. (2015). Critiques of Life Cycle Assessment. Available at: http://www.wpi.edu/Academics/Projects.
Muthu, S. S. (2020). “Introduction to Sustainability and the Textile Supply Chain and its Environmental Impact,” in Assessing the Environmental Impact of Textiles and the Clothing Supply Chain (Elsevier), 1–32. doi:10.1016/b978-0-12-819783-7.00001-6
Najjar, M. K., Figueiredo, K., Evangelista, A. C. J., Hammad, A. W. A., Tam, V. W. Y., and Haddad, A. (2019). Life Cycle Assessment Methodology Integrated with BIM as a Decision-Making Tool at Early-Stages of Building Design. Int. J. Constr. Manag. 22, 541–555. doi:10.1080/15623599.2019.1637098
NSC (2010). The Carbon Footprint of Steel. Available at: https://www.newsteelconstruction.com/wp/the-carbon-footprint-of-steel/(Accessed: July 12, 2021).
Periodic Table (2021). Carbon Fiber – Density – Strength – Melting Point. Available at: https://material-properties.org/carbon-fiber-density-strength-melting-point/(Accessed: July 7, 2021).
Pryshlakivsky, J., and Searcy, C. (2013). Fifteen Years of ISO 14040: A Review. J. Clean. Prod. 57, 115–123. doi:10.1016/j.jclepro.2013.05.038
Reddy, V., Chattopadhyay, G., Larsson-Kråik, P.-O., and Hargreaves, D. J. (2007). Modelling and Analysis of Rail Maintenance Cost. Int. J. Prod. Econ. 105 (2), 475–482. doi:10.1016/j.ijpe.2006.03.008
Santos, R., Costa, A. A., Silvestre, J. D., and Pyl, L. (2019). Integration of LCA and LCC Analysis within a BIM-Based Environment. Automation Constr. 103, 127–149. doi:10.1016/j.autcon.2019.02.011
Santos, R., Costa, A. A., Silvestre, J. D., Vandenbergh, T., and Pyl, L. (2020). BIM-Based Life Cycle Assessment and Life Cycle Costing of an Office Building in Western Europe. Build. Environ. 169, 106568. doi:10.1016/j.buildenv.2019.106568
Semtrio (2021). Advantages and Disadvantages of Life Cycle Assessment (LCA). Available at: https://www.semtrio.com/advantages-and-disadvantages-of-life-cycle-assessment#:∼:text=The%20main%20problem%20when%20it%20comes%20to%20life,data%20that%20will%20help%20you%20operate%20with%20it (Accessed: June 21, 2021).
Shin, Y.-s., and Cho, K. (20152015). BIM Application to Select Appropriate Design Alternative with Consideration of LCA and LCCA. Math. Problems Eng. 2015, 1–14. doi:10.1155/2015/281640
Soust-Verdaguer, B., Llatas, C., and García-Martínez, A. (2017). Critical Review of Bim-Based LCA Method to Buildings. Energy Build. 136, 110–120. doi:10.1016/j.enbuild.2016.12.009
Statisca (2020). BIM Adoption Rate in Construction Industry in the United Kingdom 2011-2020. Available at: https://www.statista.com/statistics/1019177/construction-industry-bim-adoption-rate-uk/(Accessed: June 22, 2021).
The American Institute of Architects (2010). AIA Guide to Building Life Cycle Assessment in Practice Authorship and Acknowledgements A Guide to Life Cycle Assessment of Buildings 2. Available at: https://www.brikbase.org/sites/default/files/aiab082942.pdf (Accessed: June 25, 2021).
Yuan, H. (2017). Barriers and Countermeasures for Managing Construction and Demolition Waste: A Case of Shenzhen in China. J. Clean. Prod. 157, 84–93. doi:10.1016/j.jclepro.2017.04.137
Keywords: digital twin, BIM, life cycle assessment, life cycle costing, PCAT light rail system
Citation: Borjigin AO, Sresakoolchai J, Kaewunruen S and Hammond J (2022) Digital Twin Aided Sustainability Assessment of Modern Light Rail Infrastructures. Front. Built Environ. 8:796388. doi: 10.3389/fbuil.2022.796388
Received: 16 October 2021; Accepted: 06 June 2022;
Published: 11 July 2022.
Edited by:
Ampol Karoonsoontawong, King Mongkut’s University of Technology Thonburi, ThailandReviewed by:
Ting Li, Southwest Jiaotong University, ChinaDuangdao Watthanaklang, Nakhon Ratchasima Rajabhat University, Thailand
Copyright © 2022 Borjigin, Sresakoolchai, Kaewunruen and Hammond. This is an open-access article distributed under the terms of the Creative Commons Attribution License (CC BY). The use, distribution or reproduction in other forums is permitted, provided the original author(s) and the copyright owner(s) are credited and that the original publication in this journal is cited, in accordance with accepted academic practice. No use, distribution or reproduction is permitted which does not comply with these terms.
*Correspondence: Sakdirat Kaewunruen, cy5rYWV3dW5ydWVuQGJoYW0uYWMudWs=
 Aorigele Orgil Borjigin
 Jessada Sresakoolchai1
 Sakdirat Kaewunruen