 Diana Contreras
 Sean Wilkinson
 Yasemin Didem Aktas
 Laure Fallou
 Rémy Bossu
 Matthieu Landès
- 1School of Earth and Environmental Sciences, College of Physical Sciences and Engineering, Cardiff University, Cardiff, United Kingdom
- 2School of Engineering, Faculty of Science, Agriculture and Engineering, Newcastle University, Newcastle Upon Tyne, United Kingdom
- 3Department of Civil, Environmental and Geomatic Engineering (CEGE), University College of London (UCL), London, United Kingdom
- 4EMSC (Euro-Mediterranean Seismological Centre), Arpajon, France
- 5CEA, DAM, DIF, Arpajon, France
After an earthquake, it is necessary to understand its impact to provide relief and plan recovery. Social media (SM) and crowdsourcing platforms have recently become valuable tools for quickly collecting large amounts of first-hand data after a disaster. Earthquake-related studies propose using data mining and natural language processing (NLP) for damage detection and emergency response assessment. Using tex-data provided by the Euro-Mediterranean Seismological Centre (EMSC) collected through the LastQuake app for the Aegean Earthquake, we undertake a sentiment and topic analysis according to the intensities reported by their users in the Modified Mercalli Intensity (MMI) scale. There were collected 2,518 comments, reporting intensities from I to X being the most frequent intensity reported III. We use supervised classification according to a rule-set defined by authors and a two-tailed Pearson correlation to find statistical relationships between intensities reported in the MMI by LastQuake app users, polarities, and topics addressed in their comments. The most frequent word among comments was: “Felt.” The sentiment analysis (SA) indicates that the positive polarity prevails in the comments associated with the lowest intensities reported: (I-II), while the negative polarity in the comments is associated with higher intensities (III–VIII and X). The correlation analysis identifies a negative correlation between the increase in the reported MMI intensity and the comments with positive polarity. The most addressed topic in the comments from LastQuake app users was intensity, followed by seismic information, solidarity messages, emergency response, unrelated topics, building damages, tsunami effects, preparedness, and geotechnical effects. Intensities reported in the MMI are significantly and negatively correlated with the number of topics addressed in comments. Positive polarity decreases with the soar in the reported intensity in MMI demonstrated the validity of our first hypothesis, despite not finding a correlation with negative polarity. Instead, we could not prove that building damage, geotechnical effects, lifelines affected, and tsunami effects were topis addressed only in comments reporting the highest intensities in the MMI.
Introduction
After an earthquake, it is necessary to understand its impact to provide relief and plan recovery. In the past, conventional recording and measurement tools, such as photography, note-taking, and surveying, were used by reconnaissance investigators to collect data and document field observations. Nowadays, the availability of state-of-the-art instrumentation, mobile data collection technologies, social media (SM), crowdsourcing platforms, training, and field support services has increased and eased the ability to capture perishable data during post-disaster phases (Wartman et al., 2020; Contreras et al., 2021a; Contreras et al., 2021c).
Recently, social media (SM) and crowdsourcing platforms such as Did You Feel It? (DYFI) (Kropivnitskaya et al., 2017; Bossu et al., 2020; Quitoriano & Wald, 2020), Earthquake Network (Fallou et al., 2020; Finazzi, 2020), LastQuake App (Bossu et al., 2018; Bossu et al., 2020; Fallou et al., 2020; Finazzi, 2020; Quitoriano & Wald, 2020), MyShake Project (Bossu et al., 2020; Finazzi, 2020; Kong et al., 2020), Raspberry Shake (Calais et al., 2020; Fallou et al., 2020; Subedi et al., 2020), QuickDeform (Zhao et al., 2019) and the Taiwan scientific earthquake reporting (TSER) system (Liang et al., 2019) have become valuable tools for quickly collecting large amounts of first-hand data after an earthquake. Social media and crowdsourcing platforms collect first-hand data, observations, sentiments, and perspectives (Yan et al., 2020). Image and text data are contained in photos, videos, and comments posted in SM Correlation between the number of tweets and the intensity of an earthquake was observed for the first time in 2010. Later, Mendoza et al. (2019) confirmed that high-intensity earthquakes produce more Mercalli reports and, therefore, consider SM a valuable source of spatial information for the rapid estimation of earthquake damages. The recent increase in the number of crowdsourcing platforms used to source earthquake reconnaissance data demonstrates that it is likely to become an increasingly fundamental data source (Contreras et al., 2021d).
Earthquake-related studies propose to use data mining and natural language processing (NLP) for damage detection and assessment of earthquakes (Avvenuti et al., 2014). These studies apply classifier methods for earthquake detection (Sakaki et al., 2010; Robinson et al., 2013). They propose a probabilistic spatiotemporal model for reporting earthquake-related events (Sakaki et al., 2013). These research studies also use a qualitative approach to analyze population behavior after an earthquake (Miyabe et al., 2012). Some other earthquake-related studies apply keyword-level analysis to track social attitudes (Doan et al., 2011) and analyze the dynamics of the rumor mill in tweets (Oh et al., 2010; Karami et al., 2020). The extraction of sentiments from mainly text data during a disaster contributes to a vital situational awareness of the disaster zone dynamics. Wu and Cui (2018) used SA to measure each tweet’s emotion or mood and classified it as positive, negative, or neutral. They confirmed that the severity of damage in one area correlates with disaster-related activity. Neppalli et al. (2017) identified the divergence of sentiments expressed during Hurricane Sandy and displayed how Twitter users’ sentiments change geographically. The authors demonstrated how users’ sentiment changed according to their locations and the disaster’s distance. The extraction of sentiments during a disaster contributes to a vital situational awareness of the disaster zone dynamics. Sentiment analysis is an NLP method to analyze automatically (Hausmann et al., 2020) within text data (Garreta et al., 2019) through computational treatment, sentiments (Taboada et al., 2011), emotions, opinions, attitudes, and subjectivity about a specific topic or towards an entity (Medhat et al., 2014; Zucco et al., 2020). To analyze the text’s emotional load, it is essential to understand its meaning (Gurman & Ellenberger, 2015; Ragini et al., 2018). Sentiment analysis identifies the sentiments contained in the text and classifies their polarity into positive, negative (Ragini et al., 2018), neutral, or not related to the specific topic. Nevertheless, SA also focuses on feelings and emotions (scared, disappointed, surprised), urgency (urgent, not urgent), and even intentions (interested v. not interested) (MonkeyLearn, 2020a). It is recommended that emergency managers consider SA of SM data as a cost-effective solution to track public mood during the post-disaster phases (Young et al., 2020). The classification of text data from SM can be performed at three primary levels in SA: document-level, sentence-level, and sub-sentence level (MonkeyLearn, 2020b).
Topic analysis, also called topic detection, topic modeling, or topic extraction, is another NLP technique to automatically extract meaning from text by identifying recurrent themes or topics. This technique uses machine learning (ML) to organize and understand large text datasets (MonkeyLearn, 2020b). Categories identified through these methods can then be used to understand the impacts of the earthquake and potentially decide the best resource allocation during the emergency response and early recovery. The analysis of text data to classify it by category or “aspect” and define their corresponding polarity is called: aspect-based sentiment analysis. This NPL technique associates specific polarities with different aspects of a service, product, or event. This classification is more accurate and detailed because aspect analysis looks more closely at the information behind the text-data (Pascual, 2019).
This research aims to understand the relationship between the intensities reported by users and the polarities and topics addressed in the comments associated with these reports. We hypothesize that negative polarity is associated with the highest intensities reported and that topics such as building damages, geotechnical effects, lifelines affected, and tsunami effects will also be associated with high intensities reported in the MMI. If the hypothesis is true, then polarity may be able to be used as a proxy for determining the impact of an earthquake. Therefore, SA will be a rapid, easy method of obtaining damage statistics over a wide area.
This paper is divided into five sections. The introductory section presents the current earthquake reconnaissance data sources based on a literature review. The materials and method section describes the case study area, the data source, and the NLP techniques applied. The result section describes the outcomes of the methodology applied. The discussion section interprets the results. The conclusion section recalls the purpose of the research and summarizes the findings.
Materials and Methods
Case Study Area
On 30 October 2020 at 14:51 Turkey and 13:51 Greece time, an Mw = 6.9 earthquake hit the Aegean coasts of Turkey and Greece. The epicenter (37.879°N 26.703°E) was 14 km northeast of Avlakia in the Greek Island of Samos and some 25 km southwest of Izmir, Seferihisar Doganbey. The event’s magnitude has been announced as 6.6 by the AFAD and 7.0 by the United States Geological Survey (USGS). Notably, the event triggered a tsunami that affected a significant coastline between Alaçatı to Gümüldür in Turkey and the northern coasts of Samos. The event was followed by more than 4,000 aftershocks with up to Mw = 5.2 (Aktas et al., 2021). The worst affected area in Turkey was the Bayraklı and Bornova districts in Izmir, located some 70 km away from the epicenter. These places were where the death toll and building and infrastructure damage were concentrated: 116 out of 119 casualties took place here, and almost all of the 17 collapsed buildings were located here. Around 200 buildings were heavily damaged (Aktas et al., 2021). The map of intensities felt reported is plotted in Figure 1. Besides the case study area, there were 345 intensity reports from Croatia (44 were from Zadar). Other intensity reports were uploaded from Bosnia and Herzegovina, Albania, Bulgaria, Romania, North Macedonia, and Serbia (Aktas et al., 2021). Pictures of the impact of the earthquake and mini-tsunami in buildings and infrastructure in Greece and Turkey are depicted in Figure 2.
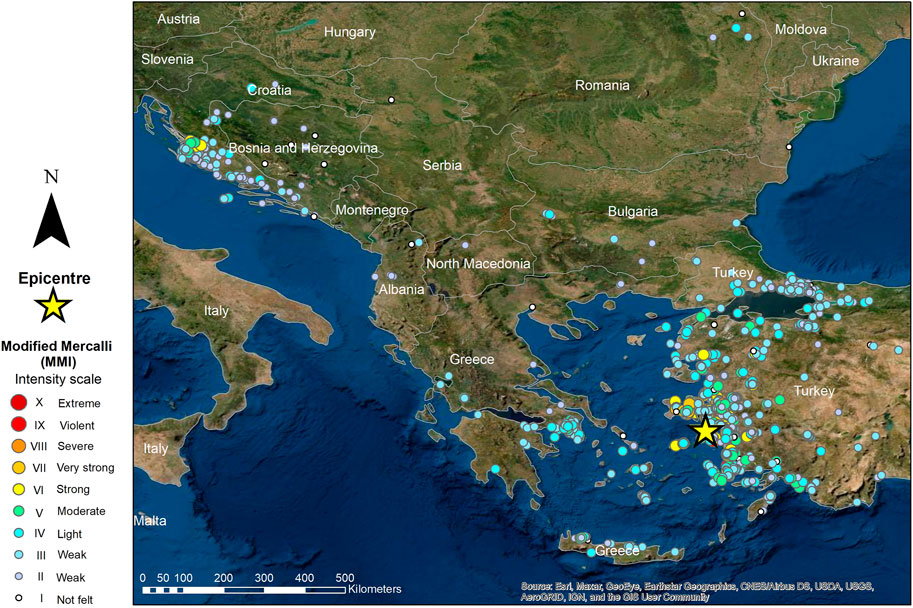
FIGURE 1. Intensities felt reported by LastQquake app users. Data source: EMSC.
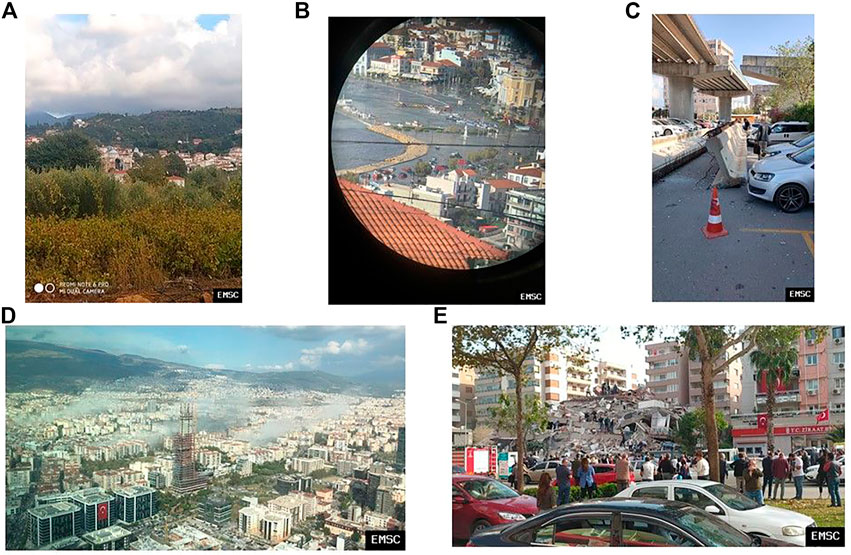
FIGURE 2. Impacts of the earthquake and mini-tsunami in buildings and infrastructure in Greece and Turkey. (A) Wall collapse in Church, Samos Island; (B) flooded coast by the mini- tsunami in Greece; (C) damages in infrastructure in Turkey; (D) Istambul after the earthquake and (E) Building collapsed.
Data Sources
We had two primary SM data sources for this case: 1) the LastQuake app and 2) Twitter. LastQuake is a crowdsource-based earthquake information app developed by the EMSC, and Twitter data was purchased from TweetBinder, a third-party vendor; however, in this paper, we focused our analysis on text data collected through the LastQuake app. This app allows eyewitnesses to share information about earthquakes they have felt and their impacts combined with seismic data. LastQuake app users report intensity they felt expressed in Modified Mercalli Intensity (MMI) through selecting one of the images included in the app that best resembles the effects of the earthquake on-site (Bossu et al., 2020; Fallou et al., 2020). Besides, the intensity report occasionally LastQuake app users submit images and/or text data. The EMSC collected 3,028 intensity reports through the LastQuake app. The text data collected and classified can be found in the data repository of Newcastle University.
Sentiment and Topic Analysis
Data stored by EMSC is extracted in a CSV file. The data contained in this file is cleaned, eliminating reports without a meaning (Eg., Ù†Ø1Ùانا جسيØa ٕيا) given the lack of the same fonts in the computer where they are classified or reports coming from outside the affected area stating that the earthquake was not felt there. We translated the remained comments to English and corrected the spelling for the classification. Eventually, we analyzed 2518 (84%) intensity reports with comments helpful in assessing the earthquake’s impact. Considering the number of reports, we did a supervised classification of the polarity and the topics addressed to extract meaningful information from them. One comment can contain more than one polarity or address more than one topic, but we performed the analysis per comment to plot the analysis in the spatial dimension. Then in the supervised classification, we allocated the predominant polarity and the main topic addressed in the comment. In the case of an emergency due to an earthquake, most of the text data will have a negative polarity because it will contain words related to damage, fear, and anxiety. However, there will also be data that include words related to the event, such as magnitude, intensity, or the location of the epicenter, that can be classified as neutral. Other data will contain solidarity messages, support with humanitarian aid, or help announcements. These are considered to be positive as they demonstrate instances of success. Our analysis employed a supervised classification of the text data. The authors defined the rule-sets used in this classification based on their experience in disaster management and post-disaster recovery. All those intensity reports that represent a low probability of impact on population or damages in physical assets are considered positive, supporting and solidarity messages, emergency actions taken, and preparedness measures adopted and shared by users. Opposite, all those reports that indicate the impact on population or damages in physical assets are considered negative. Reports containing seismic information are considered neutral. The detailed rules set to define the polarity of LastQuake app comments related to the Aegean earthquake are listed in Table 1.
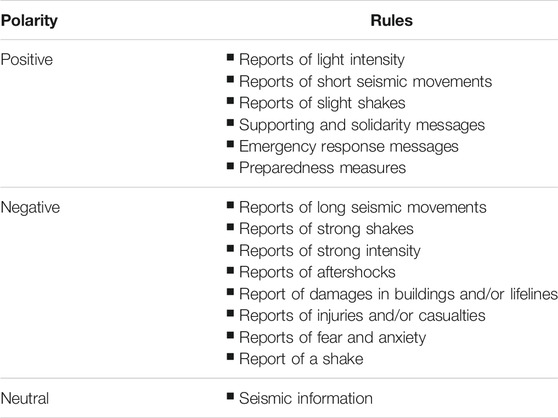
TABLE 1. Rule-set for polarity classification of comments posted by LastQuake app users.
Based on the study of dataset related to the 2019 Albania earthquake (Andonov et al., 2020; Contreras et al., 2021e) and Croatia (So et al., 2020; Contreras et al., 2021a; Contreras et al., 2021b), we identified 12 topics addressed by LastQuake app users: building damage, early recovery, intensity, geotechnical effects, lifelines affected, seismic information, tsunami effects, emergency response, injuries and casualties, preparedness, solidarity messages, and unrelated.
We used the technique of word clouds to extract keywords (MonkeyLearn, 2021) (Roldós, 2020). Uninformative words, known in NLP as stopwords (Sarica & Luo, 2021) such as “about,” “but,” “can,” “during,” “the,” “yet” were removed by the software as a service (SaaS) used to produce the word clouds. The frequency of words in comments from LastQuake app users is represented through their size on the word cloud.
Correlation Analysis
We decided to perform a two-tailed Pearson correlation analysis to explore the statistical relationship between the reported intensities, polarities, unrelated comments, and topics addressed. The result of the correlation analysis is presented in Table 4 in the Results section. The flow of the methodology is presented in Figure 3.
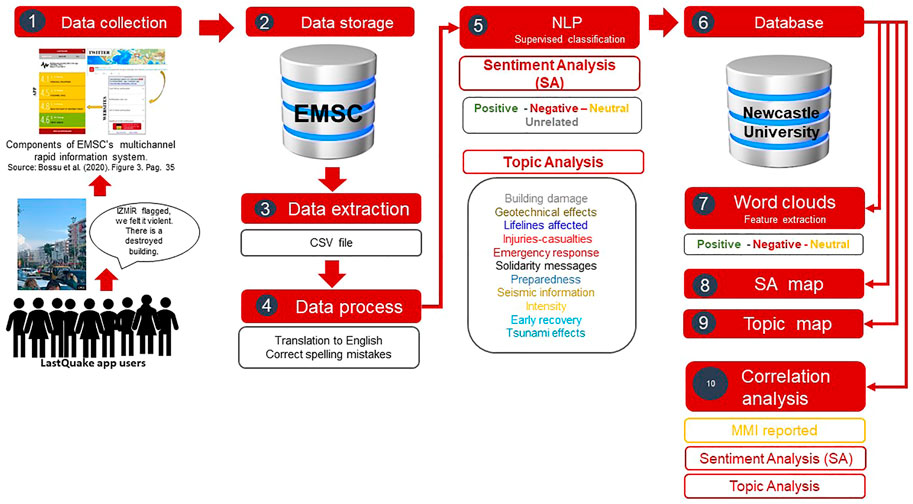
FIGURE 3. Methodology.
Results
Most comments from LastQuake app users contained negative polarity, followed by neutral and positive, as depicted in the polarity pie chart in Figure 4.
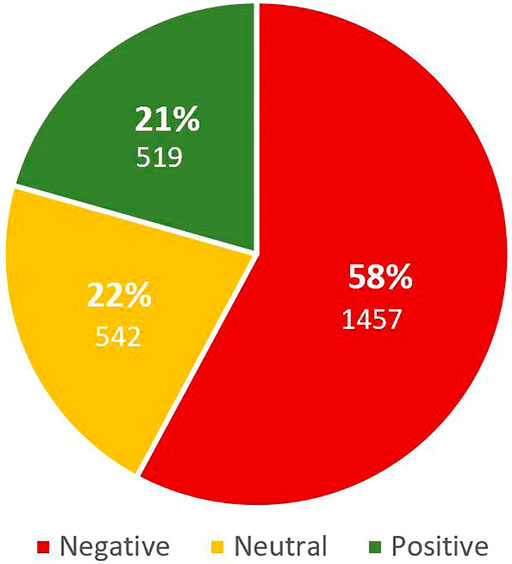
FIGURE 4. Sentiment analysis.
The most frequent words among comments with any polarity are: “felt” and “second.” Other most frequent words in all the polarities are regarding the phenomenon: “earthquake”; the most mentioned places (cities and islands) are Istanbul and Izmir, followed by Athens, Bodrum, Samos, Zadar, Bursa, Manisa, Santorini, and Denizli. Other frequent words describing the seismic movement are e.g., “shake,” “light shake,” “slight tremor,” “slight shake,” “swayed,” “horizontal movement” and “slow horizontal movement” and its duration, e.g., “long time,” “long duration,” “short ride,” “minutes.” Other common words indicating the elements affected by the earthquake are e.g. “house.” “building,” “chandelier,” “door,” “sofa,” “pool,” “lamp” and “bed.” The negative polarity is the polarity with the most information about the floors where the earthquake was felt, ground to the eighth floor. However, comments with positive polarity also include reports about the third, fifth, and ninth floors. Comments classified as neutral include only one reference to the fifth floor. The expression “triangle of life” appears in three comments classified as “positive.” The most common words on each polarity are plotted on word clouds included in Figure 5. The most frequent words per intensity are listed in Table 2. The most frequent word among comments by LastQuake app users was: “Felt” (586), followed by “second” (281), “shaking” (183), “earthquake (135),” and “time” 125) among a total of 3,068 words.
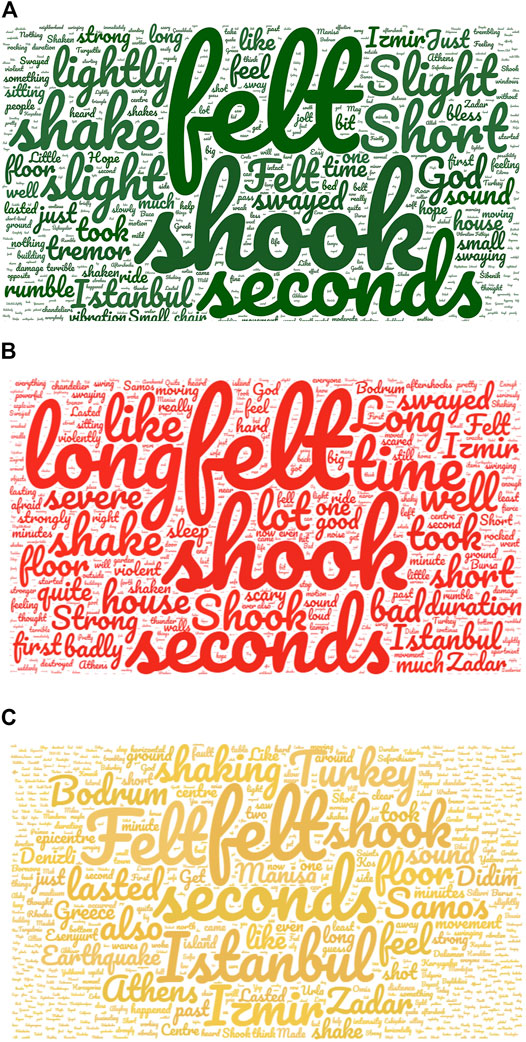
FIGURE 5. Word clouds extracted per polarity: (A) positive; (B) negative and (C) neutral.
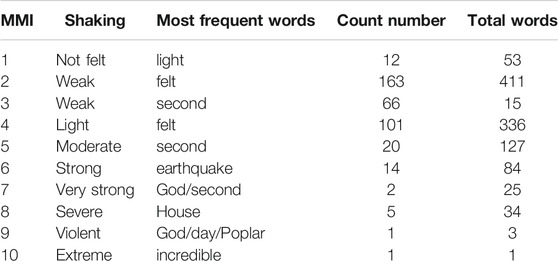
TABLE 2. Most frequent words per intensity reported by LastQuake app users.
Comments with positive, negative, and neutral polarities border the coast, with very few in the peninsula’s interior. Most comments along the coast and the Greek islands have a negative polarity. However, this polarity decreases in the comments from LastQuake app users with the distance to the coast increase, being the scarce comments in the interior of the peninsula mainly neutral, followed by negative and positive. Even on the Greek coast far from the epicenter, comments show positive polarity, as it is depicted in Figure 6.
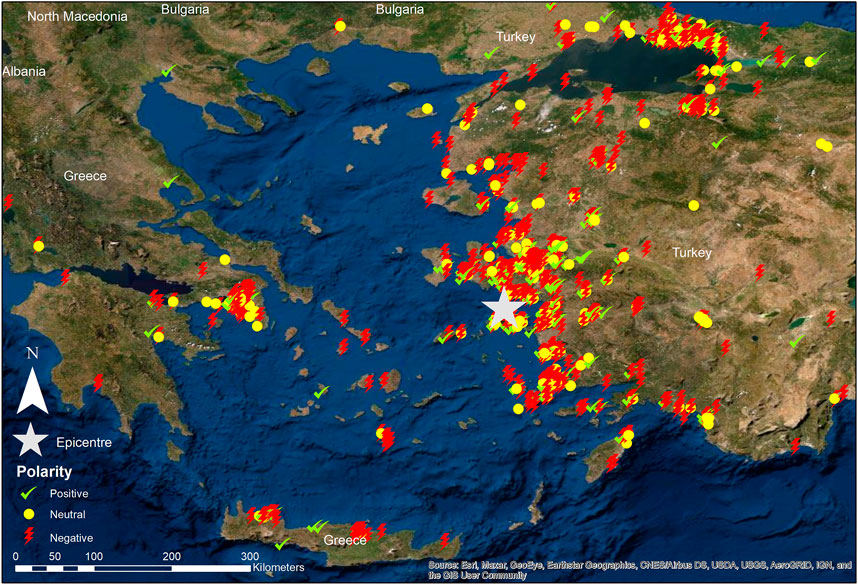
FIGURE 6. Spatial distribution of the polarity of LastQuake app users’ comments.
Comments associated with intensities I and II in the MMI scale have mainly a positive polarity, followed by negative and neutral. Accompanying comments included in intensities III to VII reports have an increasing negative polarity, followed far behind by comments with neutral polarity and comments with positive polarity in the fewest proportion. However, the positive polarity in comments linked to intensities VIII and IX start to increase again to be negative in the comment connected to the unique report of intensity X. This result is plotted in Figure 7.
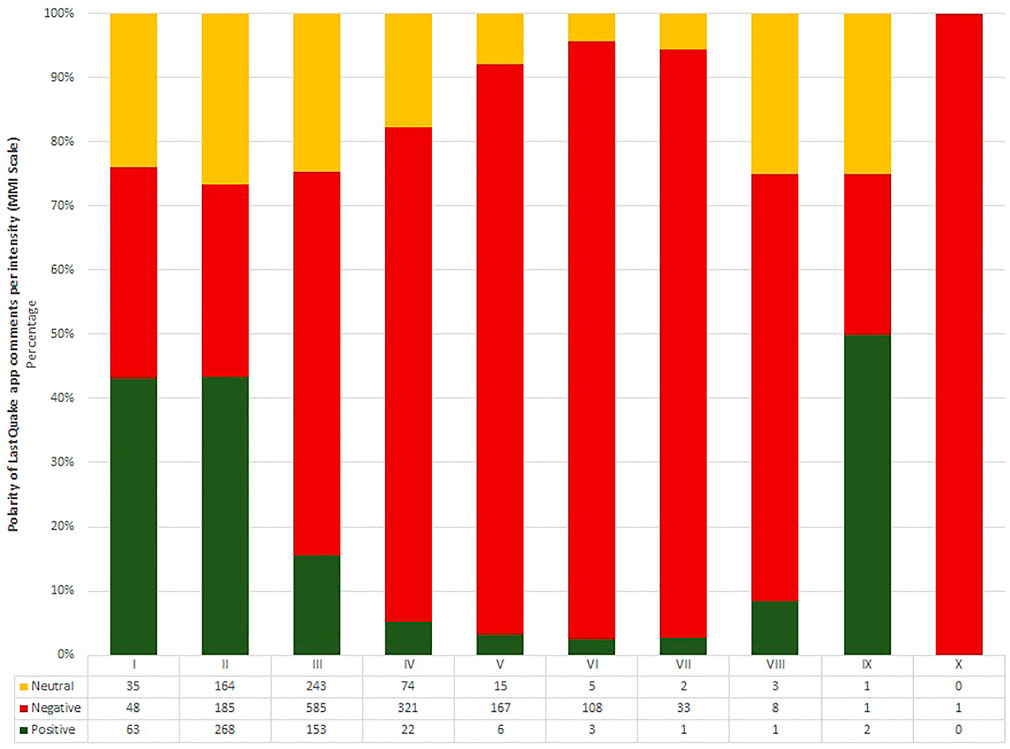
FIGURE 7. Polarity of LastQuake app user comments per levels of intensity reported by LastQuake app users in the MMI Scale.
Most LastQuake app users’ comments addressed the topic of intensity followed by seismic information, solidarity messages, emergency response, unrelated topics, building damage, tsunami effects, preparedness, lifelines affected, and geotechnical effects. The topics addressed in the comments are listed in Table 3. The categories of “injuries and casualties” and “early recovery” were not found in the dataset of this case study. Therefore only ten topics were considered for the classification (Aktas et al., 2021).
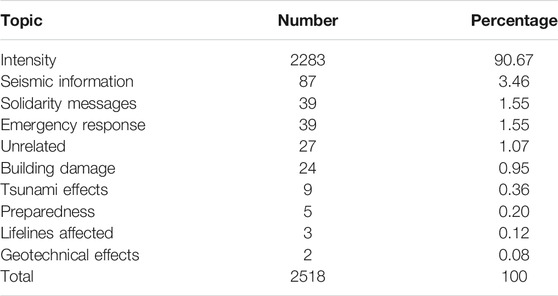
TABLE 3. Topic classification of comments from LastQuake app users in their intensity reports.
Comments around the epicenter addressed the topics of building damages, tsunami effects, and lifelines affected besides intensity. It is also visible the location of comments from LastQuake app users indicating emergency response measures taken. The spatial distribution of the topic classification of comments from LastQuake app users in their intensity reports are presented in Figure 8.
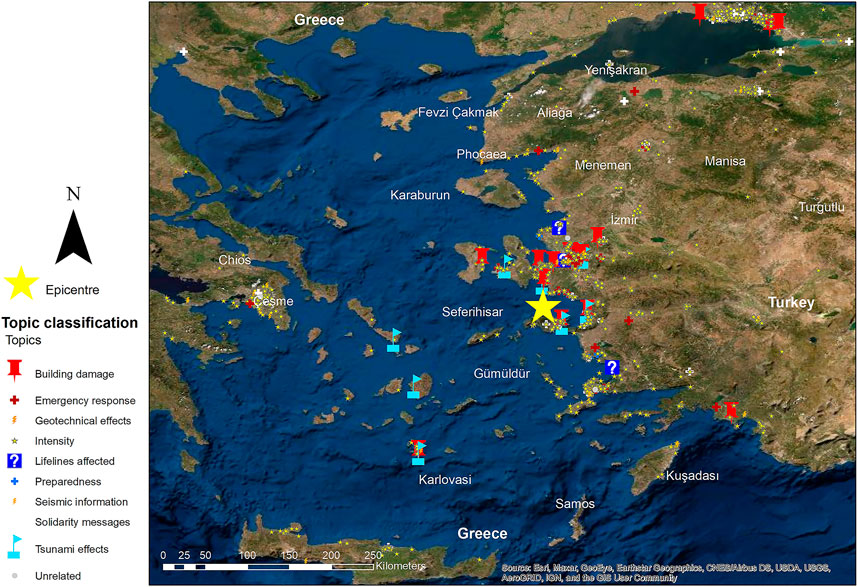
FIGURE 8. Spatial distribution of the topic classification of comments from LastQuake app users in their intensity reports.
Comments connected with the intensity report of I in the MMI scale addresses seven topics, i.e., intensity, seismic information, solidarity messages, emergency response, unrelated topic, building damages, and geotechnical effects. Associated comments to intensity reports of II deal with the highest number of topics compared to other intensities in the MMI. Besides the topics mentioned before: tsunami effects and preparedness are mentioned. Comments linked to intensity report III tackle eight topics, i.e., intensity, seismic information, solidarity messages, emergency response, unrelated topic, building damages, tsunami effects, and preparedness. Comments associated with the intensity report of IV addresses five topics, i.e., intensity, seismic information, solidarity messages, emergency response, and building damages. The comments connected to intensity V deal with the same topics as the previous intensity plus: unrelated and tsunami effects. The comments linked to intensity VI tackle eight topics: intensity, seismic information, solidarity messages, emergency response, unrelated topics, building damages, tsunami effects, and lifelines affected. The associated comments with intensity VII tackle only six topics: intensity, seismic information, solidarity messages, emergency response, building damages, and lifelines affected. The reports of intensity VIII include comments that only addressed four topics: intensity, seismic information, building damages, and tsunami effects. The comments linked to intensity reports of IX in the MMI only deal with three topics, i.e., intensity, solidarity messages, and unrelated topics. The only comment associated with X in the MMI only tackles one topic: intensity. The distribution of topic per intensity is depicted in Figure 9.
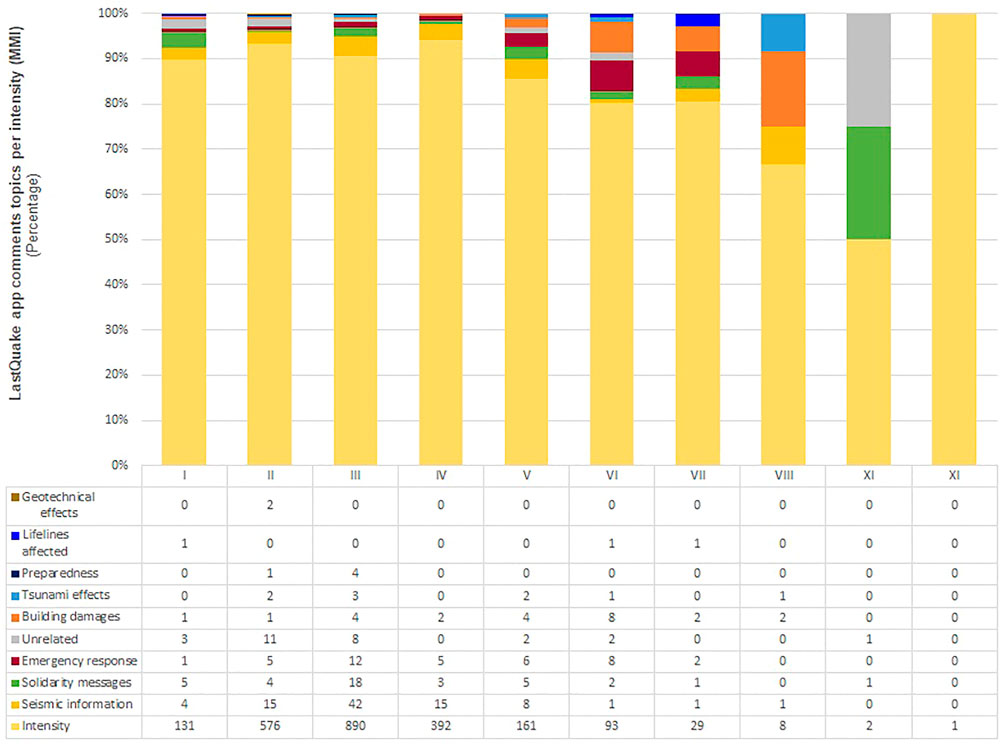
FIGURE 9. The topic of comments associated with the intensity reports submitted by LastQuake app users.
The two-tailed Pearson correlation analysis identifies a highly significant positive correlation between the neutral polarity and the positive (0.837**) and the negative (0.870**). There is a significant negative correlation (-0.664*) between the increased magnitude in the MMI reported and the positive polarity in comments. The magnitudes in the MMI are significantly and negatively correlated with the number of topics addressed (−0.812**), and there is also a negative correlation with the number of comments that include the topics of intensity (−0.658*) and unrelated topics (−0.661*). There is a highly significant positive correlation between the number of comments addressing the topic of intensity and the positive (0.784**), negative (0.928**), and neutral (0.986**) polarities. Intensity is also a topic highly correlated with seismic information (0.963**), solidarity messages (0.858**), emergency response (0.781**), unrelated topics (0.799**) and preparedness (0.874**). There is also a correlation between the number of comments related to intensity and the number of comments addressing the topic of tsunami effects (0.738*). Besides mentioned correlations, there are highly positive significant correlations between the number of comments about seismic information and the negative (0.968**) and neutral (0.943**) polarity and the number of comments addressing the topics of solidarity messages (0.937**), emergency response (0.792**) and preparedness (0.934**). Seismic information is a topic also correlated with unrelated topics (0.661*) and tsunami effects (0.738*). There is also a correlation between seismic information with unrelated comments (0.661*) and tsunami effects (0.739*). Besides previously mentioned correlations, there is a significant positive correlation between the number of solidarity messages and the number of comments with negative (0.889**) and neutral (0.849**) polarity, emergency response (0.788**) and preparedness (0.933**). There is also a positive correlation between solidarity messages and tsunami effects comments (0.741*). Additionally to the correlations mentioned above, the number of comments with the topics of emergency response has a significant positive correlation with negative polarity (0.866**), intensity (0.781**), and tsunami effects (0.772**). There is also a positive correlation between the number of comments that address the topic of emergency response and neutral polarity (0.707*), building damages (0.711*), preparedness (0.726*), and the number of topics addressed (0.704*). Apart from mentioned correlations, the number of unrelated comments is significantly positively correlated with the positive (0.968**) and neutral (0.845**) polarity, and geotechnical effects (0.767**) and positively correlated with tsunami effects (0.736*), preparedness (0.679*) and number of topics addressed (0.698*). The number of comments related to building damages is only correlated with the number of comments related to emergency response (0.711*). Besides previous correlations, the number of comments related to tsunami effects is also correlated with the number of comments with negative polarity (0.687*) and neutral polarity (730*) and preparedness (0.756*). The number of comments tackling the topic lifelines affected shows a correlation neither with polarities nor other topics. Besides previous correlations, the number of comments related to geotechnical effects correlates with positive polarity (0.844**). The details of the correlation analysis can be observed in Table 4.
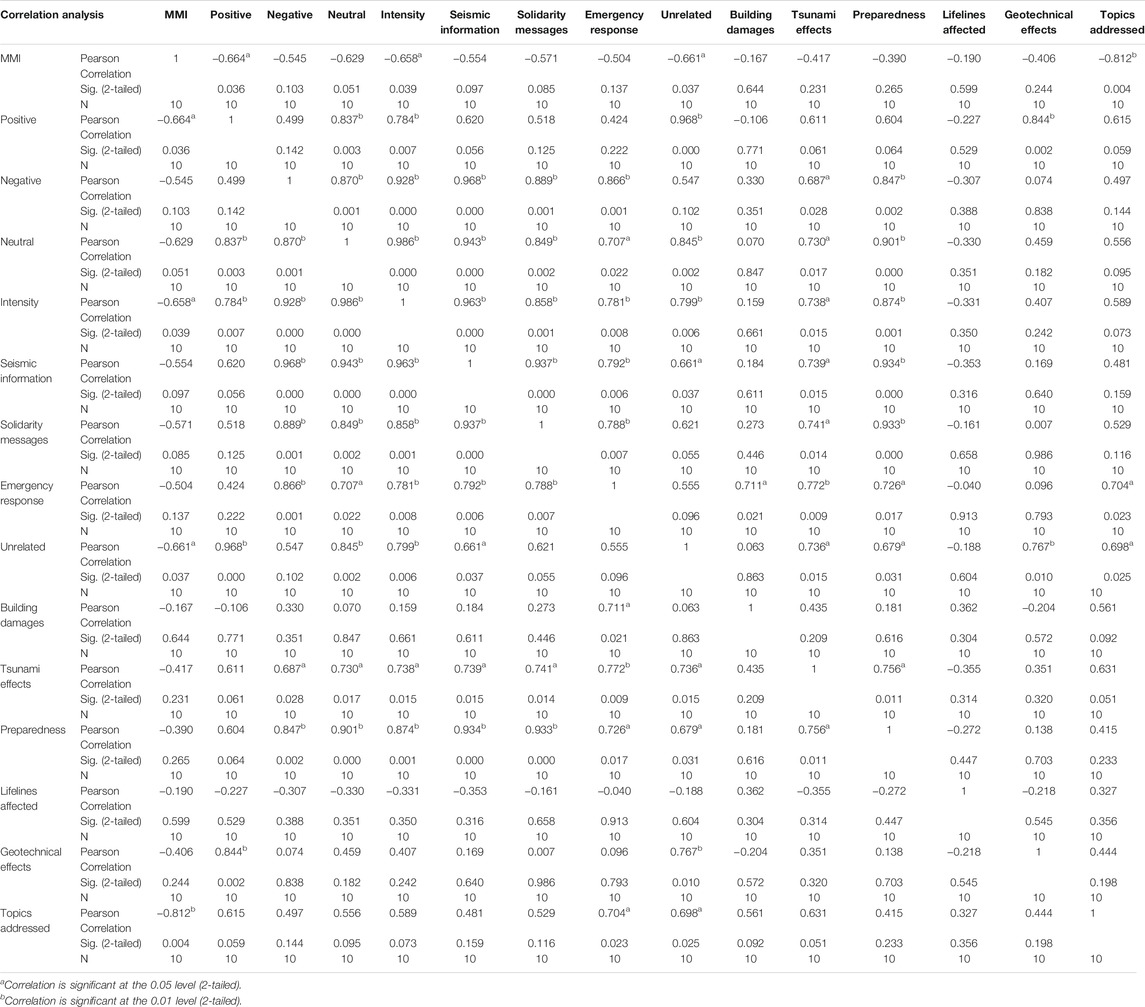
TABLE 4. Two-tailed Pearson correlation analysis result.
Discussion
Social media shows great potential to aid decision-making. However, converting any collected text or image data into meaningful information supporting relief and recovery efforts is still an ongoing area of research. As expected, after an earthquake, most comments from LastQuake app users contained negative polarity, followed by neutral and positive. There is a justifiable doubt regarding using single words without adjectives to determine polarity. Still, sentiment words are considered natural features that express positive or negative sentiments, e.g., amazing, good, wonderful are positive sentiment words, and poor, unfortunate, awful, and wicked are negative sentiment words. Most sentiment words are adjectives and adverbs. However, nouns (e.g., debris, shake, and cracks) and verbs (e.g., love and hate) can be used to express sentiments and feelings (Liu, 2015). Emotions after an earthquake can be expressed in one word, e.g., scary, fear, severe, terrible, and bad (Contreras et al., 2021f). Words like “shake” will appear in sentences classified in all three polarities. It depends accompanying words how the sentence is classified, e.g. “Strong and long shake .... kalymnos Greece” is classified as negative; “I shake it ...it made you feel” is classified as neutral and “slightly shaken” is classified as positive. The only case where the word “shake” appears alone in the dataset was classified as negative (Contreras et al., 2021c), according to the rule-set for polarity classification defined by the authors in Table 1. This classification is because the word “shake” is classified as negative by pre-trained classifiers such as MonkeyLearn (MonkeyLearn, 2020a) with a confidence of 43.3% and the SA software: SentiStrength with a result of positive strength 1 and negative strength −2. In this software, positive polarity strength ranges from 1 (not positive) to 5 (extremely positive) and negative polarity strength from −1 (not negative) to −5 (extremely negative) (Thelwall et al., 2010). The intensity related to the comments is included in the database (Contreras et al., 2021d), where it is also possible to observe that when the intensity reported by the LastQuakeapp user increases, the polarity turns negative.
It is possible to find similar words such as “shake” as a single noun, and “shakes” as a verb in the word cloud of comments with positive polarity. However, both words have different sizes according to their frequency on the comments of the LastQuake app users, which was 29 and 5 times, respectively. The reason is that we did not perform a stemming process. Stemming is a rule-based process in SA of stripping the suffixes (Joshi, 2018), such as those related to plural (“s”) because we did consider it neither appropriate for the aim of our research nor necessary in an entirely supervised classification.
LastQuake app users’ comments with positive polarity make references to a light intensity of the seismic movement (I to III). We found a couple of exceptions that reported intensities of VII and IX but were still classified as positive. The user that reported intensity of VII was informed about SAR operations, and the user that reported intensity of IX expressed happiness about surviving. Another characteristic about the LastQuake app user comments with positive polarity is they report a short duration of the seismic movement (5–20 s maximum).
The opposite happened with LastQuake app users’ comments with negative polarity, who reported strong intensities (III to VIII) with a duration between 3 and 30 s. These comments reported the places where the telluric movement was felt: Zadar, Posedarje, island of Pašman, Košino, Vodice Pakoštane, Split, Aliağa, Bibinje, Pridraga, Benkovac, Rovanjska, Özdere, Murvica, Galovac, Urla (Izmir), kalymnos, Athens, Bakırköy, Bursa, Bodrum, Alsancak, Cunda, Ayvalık, Beylikdüzü, Güzelçamlı, Palaio Faliro, Didim, Karşıyaka and Manisa Akhisar. Comments in this polarity describe the effects of the earthquake on their surroundings. Another seismic event could explain the comments from places in Croatia but having no consequences, it was ignored.
The significant negative correlation between the MMI intensity reported and the positive polarity in comments indicates that while the intensity reported by Lastquake app users is higher, positive polarity on their comments decreases, as observed in Figure 7. According to the rule-set defined by the authors, this negative correlation is explained because the LastQuake app users start to express fear and anxiety when the intensity of the earthquake is higher. The strong positive correlation between the neutral polarity and the positive and negative polarity indicates that while any of the last two polarities increased, the other also increased.
As the LastQuake app was developed to report intensities, 90% of the comments were related to this topic, and this fact also explains that the most frequent word among comments was: “felt.” After intensity, the LastQuake app users tend to describe the sensed direction of the seismic movement as both horizontal and vertical. They also sent solidarity messages, wishing everyone “will be safe.” Users shared the emergency response measures they made (mainly the evacuation of homes). At least three users reported having applied the theory of the “triangle of life” (we make no judgment on this theory here and only report that three users applied). This emergency response action seeks shelter in the void created by getting down onto hands and knees on the floor next to a solid vertical object such as a table instead of sheltering under it (Arlikatti et al., 2019). Additionally, one person who could not evacuate their home due to physical impediments decided to turn off the natural gas tap to protect him or herself. Others describe the damages to buildings and the effects of the tsunami. People recommended that others ensure they have bottles of water, while others ask for advice on how to stay safe. The georeferenced LastQuake user comments were also helpful to identify damages in phone and power lines and to identify vulnerable populations in the case study area, such as undocumented immigrants, pregnant women alone at home, and school teachers responsible for calming students during the earthquake.
The description of damages in buildings is present in comments associated with the intensity reports from I to VIII in the MMI. Simultaneously, the tsunami effects are less constant in the comments linked to reports of intensities: II, III, V, VI, and VIII. Only two comments linked to intensity II are related to geotechnical effects. There is no constant in the number of topics addressed in the comments associated with each intensity, but a decreasing tendency in the number of topics included in the comments associated with intensities from VII to X.
The significant negative correlation between the MMI magnitudes and the number of comments that include the topics of intensity, unrelated topics, and the number of topics addressed means that while the MMI magnitude reported a rise, the number of comments reporting these topics and the number of topics addressed in the comments fall. A positive correlation between the topic of intensity, seismic information, solidarity messages, emergency response, preparedness, and tsunami effects was expected. When intensity increases, the probability of a higher degree of impact by the earthquake and the tsunami rise, in turn, the need for efficient emergency response and later the improvement of preparedness among communities and authorities. The correlation between building damage and emergency response comments means that while there are more damages on buildings, the number of comments related to emergency response also soared, which was also anticipated. Contrary to expected, there is a significant positive correlation between the number of solidarity messages and the number of comments with negative polarity. We found that those comments describe the long and strong seismic movement, the impact of the earthquake and contain a lot of expression of fear and anxiety, which explains why they are classified into a negative polarity. The lack of correlation between lifelines affected and any polarity or other topic could be explained by the very few comments (only 3) classified into this topic.
Conclusion
This research aimed to understand the relationship between the intensities reported by users and the polarities and topics addressed in the comments associated with these reports. We performed a SA and topic analysis on 2,518 comments related to the Aegean earthquake reporting intensities from I to X in the MMI. These comments were provided by EMSC and collected through its LastQuake app. The most frequent intensity reported for this event was III. We used supervised classification following a rule-set defined by authors and a two-tailed Pearson correlation to find statistical relationships between intensities reported and the number of comments classified into a specific polarity and topic. Additional tools from SA to extract keywords such as word clouds allow us to know how the earthquake was felt and where, its duration, objects moved, and the floors where the earthquake was felt, which helps determine the intensity in the MMI and the direction of the seismic waves. Understandably, the most addressed topic is intensity, and the most common word was: “felt” considering that the LastQuake app was developed to report intensity felt.
The fact that positive polarity decreases with the soar in the reported intensity in MMI somehow demonstrated the validity of our first hypothesis, despite not finding a correlation with negative polarity. Instead, we could not prove that building damage, geotechnical effects, lifelines affected, and tsunami effects were topics addressed only in comments reporting the highest intensities in the MMI. We found that these topics are addressed in all the polarities, and actually, the highest intensity reported (IX and X) does not address any of them. It would be necessary to study text data collected from the same source but from other cases to see if this is an exception or a constant. Those comments reporting high intensities have a high emotional burden rather than helpful information for earthquake reconnaissance. We could have removed them from the analysis considering that their number is not significant, i.e., IX: 9 and X:1.
The description of damages in buildings is present in comments associated with the intensity reports from I to VIII in the MMI. Simultaneously, the tsunami effects are less constant in the comments linked to reports of intensities: II, III, V, VI, and VIII. Only two comments linked to intensity II are related to geotechnical effects. There is no constant in the number of topics addressed in the comments associated with each intensity, but a decreasing tendency in the number of topics included in the comments associated with intensities from VII to X. The correlation between building damage and emergency response comments can be assumed to confirm that the second one can be the result of the first one.
On the one hand, correlation analysis shows expected correlations such as MMI, intensity, polarities, seismic information, solidarity messages, emergency response, preparedness, tsunami effects, topics addressed, and building damage and emergency response. On the other hand, we did not find anticipated correlations such as MMI, intensity, lifelines affected, negative polarity, tsunami effects, and emergency response. Instead, we found an unexpected correlation between negative polarity and the number of comments classified into the topic of solidarity, given the anxiety expressed in these comments classified into this topic for this case study.
None comment from the LastQuake app could be classified into the topic of ‘injuries and casualties’. We can then conclude that text data provided by the LastQuake app users are useful for earthquake reconnaissance. Comments from vulnerable populations help to know for whom and where preparedness must be focused. The current analysis was done at the comment level. To increase the precision of the classification, we should perform the SA and the topic analysis per sentence instead of per comment to determine if there are significant changes in the correlation analysis. This supervised classification can be used to test the accuracy of algorithms for unsupervised classification. Based on the experiences processing other datasets of text data related to earthquakes, we are currently considering including additional topics to the classification: Construction practices (Contreras et al., 2021c), critical infrastructure (CI), urban facilities, vulnerable population (Contreras et al., 2021d), and in the case of tsunami: missing population (Contreras et al., 2021e).
Data Availability Statement
The dataset generated for this study can be found in the data repository of Newcastle University: https://data.ncl.ac.uk/articles/dataset/Polarity_and_topic_supervised_classification_of_LastQuake_app_user_s_comments_-_Aegean_2020_earthquake/14604354
Author Contributions
Conceptualization, DC, SW and YA; data provisions, ML, LF, and RB; data curation, DC; methodology, DC; writing—original draft preparation, DC, SW, and YA; writing—review and editing, YA, SW, LF and RB; visualisation, DC; supervision, YA and SW; project administration, YA and SW; funding acquisition, YA and SW. All authors have read and agreed to the published version of the manuscript.
Funding
This research was funded by the Engineering and Physical Sciences Research Council (EPSRC) (Grant No: EP/P025641/1).
Conflict of Interest
The authors declare that the research was conducted in the absence of any commercial or financial relationships that could be construed as a potential conflict of interest.
Publisher’s Note
All claims expressed in this article are solely those of the authors and do not necessarily represent those of their affiliated organizations, or those of the publisher, the editors, and the reviewers. Any product that may be evaluated in this article, or claim that may be made by its manufacturer, is not guaranteed or endorsed by the publisher.
Acknowledgments
We want to thank the Earthquake Engineering Field Investigation Team (EEFIT) for organizing and the 2020 Aegean Earthquake Mission. We appreciate the contribution of the reviewers with their comments and observations.
References
Aktas, Y., O'kane, A., Köşker, A., Özden, A. T., Vatteri, A. P., Durmaz, B., et al. (2021). The Aegean Earthquake and Tsunami of 30 October 2020. Available at: https://www.istructe.org/resources/report/eefit-mission-report-aegean-30-october-2020/.
Andonov, A., Andreev, S., Freddi, F., Greco, F., Gentile, R., Novelli, V., et al. (2020). The Mw6.4 Albania Earthquake on the 26th November 2019. Available at: https://www.istructe.org/IStructE/media/Public/Resources/report-eefit-mission-albania-22102020.pdf.
Arlikatti, S., Huang, S.-K., Yu, C.-H., and Hua, C. (2019). 'Drop, Cover and Hold on' or 'triangle of Life' Attributes of Information Sources Influencing Earthquake Protective Actions. Int. J. SAFE 9 (3), 213–224. doi:10.2495/SAFE-V9-N3-213-224
Avvenuti, M., Cresci, S., Marchetti, A., Meletti, C., and Tesconi, M. (2014). “EARS (Earthquake Alert and Report System),” in Paper presented at the Proceedings of the 20th ACM SIGKDD international conference on Knowledge discovery and data mining, New York, NY, USA. doi:10.1145/2623330.2623358
Bossu, R., Fallou, L., Landès, M., Roussel, F., Julien-Laferrière, S., Roch, J., et al. (2020). Rapid Public Information and Situational Awareness after the November 26, 2019, Albania Earthquake: Lessons Learned from the LastQuake System. Front. Earth Sci. 8 (235), 1–15. doi:10.3389/feart.2020.00235
Bossu, R., Roussel, F., Fallou, L., Landès, M., Steed, R., Mazet-Roux, G., et al. (2018). LastQuake: From Rapid Information to Global Seismic Risk Reduction. Int. J. Disaster Risk Reduction 28, 32–42. doi:10.1016/j.ijdrr.2018.02.024
Calais, E., Boisson, D., Symithe, S., Prépetit, C., Pierre, B., Ulyse, S., et al. (2020). A Socio-Seismology Experiment in Haiti. Front. Earth Sci. 8, 426. doi:10.3389/feart.2020.542654
Contreras, D., Wilkinson, S., and Alterman, E. (2021c). Supervised & Unsupervised Polarity Classification of Twitter Data Related to the Albania 2019 Earthquake. Available at: https://data.ncl.ac.uk/articles/dataset/Supervised_unsupervised_polarity_classification_of_Twitter_data_related_to_the_Albania_2019_earthquake/14604654.
Contreras, D., Wilkinson, S., Fallou, L., Landès, M., Bossu, R., and Aktas, Y. (2021d). Polarity and Topic Supervised Classification of LastQuake App User's Comments - Aegean 2020 Earthquake. Available at: https://data.ncl.ac.uk/articles/dataset/Polarity_and_topic_supervised_classification_of_LastQuake_app_user_s_comments_-_Aegean_2020_earthquake/14604354.
Contreras, D., Wilkinson, S., Fallou, L., Landès, M., Tomljenovich, I., Bossu, R., et al. (2021a). “Assessing Emergency Response and Early Recovery Using Sentiment Analysis (SA),” in The case of Zagreb, Croatia Paper presented at the 1st Croatian Conference on Earthquake Engineering (1CroCEE) 2021, Zagreb, Croatia. Available at: https://crocee.grad.hr/event/1/attachments/1/45/Proceedings_CroCEE.pdf.
Contreras, D., Wilkinson, S., Fallou, L., Landès, M., Tomljenovich, I., Bossu, R., et al. (2021b). Supervised Polarity and Topic Classification of LastQuake App User’s Pictures with Comments – Zagreb 2020 Earthquake. Available at: https://data.ncl.ac.uk/articles/dataset/Supervised_polarity_and_topic_classification_of_LastQuake_app_user_s_pictures_with_comments_Zagreb_2020_earthquake/14687163.
Contreras, D., Wilkinson, S., Hervas, J., Balan, N., and James, P. (2021e). Polarity Supervised Classification of Twitter Data Posted in English Related to the 10th Anniversary of the 2010 Maule Earthquake in Chile. Available at: https://data.ncl.ac.uk/articles/dataset/Polarity_supervised_classification_of_Twitter_data_posted_in_English_related_to_the_10th_anniversary_of_the_2010_Maule_earthquake_in_Chile/15081795.
Contreras, D., Wilkinson, S., and James, P. (2021f). Earthquake Reconnaissance Data Sources, a Literature Review. Earth 2 (4), 1006–1037. doi:10.3390/earth2040060
Doan, S., Vo, B.-K. H., and Collier, N. (2011). “An Analysis of Twitter Messages in the 2011 Tohoku Earthquake,” in Paper presented at the International Conference on Electronic Healthcare.
Fallou, L., Bossu, R., Landès, M., Roch, J., Roussel, F., Steed, R., et al. (2020). Citizen Seismology without Seismologists? Lessons Learned from Mayotte Leading to Improved Collaboration. Front. Commun. 5 (49), 1–17. doi:10.3389/fcomm.2020.00049
Finazzi, F. (2020). The Earthquake Network Project: A Platform for Earthquake Early Warning, Rapid Impact Assessment, and Search and Rescue. Front. Earth Sci. 8, 243. doi:10.3389/feart.2020.00243
Garreta, R., Pascual, F., Saavedra, G., Stecanella, R., Couto, J., Ventura, D., et al. (2019). MonkeyLearn. Available at: https://monkeylearn.com/.
Gurman, T. A., and Ellenberger, N. (2015). Reaching the Global Community during Disasters: Findings from a Content Analysis of the Organizational Use of Twitter after the 2010 Haiti Earthquake. J. Health Commun. 20 (6), 687–696. doi:10.1080/10810730.2015.1018566
Hausmann, A., Toivonen, T., Fink, C., Heikinheimo, V., Kulkarni, R., Tenkanen, H., et al. (2020). Understanding Sentiment of national park Visitors from Social media Data. People Nat. 2 (n/a), 750–760. doi:10.1002/pan3.10130
Karami, A., Shah, V., Vaezi, R., and Bansal, A. (2020). Twitter Speaks: A Case of National Disaster Situational Awareness. J. Inf. Sci. 46 (3), 313–324. doi:10.1177/0165551519828620
Kong, Q., Martin-Short, R., and Allen, R. M. (2020). Toward Global Earthquake Early Warning with the MyShake Smartphone Seismic Network, Part 2: Understanding MyShake Performance Around the World. Seismological Res. Lett. 91 (4), 2218–2233. doi:10.1785/02019017810.1785/0220190178
Kropivnitskaya, Y., Tiampo, K. F., Qin, J., and Bauer, M. A. (2017). Real-Time Earthquake Intensity Estimation Using Streaming Data Analysis of Social and Physical Sensors. Pure Appl. Geophys. 174 (6), 2331–2349. doi:10.1007/s00024-016-1417-6
Liang, W.-T., Lee, J.-C., and Hsiao, N.-C. (2019). Crowdsourcing Platform toward Seismic Disaster Reduction: The Taiwan Scientific Earthquake Reporting (TSER) System. Front. Earth Sci. 7, 12. doi:10.3389/feart.2019.00079
Liu, B. (2015). “Document Sentiment Classification,” in Sentiment Analysis: Mining Opinions, Sentiments, and Emotions (Cambridge: Cambridge University Press), 47–69.
Medhat, W., Hassan, A., and Korashy, H. (2014). Sentiment Analysis Algorithms and Applications: A Survey. Ain Shams Eng. J. 5 (4), 1093–1113. doi:10.1016/j.asej.2014.04.011
Mendoza, M., Poblete, B., and Valderrama, I. (2019). Nowcasting Earthquake Damages with Twitter. EPJ Data Sci. 8 (1), 3. doi:10.1140/epjds/s13688-019-0181-0
Miyabe, M., Miura, A., and Aramaki, E. (2012). “Use Trend Analysis of Twitter after the Great East japan Earthquake,” in Paper presented at the Proceedings of the ACM 2012 conference on Computer Supported Cooperative Work Companion, Seattle, Washington, USA. doi:10.1145/2141512.2141571
MonkeyLearn (2020a). Sentiment Analysis. Available at: https://monkeylearn.com/sentiment-analysis/.
MonkeyLearn (2020b). Topic Analysis. Available at: https://monkeylearn.com/topic-analysis/.
Neppalli, V. K., Caragea, C., Squicciarini, A., Tapia, A., and Stehle, S. (2017). Sentiment Analysis during Hurricane Sandy in Emergency Response. Int. J. Disaster Risk Reduction 21, 213–222. doi:10.1016/j.ijdrr.2016.12.011
Oh, O., Kwon, K. H., and Rao, H. R. (2010). “An Exploration of Social media in Extreme Events: Rumor Theory and Twitter during the HAITI Earthquake 2010,” in Paper presented at the International Conference on Information Systems.
Pascual, F. (2019). A Comprehensive Guide to Aspect-Based Sentiment Analysis. Available at: https://monkeylearn.com/blog/aspect-based-sentiment-analysis/.
Quitoriano, V., and Wald, D. J. (2020). USGS "Did You Feel It?"-Science and Lessons from 20 Years of Citizen Science-Based Macroseismology. Front. Earth Sci. 8, 120. doi:10.3389/feart.2020.00120
Ragini, J. R., Anand, P. M. R., and Bhaskar, V. (2018). Big Data Analytics for Disaster Response and Recovery through Sentiment Analysis. Int. J. Inf. Manage. 42, 13–24. doi:10.1016/j.ijinfomgt.2018.05.004
Robinson, B., Power, R., and Cameron, M. (2013). “A Sensitive Twitter Earthquake Detector,” in Paper presented at the Proceedings of the 22nd International Conference on World Wide Web, Rio de Janeiro, Brazil. doi:10.1145/2487788.2488101
Roldós, I. (2020). “Best Word Visualization Tools to Create Your Own Word Cloud,” in MonkeyLearn Blog (Vol. 2020) (San Francisco, CA: MonkeyLearn).
Sakaki, T., Okazaki, M., and Matsuo, Y. (2010). “Earthquake Shakes Twitter Users,” in Paper presented at the Proceedings of the 19th international conference on World wide web, Raleigh, North Carolina, USA. doi:10.1145/1772690.1772777
Sakaki, T., Okazaki, M., and Matsuo, Y. (2013). “Tweet Analysis for Real-Time Event Detection and Earhtquake Reporting System Development,” in Paper presented at the IEEE transactions on knowledge and Data Engineering 2013.
Sarica, S., and Luo, J. (2021). Stopwords in Technical Language Processing. PLOS ONE 16 (8), e0254937. doi:10.1371/journal.pone.0254937
So, E., Babić, A., Majetic, H., Putrino, V., Verrucci, E., Contreras, D., et al. (2020). The Zagreb Earthquake of 22 March 2020 Retrieved from Newcastle, UK. Available at: https://research.ncl.ac.uk/learningfromearthquakes/outputs/So%20et%20al_2020_%20The%20Zagreb%20earthquake%20of%2022%20March%202020-compressed.pdf.
Subedi, S., Hetényi, G., Denton, P., and Sauron, A. (2020). Seismology at School in Nepal: A Program for Educational and Citizen Seismology through a Low-Cost Seismic Network. Front. Earth Sci. 8, 19. doi:10.3389/feart.2020.00073
Taboada, M., Brooke, J., Tofiloski, M., Voll, K., and Stede, M. (2011). Lexicon-Based Methods for Sentiment Analysis. Comput. Linguistics 37, 267–307. doi:10.1162/COLI_a_00049
Thelwall, M., Buckley, K., Paltoglou, G., Cai, D., and Kappas, A. (2010). Sentiment Strength Detection in Short Informal Text. J. Am. Soc. Inf. Sci. 61 (12), 2544–2558. doi:10.1002/asi.21416
Wartman, J., Berman, J. W., Bostrom, A., Miles, S., Olsen, M., Gurley, K., et al. (2020). Research Needs, Challenges, and Strategic Approaches for Natural Hazards and Disaster Reconnaissance. Front. Built Environ. 6, 17. doi:10.3389/fbuil.2020.573068
Wu, D., and Cui, Y. (2018). Disaster Early Warning and Damage Assessment Analysis Using Social media Data and Geo-Location Information. Decis. Support Syst. 111, 48–59. doi:10.1016/j.dss.2018.04.005
Yan, Y., Chen, J., and Wang, Z. (2020). Mining Public Sentiments and Perspectives from Geotagged Social media Data for Appraising the post-earthquake Recovery of Tourism Destinations. Appl. Geogr. 123, 102306. doi:10.1016/j.apgeog.2020.102306
Young, C., Kuligowski, E., and Pradhan, A. (2020). A Review of Social Media Use during Disaster Response and Recovery Phases. Gaithersburg, MD: National Institute of Standards and Technology.
Zhao, Z., Zhu, H., Xue, Z., Liu, Z., Tian, J., Chua, M. C. H., et al. (2019). An Image-Text Consistency Driven Multimodal Sentiment Analysis Approach for Social media. Inf. Process. Manage. 56, 102097. doi:10.1016/j.ipm.2019.102097
Keywords: 2020 Aegean earthquake, modified mercalli intensity (MMI), LastQuake app, natural language processing (NLP), sentiment analysis (SA), topic analysis, crowdsourcing, citizen science
Citation: Contreras D, Wilkinson S, Aktas YD, Fallou L, Bossu R and Landès M (2022) Intensity-Based Sentiment and Topic Analysis. The Case of the 2020 Aegean Earthquake. Front. Built Environ. 8:839770. doi: 10.3389/fbuil.2022.839770
Received: 20 December 2021; Accepted: 07 February 2022;
Published: 01 March 2022.
Edited by:
Ehsan Noroozinejad Farsangi, Graduate University of Advanced Technology, IranReviewed by:
Naida Ademovic, University of Sarajevo, Bosnia and HerzegovinaAleksandra Bogdanovic, Institute of Earthquake Engineering and Engineering Seismology (IZIIS), North Macedonia
Copyright © 2022 Contreras, Wilkinson, Aktas, Fallou, Bossu and Landès. This is an open-access article distributed under the terms of the Creative Commons Attribution License (CC BY). The use, distribution or reproduction in other forums is permitted, provided the original author(s) and the copyright owner(s) are credited and that the original publication in this journal is cited, in accordance with accepted academic practice. No use, distribution or reproduction is permitted which does not comply with these terms.
*Correspondence: Diana Contreras, Y29udHJlcmFzbW9qaWNhZEBjYXJkaWZmLmFjLnVr