 Fatma Sevil Malcioglu
 Aisling O’Kane
 Kokcan Donmez
 Yasemin D. Aktas
- 1Department of Earthquake Engineering, Kandilli Observatory and Earthquake Research Institute, Boğaziçi University, İstanbul, Turkey
- 2Department of Earth Sciences, COMET, Bullard Laboratories, University of Cambridge, Cambridge, United Kingdom
- 3Epicentre Research Group, Department of Civil, Environmental and Geomatic Engineering, University College London (UCL), London, United Kingdom
The eastern parts of the Aegean Sea were struck by a destructive MW 6.9 earthquake on 30 October 2020 at 11:51:27 UTC. The earthquake ruptured an East-West trending normal fault in the Aegean Sea between the northern coast of Samos Island and the southern coast of İzmir and also triggered a medium level tsunami and thousands of aftershocks across the region. 119 fatalities, 1,051 injuries, and many collapsed buildings were reported due to the earthquake in the affected region. The most catastrophic consequences of the earthquake were registered in the Bayraklı and Bornova districts, which are built on a deep alluvial Basin approximately 60–70 km away from the epicentre of the mainshock. This paper explains the damage with an extensive dataset of ground motion records of the mainshock and aftershocks, which are provided by both Greek and Turkish networks. A set of ground motion parameters such as peak ordinates, spectral quantities, intensity measures and duration parameters are calculated and analysed. The closest softer soil station in Samos Island produces the highest peak ground acceleration and velocity. The ground motion models employed commonly for the region overestimate the observed data beyond 60–70 km of Joyner-Boore distance except for the recently published local ground motion model, which utilises local earthquakes in the derivation of the model. Contrary to expectations, stiff soil recordings exhibit considerable spectral accelerations in the long period region, similar to those in soft soils. The calculated ground motion parameters are correlated with the results of the hybrid reconnaissance mission, organized by the Earthquake Engineering Field Investigation Team (EEFIT). Although the peak values and regarded intensity measures clearly highlight the variability in soil conditions in the most damaged area (Bayraklı and Bornova), velocity-based ground motion parameters seem to be the more responsive damage indicators. The spectral shapes of the normalised response spectra in the İzmir Basin are not compatible with the 2018 Turkish seismic code spectrum whereas their response spectra are below the 475-years return period design spectra provided in outdated and current Turkish seismic codes.
Introduction
On 30 October 2020 at 11:51:27 UTC, a MW 6.9 (Kandilli Observatory and Earthquake Research Institute, 2021) normal-faulting earthquake hit the Aegean Sea off the coasts of the Greek Island of Samos and Turkey. The epicentre was 14 km northeast of Avlakia in Samos and 25 km southwest of Seferihisar in İzmir, Turkey, at a reported depth ranging from 3 (Institute of Engineering Seismology and Earthquake Engineering, 2020) to 21 km (United States Geological Survey, 2020) and with maximum intensity VIII (United States Geological Survey, 2020). The event was followed by thousands of aftershocks with a moment magnitude (MW) up to 5.1. The event caused 15–35 cm of coseismic uplift along the coast of Samos (Plicka et al., 2021) and was accompanied by a tsunami that affected the northern coastline of Samos, as well as between Alaçatı and Gümüldür in Turkey with the water level reaching up to 1.9 m (Aktas et al., 2021). Because of the large magnitude and shallow nature of the earthquake on 30 October 2020, there were many coseismic surface ruptures reported (Lekkas et al., 2020; Aktas et al., 2021).
The Aegean region is one of the most seismically active locations in the world and with a growing population and expansion of cities like İzmir, which is now the third-largest city in Turkey with a population of about 2.8 million (Demographia, 2021), the vulnerability and risk to the people who live there is ever increasing. Despite being situated further away from the epicentre at 70 km, İzmir city on the western coast of Turkey was the most adversely affected region from the 2020 earthquake. Almost all casualties due to the event took place in two districts in İzmir, Bayraklı and Bornova, due to the collapse of a seven 7–11 storey reinforced concrete (RC) structures. It is believed that the collapse of these structures was the result of a combination of the site characteristics, having being built on deep alluvial deposits, and poor construction practices with non-compliant design to building codes and occupancy modifications on the structures (Aktas et al., 2022).
Strong ground motion recordings of the mainshock and aftershocks have allowed us to investigate the event’s seismological and engineering aspects. The earthquake waves generated by a rupture source change their characteristics based on the propagation path and site characteristics of the stations. In this context, the recorded strong ground motions during earthquakes are seminal sources to ascertain the main causes of the earthquake-induced consequences. This paper aims to make a comprehensive evaluation of this well-recorded earthquake through the ground motion parameters computed from a significant accelerograms database [200 horizontal and 99 vertical components]. We briefly outline the seismotectonic and geological context of the region and give an account of the seismological interpretation of the mainshock and aftershock sequence. Then, a detailed explanation of our database and selection criteria are given considering the statistical distribution of distances and soil conditions of stations within 200 km of the 2020 earthquake’s epicentre. The consistency of velocity particle traces with the azimuth of the fault plane is also investigated. Several ground motion parameters including peak ground acceleration (PGA), peak ground velocity (PGV), spectral accelerations (SAs), Arias intensity (AI) (Arias, 1970), cumulative absolute velocity (CAV) (Reed et al., 1988), Housner spectral intensity (Housner, 1952) and significant durations (D5,75 and D5,95) (Arias, 1970) are compared with the widely-used ground motion prediction equations [GMPEs, and also commonly known as Ground Motion Models (GMMs)] and residual analyses, to understand the compatibility of the observed parameters with the estimated values. To understand whether seismic codes are responsible for the damage, the comparison of the response spectra of the ground motions with the design spectra of the outdated and currently used seismic design codes is provided. Then, the role of the duration and frequency content is examined with a special emphasis on the concept of the 3D response spectrum. To conclude, the damage correlation of the spatial distribution of several ground motion parameters is presented.
Seismological Background and Geological Setting
In this section, we will briefly summarise the regional tectonics, geodetic observations, seismicity, and local geology of the Aegean region surrounding the earthquake epicentre, to provide context for understanding the strong ground motion distributions discussed later in the paper.
Regional Tectonics and Geodetic Observations
The Aegean Sea is a tectonically complex region at the intersection between three major tectonic plates (African, Arabian, and Eurasian) and two microplates (Aegean and Anatolian) (McKenzie, 1972). It forms part of the rapidly deforming Alpine-Himalayan orogenic belt and is dominated by strike-slip and extensional motion. Firstly, strike-slip motion is accommodated along the rapidly moving North and East Anatolian Faults, causing an overall westward motion of Turkey relative to Eurasia. Secondly, north-eastward subduction of the African plate along the Hellenic trench causes extension in the overriding Aegean plate (McKenzie, 1972; Jackson, 1994; Taymaz et al., 2007), within which the 30 October 2020 earthquake occurred. It was this north-eastward subduction that resulted in the East-West-trending graben system that extends across western Turkey and into the Aegean Sea (McKenzie, 1978; Taymaz et al., 1991).
McKenzie (1972) first estimated the convergence rates of the wider region (Turkey) to be ∼70 mm/yr, relative to Eurasia. Jackson and McKenzie (1988) however, used earthquakes between 1908 and 1981 to estimate that the Hellenic Trench in the Aegean Sea only accommodates ∼15 mm/yr of shortening, whilst the central Aegean region is extending North-South at rates of 20–60 mm/yr. Africa and Eurasia are converging so this anomaly led to the conclusion that most of the convergence in the Hellenic Trench must be aseismic. McClusky et al. (2000), Nocquet (2012) and England et al. (2016) have since carried out extensive studies using GPS measurements and other available datasets to gain average strain rates across the Aegean region to be in the range of ∼30–43 mm/yr, with Nocquet (2012) noting slightly higher rates at sites near Crete and the southern Peloponnese (see Figure 1).
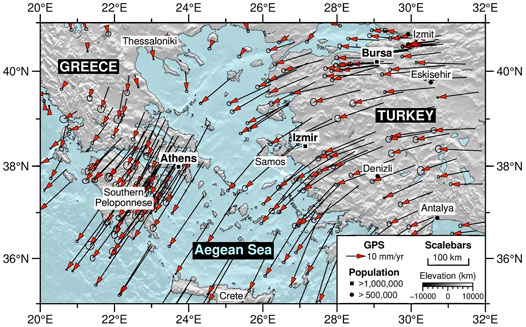
FIGURE 1. GPS velocities relative to Eurasia from the Nocquet (2012) and England et al. (2016) catalogues.
Weiss et al. (2020) produced a strain rate model across Anatolia prior to the earthquake from Sentinel-1 InSAR and GNSS Data. The authors identified the region West of İzmir (where the 30 October 2020 Aegean Sea earthquake occurred) to be an area of high strain.
Local Geology of Samos and İzmir
The Island of Samos is located ∼10 km South of the 30 October 2020 epicentre and ∼1.5 km off the western coast of Turkey, where it extends from the Mycale range (Papadimitriou et al., 2020). The geomorphology of Samos is dominated by two mountainous regions (Mount Ambelos in the centre of the Island and Mount Kerketeas in the West) (Kotinas, 2021), in addition to the Zoodochos Pigi Massif to the East, which creates another topographic high across the Island. These structurally high regions are divided by two topographically low Neogene sedimentary Basins (the Karlovasi Basin to the West and Mytilinii Basin to the East) (Stiros et al., 2000), and in addition to these, there is a prominent decrease in topography from West to East across the Island. Ring et al. (2007) mapped the main geological features of the Island which is centralised around a nappe stack from an Upper ophiolite unit to a basal dolomitic marble unit, in addition to Neogene lacustrine graben sediments (Weidmann et al., 1984). Chatzipetros et al. (2013) identified the main active structures across the Island to be the Karlovasi, Marathokampos, Pythagorion and Vathy faults, in addition to the offshore North Samos fault, on which the 2020 earthquake occurred (as illustrated in Figure 2B).

FIGURE 2. (A) Focal mechanism map showing earthquake events in the Aegean Sea and neighbouring Greek and Turkish coastlines from the Wimpenny and Watson’s (2020) global waveform modelled catalogue. The focal mechanism for the 30 October 2020 earthquake is in blue. The inset shows the frequency of seismic events across the Aegean region within the extent of (A). (B) Seismicity map of the region local to the 30 October 2020 Samos earthquake. The map illustrates crustal (<35 km) events from Dziewonski et al. (1981), Burton et al. (2004), Ekström et al. (2012) and the AFAD 1900–2020 earthquake catalogue (Disaster and Emergency Management Authority, 2020).
İzmir, however, is a densely populated city that is located at the mouth of the Bay of İzmir and is built on Miocene sedimentary units and Plio-Quaternary alluvial deposits (Uzel et al., 2013). There are a series of East-West trending normal faults and northeast-southwest trending strike-slip faults, which pose a hazard to the city. İzmir Bay has a unique ‘L’ shape due to being bound by these active faults (Aksu et al., 1987). The worst affected areas were the Bayraklı and Bornova districts, where 17 buildings collapsed and 200 buildings were heavily damaged (Aktas et al., 2021), despite being ∼70 km away from the earthquake’s epicentre as of 30 November 2020. These districts suffered catastrophic consequences because of the subsurface geology (alluvial soils) on which the city is built. The 30 October 2020 event demonstrated the earthquake ground motion amplification that can occur in sedimentary Basins, as discussed by Bard and Bouchon (1985), Rial et al. (1992), Meza-Fajardo et al. (2016) and O’Kane and Copley (2020). The near-surface shallow velocity structure (e.g., the top 30 m) can also have a large effect on the earthquake ground motion amplification and these can change significantly over short horizontal distances (Anderson et al. (1996); Boore and Joyner, (1997)).
Historical Seismicity
The Aegean region is one of the most seismically active regions in the world (as demonstrated by Figure 2A) and as such, has had a history of destructive earthquakes. Although the early seismic record for Samos is incomplete, Stiros et al. (2000) noted that there were multiple devastating earthquakes in 200 BC, 47 AD and 1751, and at least six > MW 6 earthquakes in the 19th century. Soysal et al. (1981) and Ambraseys (2009) report a few large earthquakes in the 17th to 19th centuries, including the 10 July 1688 and 4 April 1739 events which, similarly to the 2020 Aegean Sea earthquake, caused severe localised damage across parts of Turkey’s İzmir province. The 1688 event killed over 5,000 people in İzmir, largely attributed to the collapse of three-quarters of the city’s building stock and subsequent widespread fires across parts of the city, and the 1739 event had the greatest effect on the low-lying European quarter and the town of Old Foca where three-quarters of its infrastructure was destroyed, causing up to 80 deaths (Ambraseys, 2009). Although the historic records are minimal, the Island of Samos has been affected by multiple earthquakes in the past, including events in 1751, 1766, 1804, 1817, 1831 and two >MW 6.0 earthquakes (1904 MW 6.8 and 1955 MW 6.9) since the beginning of the instrumental record (Ambraseys, 2009). These earthquakes caused widespread damage across the Island of Samos and the surrounding Greek Islands, in addition to the provinces in western Turkey (Makropoulos et al., 2012). The Samos Fault that ruptured during the 2020 Aegean Sea earthquake was similar in dimensions to the sub-parallel onshore Pythagorian fault which was activated during the MW 6.8 11 August 1904, causing severe damage to towns such as Vathy which are built on quaternary sediments known to amplify earthquake ground motions (Lekkas et al., 2020).
The Aegean region is an extensional back-arc area behind the Hellenic subduction arc and as a result, the seismicity is dominated by either strike-slip or normal faulting (McKenzie, 1978). The deformation in the Aegean region is distributed over many active faults, which mainly strike northeast-southwest or East-West, both offshore and onshore in Turkey and Greece (see red lines in Figure 2). Over the past century, there have been thousands of earthquakes across the Aegean region, with frequent moderate-magnitude (MW ≥ 5.0) earthquakes and a significantly large number of smaller-magnitude (MW < 5.0) earthquakes across the region (as demonstrated by the inset on Figure 2). The seismicity of moderately sized earthquakes across the region has been known to be episodic with periods of quiescence, followed by clustering of earthquakes [e.g., in 1969; McKenzie (1972), or in 2009; Tan et al. (2014)]. To illustrate the spatial distribution of the most hazardous earthquakes in Figure 2A, we have filtered the seismic data to only show events within the crust (at depths of <35km, as determined by Jackson et al. (2008)), and with a sufficiently large moment magnitude (>MW5.0). In mainland Greece and the eastern Greek Islands, normal faulting is the main mechanism of deformation, whilst in the Hellenic arc, thrust faulting dominates. In the northern parts of the Aegean region, strike-slip faulting is the predominant type of fault rupture, whilst in the centre of the Aegean region, there is an aseismic region, surrounded by active belts on all sides. The focal mechanisms in Figure 2A illustrate transpressional stress along the Hellenic Arc and transtensional tectonics in the overriding Aegean plate (Kassaras et al., 2020).
We also investigated the seismicity on a local scale to the 30 October 2020 earthquake (Figure 2B). We illustrate the active faults across the Samos and the surrounding region, with most trending northeast-southwest onshore and a couple trending East-West offshore. Mountrakis et al. (2003), Chatzipetros et al. (2013) and Coskun et al. (2017) have carried out local studies on the active faulting on the Island of Samos and within the Gulf of Kuşadası, local to the 30 October 2020 Aegean Sea earthquake. Whilst there are many faults spread across the Island of Samos, Chatzipetros et al. (2013) identified the Karlovasi, Marathokampos, Pythagorion, Vathy and North Samos faults to be the active structures in the region. The Samos fault (located ∼10 km North of Samos) dips at 45° to the North, at a depth of 15 km (Eyidoğan, 2020), consistent with the earthquake parameters of the 30 October 2020. It, therefore, was determined to be responsible for the earthquake.
Brief Seismological Information of the Event
On 30 October 2020 (11:51:27 UTC) a MW 6.9 normal-faulting earthquake occurred in the Aegean Sea ∼10 km North of the Greek Island of Samos and ∼35 km West of the coast of Turkey. Although multiple seismological agencies have reported slightly varying finite fault solutions for the earthquake (see Supplementary Table S1), we can deduce that the earthquake did occur in the shallow upper crust (depth of <12 km; Plicka et al., 2021), on the East-West trending Samos fault that dips steeply to the North. The previous geological surveys and field investigations of several researchers also strongly sustain the argument of North-dipping faulting for the region (Pınar, 2020)1. The rakes deduced in Supplementary Table S1 suggest that the earthquake was almost pure extension (with little to no strike-slip motion involved). This fault movement caused uplift of Samos Island on the footwall side of the fault and subsidence on the hanging wall side, hence why the Greek Islands to the North of the epicentre saw higher tsunami run-up levels (Aktas et al., 2021). Considerable research efforts have also been dedicated to the identification of the finite fault models, many of which are compatible with each other for the mainshock (Kiratzi et al., 2021 (see Supplementary Table S1); Akinci et al., 2021; Karakostas et al., 2021; Chousianitis and Konca, 2021; Ganas et al., 2021; Taymaz et al., 2022). Kiratzi et al. (2021) has established a mainshock slip model with thirty recordings chosen to represent all azimuth angles based on a finite fault inversion method. The details of the fault geometry based on this solution will be used in the calculation of distance metrics in this study. For consistency, the moment magnitude (MW7.0) which is proposed by Kiratzi et al. (2021) will be used in our computations.
Lekkas et al. (2020) report several metre-scale coseismic surface ruptures with centimetre-scale offsets in the Agios Nikolaos, Agios Elias and Kontakaeika villages in the North-West of the Island of Samos. The ruptures in the area of Agios Nikolaos strike 40–70° NE which is consistent with the already mapped faults in the region (Ring et al., 2007). Lekkas et al. (2020) also documented the permanent coseismic uplift attributed to the 30 October 2020 earthquake, which was easy to identify from old waterlines along the rocky shoreline and harbour walls. This type of observation is not unique to the Mediterranean region as many studies have documented tectonic uplift and subsidence across Euboea (Stiros et al., 1992), the Gulf of Corinth (Jackson et al., 1982; McNeill and Collier, 2004), Ionian Islands (Pirazzoli et al., 1994), Rhodes (Pirazzoli et al., 1989), Crete (Tiberti et al., 2014) and the Cyclades (Evelpidou et al., 2014) in the same way. Stiros et al. (2000) have previously documented the changes in the Samos coastline, which allowed Lekkas et al. (2020) to make direct measurements at various locations along the Samos coastline where pre-2020-earthquake measurements were available.
Brief Evaluation of Aftershocks-Mainshock Sequences
Major earthquakes cause cascading effects on the built environment, with the ground shaking caused by earthquakes and their aftershocks being the main contributing factors. Especially in earthquake-prone high-populated regions, aftershocks can considerably increase the amount of in-situ damage to structures. Therefore, investigating the frequency and magnitude characteristics of these kinds of seismogenic areas (i.e., their capability to generate aftershocks), could be as crucial as investigating the mainshock itself. Statistics-based scaling approaches constitute three pillars for this identification process: Gutenberg-Richter, Omori, and Bath (Shcherbakov et al., 2005). Foremost, the Gutenberg-Richter law reveals the correlation between the earthquake magnitude and occurrence frequency for a particular region. On the other hand, the Omori’s law characterises the rate of shocks by elapsed time, and Bath’s rule is for the identification of the primary largest aftershock. It is, therefore, essential to identify the frequency-magnitude characteristics of the seismic zone and evaluate the aftershock sequence and distribution of events.
In the 30 days following the 2020 Aegean Sea earthquake, a sequence consisting of hundreds of events of varying severities was triggered. These events informed two data sets within the 1-month period following the ML 6.7 (MW 6.9) mainshock on 30 October 2020. Events with local magnitude ML ≥3 were uniformly extracted from KOERI and AFAD databases (Disaster and Emergency Management Authority, 2021; Kandilli Observatory and Earthquake Research Institute, 2021), considering a circular area with r = 50 km from the epicentre. KOERI and AFAD databases provide 458 and 338 events, respectively. According to the former set, most of the events occur at 5–10 km depth (Figure 3B) and are in the 3.0–3.5 local magnitude range.
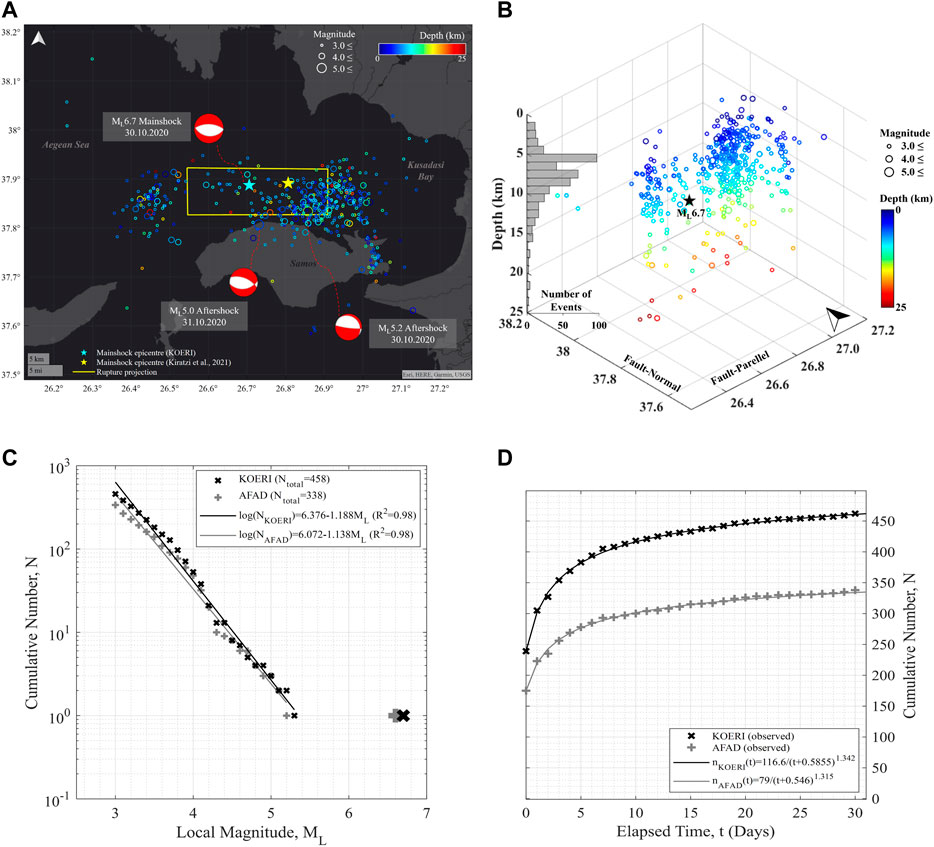
FIGURE 3. (A) Locations of Aegean Sea aftershock sequence with ML ≥ 3.0 (based on KOERI database), (B) 3D re-evaluation of the sequence within the crust. (C) Frequency-magnitude relationships and (D) the Omori-Utsu models that obtained based on KOERI and AFAD databases (n refers to the daily number of the events).
The map in Figure 3A displays epicentres of earthquakes of the sequence, focal depths of which are presented by colours. Two aftershocks with ML 5.2 (MW 5.1, 30.10.2020) and ML 5.0 (MW 5.0, 31.10.2020) take place within close proximity to the main fault line. Along or within close proximity to the proposed rupture surface by Kiratzi et al., 2021, ML ≤4.0 shallow events are dominant. Figure 3B depicts the 3D distribution of the observed sequential seismic activity based on the KOERI database. At first glance, two groups of primarily shallow shocks occurred westward and eastward from the epicentre, and the majority of them were in the eastern part, which corresponds to the main fault off the northern shore of Samos (Figure 4). Utilising the focal depths of aftershocks, the characteristic of normal faulting has also been seen, however, the depth evaluation of the entire dataset does not explicitly point out the North-dipping feature of the mainshock.
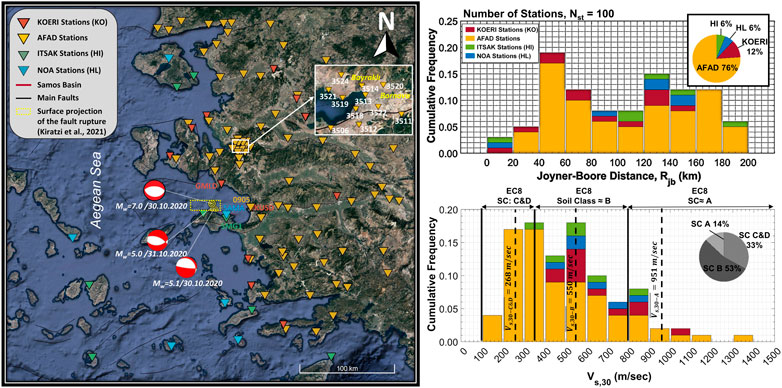
FIGURE 4. (Left) Epicentres of the events with the surface projection of the mainshock rupture model proposed by Kiratzi et al. (2021) and spatial distribution of recording stations. (Right Top) The statistical distribution of Rjbs. (Right Bottom) The distribution of the average shear wave velocities of the stations for the upper 30 m depth (Vs,30) with the mean values of each class for the mainshock.
A prominent statistical aspect of the aftershocks, (i.e., the earthquake-frequency relationship of the Samos seismic zone), is revealed utilising the Gutenberg-Richter law (Gutenberg and Richter, 1949). This relationship employs a regression form:
The temporal distribution of this sequence is expressed by the Omori-Utsu approach (Utsu, 1961). Daily rates (n) of aftershocks, i.e., a time interval (t) equals to 1 day, is used to fit a nonlinear curve employing the following equation:
Compilation and Processing of Ground Motion Dataset
The Aegean Sea earthquake (30 October 2020, Mw 6.9) has provided an extensive set of ground motion records from four different networks operated by the Ministry of Interior Disaster and Emergency Management Presidency (AFAD), Boğaziçi University’s Kandilli Observatory and Earthquake Research Institute (KOERI), National Observatory of Athens Seismic Network (HL) and ITSAK Strong Ground Motion (HI). The raw accelerograms recorded within 200 km of the re-calculated epicentral distances have been meticulously examined and the unqualified records, which contain data gaps within seismic event duration, have been rejected. The KOERI data have been received in count format and then converted to raw accelerations via sensitivity factors acquired from the KOERI-RETMC website. AFAD and NOA’s unprocessed acceleration data are also accessible through their official websites. After adjusting the baseline of the accelerograms, we applied a fourth order band-pass Butterworth filter to the data by keeping constant low-pass filter frequency at 20 Hz. By visually inspecting each velocity and displacement time history, which are calculated based on trapezoidal numerical integration, the high-pass filter frequencies have been detected on a record-by-record basis. With several minor exceptions, the specified high-pass filter frequencies range from 0.1 to 0.2 Hz. For ITSAK, we could only access the processed data whose selected high-pass filter frequency varies from 0.05 to 0.22 Hz. However, to provide uniformity in the database, these records have been adopted based on a specified low-pass filter frequency. It should be noted that while all stations yield EW (East-West) and NS (North-South) components of the ground motions, the horizontal components of SAMA and SMG1 recordings are in the direction of
200 horizontal and 99 vertical components - since vertical component of only the 3,518 station (AFAD) has been labelled as an unqualified record-of accelerograms from 100 strong ground motion stations in Greece and Turkey within 200 km of epicentral distances have composed the final database for the 30 October Aegean Sea earthquake. There is a good spatial coverage of stations to the East and North of the epicentre (which are mostly operated by the AFAD), and SMG1 and SAMA stations to the South of the epicentre provide a good opportunity to evaluate the significant strong ground motion parameters. There is a lack of stations to the West of the epicentre however. A dataset for the two largest aftershocks (30 October 2020, Mw 5.1 and 31 October 2020, Mw 5.0) has been also generated, similarly to the mainshock records so that they could be further evaluated.
Figure 4 illustrates the spatial distribution of the mainshock and aftershock epicentres, as well as stations triggered by the events. This figure also categorises the strong ground motion stations which recorded only the main event, based on their Joyner-Boore distances (Rjb), which is the closest distance to surface projection of the rupture plane. In this study, the fault geometry proposed by Kiratzi et al., 2021 has been used in the calculation of the Joyner-Boore distances. This study suggests a rupture plane with 32 km subsurface length and 15 km down-dip width. The top of the fault rupture is located approximately 0.5 km deep beneath the seafloor according to the selected fault geometry model. The finite fault model of aftershocks is not available in the literature. That’s why, the Joyner-Boore distances have been empirically estimated by using the approach of Harmsen, C. in Petersen et al., 2008. The fault dimensions have been calculated based on Wells and Coppersmith, 1994. The network-based distribution of Rjb for the mainshock is also assessed in Figure 4. Although most of our data has been acquired from AFAD, the closest stations to the fault rupture projection such as SAMA, SMG1 and GMLD are from NOA and ITSAK in the South and KOERI in the North, respectively. The site categorisation of Eurocode 8 (EC8) (Eurocode, 2004) is used to determine the soil conditions of the stations based on the average shear wave velocities of stations for the upper 30 m depth (Vs,30) (Figure 4). Vs,30 values of the stations are mainly supplied by the networks; however, the USGS topography-based Vs,30 map (Allen and Wald, 2007) has been used for a few stations. Askan et al., 2021 stated that the Vs,30 values of SAMA and SMG1 stations have been updated based on the Vs,30 measurements after the mainshock, and these updated values are considered within our calculations. The majority of the stations are deployed in the sites with soil class B (360 m/s < Vs,30 <800 m/s) with a mean value of 550 m/s. Soil Classes C and D (33% of stations) have been combined into one class due to the lack of data in soil class D.
General Evaluation of Engineering Parameters
The source, path, and site conditions are responsible for the generation of site-specific seismic traces at the earth’s surface, which allows the identification of spatial variation of ground shaking effects. An earthquake’s destructiveness can be characterized by employing simple engineering ground motion parameters such as peak ordinates of time histories, energy-based parameters, spectral quantities, etc. The simplest and most widely used parameters are peak ground acceleration (PGA) and peak ground velocity (PGV) to quantify the damage potential of seismic excitations. PGA mostly offers meaningful information for structures with periods of less than 0.3 s although they possess geophysical and engineering constraints (Douglas, 2003; Boore and Bommer, 2005). Peak Ground Velocities (PGVs) are also feasible to afford an insight into the magnitude and intensity of an earthquake (Akkar and Ozen, 2005). In the initial damage identification, Arias Intensity (AI) and Housner’s spectral intensity (SI) may also be more reliable indicators since they take into account the whole duration of seismic shaking and frequency content.
The initial evaluation of ground motion parameters has been conducted by considering the epicentral distances and soil conditions of each recorded station for both horizontal components of the ground motions (Figure 5). The seismic traces measured at the closest station, the SMG1 (Repi ≈ 22 km), which is one of two strong ground motion stations on Samos Island, produces the largest PGA and PGV of 232 cm/s2 and 25 cm/s in the converted NS component, respectively. Also, the SAMA station, which is deployed on a relatively stiffer soil (Vs,30, SMG1 ≈550 m/s < Vs,30, SAMA≈840 m/s), 250 m away from SMG1, and results in a PGA of 156 cm/s2 and a PGV of 14 cm/s in the NS component. The PGA and PGV values of the nearest station (GMLD) in Turkish territory, which is North of the epicentre with Repi ≈ 23 km, produced 209 cm/s2 and 20 cm/s ground motions in the NS component. The largest peak amplitudes of these stations, which are settled on the perpendicular orientation to the fault, occur on the fault-normal component. The direction dependency of the parameters will be elaborated later in the paper. Another large PGA (≈178 cm/s2) is recorded at the 0905 AFAD station (Repi ≈ 40 km; Vs,30 ≈369 m/s), which is positioned in the EW (fault-parallel) direction, and its PGV is compatible with the others at similar distances. In contrast, the KUSD station, 2 km East of station 0905 does not exhibit PGA and PGV values as large as 0905. The relatively stiffer soil conditions of the KUSD (Vs,30 ≈1,052 m/s) may be the contributing factor that dampens the station peak amplitudes.
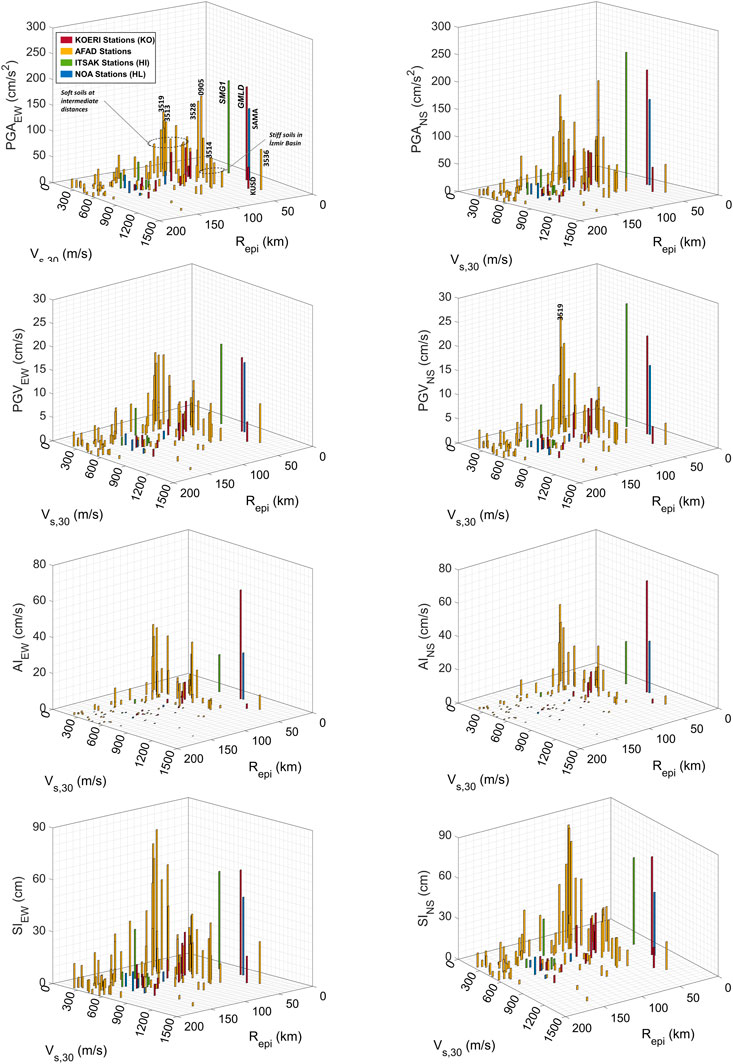
FIGURE 5. The variation of component-based PGA, PGV, AI and SI with respect to epicentral distances (Repi) and Vs,30 values.
A data cluster with relatively high PGAs and PGVs may compel one’s attention to the intersection of low Vs,30 and moderate distances (Repi ∼ 60–70 km). It is detected that all stations, in this cluster are from the İzmir Basin, where the most catastrophic earthquake-induced consequences occurred. The PGV from the NS component in station 3519, which is settled on the softest soil conditions in the İzmir Basin, surpasses the peak velocities of the closest stations (GMLD and SAMA). Additionally, stiff soil stations (Vs,30 ≈ 800–900 m/s) in the İzmir Basin allow for comparison with soft soil peak amplitudes. When comparing soft (3513; Repi ≈ 70 km; Vs,30 ≈ 196 m/s) and stiff (3514; Repi ≈ 72 km; Vs,30 ≈ 836 m/s) soil stations in Bayraklı (one of the most damaged districts), PGA (PGAEW,3513 ≈ 94.5 cm/s2 and PGANS,3513 ≈ 106.5 cm/s2) and PGV (PGVEW,3513 ≈ 14.5 cm/s and PGVNS,3513 ≈ 17.1 cm/s) of soft soil records are determined to be roughly double in the EW direction and triple, even fourfold in the NS direction, than that of the stiff soil station (PGAEW,3514 ≈ 56.3 cm/s2, PGANS,3514 ≈ 39.2 cm/s2, PGVEW,3514 ≈ 6.0 cm/s and PGVNS,3514 ≈ 4.3 cm/s). This finding may be indicative of the soil amplification in the Basin.
Arias intensity (AI), which is a ground motion energy parameter computed as the integrated value of squared accelerations, is maximum at the GMLD station, on the hanging wall side of the fault rupture. The closest footwall stations (SMG1 and SAMA) illustrate remarkably lower AIs. Contrary to AIs, spectral intensities (SIs), which are the accumulated kinetic energy in the SDOFs during ground motion, demonstrate an approximately similar level of energy. The expected high energy accumulation in the soft soils is also verified by the large AI and SI values, which show a prominent rise for the soft soils of the İzmir Basin.
Comparison of Ground Motion Parameters With GMPEs
The fundamental input of the seismic hazard and risk studies, and seismic design of structural and geotechnical systems is predicated on the estimated ground motion parameters for possible future events. The comparison of the actual ground motion parameters with the estimated values provides invaluable information to improve better estimation relations and evaluation of the current GMPEs. Several empirical equations exist that estimate ground motion parameters depending on mainly the tectonic regime, earthquake magnitude, source-to-site distance, soil condition, etc. The comparison of observed results with estimated ground motion parameters via five different GMPEs is presented in this study. Akkar et al., 2014 (ASB14), Boore et al., 2014 (BSSA14), Kale et al., 2015 (KAAH15) and Boore et al., 2021 (BEA21) are preferred for the comparison of peak parameters and spectral ordinates. Arias intensities (AI), cumulative absolute velocities (CAV), and significant durations (D5-75 and D5-95), which refers to the time between 5 and 75%/95% of the cumulative Arias Intensity, respectively, are compared with the GMPEs of Sandikkaya and Akkar, (2017) (SA17). The compatibility of the fundamental attributes of GMPE databases with the key features of the Aegean Sea earthquake and the affected region have been the main selection criteria of these ground-motion models. It should be noted that the recently published regional relation, BEA21, has been utilised from only earthquakes in Greece. The open forms of the evaluated GMPEs are not included in the paper for the sake of brevity, however; the main characteristics of the equations could be found in the relevant references.
The EC8 classification is considered in the separation of the soil classes of the stations as given previously. The mean of each soil class is used in the computation of the estimated ground motion parameters. Geometrical means of PGAs, PGVs, and SAs have been calculated for both horizontal components and compared with empirical estimations of the abovementioned GMPEs. Also, total residuals have been computed as follows,
Where,
The observed PGAs and PGVs for site class A are mainly in agreement with four GMPEs (Figures 6, 7). The scarcity of data in this soil class does not allow for a complete assessment of the variation of peak ordinates with distance. However, the residuals are close to zero with several exceptions. For soil classes B and C, there are two clear trends. The band of 60–70 km of Rjb divides the plot into two sections with different attenuation tendencies in the comparison with ASB14, BSSA14, and KAAH15. Beyond this distance, the observed peak values start to degrade at a faster rate than those predicted by GMPEs and this trend is responsible for the increase in total residuals with the negative signs. However, the BEA21 appears to be considerably better at representing these two distinct patterns, and mean residuals are approximately zero.
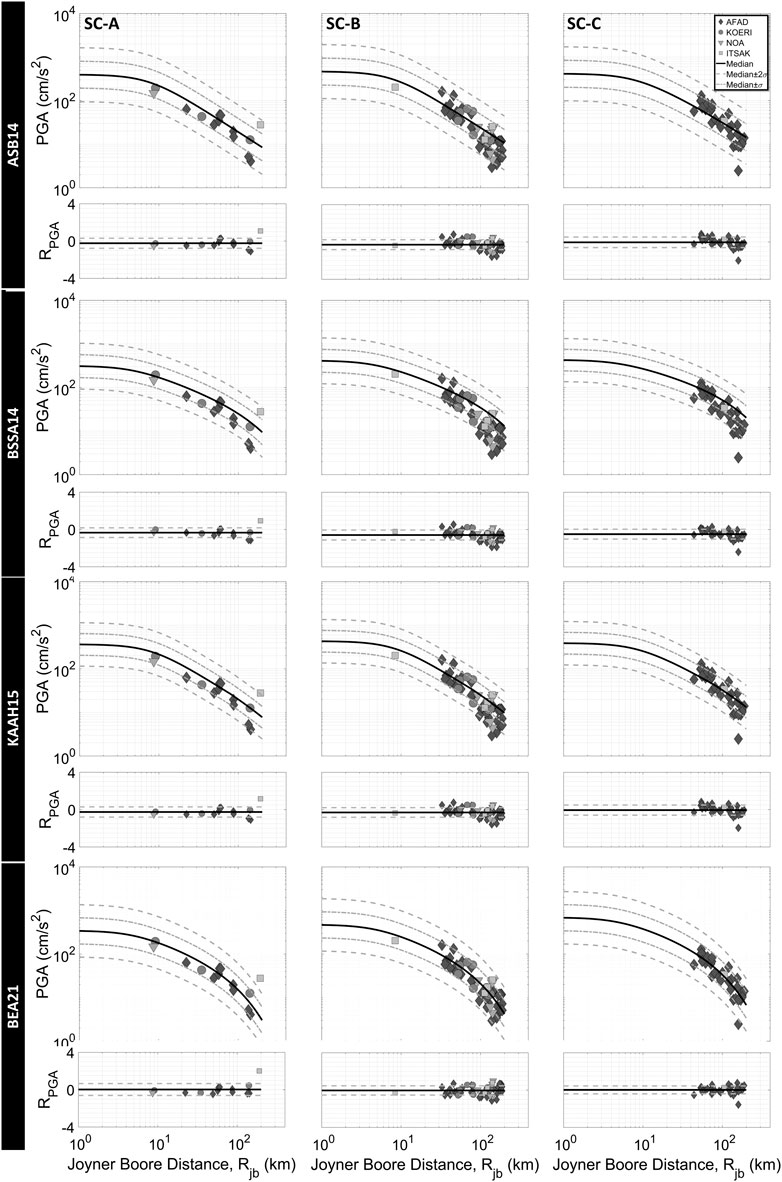
FIGURE 6. Comparison of PGAs with GMPEs; Akkar et al., 2014 (ASB14), Boore et al., 2014 (BSSA14), Kale et al., 2015 (KAAH15), and Boore et al., 2021 (BEA21) for the geometric mean of horizontal components and three soil classes (R = Total residual and, solid and dashed lines refer to its mean and mean ± standard deviations in residual graphs).
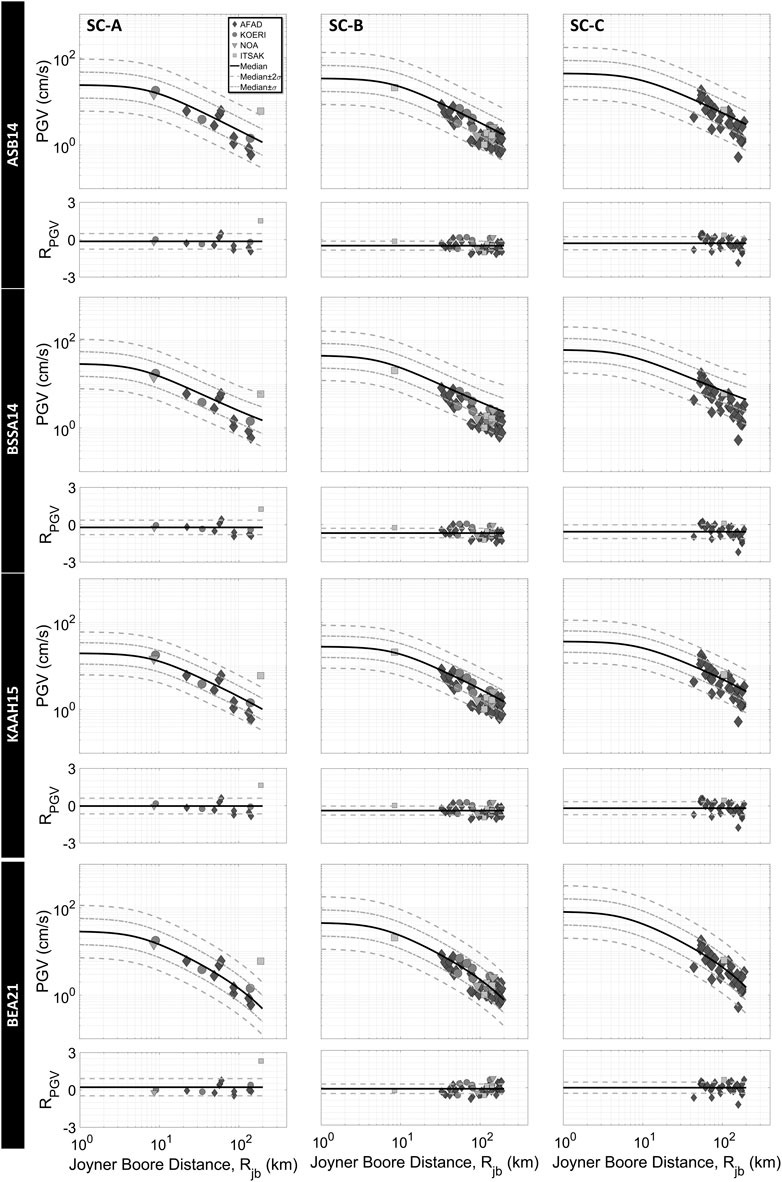
FIGURE 7. Comparison of PGVs with GMPEs; Akkar et al., 2014 (ASB14), Boore et al., 2014 (BSSA14), Kale et al., 2015 (KAAH15), and Boore et al., 2021 (BEA21) for the geometric mean of horizontal components and three soil classes (R = Total residual and, solid and dashed lines refer to its mean and mean ± standard deviations in residual graphs).
Spectral ordinates give a useful insight into the seismic demand of structures within different period ranges. Figures 8, 9 demonstrate the variation of not only empirical estimations but also calculated SAs with distance for the periods of 1.0 and 2.0 s. At first glance, it seems that all calculated SAs are within the range of median ± 2σ except for the several values from distant stations. In soil class A, the sparse data hamper a reliable evaluation, however; three stations at about 60 km of Rjb, located in the İzmir Basin, exhibit relatively larger observed SAs than all GMPEs’ estimations at T = 1 s. As for T = 2 s, SAs of the Basin stations seem to approach the median lines. For soil classes B and C, SAs at T = 1 s are mainly overpredicted by three GMPEs (ASB14, BSSA14 and KAAH15) while estimations of BEA21 give smaller values than observed spectral attributes with the positive mean residuals. Furthermore, at greater distances, observed SAs tend to attenuate slightly faster than median lines of ASB14, BSSA14 and KAAH15, similar to the peak ground motion parameters. Although the median lines of empirical equations (except for BEA21) are higher than the observed SAs at T = 2 s with negative mean residuals, a distinctive attenuation pattern after 60–70 km distance cannot be readily recognized. On the contrary, in the case of BEA21, the estimated SAs at T = 2 s are in accordance with observed SAs with approximately zero mean residuals. Similar to PGA and PGV, BEA21 captures the variation of attenuation beginning at 60–70 km of Rjb in both periods. This attenuation change in these distances may be associated with regional implications. Furthermore, the soft soil (soil class C) records of the İzmir Basin, mostly damaged area, produce larger SAs, especially at the period of 1.0 s and nearly reaches the 97.8 percentile line. However, at the period of 2.0 s, spectral ordinates of these records come close to median again.
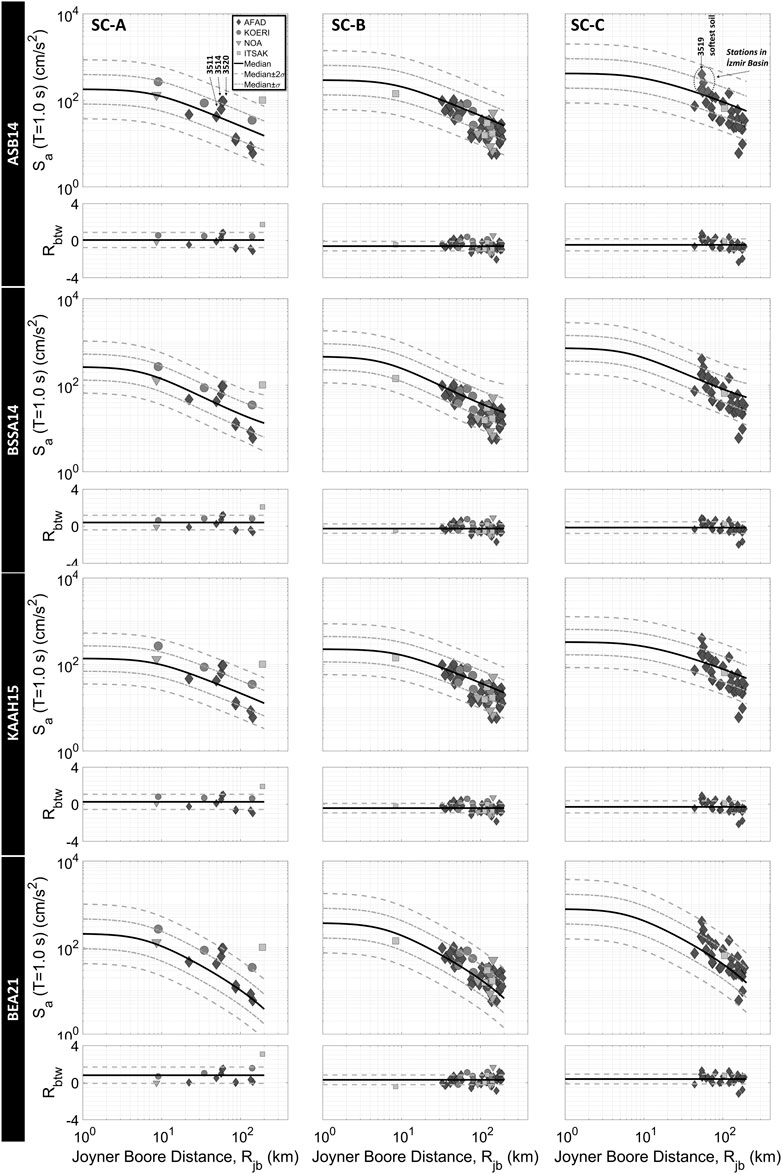
FIGURE 8. Comparison of SAs at T = 1.0 s with GMPEs; Akkar et al., 2014 (ASB14), Boore et al., 2014 (BSSA14), Kale et al., 2015 (KAAH15), and Boore et al., 2021 (BEA21) for the geometric mean of horizontal components and three soil classes (R = Total residual and, solid and dashed lines refer to its mean and mean ± standard deviations in residual graphs).
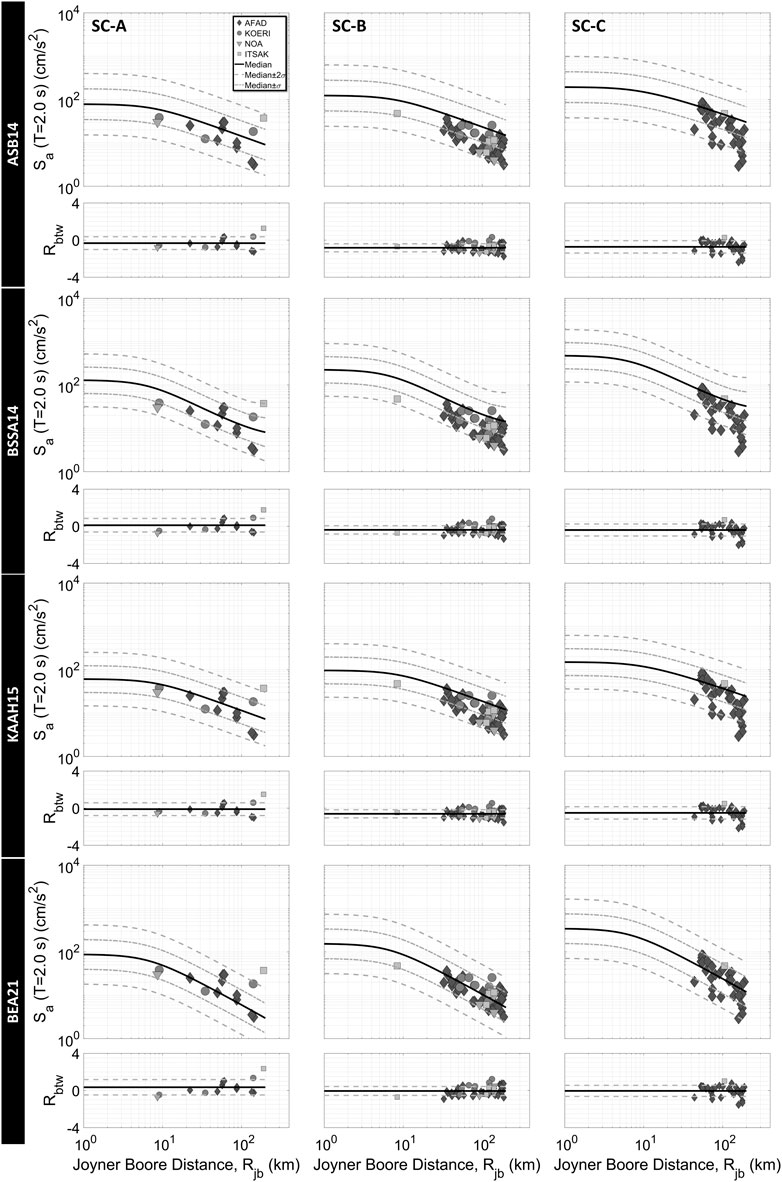
FIGURE 9. Comparison of SAs at T = 2.0 s with GMPEs; Akkar et al., 2014 (ASB14), Boore et al., 2014 (BSSA14), Kale et al., 2015 (KAAH15), and Boore et al., 2021 (BEA21) for the geometric mean of horizontal components and three soil classes (R = Total residual and, solid and dashed lines refer to its mean and mean ± standard deviations in residual graphs).
As previously stated, the higher SAs of the İzmir Basin stiff soil stations (3511, 3514, and 3520, see Figure 8) at T = 1.0 s return to the median lines at the period of 2 s. It should also be noted that their PGAs -zero period spectral acceleration-are also close to the median line. This finding has motivated us to compare the spectral accelerations of these stations with GMPEs through the greater range of periods for the mainshock and the two largest aftershocks. Figure 10 shows the response spectra of the EW and NS components of the station records and GMPEs’ results. As seen in the figure, the peak of response spectra for the observations shifts towards the longer periods compared to the empirical predictions. As a result, the SAs are underpredicted within a specific period range by estimated median lines. Beyond these periods, the SAs are slightly overpredicted for the mainshock. Although similar evaluations are valid for the aftershocks, the difference between the GMPE and the observed peak periods are not as pronounced as much as the mainshock, probably due to the lower long period content of low-magnitude earthquakes. The period of the peak is closer to the period of the empirically estimated maximum in the aftershocks. High SAs unexpectedly observed in longer periods may raise the seismic demand of structures with respective periods, therefore this enigmatic behaviour of stiff soils is crucial.
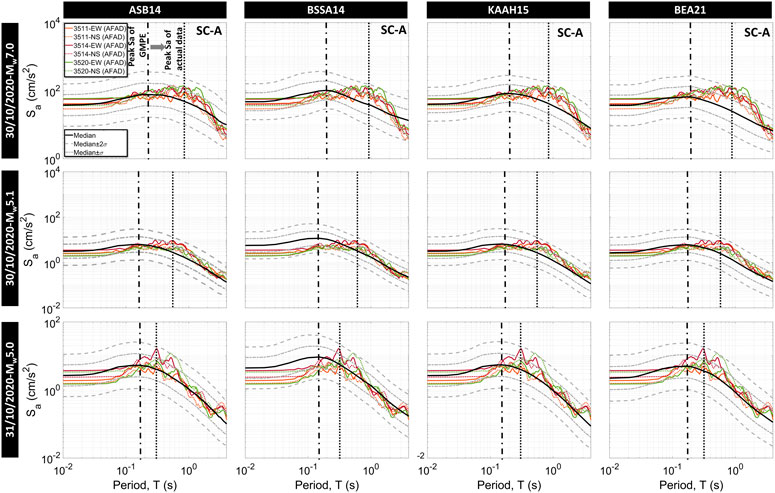
FIGURE 10. Variation of observed SAs and GMPEs with period for Rjb = 58.4 km and Vs,30 = 846 m/s [Akkar et al., 2014 (ASB14), Boore et al., 2014 (BSSA14), Kale et al., 2015 (KAAH15), and Boore et al., 2021 (BEA21)].
The rise in long period content of both soft and stiff soil records has also motivated us to investigate the predictive capability of GMPEs of two cumulative intensity parameters (AI and CAV), which consider the whole duration of the ground motions and are mainly associated with the potential damage, and significant durations (D5-75 and D5-95). Figure 11 compares ground motion parameters of measured data with the estimated values of the SA17. The first significant result is that these plots verify the 60–70 km limit, at which attenuation exhibits different features. It is clear that the AIs and CAVs are highly estimated for soil classes A and B with mainly negative mean residuals. However, SA17 yields slightly more robust estimations for significant durations, which vary majorly between the 16th and 84th percentile estimations. It is also worth noting that any distinctive feature of AI, CAV, and duration parameters of both stiff and soft soil recordings in the İzmir Basin are not detected.
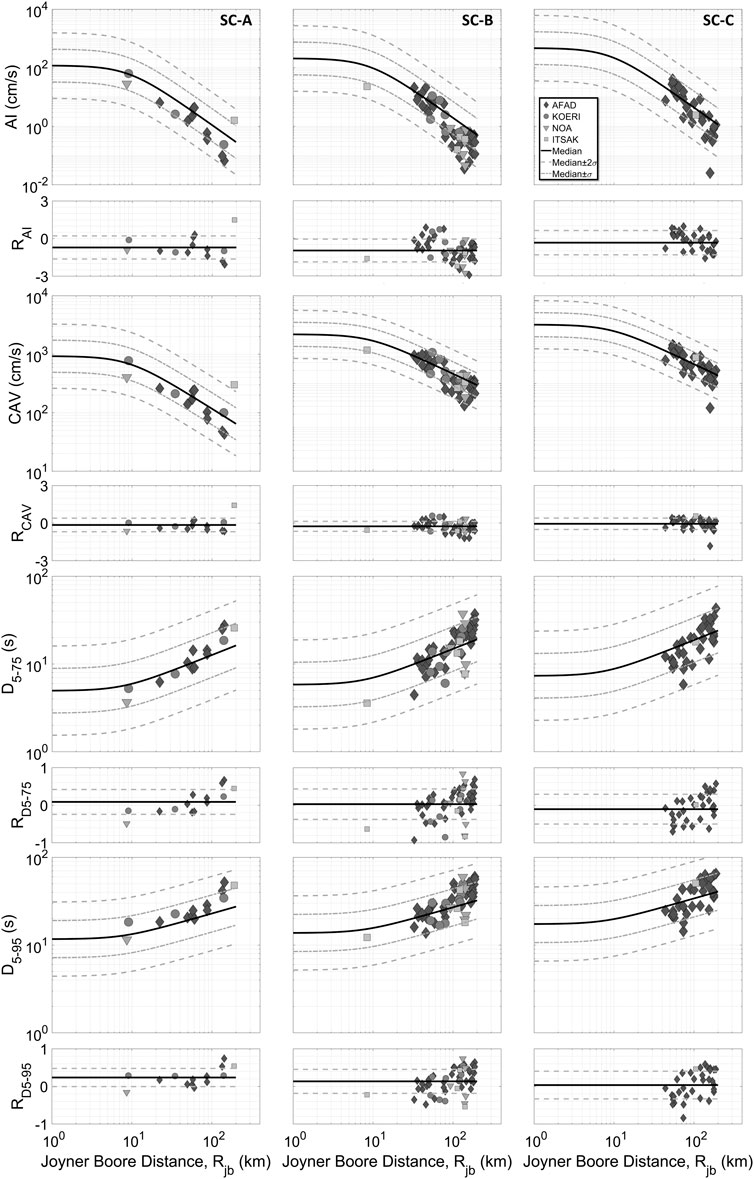
FIGURE 11. Comparison of AIs, CAVs, and significant durations with the equation of Sandikkaya and Akkar, (2017) (SA17) for the geometric mean of horizontal components and three soil classes.
Evaluation of Source Directivity and Azimuthal Impacts
The largest amplitudes, according to Somerville et al., 1997, are more intimately correlated to the fault-normal direction than the fault-parallel direction due to strong S wave radiation. Therefore we check the congruity of the time-varying particle motions of velocity traces with the direction of the causative fault orientation proposed in the literature. Figure 12A demonstrates the polar resultant velocity trajectories of the four closest stations (GMLD, 0905, SAMA and SMG1) with their three-component time histories. The velocity particle motions (especially that of GMLD on the hanging wall) move in the NS direction (fault-normal) and display a robust agreement with the perpendicular direction to the strike, proposed by several studies and earthquake agencies summarized in Supplementary Table S1. This relatively strong velocity polarisation of GMLD may be associated with up-dip directivity. The velocity paths of other closely located stations, SAMA and SMG1, which are settled in the South of the fault rupture (footwall part), indicate a relatively slight correlation along the fault-normal (NS) direction. Dissimilarly, the recordings of the 0905 station do not demonstrate a clearly identifiable polarized velocity path, however, strong velocity amplitudes tend towards a westward direction. Although GMLD and SMG1 display slightly impulsive velocity traces in the NS direction, it is hard to explicitly point out directivity effects in the ground motions.
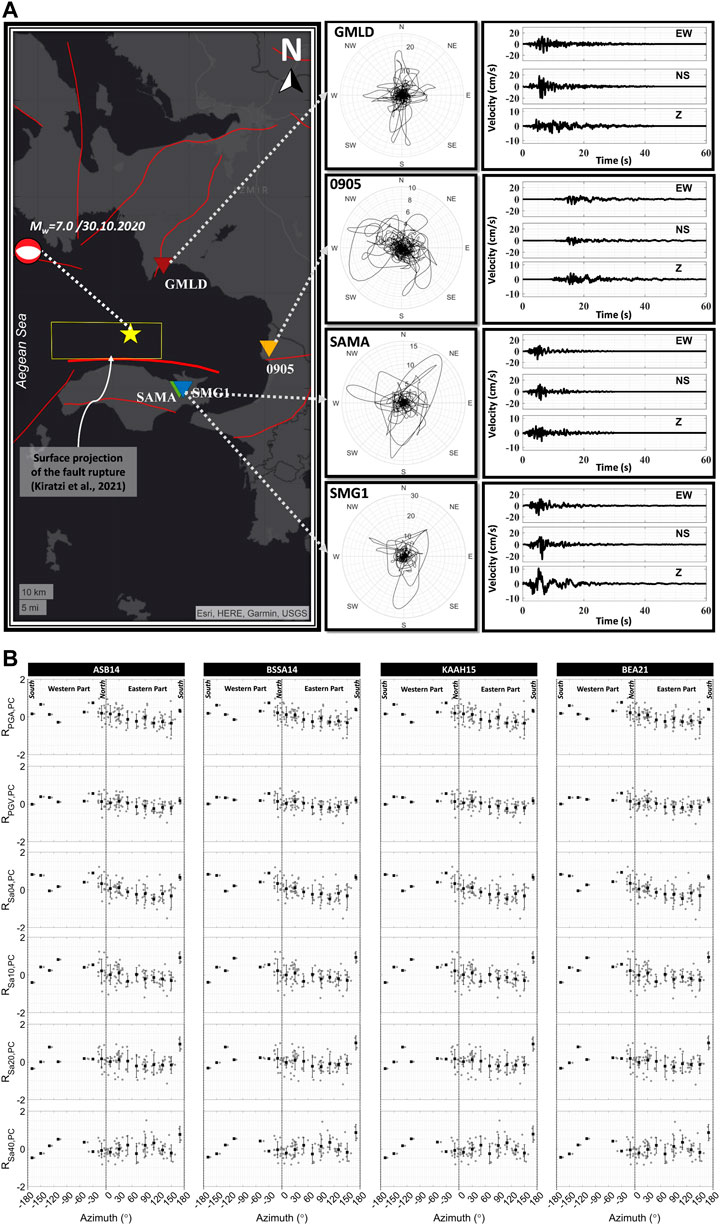
FIGURE 12. (A) Velocity particle motions in polar coordinates and three-component velocity time histories of closest stations, (B)Variation of path-corrected residuals with source-to-station azimuth angles (Black squares refer to the means of 20-degree slices with their standard deviations).
These inferences have also prompted us to delve into the implications of azimuths on ground motion parameters. To investigate azimuthal effects, the variation of path-corrected residuals with source-to-station azimuth, which is the clockwise angle between North and the direction vector drawn from source to station, has been examined. We constructed path-corrected residuals by subtracting the mean of bins with 10 km intervals from each residual value. The mean and standard deviations of path-corrected residuals for each 20-degree azimuth segment have been computed to better understand the azimuthal tendency. Figure 12B demonstrates that the residuals diminish from North to South (in a clockwise direction/towards the east). In the North, the residuals of SA (T = 0.4 s) range from 0.04 (at BEA20) to 0.07 (at ASB14) while these residuals reduce to about -0.3 at 150° azimuth for all GMPEs. The SAs with a period of 4 s, on the other hand, have similar values (about -0.2) at both 10 and 150° azimuth with some fluctuations between these two angles. In other words, this direction-dependent reduction in SAs begins to disappear as the periods increase. It is difficult to determine a definitive judgment for the west side of the epicentre since there are not enough stations within the Aegean Sea. However, several distant stations are located on Greek Islands within this azimuthal range in our database and they result in larger residuals which represent the higher amplitudes than their predicted values. This inference corroborates the statement of “the possibility of a predominantly westward with less eastward directivity” highlighted by Ganas et al., 2021, Kiratzi, et al., 2021 and Taymaz et al., 2022.
Code Spectra Comparison
The last seismic provision of Greece, EAK 2003 (EAK, 2003) incorporates the currently used official seismic hazard map. For Samos, PGAs with a 10% probability of exceedance in the next 50 years (475 years of mean return period) are labelled as Seismic Zone II with 0.24 g (≈235 cm/s2) in this seismic zonation map. The resultant PGAs recorded in the SMG1 station (≈245 cm/s2) and SAMA station (≈176 cm/s2) are slightly greater than the expected PGA value of the zonation map. The currently used Turkish seismic code published in 2018 and enforced in 2019 offers georeferenced based ground motion parameters (PGA, PGV and SAs) for earthquake levels with several specified return periods instead of a conventional seismic zonation map. The superiority of the earthquake hazard map is corroborated by comparing the observed resultant PGAs and PGVs with those of the earthquake hazard map for design basis earthquake (475 years of return period) in Figure 13A. This comparison holds for up to 200 km from the epicentre. All observed values are below the map peak values. However, it is worth noting that the PGVs of the close-to-intermediate-distanced stations seem to be similar to the map values.
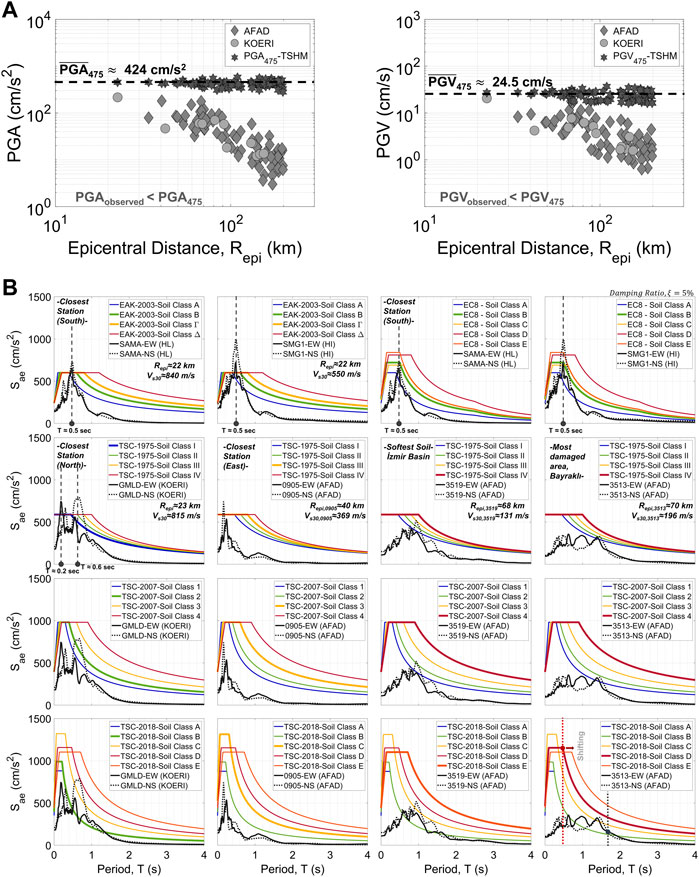
FIGURE 13. (A) Comparison of 475 years return period PGAs and PGVs recommended by Turkey Seismic Hazard Map (TSHM) with geometrical mean of observed values, (B) Comparison of the acceleration response spectra of the recorded ground motions at the closest stations and the most damaged areas against the design spectra recommended in EAK2003 and EC8 seismic codes for Greece and 1975, 2007 and 2018 seismic codes for Turkey).
We have explored whether all acceleration responses are compatible with the expected earthquake elastic design spectra of outdated and currently used seismic codes in Greece and Turkey. First, all acceleration responses within the 200 km epicentral distances have been compared with the elastic design spectra. The stations, which are closest to the epicentre and deployed in soft soils, yield relatively larger responses and only their results are presented in Figure 13B.
Since 2012, EC8 is employed with EAK2003 as the seismic design code in Greece (Nikolaou and Gilsanz, 2015). Both seismic codes provide typical elastic response spectra for four different soil types. However, in the EAK2003’s design spectrum, the plateau corresponding to the highest spectral acceleration only expands to higher periods in softer soils without taking soil amplification into account while EC8 considers the soil amplification by using a constant soil factor, which provides the variation of the level of elastic response spectra equally over all periods. The top row of Figure 13B shows the comparison of elastic pseudo-spectral accelerations for both horizontal components of SMG1 and SAMA, which are the closest stations in Samos, with EAK2003 and EC8 (for Type 1 Earthquake) design spectra for 5 percent damping ratios. At a period of around 0.5 s, both horizontal component records attain their highest SAs and surpass the design spectra of all soil types in EAK 2003. Although EC8 design spectra feature the soil amplification effects, the NS component of SMG1 exceeds the design spectra regardless of the soil classes and its EW component seems at the limit of the corresponding soil class (SCB). The SAs of the SAMA station also exceed the EC8 design spectrum corresponding to soil class A around T = 0.5 s. This finding indicates that the measured Aegean Sea earthquake spectral levels of SAMA and SMG1 stations are not met by the design conditions of both codes, particularly for medium-rise reinforced concrete buildings. This may explain the level of damage in the region.
The elastic response spectra of ground motions from GMLD and 0905 stations, which are the other two close stations to the epicentre in the North and West, respectively are compared with two less stringent Turkish outdated codes (1975 and 2007) and the current 2018 seismic code. Before proceeding with the evaluations, it is beneficial to give an approximate equivalence of the soil classes of three Turkish seismic codes to provide readers with a general overview. While the soil class I and 1 of the 1975 and 2007 seismic regulations (Ministry of Public Works and Settlement, Government of Republic of Turkey, 1975; 2007), respectively, encompass the is based on uniform shear wave velocity soil class A and B of the 2018 seismic provision (Ministry of Public Works and Settlement, Government of Republic of Turkey, 2018), the other soil classes can be considered roughly equivalent for all three earthquake codes. It should be reminded that soil classification in 1975 seismic code is based on uniform shear wave velocity while 2007 and 2018 TSCs consider Vs,30 values in the soil categorisation. However, this equivalency is partially acceptable for a general evaluation.
Similar to SAMA and SMG1 stations, the NS component of the GMLD station demonstrates a peak value at around 0.6 s, while the EW component reaches the peak at shorter periods (T ≈ 0.2 s). Both components at the aforementioned periods exceed the design spectra of the 1975 seismic code for all site classes. Also, SAMA and SMG1 stations show a small peak at this period but it is not as large as the value of the GMLD station. The exceedance around 0.6 s also appears in the comparison with the design spectrum corresponding to the soil class of the station in 2007 and 2018 seismic provisions. However, no heavy damage is recorded except for several lightly damaged buildings in the area (Aktas et al., 2022). Spectral accelerations of the NS component at station 0905 deployed on a site with a Vs,30 value of 369 m/s on the fault-parallel (EW) alignment, surpassed the design spectra of only 1975 seismic provision. However, the station KUSD of KOERI, which is 2 km away from the 0905 station and on extremely stiff ground (Vs,30 ≈ 1,052 m/s), produces lower spectral accelerations (SAmax = 142 cm/s2 at T = 0.2 s).
A similar comparison has been conducted for two selected stations (3513 and 3519) from the most damaged areas in the İzmir Basin. Given that mostly reinforced concrete buildings were constructed after the 1990s in the region, the comparison with outdated design spectra may give an insight into the reasons for the damage. However, Figure 13B indicates that the response spectra of ground motions seem to have good agreement with all design spectra, even those recommended by the 1975 seismic regulations. Therefore, this question should be posed; what are the reasons for the collapsed buildings in the İzmir Basin? According to Erdik et al. (2020), poor compliance with seismic regulations and inadequate construction inspections may be the primary reasons for the destruction.
It should be highlighted that the flat portion of the Soil Class D design spectrum in the 2018 seismic code begins at lower periods but finishes at the periods around when SAs of the 3513 station record tend to display steadiness. In other words, the observed response spectra tend to shift to longer periods. Additionally, the flat region in the design spectrum is narrower than that of the observed spectra. It should be noted that this phenomenon does not give an insight into the damage in the region for this earthquake but may exert an important influence on the future design of the buildings within these period ranges. This incompatibility between code and response spectra has prompted us to investigate their spectral shapes of both mainshock and two largest aftershocks more deeply particularly for İzmir Basin. The comparison of PGA-normalised acceleration response spectra for two soft soil (3513 and 3519) and two stiff soil (3514 and 3520) stations with normalised 475-years return period 2018 TSC spectra are given in Supplementary Figure S1. The normalised spectrum of a recording (station 0905) outside the İzmir Basin is also provided in the same figure to make the comparison more comprehensible. For mainshock record of the station 3513, the normalised spectrum is higher than the corresponding code spectrum along a wide period range between 0.3 and 2.3 s. At station 3519, which is deployed on the softest soil in the database, normalised spectrum exceeds the code spectrum in a shorter period interval between 0.7 and 1.7 s. This inadequacy of the code spectrum might be attributed to soil amplification in this type of soft soils. However, interestingly, the normalised spectra of stiff soil records (stations 3514 and 3520) in the İzmir Basin exhibit higher values than the code spectrum in a similar period range like the soft soil recordings. Moreover, the code spectrum is below the normalised response spectrum along a narrower period range between 0.1 and 0.3 s at 0905 station, which is deployed on medium-stiff soil outside the İzmir Basin. These findings corroborate the previously mentioned argument that stiff soil recordings in the İzmir Basin are richer in terms of long period content than those from outside the Basin. Also, similar implications can be reached for the smaller magnitude (MW5.1 and MW5.0) aftershocks over a shorter period range. Furthermore, nine RC buildings collapsed in the Bayraklı and Bornova districts, which resulted in the majority of the casualties and losses and it should be emphasize that the number of storeys in seven of those ranges from seven to eleven (Aktas et al., 2021). Herein, it should be emphasized that the structural period of the buildings at this height fall within the period range where the observed normalised SAs exceed the code spectrum.
The preceding discussions explicitly evidence the site effects in the İzmir Basin. For the sake of integrity throughout all evaluations, horizontal to vertical spectral ratios (HVSR) (Nakamura, 1989) are also computed for S wave portions, whose Fourier Amplitude Spectrum (FAS) has been smoothed by Konno-Omochi window (window bandwidth = 40) (Supplementary Figure S1). The frequency dependent amplification of soft soil recordings (stations 3513 and 3519) are immediately apparent in the relatively low frequency range, particularly at 0.3 and 1.5 Hz. For the stiff soils (stations 3514 and 3520), although a slight bump may be detected around 0.4 and 1.0 Hz, this increase is not accepted as exact evidence for the soil amplification of stiff soils. The more detailed evaluations for the mainshock-induced soil implications in the İzmir Bay can be found in the study of Cetin et al. (2022).
Evaluation of Duration in Terms of 3D Response Spectrum Concept
The duration of earth-shaking is another notable feature characterising the ground motion. Past earthquake experiences provide valuable information on the effect of duration on structural damages (Bommer et al., 2004). There are many different definitions of strong ground motion durations, which have been developed using considerably different methodologies (Bolt, 1973; Trifunac and Brady, 1975; Perez, 1977; Sarma and Casey, 1990; Bommer and Martínez-Pereira, 1999). We have utilised the concept of 3D velocity response spectra proposed by Safak (1998) since this methodology considers the ground motion duration together with the structural response. 2D response spectrum is constructed by combining the largest absolute peaks of SDOFs’ responses to ground motions. The study proposes to add a third axis showing the subsequent largest peaks. Furthermore, a new intensity measure is defined analogously to spectral intensity. Instead of the area under the velocity response spectrum, the volume of the 3D response spectrum is calculated to consider the duration of the assessment of structural damage.
The 5% damped 3D velocity response spectra and associated volumes have been computed for all recordings of the mainshock in our database. The maximum peak number has been restricted to 20 to establish a feasible comparison among ground motion records. We compared the volume of 3D velocity response spectra (VolSv) with the conventional Housner’s spectral intensity (SI) to account for the variation of duration effects on a record-by-record basis. The period interval of 3D response spectra has been chosen as 0.1–2.5 s, similar to Housner’s intensity definition. The ratio of the VolSv to SI, which represents the unit volume per area, has been calculated and normalised to the maximum of the ratio for both EW and NS components of the ground motion. This normalised ratio refers to a geometric parameter which relatively denotes the duration implications. The contribution of the duration, i.e., secondary peaks, is maximized if this normalised ratio equals 1. However, it does not offer insight into the level of intensity measures. The SI and VolSv values are also normalised to their respective amplitudes at the minimum value of VolSv/SI ratio and plotted with respect to the normalised VolSv/SI ratio, to make the effect of duration easily identifiable (Figure 14A).
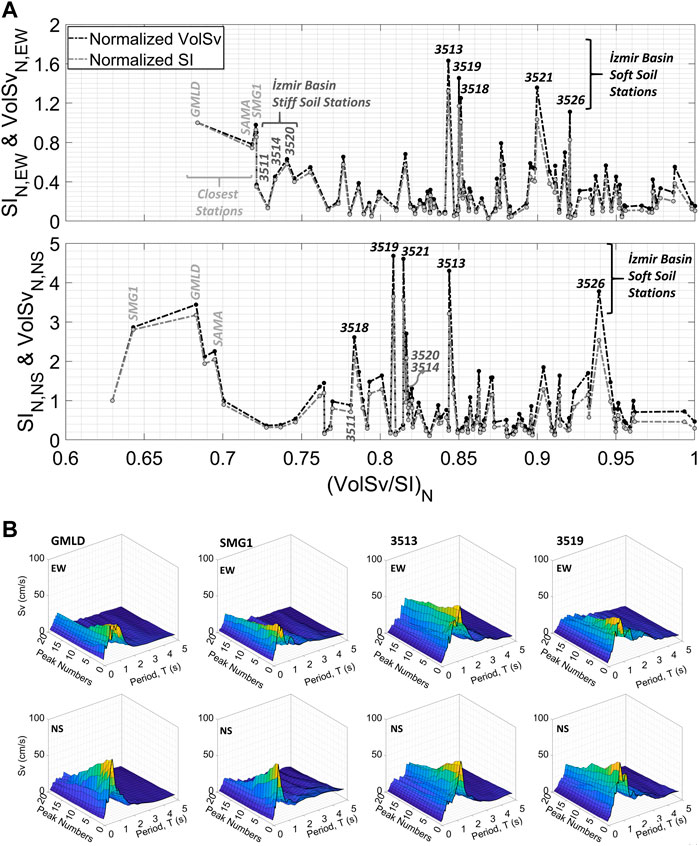
FIGURE 14. (A)The variation of normalised Housner’s spectral intensities (SI) and the volumes of 3D velocity response spectra (VolSv) with the normalised ratio of VolSv/SI, (B) 3D velocity response spectra (5% damped) of the recorded ground motions at the closest stations (GMLD and SMG1) and most damaged areas (3513 in Bayraklı–soft soil in the most damaged area) and 3519 in Karşıyaka–station on softest soil in the database).
The first insight from Figure 14A is that the effect of the secondary peaks do not considerably change the normalised VolSv and SI level in both component records of the spatially close stations. In the EW direction, GMLD becomes a reference station with the minimum value of normalised VolSv/SI ratio for the normalization and SMG1 and SAMA follow it. Another less affected significant group by the duration is the stiff soil recordings (stations 3511, 3514 and 3520) of the İzmir Basin. While a similar trend is valid for the NS component of the close stations. The NS components of the stiff soil recordings are more prone to secondary peaks of the ground motion. The effect of duration is also prominent in the soft soil recordings (stations; 3513, 3518, 3519 and 3521) of the İzmir Basin. When compared with the SI, the volume of 3D response spectra exhibits a higher energy release in these recordings. Despite being located outside the edge of the İzmir Basin, the soft soil station 3526 (Vs,30 ≈ 200 m/s) is another recording influenced by the duration. The previous discussions give an insight into whether the secondary peaks, and therefore duration, decrease or increase the energy level of the ground motions. The 5% damped 3D velocity response spectra of four significant station records are also illustrated in Figure 14B. The continuity of the high-amplitude secondary peaks is easily detected in the soft soil recordings (stations 3513 and 3519). In contrast, the relatively sharper decay of GMLD and SMG1 recordings is especially explicit in the NS component.
Comparison of Damage Indicators
Numerous ground motion parameters such as peak ordinates, SAs, intensity measures, etc. which represent the different features of the ground motions, may be correlated to identify the potential destructiveness of the earthquakes. Until here, this study has focused on a detailed evaluation of widely used ground motion parameters. In light of our previous results, we have made an approximate evaluation of the relation between the spatial distribution of the several ground motion parameters and the damaged sites. In addition to AI, SI and VolSv, which take into account the frequency content of the strong ground motion traces, the specific referential energy
The specific referential energy,
In which,
Where, PGV and Ds correspond to peak ground velocity and the significant duration proposed by Trifunac and Brady, (1975). JI has been calculated for both D5-75 and D5-95.
To identify whether the normalised geometrical mean of the aforementioned six ground motion parameters yields a good spatial correlation with the structural damage due to the mainshock, their positional distributions are roughly generated as illustrated in Figure 15. The observational damage dispersion of the earthquake is comprehensively elaborated in Aktas et al., 2022. The study particularly underlines the building and infrastructure damage densified in Bayraklı and Bornova districts (Repi≈70 km, İzmir Basin) in Turkey and the northern part of the Samos (Karlovasi, Kokkari and Vathi) Island in Greece. SI and damage parameters,
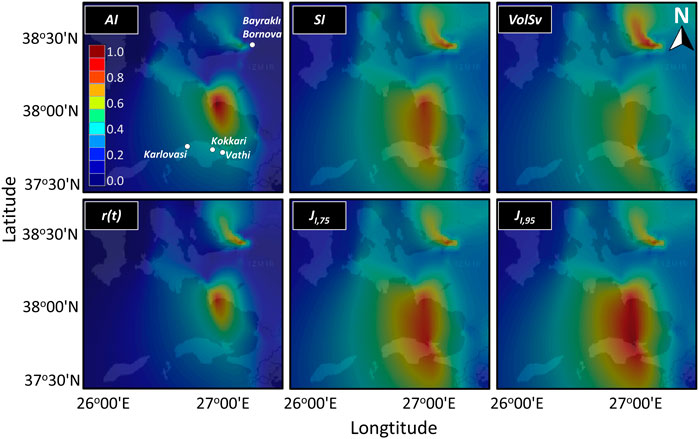
FIGURE 15. Positional distribution of the normalised geometrical mean of several damage indicator ground motion parameters (AI, Arias Intensity; SI, Spectral Intensity; VolSv, Volume of 3D velocity response spectra, r(t), Specific Referential Energy, JI,75 and JI,95, damage factor based on significant durations, D5-75 and D5-95, respectively).
Concluding Remarks
The 2020, MW 6.9 Aegean Sea earthquake has been evaluated through the well-distributed strong ground motion networks in the region. The limited number of strong ground motion stations in Samos Island hinders the meaningful correlation between the consequences of the earthquake and the related ground motion parameters. The NS (fault-normal direction) recording of the spatially closest station SMG1 produces the strongest PGA and PGV of 232 cm/s2 and 25 cm/s, respectively. The lower peak values of the SAMA station located at a similar distance can be explained by its stiffer soil conditions. It is important to note that the PGV at the softest soil station in the İzmir Basin, located 70 km from the epicentre, produces higher values than the closest stations (GMLD and SAMA). This high PGV may be accepted as a preliminary indicator for damage in the İzmir Basin. The largest AI and SI, on the other hand, are discovered in the NS component of station GMLD’s recording, which is positioned on the hanging wall site. In addition to the high peak amplitudes of the stations on the soft soils and intermediate distances (mainly İzmir Basin stations), large energy accumulations are also observed. The estimation power of the GMPEs is investigated through the comparison of predictions and actual values of ground motion parameters as well as residual analyses considering the specific soil conditions and distances of the data points. The GMPEs of Akkar et al., 2014 (ASB14), Boore et al., 2014 (BSSA14), and Kale et al., 2015 (KAAH15) showcase similar patterns and offer larger values for distances greater than 60–70 km from the surface projection of the rupture. For distances greater than 70 km, the faster attenuation is also visible in the comparison plot of AI, CAV, and significant durations with the GMPE of Sandikkaya and Akkar, (2017). Moreover, this faster attenuation after 70 km may be attributed to the regional influences since this attenuation variation is captured by only the region-specific derived GMPE, BEA21. However, BEA21 majorly gives smaller median estimations at T = 1 s while the other three GMPEs yield greater SAs. Nevertheless, in the İzmir Basin, in which earthquake-induced structural collapses occurred, both soft and stiff soil SAs at T = 1 s yield larger values than all GMPEs’ estimations. The variation of spectral accelerations of stiff soil records in the İzmir Basin has been calculated through a set of periods for the mainshock and the two largest aftershocks, and the period corresponding to the maximum estimated SA appears to remain at smaller values when compared to the observed data. These high spectral accelerations in the unanticipated higher period range may raise the seismic demand of structures with similar periods, so this behaviour of stiff soils is noteworthy. For the closest stations, high values of the fault-normal (NS) particle velocities provide a consistent match with the fault plane solutions in the recent literature. This direction based high values is remarkably pronounced in the station GMLD, which is located on the hanging wall part. The variation of path-corrected residuals with source-to-station azimuths unveils a systematically North-to-South reduction of residuals in the East of the epicentre. Although the limited data precludes us from making any definite conclusions, we discern a greater residual tendency westward of the epicentre. Actual PGAs of the mainshock appear to be lower than 50% of the PGAs provided by both Greek and Turkish seismic codes, with a 10% probability of exceedance in 50 years; however, spectral accelerations of closely located stations (SAMA, SMG1 and GMLD) surpass both obsolete and contemporary code design spectra. Unexpectedly, the acceleration response spectra of soft soil ground motions in the İzmir Basin yield lower spectral accelerations than all code design spectra. On the other hand, it is worth remembering that the high level of spectral accelerations of the measured response spectra extends to longer periods than those of the design spectra. Moreover, the spectral shape incompatibility between normalised response spectra for soft and stiff soil recordings in İzmir Basin and normalised 475-years return period TSC2018 (Ministry of Public Works and Settlement, Government of Republic of Turkey, 2018) spectra validate the former argument. Additionally, HVSR amplitudes of soft soil recordings (station 3513 and 3519) in the İzmir Basin imply soil amplifications in the relatively low-frequency range (0.3–1.5 Hz). The 3D response spectra concept highlights the large energy release in the soft soil recordings as a result of the contribution of secondary peaks, i.e., duration of ground motion when compared to the spectral intensities. The spatial comparison of SI, VolSv, JI and r(t) captures damages in the Bornova-Bayraklı region, the most damaged area in Turkey. On the other hand, the lack of stations on Samos Island hinders the comprehensive evaluation of the ground motion parameters with observed damages on the Island. The enhancement of the station network on Samos Island would benefit future evaluations of potential seismic events, especially given the tectonic regime and many regional active faults that surround Samos.
Discussion
This study offers a comprehensive assessment based on strong ground motion recordings of 30 October Aegean Sea earthquake, which occur in a complex tectonic structure and high seismically active area, accompanied with damage observations from the EEFIT reconnaissance mission. The variation in basic but robust ground motion parameters such as peak ground amplitudes, spectral ordinates, AI, CAV, SI and duration parameters, with distance from the earthquake and soil conditions enable us to roughly assess the earthquake-induced damage. As expected, the closest stations to the epicentre have the highest values of acceleration-based parameters, whereas similar or even higher values of velocity-based parameters (PGV, SI, VolSv, r(t), JI,75 and JI,95) with nearby stations to the epicentre are resulted in the Bayraklı and Bornova region (Repi ≈ 70 km), where mid-rised RC buildings collapsed, causing fatalities and losses.
The selection of the most compatible GMPE to the region will undoubtedly be an essential component in the seismic hazard and risk assessments that will be conducted for the region. The faster attenuation of observed ground motion parameters beyond the 60–70 km band are not captured by ASB14, BSSA14 and KAAH15, which includes earthquakes from various regions in their databases. BEA21, on the other hand, which is entirely generated based on Greek earthquakes, appears to be compatible with this distinct attenuation. This circumstance clearly indicates that local-based estimation of ground motion parameters will yield more realistic results. In both soft and stiff soil stations in İzmir Basin, the highest spectral accelerations are detected at longer periods than those estimated empirically. This phenomenon could be a sign of the regional feature peculiar to the İzmir Basin. The influence of secondary peaks in the 3D velocity spectrum, which accounts for the duration of the earthquake, is similar to soft soils, notably in the NS components (fault-normal direction), probably due to the unexpectedly high period content of stiff soil recordings in the İzmir Basin. Furthermore, both soft and stiff soil records produce substantial spectral accelerations beyond the flat part of the current TSC spectrum. Although the observed response spectra seem lower than the 475-years return period TSC spectra released in 1975, 2007, and 2018, the comparison of the PGA-normalised spectra reveals that the mismatch between the shapes of the code and observed response spectra. Given all of the preceding, it is worth noting that the distinct behaviour of stiff soils in the Bayraklı and Bornova region poses an essential design concern. Furthermore, all these findings point to the need for a comprehensive site investigation and regional studies, particularly in the İzmir Basin.
Data Availability Statement
Publicly available datasets were analyzed in this study. This data can be found here: https://tadas.afad.gov.tr/list-event; AFAD, http://www.koeri.boun.edu.tr/sismo/2/deprem-verileri/sayisal-veriler/; Bogazici University, KOERI, http://www.itsak.gr/en/db/data/sm/after2000; ITSAK, https://accelnet.gein.noa.gr; NOA.
Author Contributions
AO’K and FM designed the project and undertook the initial seismological and ground motion analysis as part of the 2020 Aegean IStructE EEFIT mission, led by YA. FM evaluated the ground motion parameters, generated the MATLAB routines, and prepared the manuscript whilst AO’K evaluated the seismotectonics and geological aspects of the study. KD performed an analysis of the aftershock sequences and contribute the calculation of ground motion analysis and YA evaluated the structural damage from the earthquake. All authors contributed to the writing of this paper, led by FM and their names are ordered alphabetically.
Funding
Learning from Earthquake (LfE) Building Resilient Communities Through Earthquake Reconnaissance, Response and Recovery (EP/P025641/1). AO’K was funded by an EPSRC iCASE PhD Studentship in collaboration with Ove Arup and Partners Ltd (Grant Reference: 2117461).
Conflict of Interest
The authors declare that the research was conducted in the absence of any commercial or financial relationships that could be construed as a potential conflict of interest.
Publisher’s Note
All claims expressed in this article are solely those of the authors and do not necessarily represent those of their affiliated organizations, or those of the publisher, the editors and the reviewers. Any product that may be evaluated in this article, or claim that may be made by its manufacturer, is not guaranteed or endorsed by the publisher.
Acknowledgments
This study was carried out as an extension to the EEFIT Mission to 30 October 2020 Aegean Earthquake and Tsunami, and the authors are grateful to EEFIT and the EPSRC-funded Learning from Earthquake (LfE) Building Resilient Communities Through Earthquake Reconnaissance, Response and Recovery (EP/P025641/1) for supporting this activity. We cordially thank our field crews in Turkey and Greece. We are also indebted to the communities in the affected areas for their help and support during the data collection. All pictures are property of the EEFIT Aegean Mission Team, unless otherwise stated. The authors are grateful to Erdal Şafak for providing some MATLAB codes and accessing several pieces of literature. This paper also has benefited from invaluable discussions with Paul W. Burton and Eser Çaktı. We also express our appreciations to Enrico Tubaldi, Rajesh Rupakhety, Bogdan Grecu and, Alexandru Tiganescu, who contributed to the review of Bogdan Grecu, for editing, reviewing the manuscript and providing fruitful comments and suggestions.
Supplementary Material
The Supplementary Material for this article can be found online at: https://www.frontiersin.org/articles/10.3389/fbuil.2022.870279/full#supplementary-material
Supplementary Figure S1 | (Left) Comparison of normalised acceleration response spectra with 475-year return period TSC (2018) spectra for corresponding soil classes, (Right) HVSR amplitudes for mainshock and aftershock recordings of stations 3519, 3513, 3514 3520 and 0905.
Supplementary Table S1 | Summary list of finite fault solutions given by different earthquake agencies and studies.
Footnotes
1Pınar, A. (2020). Conversation with Prof. Ali Pınar, December. personal communincation.
References
Akinci, A., Cheloni, D., and Dindar, A. A. (2021). The 30 October 2020, M7.0 Samos Island (Eastern Aegean Sea) Earthquake: Effects of Source Rupture, Path and Local-Site Conditions on the Observed and Simulated Ground Motions. Bull. Earthq. Eng. 19, 4745–4771. doi:10.1007/s10518-021-01146-5
Akkar, S., and Özen, Ö. (2005). Effect of Peak Ground Velocity on Deformation Demands for SDOF Systems. Earthq. Engng Struct. Dyn. 34, 1551–1571. doi:10.1002/eqe.492E
Akkar, S., Sandıkkaya, M. A., and Bommer, J. J. (2014). Empirical Ground-Motion Models for Point- and Extended-Source Crustal Earthquake Scenarios in Europe and the Middle East. Bull. Earthq. Eng. 12, 359–387. doi:10.1007/s10518-013-9461-4
Aksu, A. E., Piper, D. J. W., and Konuk, T. (1987). Late Quaternary Tectonic and Sedimentary History of Outer Izmir and Candarli Bays, Western Turkey. Mar. Geol. 76, 89–104. doi:10.1016/0025-3227(87)90019-3
Aktas, Y. D., Ioannou, I., Malcioglu, F. S., Kontoe, M., Parammal Vatteri, A., Durmaz, B., et al. (2022). Hybrid Earthquake Reconnaissance Mission to 30 October 2020 Aegean Sea Earthquake and Tsunami: Description of Data Collection Methods and Damage. Front. Built Environ. Earthq. Eng. 8, 1–23. doi:10.3389/fbuil.2022.840192
Aktas, Y. D., O'Kane, A., Ozden, A. T., Parammal Vatteri, A., Durmaz, B., Kazantzidou-Firtinidou, D., et al. (2021). The Aegean Earthquake and Tsunami of 30 October 2020. London: EEFIT. Technical Report.
Allen, T. I., and Wald, D. J. (2007). Topographic Slope as a Proxy for Global Seismic Site Conditions (Vs30) and Amplification Around the Globe. Reston, Virginia, USA: U.S. Geological Survey. Open-File Report 2007–1357.
Ambraseys, N. N. (2009). Earthquakes in the Mediterranean and Middle East: A Multidisciplinary Study of Seismicity up to 1900. Cambridge, UK: Cambridge University Press.
Anderson, J. G., Lee, Y., Zeng, Y., and Day, S. (1996). Control of Strong Motion by the Upper 30 Meters. Bull. Seism. Soc. Am. 86 (6), 1749–1759. doi:10.1785/BSSA0860061749
Arias, A. (1970). A Measure of Earthquake Intensity. Seismic Design for Nuclear Power Plants. Editor R. J. Hansen (Cambridge, MA: MIT Press), 438–483.
Askan, A., Gülerce, Z., Roumelioti, Z., Sotiriadis, D., Melis, N. S., Altindal, A., et al. (2021). The Samos Island (Aegean Sea) M7.0 Earthquake: Analysis and Engineering Implications of Strong Motion Data. Bull. Earthq. Eng. doi:10.1007/s10518-021-01251-5
Atik, L. A., Abrahamson, N., Bommer, J. J., Scherbaum, F., Cotton, F., and Kuehn, N. (2010). The Variability of Ground-Motion Prediction Models and its Components. Seismol. Res. Lett. 81, 794–801. doi:10.1785/gssrl.81.5.794
Bard, P.-Y., and Bouchon, M. (1985). The Two-Dimensional Resonance of Sediment-Filled Valleys. Bull. Seismol. Soc. Am. 75 (2), 519–541. doi:10.1785/BSSA0750020519
Benedetti, D., Carydis, P., and Limongelli, M. P. (2001). Evaluation of the Seismic Response of Masonry Buildings Based on Energy Functions. Earthq. Engng. Struct. Dyn. 30 (7), 1061–1081. doi:10.1002/eqe.52
Bolt, B. A. (1973). “Duration of Strong Ground Motion,” in 5th World Conference on Earthquake Engineering (Rome, Italy: International Association for Earthquake Engineering (IAEE)).
Bommer, J. J., Magenes, G., Hancock, J., and Penazzo, P. (2004). The Influence of Strong-Motion Duration on the Seismic Response of Masonry Structures. Bull. Earthq. Eng. 2 (1), 1–26. doi:10.1023/B:BEEE.0000038948.95616.BF
Bommer, J. J., and Martínez-pereira, A. (1999). The Effective Duration of Earthquake Strong Motion. J. Earthq. Eng. 3 (2), 127–172. doi:10.1080/13632469909350343
Boore, D. M., Stewart, J. P., Seyhan, E., and Atkinson, G. M. (2014). NGA-West2 Equations for Predicting PGA, PGV, and 5% Damped PSA for Shallow Crustal Earthquakes. Earthq. Spectra 30, 1057–1085. doi:10.1193/070113EQS184M
Boore, D. M., and Bommer, J. J. (2005). Processing of Strong-Motion Accelerograms: Needs, Options and Consequences. Soil Dyn. Earthq. Eng. 25 (2), 93–115. doi:10.1016/j.soildyn.2004.10.007
Boore, D. M., and Joyner, W. B. (1997). Site Amplifications for Generic Rock Sites. Bull. Seism. Soc. Am. 87 (2), 327–341. doi:10.1785/BSSA0870020327
Boore, D. M., Stewart, J. P., Skarlatoudis, A. A., Seyhan, E., Margaris, B., Theodoulidis, N., et al. (2021). A Ground-Motion Prediction Model for Shallow Crustal Earthquakes in Greece. Bull. Seismol. Soc. Am. 111, 857–874. doi:10.1785/0120200270
Bradley, B. A. (2015). Correlation of Arias Intensity with Amplitude, Duration and Cumulative Intensity Measures. Soil Dyn. Earthq. Eng. 78 (2015), 89–98. doi:10.1016/j.soildyn.2015.07.009
Burton, P. W., Xu, Y., Qin, C., Tselentis, G.-A., and Sokos, E. (2004). A Catalogue of Seismicity in Greece and the Adjacent Areas for the Twentieth Century. Tectonophysics 390 (1-4), 117–127. doi:10.1016/j.tecto.2004.03.020
Cetin, K. O., Altun, S., Askan, A., Akgün, M., Sezer, A., Kıncal, C., et al. (2022). The Site Effects in Izmir Bay of October 30 2020, M7.0 Samos Earthquake. Soil Dyn. Earthq. Eng. 152, 107051. doi:10.1016/j.soildyn.2021.107051
Chatzipetros, A., Kiratzi, A., Sboras, S., Zouros, N., and Pavlides, S. (2013). Active Faulting in the North-Eastern Aegean Sea Islands. Tectonophysics 597-598, 106–122. doi:10.1016/j.tecto.2012.11.026
Chousianitis, K., and Konca, A. O. (2021). Rupture Process of the 2020 M W 7.0 Samos Earthquake and its Effect on Surrounding Active Faults. Geophys. Res. Lett. 48, e2021GL094162. doi:10.1029/2021GL094162
Coskun, S., Dondurur, D., Cifci, G., Aydemir, A., Gungor, T., and Drahor, M. G. (2017). Investigation on the Tectonic Significance of Izmir, Uzunada Fault Zones and Other Tectonic Elements in the Gulf of Izmir, Western Turkey, Using High Resolution Seismic Data. Mar. Petroleum Geol. 83, 73–83. doi:10.1016/j.marpetgeo.2017.03.010
Demographia (2021). Demographia World Urban Areas: 17th Annual Edition. Bellevill, IL: Wendell Cox Consultancy. Available at: http://www.demographia.com/db-worldua.pdf (Accessed January 08, 2022).
Disaster and Emergency Management Authority (AFAD) (2020). 1900 – 2020 Earthquake Catalog (M >= 4.0). Ankara, Turkey. Available at: https://deprem.afad.gov.tr/depremkatalogu/(Accessed November 11, 2020).
Disaster and Emergency Management Authority (AFAD) (2021). Disaster and Emergency Management Authority. Available at: https://deprem.afad.gov.tr/ddakatalogu (Accessed July, 2021).
Douglas, J. (2003). Earthquake Ground Motion Estimation Using Strong-Motion Records: a Review of Equations for the Estimation of Peak Ground Acceleration and Response Spectral Ordinates. Earth-Science Rev. 61, 43–104. doi:10.1016/S0012-8252(02)00112-5
Douglas, J., and Edwards, B. (2016). Recent and Future Developments in Earthquake Ground Motion Estimation. Earth-Science Rev. 160, 203–219. doi:10.1016/j.earscirev.2016.07.005
Dziewonski, A. M., Chou, T.-A., and Woodhouse, J. H. (1981). Determination of Earthquake Source Parameters from Waveform Data for Studies of Global and Regional Seismicity. J. Geophys. Res. 86 (2), 2825–2852. doi:10.1029/JB086iB04p02825
Ekström, G., Nettles, M., and Dziewoński, A. M. (2012). The Global CMT Project 2004-2010: Centroid-Moment Tensors for 13,017 Earthquakes. Phys. Earth Planet. Interiors 200-201, 1–9. doi:10.1016/j.pepi.2012.04.002
England, P., Houseman, G., and Nocquet, J.-M. (2016). Constraints from GPS Measurements on the Dynamics of Deformation in Anatolia and the Aegean. J. Geophys. Res. Solid Earth 121 (12), 8888–8916. doi:10.1002/2016JB013382
Erdik, M., Demircioglu, M. B., Demircioğlu, M., and Tüzün, C. (2020). Forensic Analysis Reveals the Causes of Building Damage in İzmir in the Oct. 30 Aegean Sea Earthquake. Temblor. doi:10.32858/temblor.139
Eurocode (2004). EC8: Design of Structures for Earthquake Resistance - Part 1: General Rules, Seismic Actions and Rules for Buildings, European Standard EN 1998-1:2004. Brussels: European Committee for Standardization.
Evelpidou, N., Melini, D., Pirazzoli, P. A., and Vassilopoulos, A. (2014). Evidence of Repeated Late Holocene Rapid Subsidence in the SE Cyclades (Greece) Deduced from Submerged Notches. Int. J. Earth Sci. Geol. Rundsch) 103 (1), 381–395. doi:10.1007/s00531-013-0942-0
Eyidoğan, H. (2020). Report on the Seismological Characteristics and Effects of the 30 October 2020 Samos-Kuşadası Bay Earthquake (MW7.0) in the Western Aegean Sea [Preprint]. ResearchGate. Available at: https://www.researchgate.net/profile/Haluk_Eyidogan/publication/(Accessed January, 2022).
Fajfar, P., Vidic, T., and Fischinger, M. (1989). Seismic Demand in Medium- and Long-Period Structures. Earthq. Engng. Struct. Dyn. 18, 1133–1144. doi:10.1002/eqe.4290180805
Ganas, A., Elias, P., Briole, P., Valkaniotis, S., Escartin, J., Tsironi, V., et al. (2021). Co-seismic and Post-seismic Deformation, Field Observations and Fault Model of the 30 October 2020 Mw = 7.0 Samos Earthquake, Aegean Sea. Acta Geophys. 69, 999–1024. doi:10.1007/s11600-021-00599-1
Gutenberg, B., and Richter, C. F. (1949). Seismicity of the Earth and Associated Phenomena. New Jersey: Princeton University.
Housner, G. W. (1952). “Spectrum Intensities of Strong-Motion Earthquakes,” in Proceedings of the Symposium on Earthquake and Blast Effects on Structures (Los Angeles, California: UCLA), 20–36.
Institute of Engineering Seismology and Earthquake Engineering (ITSAK) (2020). ITSAK Shake Map: Northern Coast of W. Turkey. Available at: http://shakemaps.itsak.gr/auth2020vimx/intensity.html (Accessed January 21, 2022).
Jackson, J. (1994). Active Tectonics of the Aegean Region. Annu. Rev. Earth Planet. Sci. 22 (1), 239–271. doi:10.1146/annurev.ea.22.050194.001323
Jackson, J. A., Gagnepain, J., Houseman, G., King, G. C. P., Papadimitriou, P., Soufleris, C., et al. (1982). Seismicity, Normal Faulting, and the Geomorphological Development of the Gulf of Corinth (Greece): the Corinth Earthquakes of February and March 1981. Earth Planet. Sci. Lett. 57 (2), 377–397. doi:10.1016/0012-821X(82)90158-3
Jackson, J., McKenzie, D., Priestley, K., and Emmerson, B. (2008). New Views on the Structure and Rheology of the Lithosphere. J. Geol. Soc. 165 (2), 453–465. doi:10.1144/0016-76492007-109
Jackson, J., and McKenzie, D. (1988). Rates of Active Deformation in the Aegean Sea and Surrounding Regions. Basin Res. 1 (3), 121–128. doi:10.1111/j.1365-2117.1988.tb00009.x
Kale, O., Akkar, S., Ansari, A., and Hamzehloo, H. (2015). A Ground-Motion Predictive Model for Iran and Turkey for Horizontal PGA, PGV, and 5% Damped Response Spectrum: Investigation of Possible Regional Effects. Bull. Seismol. Soc. Am. 105 (2A), 963–980. doi:10.1785/0120140134
Kandilli Observatory and Earthquake Research Institute (KOERI) (2021). Data from: B.U. KOERI-RETMC Earthquake Catalog Search System. Available at: http://www.koeri.boun.edu.tr/sismo/2/earthquake-catalog/(Accessed January 21, 2022).
Karakostas, V., Tan, O., Kostoglou, A., Papadimitriou, E., and Bonatis, P. (2021). Seismotectonic Implications of the 2020 Samos, Greece, Mw 7.0 Mainshock Based on High-Resolution Aftershock Relocation and Source Slip Model. Acta Geophys. 69, 979–996. doi:10.1007/s11600-021-00580-y
Kassaras, I., Kapetanidis, V., Ganas, A., Tzanis, A., Kosma, C., Karakonstantis, A., et al. (2020). The New Seismotectonic Atlas of Greece (v1.0) and its Implementation. Geosciences 10 (11), 447. doi:10.3390/geosciences10110447
Kiratzi, A., Papazachos, C., Özacar, A., Pinar, A., Kkallas, C., and Sopaci, E. (2021). Characteristics of the 2020 Samos Earthquake (Aegean Sea) Using Seismic Data. Bull. Earthq. Eng. doi:10.1007/s10518-021-01239-1
Kotinas, V. A. (2021). A GIS Based Methodology to Obtain the Hydrological Response to Storm Events of Small Coastal Basins, Prone to Flash Flooding. Int. J. Environ. Clim. Chang. 11 (5), 163–171. doi:10.9734/ijecc/2021/v11i530417
Kourouzidis, M. C. (2003). Study of Seismic Sequences in Greece and its Contribution to Earthquake Prediction (Greece: University of Thessaloniki). [PhD Thesis].
Lekkas, E., Mavroulis, S., Gogou, M., Papadopoulos, G. A., Triantafyllou, I., Katsetsiadou, K. N., et al. (2020). The October 30, 2020 MW 6.9 Samos (Greece) Earthquake in Newsletter of Environmental, Disaster and Crises Management Strategies (Athens, Greece: Department of Geology and Geoenvironment of the National and Kapodistrian University of Athens), 21. doi:10.13140/RG.2.2.13630.10561
Makropoulos, K., Kaviris, G., and Kouskouna, V. (2012). An Updated and Extended Earthquake Catalogue for Greece and Adjacent Areas since 1900. Nat. Hazards Earth Syst. Sci. 12 (5), 1425–1430. doi:10.5194/nhess-12-1425-2012
McClusky, S., Balassanian, S., Barka, A., Demir, C., Ergintav, S., Georgiev, I., et al. (2000). Global Positioning System Constraints on Plate Kinematics and Dynamics in the Eastern Mediterranean and Caucasus. J. Geophys. Res. 105 (B3), 5695–5719. doi:10.1029/1999JB900351
McKenzie, D. (1978). Active Tectonics of the Alpine--Himalayan Belt: the Aegean Sea and Surrounding Regions. Geophys. J. Int. 55 (1), 217–254. doi:10.1111/j.1365-246X.1978.tb04759.x
McKenzie, D. (1972). Active Tectonics of the Mediterranean Region. Geophys. J. Int. 30 (2), 109–185. doi:10.1111/j.1365-246X.1972.tb02351.x
McNeill, L. C., and Collier, R. E. L. (2004). Uplift and Slip Rates of the Eastern Eliki Fault Segment, Gulf of Corinth, Greece, Inferred from Holocene and Pleistocene Terraces. J. Geol. Soc. 161 (1), 81–92. doi:10.1144/0016-764903-029
M. Erdik, M., Y. A. Biro, Y. A., T. Onur, T., K. Sesetyan, K., and G. Birgoren, G. (1999). Assessment of Earthquake Hazard in Turkey and Neighboring. Ann. Di Geofis. 42, 1125–1138. doi:10.4401/ag-3773
Meza‐Fajardo, K. C., Semblat, J. F., Chaillat, S., and Lenti, L. (2016). Seismic‐Wave Amplification in 3D Alluvial Basins: 3D/1D Amplification Ratios from Fast Multipole BEM Simulations. Bull. Seismol. Soc. Am. 106 (3), 1267–1281. doi:10.1785/0120150159
Ministry of Public Works and Settlement, Government of Republic of Turkey (1975). Specification for Structures to Be Built in Disaster Areas. Ankara, TR: Official Gazette.
Ministry of Public Works and Settlement, Government of Republic of Turkey (2007). Specification for Structures to Be Built in Disaster Areas. Ankara, TR: Official Gazette. No.26454.
Ministry of Public Works and Settlement, Government of Republic of Turkey (2018). Specification for Structures to Be Built in Seismic Areas. Ankara, TR: Official Gazette. No. 30364.
Mountrakis, D., Kilias, A., Vavliakis, E., Psilovikos, A., and Thomaidou, E. (2003). “Neotectonic Map of Samos Island (Aegean Sea, Greece): Implication of Geographical Information Systems in the Geological Mapping,” in 4th European Congress on Regional Geoscientific Cartography and Information Systems (Bologna, Italy: Servizio Geologico), 11–13.
Nakamura, Y. (1989). A Method for Dynamic Characteristics Estimation of Subsurface Using Microtremor on the Ground Surface. Q. Rep. Railw. Tech. Res. Inst. 30 (1), 25–33.
Nikolaou, S., and Gilsanz, R. (2015). “Learning from Structural Success rather Than Failures,” in Structure Magazine (Chicago, IL: C3 Ink), 25–31.
Nocquet, J.-M. (2012). Present-day Kinematics of the Mediterranean: A Comprehensive Overview of GPS Results. Tectonophysics 579, 220–242. doi:10.1016/j.tecto.2012.03.037
O’Kane, A., and Copley, A. (2020). The Controls on Earthquake Ground Motion in Foreland-Basin Settings: the Effects of Basin and Source Geometry. Geophys. J. Int. 225 (1), 512–529. doi:10.1093/gji/ggaa599
Papadimitriou, P., Kapetanidis, V., Karakonstantis, A., Spingos, I., Kassaras, I., Sakkas, V., et al. (2020). First Results on the Mw=6.9 Samos Earthquake of 30 October 2020. Geosociety 56 (1), 251–279. doi:10.12681/bgsg.25359
Perez, V. (1977). “Response Time Duration of Selected United States Strong Motion Earthquake Records,” in 6th World Conference on Earthquake Engineering (New Delhi, India: International Association for Earthquake Engineering (IAEE)).
Petersen, M. D., Frankel, A. D., Harmsen, S. C., Mueller, C. S., Haller, K. M., Wheeler, R. L., et al. (2008). Documentation for the 2008 Update of the United States National Seismic Hazard Maps. Reston, Virginia: U.S. Geological Survey.
Pirazzoli, P. A., Montaggioni, L. F., Saliege, J. F., Segonzac, G., Thommeret, Y., and Vergnaud-Grazzini, C. (1989). Crustal Block Movements from Holocene Shorelines: Rhodes Island (Greece). Tectonophysics 170 (1-2), 89–114. doi:10.1016/0040-1951(89)90105-4
Pirazzoli, P. A., Stiros, S. C., Laborel, J., Laborel-Deguen, F., Arnold, M., Papageorgiou, S., et al. (1994). Late-Holocene Shoreline Changes Related to Palaeoseismic Events in the Ionian Islands, Greece. Holocene 4 (4), 397–405. doi:10.1177/095968369400400407
Plicka, V., Gallovic, F., Zahradník, J., Serpetsidaki, A., Sokos, E., Vavlas, N., et al. (2021). The 2020 Samos (Aegean Sea) M7 Earthquake: a Normal Fault with Rupture Directivity and Near Surface Slip Explaining the Tsunami Generation and Coastal Uplift. Open Archive ESSOAr [Preprint]. Available at: https://www.essoar.org/doi/10.1002/essoar.10506903.1 (Accessed January, 2022).
Reed, J. W., Anderson, N., Chokshi, N., Kennedy, R. P., Metevia, W. J., Ostrom, D., et al. (1988). A Criterion for Determining Exceedance of the Operating Basis Earthquake. Palo Alto, California: Electric Power Research Institute. Technical Final Report, NP-5930.
Rial, J. A., Saltzman, N. G., and Ling, H. (1992). Earthquake-induced Resonance in Sedimentary Basins. Am. Sci. 80 (6), 566–578.
Ring, U., Okrusch, M., and Will, T. (2007). Samos Island, Part I: Metamorphosed and Non-metamorphosed Nappes, and Sedimentary Basins. J. Virt. Ex. 27 (5), 1–28. doi:10.3809/jvirtex.2007.00180
Safak, E. (1998). “3D Response Spectra: A Method to Include Duration in Response Spectra,” in 11th European Conference on Earthquake Engineering (Paris, France: International Association for Earthquake Engineering (IAEE)).
Sandıkkaya, M. A., and Akkar, S. (2017). Cumulative Absolute Velocity, Arias Intensity and Significant Duration Predictive Models from a Pan-European Strong-Motion Dataset. Bull. Earthq. Eng. 15, 1881–1898. doi:10.1007/s10518-016-0066-6
Sarma, S. K., and Casey, B. J. (1990). “Duration of Strong Motion in Earthquakes,” in 9th World Conference on Earthquake Engineering (Tokyo, Japan: International Association for Earthquake Engineering (IAEE)).
Shcherbakov, R., Turcotte, D. L., and Rundle, J. B. (2005). Aftershock Statistics. Pure Appl. Geophys. 162, 1051–1076. doi:10.1007/s00024-004-2661-8
Somerville, P. G., Smith, N. F., Graves, R. W., and Abrahamson, N. A. (1997). Modification of Empirical Strong Ground Motion Attenuation Relations to Include the Amplitude and Duration Effects of Rupture Directivity. Seismol. Res. Lett. 68, 199–222. doi:10.1785/gssrl.68.1.199
Soysal, H., Sipahioglu, S., Kolcak, D., and Altinok, Y. (1981). Historical Earthquake Catalog of Turkey and Surroundings. Istanbul: TUBITAK, 86. Project no. TBAG 341(in Turkish).
Stiros, S. C., Arnold, M., Pirazzoli, P. A., Laborel, J., Laborel, F., and Papageorgiou, S. (1992). Historical Coseismic Uplift on Euboea Island, Greece. Earth Planet. Sci. Lett. 108 (1-3), 109–117. doi:10.1016/0012-821X(92)90063-2
Stiros, S. C., Laborel, J., Laborel-Deguen, F., Papageorgiou, S., Evin, J., and Pirazzoli, P. A. (2000). Seismic Coastal Uplift in a Region of Subsidence: Holocene Raised Shorelines of Samos Island, Aegean Sea, Greece. Mar. Geol. 170 (1-2), 41–58. doi:10.1016/S0025-3227(00)00064-5
Tan, O., Papadimitriou, E. E., Pabucçu, Z., Karakostas, V., Yörük, A., and Leptokaropoulos, K. (2014). A Detailed Analysis of Microseismicity in Samos and Kusadasi (Eastern Aegean Sea) Areas. Acta Geophys. 62 (6), 1283–1309. doi:10.2478/s11600-013-0194-1
Taymaz, T., Jackson, J., and McKenzie, D. (1991). Active Tectonics of the North and Central Aegean Sea. Geophys. J. Int. 106 (2), 433–490. doi:10.1111/j.1365-246X.1991.tb03906.x
Taymaz, T., Yilmaz, Y., and Dilek, Y. (2007). The Geodynamics of the Aegean and Anatolia: Introduction. Geol. Soc. Lond. Spec. Publ. 291 (1), 1–16. doi:10.1144/SP291.1
Taymaz, T., Yolsal-Çevikbilen, S., Irmak, T. S., Vera, F., Liu, C., Eken, T., et al. (2022). Kinematics of the 30 October 2020 Mw 7.0 Néon Karlovásion (Samos) Earthquake in the Eastern Aegean Sea: Implications on Source Characteristics and Dynamic Rupture Simulations. Tectonophysics 826, 229223. doi:10.1016/j.tecto.2022.229223
Tiberti, M. M., Basili, R., and Vannoli, P. (2014). Ups and Downs in Western Crete (Hellenic Subduction Zone). Sci. Rep. 4, 5677. doi:10.1038/srep05677
Trifunac, M. D., and Brady, A. G. (1975). A Study on the Duration of Earthquake Strong Motion. Bull. Seismol. Soc. Am. 65, 581–626. doi:10.1785/BSSA0650030581
United States Geological Survey (USGS) (2020). M 7.0-13 Km NNE of Néon Karlovásion, Greece. Available at: https://earthquake.usgs.gov/earthquakes/eventpage/us7000c7y0/dyfi/intensity (Accessed January 21, 2022).
Uzel, B., Sözbilir, H., Özkaymak, Ç., Kaymakcı, N., and Langereis, C. G. (2013). Structural Evidence for Strike-Slip Deformation in the İzmir-Balıkesir Transfer Zone and Consequences for Late Cenozoic Evolution of Western Anatolia (Turkey). J. Geodyn. 65, 94–116. doi:10.1016/j.jog.2012.06.009
Weidmann, M., Solounias, N., Drake, R. E., and Curtis, G. H. (1984). Neogene Stratigraphy of the Eastern Basin, Samos Island, Greece. Geobios 17 (4), 477–490. doi:10.1016/S0016-6995(84)80020-0
Weiss, J. R., Walters, R. J., Morishita, Y., Wright, T. J., Lazecky, M., Wang, H., et al. (2020). High‐Resolution Surface Velocities and Strain for Anatolia from Sentinel‐1 InSAR and GNSS Data. Geophys. Res. Lett. 47 (17), e2020GL087376. doi:10.1029/2020GL087376
Wells, D. L., and Coppersmith, K. J. (1994). New Empirical Relationships Among Magnitude, Rupture Length, Rupture Width, Rupture Area, and Surface Displacement. Bull. Seismol. Soc. Am. 84, 974–1002. doi:10.1785/BSSA0840040974
Keywords: strong ground motion, earthquake damage, Samos, İzmir, Aegean Sea earthquake, ground motion parameters, GMPE, earthquake reconnaissance
Citation: Malcioglu FS, O’Kane A, Donmez K and Aktas YD (2022) Characteristics of Strong Ground Motions in the 30 October 2020, MW6.9 Aegean Sea Earthquake. Front. Built Environ. 8:870279. doi: 10.3389/fbuil.2022.870279
Received: 06 February 2022; Accepted: 02 May 2022;
Published: 02 June 2022.
Edited by:
Enrico Tubaldi, University of Strathclyde, United KingdomReviewed by:
Rajesh Rupakhety, University of Iceland, IcelandBogdan Grecu, Institutul National de Cercetare si Dezvoltare pentru Fizica Pamantului, Romania
Alexandru Tiganescu, Institutul National de Cercetare si Dezvoltare pentru Fizica Pamantului, Romania, in collaboration with reviewer BG
Copyright © 2022 Malcioglu, O’Kane, Donmez and Aktas. This is an open-access article distributed under the terms of the Creative Commons Attribution License (CC BY). The use, distribution or reproduction in other forums is permitted, provided the original author(s) and the copyright owner(s) are credited and that the original publication in this journal is cited, in accordance with accepted academic practice. No use, distribution or reproduction is permitted which does not comply with these terms.
*Correspondence: Yasemin D. Aktas, eS5ha3Rhc0B1Y2wuYWMudWs=