 Hsiao-Hui Chen
 Olaf Mumm
 Vanessa Miriam Carlow
- ISU - Institute for Sustainable Urbanism, Technische Universität Braunschweig, Braunschweig, Germany
Street classification is fundamental to transportation planning and design. Urban transportation planning is mostly based on function-based classification schemes (FCS), which classifies streets according to their respective requirements in the pre-defined hierarchy of the urban street network (USN). This study proposes a computational approach for a network-based categorization of street segments (NSC). The main objectives are, first, to identify and describe NSC categories, second, to examine the spatial distribution of street segments from FCS and NSC within a city, and third, to compare FCS and NSC to identify similarities and differences between the two. Centrality measures derived from network science are computed for each street segment and then clustered based on their topological importance. The adaption of clustering, which is a numerical categorization technique, potentially facilitates the integration with other analytical processes in planning and design. The quantitative description of street characteristics obtained by this method is suitable for development of new knowledge-based planning approaches. When extensive data or knowledge of the real performance of streets are not available or costly, this method provides an objective categorization from those data sets that are readily available. The method can also assign the segments that are categorized as “unclassified” in FCS to the categories in the NSC scheme. Since centrality metrics are associated with the functioning of USNs, the comparison between FCS and NSC not only contributes to the understanding and description of the fine variations in topological properties of the segments within each FCS class but also supports the identification of the mismatched segments, where reassessment and adjustment is required, for example, in terms of planning and design.
1 Introduction
For cities, well-functioning urban street networks (USN) are essential in connecting places and people (Noori et al., 2020). In transport planning, the categorization of streets provides a sound basis for guidelines for managing and maintaining the street system (Dong et al., 2013). A widely used approach to classify streets is the functional-based classification scheme (FCS), mainly focusing on the mobility and accessibility of streets (FHWA, 2013). FCS characterizes the role of each street in the overall urban transportation network (FHWA, 2013). Since the flows of motorized traffic that the network elements (i.e., street segments) carry have an impact on the quality and liveliness of the street system (Yerra and Levinson, 2005), a critical criterion for classifying streets is the planned and expected annual average daily traffic volume (FHWA, 2013). Accordingly, arterial roads are typically roadways with high motorized traffic volumes, which by definition “serve a large percentage of travel between cities and other activity centres” (FHWA, 2013). By contrast, local roads typically have relatively low traffic volumes (FHWA, 2013).
However, the common classifications based on functional attributes, as in FCS, largely neglect street segments’ topological properties within a network. Without considering topological attributes, the capacity of FCS to model movement patterns or traffic flows may be undermined (Paul, 2015). For example, a local road, which is expected to have low levels of traffic volumes according to the definition of FHWA, may actually play an important role in the network if we examine its topological characteristics from the perspective of configuration analysis.
This study introduces a computational approach for network-based categorization of street segments (NSC) that provides the quantitative description of the topological characteristics of streets segments. Centrality measures derived from network science are computed for each street segment, which are then clustered based on their topological importance. The adaptation of clustering, which is a numerical categorization technique, supports the creation of an objective categorization scheme of street segments. In a concluding step this study compares the centrality measures based NSC with the FCS description of the USN of the study area (i) to identify the deviation between the two schemes and (ii) to more accurately distinguish different characteristic clusters within each FCS class. This allows a pertinent evaluation with regard to questions of planning and design, to further distinguish the heterogeneity within each FCS class and increase the information, such as accessibility and connectivity, in each classification.
Graph theory has been commonly applied to understand USN. The centrality measures derived from network analysis have been applied to extract spatial-structural properties and the topological importance of nodes and edges in the network (Hillier, 1996; Porta et al., 2006; Zhong, Arisona, Huang, Batty and Schmitt, 2014; Berli, Ducruet, Martin and Seten, 2020).
Previous studies, from both the fields of space syntax and network analysis show that investigating the structure of USNs by “collective network properties”, which simultaneously take the relations between all spaces in the network into consideration (Hillier, 1996; Hillier, 2012) rather than one or few (Serra et al., 2016), utimately contributes to gaining an understanding of urban function, such as a) traffic flows (Jiang, 2009; Kazerani and Winter 2009) and the movement rates in different thoroughfares (Penn et al., 1998; Hillier and Iida, 2005; Serra et al., 2015), b) movement patterns (Jiang and Liu, 2009), c) the spatial distributions of residential or retail areas (Schwander et al., 2013; Ravulaparthy and Goulias, 2014) and d) the human way-finding capacity (Crucitti et al., 2006; Sevtsuk et al., 2016; Tiarasari and Kartidjo, 2021) that are network-constrained in urban areas.
To this end, the present study builds on previous studies, but expands upon them by adding the following crucial aspects.
Building on the methodologies from the field of space syntax (Hillier and Iida, 2005; Turner, 2007), previous studies (Barthelemy, 2017; Berghauser-Pont et al., 2019) aim to develop a street categorization based on only a single network centrality measure, betweenness centrality, for the quantitative description of streets. In the current research we emphasize, that for complex spatial structures like urban street networks multiple centrality measures are necessary for their analysis and description.
Works applying the Multiple Centrality Assessment (Porta et al., 2006; Porta, et al., 2013) evaluate different features of street segments utilizing a multi-variable approach to investigate street characteristics separately by individual measures (Zhang and Li, 2011) (see Supplementary Figure S1 as example), instead of applying the clustering technique to multiple centralities and simultaneously taking the relations between all street segments in the network into consideration. Although classification based on separate elements allow comparison between different spatial features, the interrelation between elements is lacking (Berghauser-Pont et al., 2017). To fill this gap, the current study adapts a more integrated approach: the street segments are categorized by a cluster analysis, which combines the different centralities simultaneously.
Other studies apply the clustering technique to integrated multi-variables (though not multiple centrality measures) to define street types (cf. Berghauser-Pont and Haupt, 2010; Gil et al., 2012; Serra, 2013; Barthelemy, 2017; Berghauser-Pont et al., 2017; Berghauser-Pont et al., 2019; Boeing, 2020). This allows for a comparative analysis of different cities to “give an objective summary of their spatial structure, identifying common as well as unique traits” (Berghauser-Pont et al., 2017).
Yet other studies aimed at expanding FCS for improved Multimodal Designs (Stamatiadis et al., 2019) to identify the location for introducing “multimodal corridors” (Tsigdinos et al., 2020; Tsigdinos et al., 2021). However, the topological characteristics of street segments in USN were overlooked. Noori et al. (2020) aim to fill this gap by using deep learning techniques to develop a classifier model and predict the functional class of streets. The current research does not classify multiple city networks or focus on examining the predicting ability of centrality measures. Instead, our analysis applies centrality measures to create a network-based categorization scheme (NSC).
The objectives of this study are: (a) to develop an automatized, and reproducible method for applying network analysis and machine learning for the categorisation of street segments by computing and clustering multiple centrality dimensions, which evaluate their accessibility, connectivity, and intermediary capacity, as well as the importance of the neighbouring segments; and (b) to compare and discuss the method revealing the heterogeneous topological characteristics within each homogeneous FCS classification. The overall objective of the development of the method is motivated by its use in deriving possible approaches for sustainable development of urban street networks, e.g., by identifying possible traffic hotspots—both conflict-prone or those with high potential for, e.g., a new bike infrastructure.
The paper is structured as follows: The “Materials and Methods” section provides an overview of the study area (the city of Braunschweig) and its USN, including the spatial distribution of FCS. Furthermore it describes the main methodological steps and the indicators, i.e. four centrality measures applied. The “Results” section presents a visualization of the spatial and statistical distribution of the four computed centrality values. Furthermore, the outputs and findings of the clustering analysis are described, which enables identification of different characteristic types of street segments. The identified NSC categories are described semantically. Lastly, the results of the comparison of NSC and FCS are explained. In the final section, we summarize briefly and discuss the conclusions, and give a perspective on possible future works.
2 Materials and methods
2.1 Case study: study area and data source
The NSC method was developed and tested for the city of Braunschweig in Lower Saxony, a Federal State of Germany. The city has a population of 0.25 million and an administrative size of 192 km2. The city of Braunschweig was selected as case study due to the availability of relevant data and access to additional resources such as official transport models. The spatial research boundary is delineated by the administrative boundary of the city. The prime data source for extraction of the USN is OpenStreetMap (OSM) (OpenStreetMap contributors, 2021). OSM describes roads by function and importance (key:highway) (cf. OpenStreetMap contributors, 2023). Although it does not depict official classifications of planning authorities due to lack of comprehensive official data this study utilizes the definition of the functional classification indicated by OSM. In Braunschweig, the values of the key:highway are motorway, primary, secondary, tertiary, residential, and unclassified roads. The total number of segments and overall length of each classification in Braunschweig are provided in Supplementary Table S1.
In Germany, roads are officially grouped into motorways, country roads, main roads, collector roads, and access roads. Furthermore, they are described by the level of their linking function, which depends on whether the road connects big cities, smaller towns or villages (there are 6 levels: from 0 to V). This official classification is provided in the Guidelines for Integrated Network Design (Richtlinien für integrierte Netzgestaltung, RIN) adopted in 2008 by the Research Society for Road and Traffic Engineering (FGSV, 2008). Combining the level and the category of a road allows for determining the road’s design class (Entwurfsklasse)—e.g., level III (regional) country road. So far, Germany does not have an official (publicly available) data set that assigns the design classes to the existing road network (Holthaus and Thiemermann, 2022). For this reason, the classification in OSM forms the basis for the present study.
Figure 1 presents the USN within the administrative borders of Braunschweig differentiated by the OSM highway keys. It shows that the northern and southern parts of the city are mainly connected by streets with the function of a motorway (Figure 1B), whereas its eastern and western parts are mainly connected by primary roads (Figure 1C). Street segments with the key:highway “residential” facilitate smaller-scale communication between the neighbourhoods and often form segment clusters, especially at the outer edge of the study area (See Figure 1F).
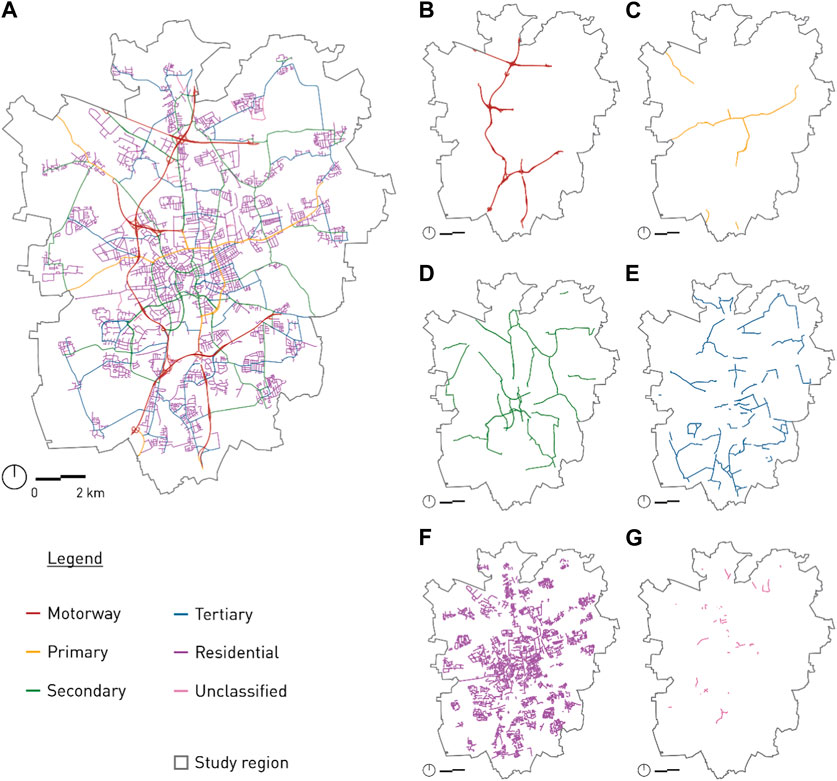
FIGURE 1. The USN in Braunschweig coloured by the FCS defined by OSM key:highway: (A) All FCS categories, (B) Motorway, (C) Primary, (D) Secondary, (E) Tertiary, (F) Residential and (G) Unclassified.
2.2 Indicators
We define street segment categories (NSC categories) as segments with similar topological characteristics regarding the intermediary capacity, accessibility, connectivity, and the importance of its neighbouring segments. USN can be modelled with two methods. In the “primal graph” streets are considered as edges, whereas in the “dual graph” streets are considered as nodes. In this research, the smallest research unit is the street segment, defined as a line segment included in the network analysis, which is the “edge” of the “primal graph”, with uniform characteristics located between two nodes. In the network graph, it is represented as an edge between two nodes. The network-based categorization of street segments proposed in this research is based on the integrated centrality measures, including betweenness centrality, closeness centrality, degree centrality, and PageRank centrality.
1 Betweenness centrality (Cb)
Cb (Freeman, 1977) measures the level of intermediary capacity by assessing the frequency of a segment that comes in between the shortest paths among any two selected segments. The segments with higher Cb values have a higher frequency to be passed by and are more involved in directing and transferring the flow in the network (Noori et al., 2020). Cb expresses detouring or stopping-by behaviours, which is particularly important when we regard centrality as a simplified model of human activities (Kaoru et al., 2021). The Cb of a segment u is formally defined as
where Cb(u) is the Cb of a given segment u, N is the total number of segments in the network graph, mij is the number of shortest paths connecting i and j, while mij(u) is the number of shortest paths connecting i and j and passing through u.
2 Closeness centrality (Cc)
Cc (Bavelas, 1950) evaluates the level of accessibility by assessing to what extent a segment is close to all the other segments. This makes Cc particularly suitable for measuring accessibility (Ozuduru et al., 2021). Segments with higher Cc have a shorter distance to other segments. In addition, segments with the highest Cc tend to be in the centre of a graph. Cc is the average shortest distance from a given starting segment u to all the other segments. It is the reciprocal sum of the shortest distance between the chosen segment u under investigation and all the other segments. It is expressed as
where Cc(u) is the Cc of a given segment u, N refers to the total number of segments in the network graph, and S(u, v) refers to the length of the shortest distance between the segment u and the other segment v.
3 Degree centrality (Cd)
Cd (Freeman, 1979) reflects connectivity by calculating the number of neighbouring segments to which each segment is directly connected. The more ties a segment has, the more critical it is in the network (Crucitti et al., 2006). In a network graph with N segments, the maximum possible degree value of a segment is N-1, and the Cd of segment u, Cd(u), is calculated by the following formula:
where Cd(u) is the Cd of a given segment u, du is the number of segments directly connected to the segment u, N is the total number of segments in the network graph, and N-1 is the maximum possible degree value of a segment in the network.
4 PageRank centrality (Cp)
Cp (Page et al., 1999) ranks the segment by the importance of its neighbouring segments. A segment is important if it links to another important segment. Cp can be formally expressed as
where Cp(u) is the Cp of a given segment u, d is the probability of randomly moving to another segment, N is the total number of segments in the network graph, Bv is defined as the set of segments that link to segment v, v is each possible segment that connects to segment u, and NumLinks(v) is the number of links on segment v.
2.3 Workflow of the proposed NSC method
The proposed method of NSC compromises seven steps (see Supplementary Figure S2):
Step 1. Define the location and boundary of the study area.
Step 2. Construct the network graph from OSM within the defined boundaries.
The function of graph_from_place() in the OSMnx python library is used to access the OSM repository and query the OSM Application Programming Interface (API) Overpass to automate the extraction of the primal network graph (Pezzica et al., 2019) within the boundary of selected urban areas. The USN of Braunschweig is visualized and represented by a connectivity graph, where the intersections are studied as nodes and the streets as the network’s edges. The graph representation of the street network is saved as Shapefile (.shp).
Step 3. Convert the network graph to node and edge geodataframes.
The network graph is converted to node and edge geodataframes using the graph_to_gdfs() function in the OSMnx python library.
Step 4. Compute centrality measures for network segments.
To calculate the network segments' centrality, firstly, the “line_graph()” function in the python library of networkx is applied to convert the graph to a line graph so edges become nodes and vice versa; secondly, the “betweenness_centrality()”, “closeness_centrality()”, “degree_centrality()”, “pagerank()” functions of networkx are used to compute the centrality values for each segment. Each segment has four values of the centrality measures, i.e., Cb, Cc, Cd, and Cp, and z-score normalization is applied to receive values within the range of −1 and 1. In addition, to allow categorization of the “unclassified” segments of the FCS scheme, the outliers are considered to investigate to which NSC category these “unclassified” segments belong if the segments were categorized purely by their topological characteristics. Interpreting the centrality values these outliers may exist due to the so called “edge effect” (Crucitti et al., 2006; Gil, 2017), also termed “boundary effect” (Park, 2009) or “placement effect” (Chen and Dietrich, 2023). This describes the effect of the network being cut by the defined study boundary. The segments at the outer edges of the network have very low values and become outliers since they are close to the defined spatial perimeter of the study, not because of their low actual connectivity.
Characteristics of the USN in Braunschweig
The spatial and statistical distributions of the computed centrality measures are visualized to describe the USN’s structural and topological characteristics. The spatial distribution of these measures presents the locations of the topologically important and, therefore, more “central” segments in the entire network, whereas the statistical distribution summarizes the structural and topological characteristics of the Braunschweig USN.
1 Betweenness Centrality (Cb)
Supplementary Figure S3A presents the results of the distribution of intermediary capacity, measured by Cb (see also Table 1). It shows that the frequency distribution of Cb clearly follows the power law behaviour, which means that, in the case of Braunschweig, a large number of segments have small Cb and a small number of segments have large Cb.
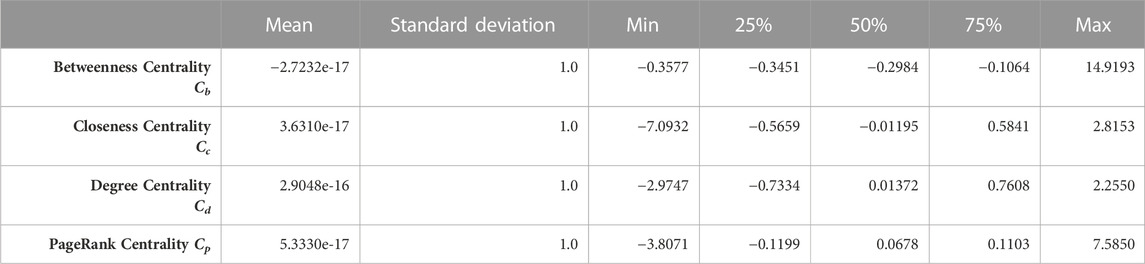
TABLE 1. Descriptive statistics of the z-score of the four computed centrality measures.
The spatial distribution of segments with Cb higher than the 75 percentile is coloured red in Supplementary Figure S1A. These segments have higher intermediary capacity. Because the Cb is calculated globally over the whole network, segments with higher Cb are more critical in traveling over the entire city. They connect different areas of the city.
2 Closeness Centrality (Cc)
Supplementary Figure S3B and Table 1 present the results of the distribution of accessibility, which is measured by Cc. The frequency distribution of Cc follows a normal distribution and the majority of the segments concentrate between −0.566 and 0.584, which is also shown by the 25 and 75 percentiles (Table 1).
The spatial distribution of the street segments with Cc higher than 75 percentiles is coloured in dark blue in Supplementary Figure S1B. These segments are more critical regarding their accessibility to all other segments. Supplementary Figure S1B exhibits a clear pattern that segments in the centre of the study area have higher Cc while segments in the outer areas tend to have lower Cc. Apart from the expected lower centrality of these areas, this also indicates an overwhelming sensibility of the outer segments to the edge effects (Gil, 2017), as explained in section 2.3.
3 Degree Centrality (Cd)
Supplementary Figure S3C present the results of the connectivity distribution, measured by Cd. The majority of the segments have a Cd between −0.7334 and 0.7608, which is also shown by the values of 25 and 75 percentiles in Table 1.
The spatial distribution of segments with high Cd is presented in Supplementary Figure S1C, where segments with a Cd higher than 75 percentiles are coloured in green. It is noteworthy that, in contrast to Cc, the segments in the neighbourhoods have higher values of Cd, whereas the segments forming the backbone of the urban street network, such as the motorways or primary roads, have a value of Cd lower than 75 percentiles (segments coloured in pink). This means that the segments in-between the neighbourhoods have lower Cd, while segments within the neighbourhoods have higher Cd. This indicates that one of the structural and topological characteristics of the Braunschweig USN is that the segments used to travel between the neighbourhoods are often not connected to many other segments. Within the neighbourhood, the segments are well-connected to many other segments.
4 PageRank Centrality, (Cp)
Supplementary Figure S3D shows that an exceptionally large number of the segments concentrate in 5.3330e-17, the average Cp of Braunschweig. This means that most segments are linked to the segments whose importance is at the average level. Only a small proportion of segments are linked to important and very unimportant segments.
The Cp’s spatial distribution is presented in Supplementary Figure S1D, where segments with a Cp higher than 75 percentiles are coloured in orange. A unique pattern in the study area is that even if a segment is on the edge of the network, which is the peripheral area, its own level of importance is increased as long as it is connected to an important segment.
The computed centrality measures are the base for the following categorization of the street segments by means of cluster analysis.
Step 5. Cluster analysis for segment categorization based on centrality measures
The categorization of segments of similar characteristics was performed through Hierarchical Cluster Analysis (HCA). HCA is an unsupervised machine learning approach for building a hierarchy of clusters. In contrast to other clustering approaches it has the advantage of not requiring to determine the final number of clusters beforehand, thus providing open and unbiased results. HCA is applied to the raw segment data to form clusters based on common factors, i.e., the four centrality measures, among various segment data points. In this research we utilised the AgglomerativeClustering() function of the sci-kit-learn python library to carry out the HCA. The parameter value of affinity, which indicate the metric used to calculate distance between instances, is “Euclidean”. The “Ward’s method” is chosen to be the aggregative method. The function of “hopkins()” in the pyclustertend python library is imported to calculate the Hopkin’s statistic, which provides the numerical proof of the clusterability of the data. The resulting Hopkins score of 0.026651, which is positive and between 0 and 1, indicates that the data is not uniformly distributed and, therefore, clustering can be useful to categorize the observations. Also, the “silhouette_score()” function of the sci-kit-learn python library is imported to calculate the silhouette coefficient, which is used to evaluate the goodness of the chosen number of clusters. The results suggest that the best number of clusters should be two, according to silhouette score of 0.53. However, this limits the description of a complex USN in particular with regard to the assessment in terms of urban planning and design. Therefore, a varying number of clusters formed by means of HCA were examined for their feasibility (see, e.g., Supplementary Figure S5). We randomly selected 50 street segments across the entire USN. Based on high resolution satellite imagery (IFF, 2020), we visually assessed these and neighbouring segments in each cluster along the specifications of the street layout. In this contextual assessment of the clusters, six clusters proved to be conclusive, which has the silhouette score of 0.29. In addition, the FCS also describes six categories, indicating the need for a greater number of clusters and furthermore facilitating comparison between the NSC and FCS. A dendrogram, in which the euclidean distances of 0.2 was selected as the threshold value (indicated by the horizontal line above the axis), is shown in Supplementary Figure S4. Cutting the hierarchical tree into six clusters returns a vector of cluster labels indicating their memberships. This vector is then attached to the original segment data frame for visualization and summary statistics in the next step.
Step 6. Visualize the spatial and statistical distribution of NSCs to describe each NSC’s characteristics.
The cluster analysis results are mapped utilizing QGIS, and street segments are coloured by their categories to visualize the spatial distribution of the NSC categories (see Figure 3). Descriptive analysis of the centrality values is further facilitated by a diagrammatic representation in order to examine the statistical distribution of the four centrality measures within the individual NSC categories (see Figure 2).
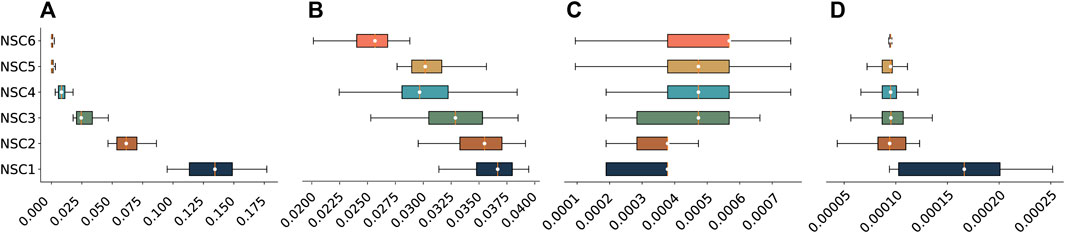
FIGURE 2. Box plot of the statistical distribution of (A) Cb, (B) Cc, (C) Cd, and (D) Cp by each NSC category.
Step 7. Compare the NSC with FCS.
Comparison between the function- and network-based schemes is carried out by plotting the stacked bar chart of the percentage of NSC within each FCS (see Figure 4). The cumulative distribution function (CDF) of the four centrality measures of each category within FCS and NSC is presented in Figure 5. The ks_2samp() function in the python module of scipy.stats is then performed to carry out the 2-sample Kolmogorov–Smirnov test (KS), which allows us to compare FCS and NSC and examine whether they have the same distribution.
3 Results
3.1 Characteristics of the NSC categories
The segments are grouped into six clusters as a result of the HCA. This forms the basis for the further definition of the NSC categories, also with regard to spatial aspects such as segment length relevant from the perspective of urban and transport planning. The characteristics of each cluster forming the NSC categories are described by statistical distribution presented in Table 2(a) and Figure 2. The spatial distribution of all categories is mapped in Figure 3. A description of the characteristics is also provided in Table 2(b). The following steps illustrate the process of defining and detailing the NSC from the initial clusters created.
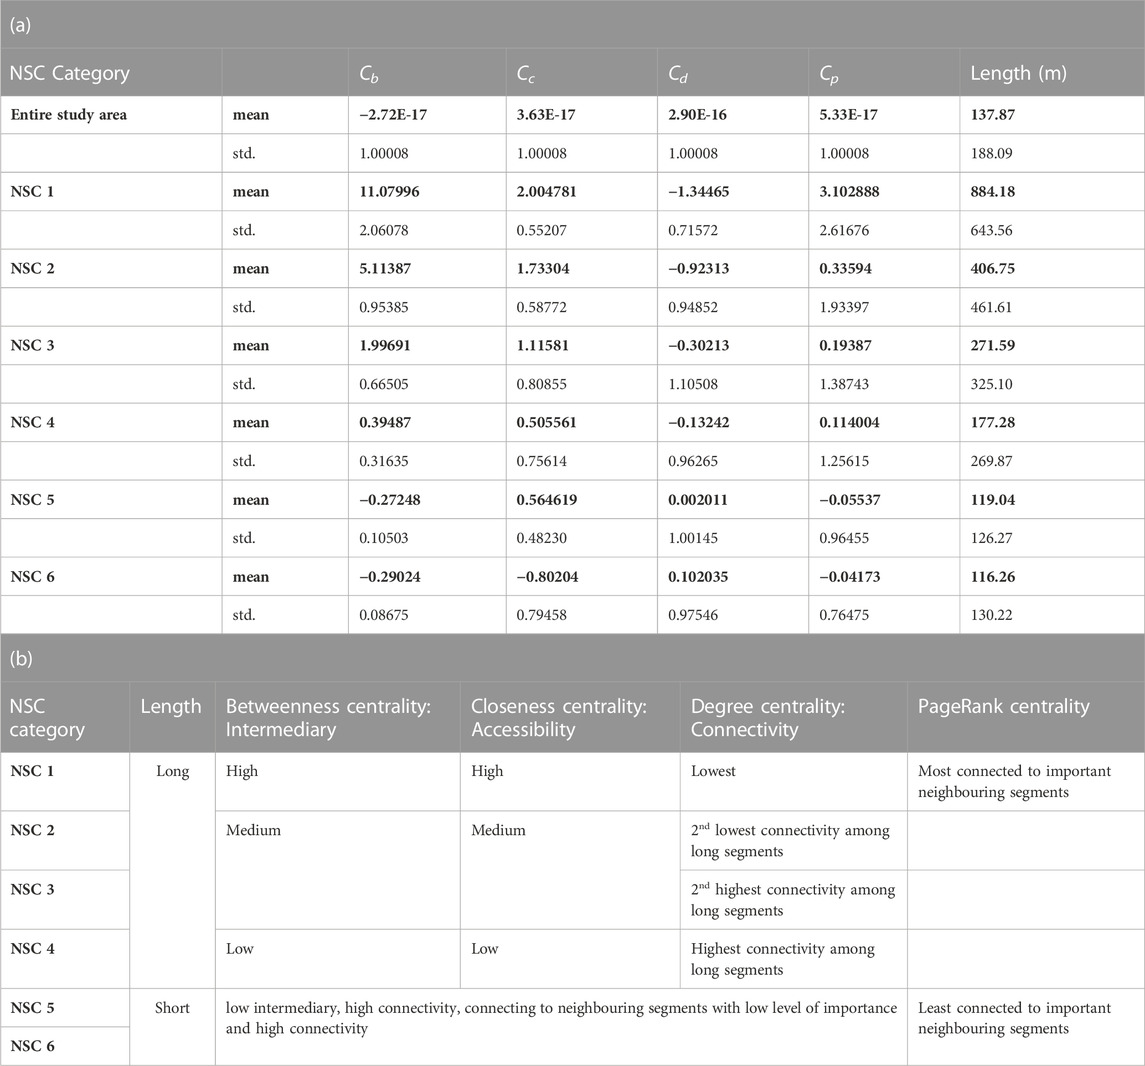
TABLE 2. (a) Descriptive statistics and (b) specification of the characteristics of each NSC category.
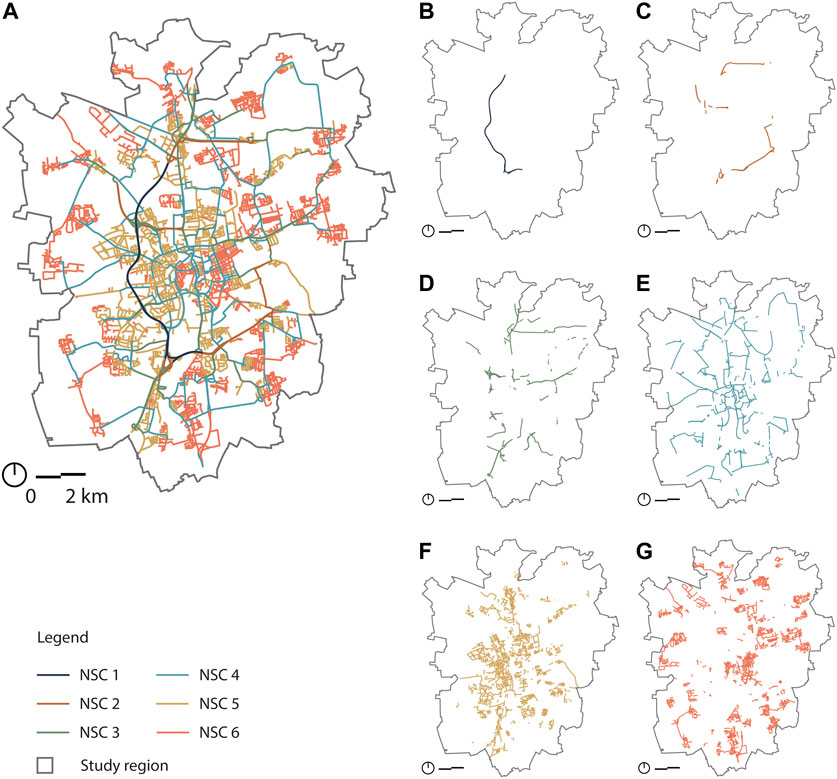
FIGURE 3. Map of USN colored by the identified categories through the proposed network-based method: (A) NSC 1 to 6, (B) NSC 1, (C) NSC 2, (D) NSC 3, (E) NSC 4, (F) NSC 5 and (G) NSC 6.
In the course of the detailed analysis of the clusters, it became evident that one of the distinct and recognizable factors is the average length of the segments in each cluster. This is also plausible from the perspective of urban (transportation) planning, e.g., with regard to connectivity, and it can be seen spatially that the clusters with the shorter segments describe high-density networks, for example, in the inner-city area (see also Figure 3). Therefore the NSC groups are divided into two groups based on their average length. NSC 1 to 4 are characterized as long segment groups, and NSC 5 and 6 are represented as short segment groups using the city-wide average length (137 m) as a threshold.
Next, the long- and short-segment groups are further differentiated based on the values of their four centrality measures. Table 2(a) and Figure 2 shows that average Cb, Cc, and Cp values decrease from NSC 1 to NSC 6. On the other hand, the average values of Cd increase gradually from NSC 1 to NSC 6.
Among all the categories, NSC 1 has the highest average values in the three centrality indices Cb, Cc, and Cp. This means that segments in NSC 1 have the highest level of intermediary capacity, accessibility, and connection with very important neighbouring segments. However, it also has the lowest average Cd (0.00030), which means that they are connected with the smallest number of other segments and, therefore, has the lowest connectivity. As shown in Figure 3B, segments in NSC 1 play an essential role in connecting the northern and southern areas of the city. Figure 3A shows that NSC 1 is only connected to segments in NSC 2, which explains the low average Cd. On the whole, NSC 1 can be characterized as long segments with the highest intermediary capacity, accessibility, connection with very important neighbouring segments, and low connectivity.
Among the long segments, NSC 2 and 3 have medium intermediary capacity (average Cb = 0.06343 and 0.0273) and accessibility (average Cc = 0.03515 and 0.032688). The main difference between NSC 2 and 3 concerns their connectivity, where NSC 2 has a lower average Cd (0.00035) than NSC 3 (0.00043). Another difference can be found in the connectivity distribution, Cd, as shown in Figure 2C. Compared with NSC 3, NSC 2 has lower connectivity, which means that segments in NSC 2 are connected to a smaller number of segments. By contrast, the broader distribution range of Cd in NSC 3 indicates that segments belonging to this category are connected to a large and small number of other segments. In sum, NSC 2 and 3 are characterized as long segments with medium intermediary capacity and accessibility, whereas NSC 2 has lower connectivity than NSC 3.
Among the long segment groups, NSC 4 has the lowest level of intermediary capacity (average Cb = 0.00872) and accessibility (average Cc = 0.03025). However, the level of connectivity, measured by average Cd (0.00045), is the highest among the NSCs with long segments. This means that the segments of NSC 4 are connected to more other segments, compared to NSC 1, NSC 2, and NSC 3 segments. As shown in Figure 3E, the ring road along the outer edge of the historical city center and the roads connecting central and outer areas start to appear in NSC. Their roles in the network system can be defined as connecting the neighbourhoods distributed across the city, and at least one of the nodes of these segments is connected to multiple segments. This explains why its connectivity is high. Therefore, NSC 4 is characterized as long segments with low intermediary capacity, low accessibility, and high connectivity.
NSC 5 and 6 share the common feature of having short segments with the lowest level of intermediary capacity, as they both have the lowest average Cb (0.00099 and 0.00078). Furthermore, they both connect to segments that are not very important, which is indicated by their lowest average Cp (both are 0.00009). On the other hand, their highest average Cd (0.00047 and 0.00048) among all NSC categories means that the number of segments they are connected to is the largest, which means NSC 5 and 6 have the highest connectivity. The most obvious feature that can distinguish NSC 5 and 6 is their level of accessibility, Cc, as shown in Figure 2B. NSC 5 has higher average Cc than NSC 6. This means that NSC 6 is more likely to be found in the outer peripheral areas than NSC 5, as shown in Figures 3G, H. Therefore, NSC 5 and 6 can be described as short segments with low intermediary capacity, connecting to neighbouring segments with low importance and high connectivity.
3.2 Comparison between the network-based and the function-based method
The comparison between the FCS and the NSC is divided into three steps. First of all, the percentages of different NSC categories within each FCS class are presented in Figure 4 to distinguish the topological heterogeneity within each FCS class and increase the information such as accessibility and connectivity in each class. Secondly, the cumulative distribution function (CDF) of the four centrality measures within each category in FCS and NSC is visualized in Figure 5. Finally, the KS is carried out to examine whether FCS and NSC have the same distribution and how similar these two schemes are.
1 Comparing the results of network-based with the function-based categories
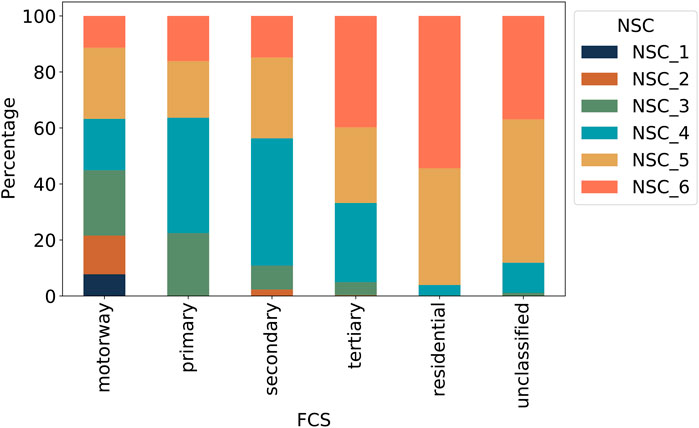
FIGURE 4. Visualization of distribution of different NSC categories within each FCS.
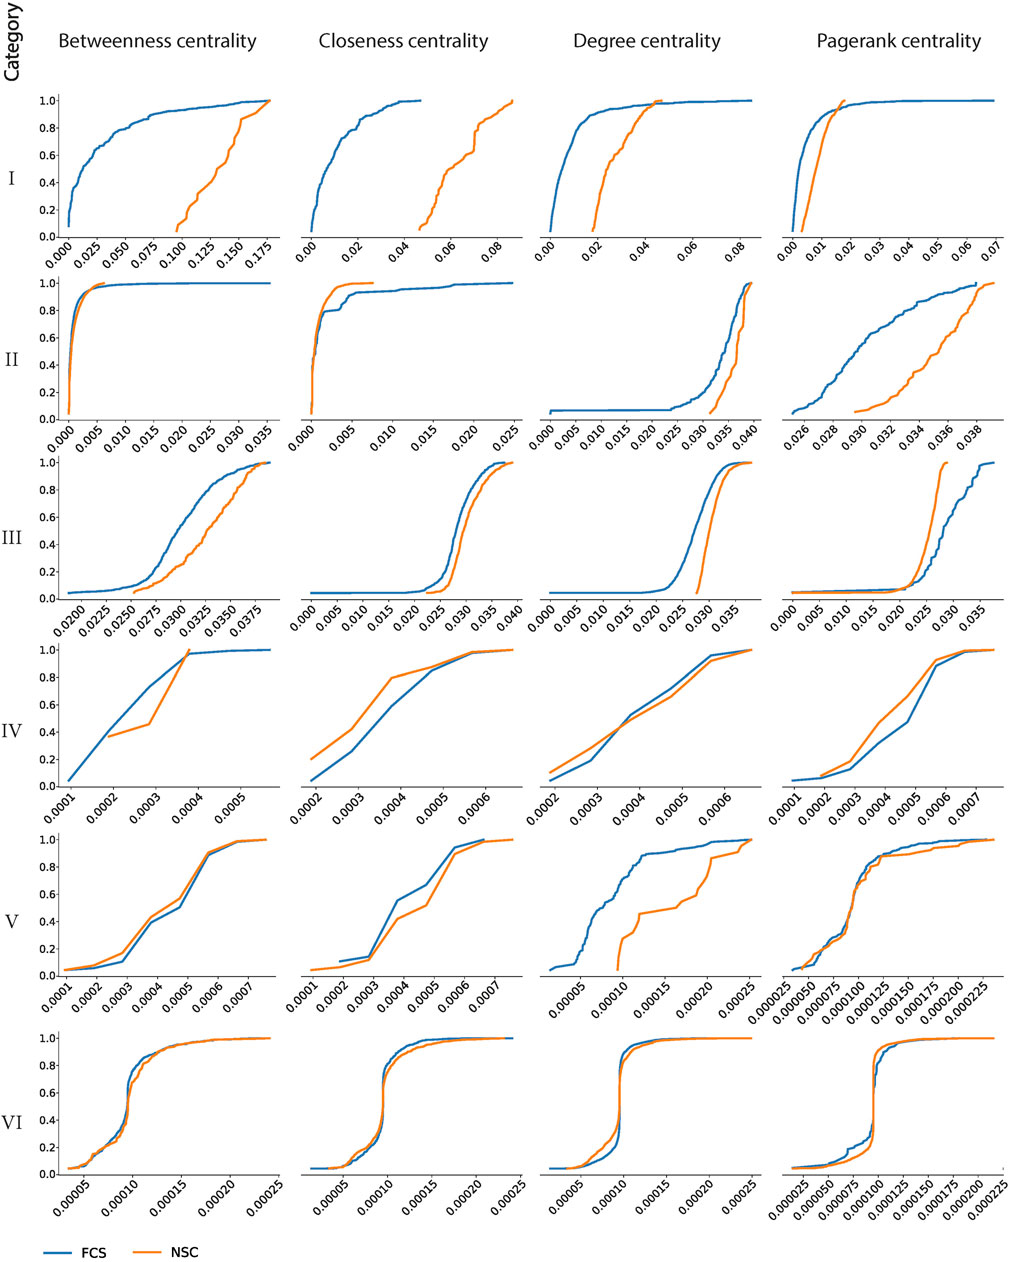
FIGURE 5. Cumulative distribution function (CDF) of the four centrality measures of each category within FCS and NSC.
NSC 1 and the majority of NSC 2 segments belong to motorways in FCS (Figure 4; Supplementary Table S2), reflecting the characteristics of NSC 1 and 2 as long segments with high intermediary capacity, accessibility, connection to very important neighbouring segments and low connectivity, all of which are the typical features of motorways.
Secondly, more than 36% of the motorways and primary roads are categorized as NSC 5 and 6, characterized by short segments with low intermediary capacity, connecting to neighbouring segments with low importance and high connectivity. There is a mismatch between some features of these segments and the typical expectations regarding the motorways and primary roads. Such roads are expected to carry heavy loads of traffic volume, but topologically their centrality values are low. These segments should be the location for collecting further data regarding the actual traffic volume.
At the same time, more than 30% of the tertiary and 3% of the residential roads in the NSC 3 and 4 have middle levels of importance in terms of intermediary capacity and accessibility. Thus, an inevitable mismatch between the expected traffic volume and the topological features is also observable with regard to these roads.
Finally, segments belonging to the “unclassified” group in the FCS are perhaps the most interesting for further investigation. Based on the FCS, it is unclear how much traffic should be expected for these segments. However, based on the NSC, more than 10% of these segments can be clearly categorized as belonging to NSC 3 and 4.
In sum, the segments with conflicting or indecisive categorizations between FCS and NSC require further investigation. On-site data collection potentially allows the discrepancy to be validated or determined.
2 Comparing cumulative frequency distribution of centrality measures within each category
Further investigation in this section aims to explore to what extent the FCS deviates from the NSC. The cumulative distribution function of the four centrality measures within each category in the FCS and the NSC is used to visualize their distribution patterns. To quantify the differences between the FCS and the NSC, the KS, which is a nonparametric method in statistics for comparing two samples, is then carried out to measure the greatest distance and detect the difference in both the location and the shape of the cumulative distribution functions of the FCS and the NSC.
The null hypothesis of the KS is that the two samples were drawn from the same distribution, and there is no difference between the FCS and the NSC. The resulting KS value is evaluated by the p-value (see Table 3) to decide whether this null hypothesis is rejected. The significance level of the p-value is set at 0.05. If p > 0.05, it is assumed that the null hypothesis cannot be dismissed, which means that the FCS and the NSC are sampled from the same distribution. This is the case with the Cd of category I, the Cd of category III, and the Cp of category II (see Figure 5; Table 3). This means that among all the categories in the FCS and the NSC, only these three pairs can be sampled from the same distribution for a 5% significance, and the distributions of these three pairs are equal. In other words, the topological similarity between the FCS and the NSC only exists in categories I and III in terms of the Cd and in category II in terms of the Cp. For all the other categories, there is no topological similarity between the pairs of the FCS and the NSC because their p < 0.05, so the null hypothesis is rejected.
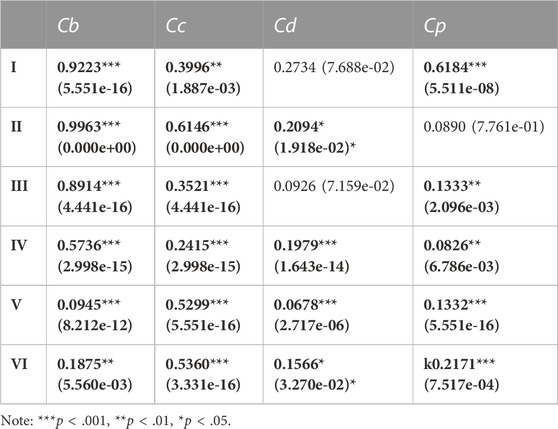
TABLE 3. KS value and p-value (in bracket) from KS test. Between FCS and NSC, the topological similarity only exists in categories I and III because their KS values are not significant enough, and the null hypothesis that the two samples are from the same distribution need to be accepted.
4 Conclusion
The authors introduce a network-based method for categorizing the segments of urban street networks. By calculating the centrality measures of the segments and applying cluster analysis, street segments with similar topological characteristics are grouped together. These categories are characterized and their spatial distribution within a city is analyzed. The results show that six network-based segment categories can be distinguished based on different levels of intermediary capacity, accessibility, connectivity, and levels of importance of the neighbouring segments.
The adaptation of clustering as a numerical categorization technique, facilitates the integration with other analytical and planning procedures in urban (transport) planning and design. One of the advantages of the method is that when extensive data-collection or prior local knowledge of the real performance of streets are not available or too cost- and resource-consuming, it provides an objective categorization from available open data or self-generated data based on e.g., satellite imagery (Verma et al., 2021).
The results of this research can serve as the initial step for further analyses, such as proposing appropriate types of interventions according to street segments’ characteristics also in terms of spatial design and evaluating the resilience and robustness of the network against disruption or congestion. For example, the segments with a high level of topological importance could be analysed in detail by setting up sensor technology to collect data to analyse the traffic flows of various transportation modes (motorized, cycling, walking) to explore whether the topological importance is associated with a higher proportion of all or specific modes of transport. The quantitative descriptions of street characteristics produced by this method is suitable for the comparisons between different urban areas based on which research regarding network qualities in different urban fabrics is possible.
This study furthermore focused on the development of the methodology to compare FCS with NCS to identify the potential linkages and mismatches between the two schemes. The heterogeneity within each FCS class can be identified, and street segments of the same functional class can be further distinguished by their topological importance. The comparison between FCS and NSC contributes to the understanding and description of the subtle differences in the topological properties of the segments within the individual FCS classes. It was found that these are not congruent. For example, in the case of Braunschweig, the segments belonging to “motorway” have very diverse topological characteristics because all six categories of the NSC can be found in this FCS category. Also, among the “unclassified” category in the FCS, more than 10% of segments have the middle level of importance regarding their intermediary capacity and accessibility in the NSC. Finally, the cumulative distribution function results and the KS provide evidence that the FCS significantly deviates from the NSC in the case of Braunschweig. Except for the top two classes (i.e., motorway and primary in FCS and NSC 1 and 2), no topological similarity is found between the pairs of FCS and NSC. With these results, this study intends to initiate and stimulate further discussion on the extent to which street segments should be categorized based on their functionality, topological importance, or both of these attributes combined.
This can potentially serve to describe challenges and opportunities for transportation planning with respect to specific sections of the network. For transport authorities dealing with transport infrastructure investments, maintenance, design, and operation, the quantitative assessment of street segments’ performance is essential. However, in practice, close monitoring of the performance and patterns of movement flows in the entire urban street network is not always possible due the cost- or resource constraints. The proposed approach in the current research and the comparison between the function- and network-based schemes can help to (a) identify mismatched segments (FCS different to NCS); and (b) the most critical central places in the network, where real-time data could be collected with view to monitoring the efficiency and accessibility of the overall transportation networks, and to identify the segments that require further planning within each FCS class.
A concrete example of application could be the examination of residential streets, where speed limits are usually imposed, so that noise levels are generally expected to be lower. However, if the NSC analysis shows that a residential street has a potentially high level of use and connectivity, installing noise sensors in the street section in question enables to check whether the noise level is higher than expected on residential roads.
Another potential application relates to network planning for different modes of transport: if a segment has a high level of topological importance but is currently without e.g., a bike lane, it may be a potential candidate for adding the respective infrastructure to increase the bike network’s overall connectivity and quality. From the perspective of encouraging more sustainable and active transportation modes, increasing the functionality of a street segment may also contribute to higher network connectivity for pedestrians or cyclists.
Overall, the network-based categorization of street segments (NSC-method) can be understood as a (spatially) high resolved tool to analyse and describe urban street networks (USN). In addition to the further investigation and validation of the method as such—e.g. regarding the scalability, advancement of the algorithms and criteria adopted or research on spatial structural effects of different street networks on this categorization method by applying this approach to more cities—the NSC-method enables an integrated characterization of street types by means of linking them with other data, in particular data describing the built environment of the respective segments. This can contribute to gain new insights into the interdependencies of network qualities (described by NSC) and urban spatial qualities through further research.
Data availability statement
The raw data supporting the conclusion of this article will be made available by the authors, without undue reservation.
Author contributions
Conceptualization: HHC, OM, and VMC; Methodology: HHC, OM, and VMC; Investigation: HHC, OM, and VMC; Writing–original draft preparation: HHC; Writing–review and editing: OM and VMC; Funding acquisition: VMC. All authors contributed to the article and approved the submitted version.
Funding
This research was funded by the Ministry of Science and Culture of Lower Saxony and by the Volkswagen Foundation under Grant 94957. We acknowledge support by the Open Access Publication Funds of Technische Universität Braunschweig.
Conflict of interest
The authors declare that the research was conducted in the absence of any commercial or financial relationships that could be construed as a potential conflict of interest.
Publisher’s note
All claims expressed in this article are solely those of the authors and do not necessarily represent those of their affiliated organizations, or those of the publisher, the editors and the reviewers. Any product that may be evaluated in this article, or claim that may be made by its manufacturer, is not guaranteed or endorsed by the publisher.
Supplementary material
The Supplementary Material for this article can be found online at: https://www.frontiersin.org/articles/10.3389/fbuil.2023.1216888/full#supplementary-material
References
Barthelemy, M. (2017). From paths to blocks: new measures for street patterns. Environ. Plan. B Urban Anal. City Sci. 44 (2), 256–271. doi:10.1177/0265813515599982
Bavelas, A. (1950). Communication patterns in task-oriented groups. J. Acoust. Soc. Am. 22, 725–730. doi:10.1121/1.1906679
Berghauser-Pont, M., and Haupt, P. (2010). Spacematrix. Space, density and urban form. Rotterdam, Netherlands: Nai Publishers.
Berghauser-Pont, M., and Marcus, L. (2014). Innovations in measuring density. From area and location density to accessible and perceived density. Nordic J. Archit. Res. (2), 11–30.
Berghauser-Pont, M., Stavroulaki, G., Bobkova, E., Gil, J., Marcus, L., Olsson, J., et al. (2017). “Quantitative comparison of cities: distribution of street and building types based on density and centrality measures,” in Conference: 11th Space Syntax Symposium, Lisbon, Portugal, July, 2017.
Berghauser-Pont, M., Stavroulaki, G., Bobkova, E., Gil, J., Marcus, L., Olsson, J., et al. (2019). The spatial distribution and frequency of street, plot and building types across five European cities. Environ. Plan. B Urban Anal. City Sci. 46 (7), 1226–1242. doi:10.1177/2399808319857450
Berli, J., Ducruet, C., Martin, R., and Seten, S. (2020). “The changing interplay between european cities and intermodal transport networks (1970s–2010s),” in European port cities in transition (Berlin, Germany: Springer), 241–263.
Boeing, G. (2020). A Multi-Scale Analysis of 27,000 Urban street networks: every US city, town, urbanized area, and zillow neighborhood. Environ. Plan. B Urban Anal. City Sci. 47 (4), 590–608. doi:10.1177/2399808318784595
Chen, H.-H., and Dietrich, U. (2021). Comparability of urban street networks: consideration of the size effect in the evaluation of network characteristics and a proposal for determining an appropriate size of the catchment area for pedestrian networks. IJSDP 16 (6), 1019–1026. doi:10.18280/ijsdp.160603
Crucitti, P., Latora, V., and Porta, S. (2006). Centrality in networks of urban streets. Chaos Interdiscip. J. Nonlinear Sci. 16, 015113. doi:10.1063/1.2150162
Dong, J.-X., Cheng, T., Jingjing, X., and Jianping, W. (2013). Quantitative assessment of urban road network hierarchy planning. Town Plan. Rev. 84 (4), 467–493. doi:10.2307/23474359
FHWA, Federal Highway Administration, (2013). Highway functional classification concepts, criteria and procedures. Washington, DC, United States: U.S. Department of Transportation.
FGSV Forschungsgesellschaft für Straßen- und Verkehrswesen (2008). Richtlinien für Integrierte Netzgestaltung (RIN). Köln, Germany: FGSV.
Freeman, L. (1977). A set of measures of centrality based on betweenness. Sociometry 40 (1), 35–41. doi:10.2307/3033543
Freeman, L. (1979). Centrality in social networks conceptual clarification. Soc. Netw. 1 (3), 215–239. doi:10.1016/0378-8733(78)90021-7
Gil, J. (2017). Street network analysis “edge effects”: examining the sensitivity of centrality measures to boundary conditions. Environ. Plan. B Urban Anal. City 44 (5), 819–836. doi:10.1177/0265813516650678
Gil, J., Beirão, J., Montenegro, N., and Duarte, J. (2012). On the discovery of urban typologies: data mining the many dimensions of urban form. Urban Morphol. 16 (1), 27–40. doi:10.51347/jum.v16i1.3966
Hillier, B. (1996). Space is the machine: a configurational theory of architecture. London: Space Syntax.
Hillier, B. (2012). “The genetic code for cities: is it simpler than we thought?,” in Complexity theories of cities have come of age: an overview with implications to urban planning and design. Editors Y. Portugali, H. Meyer, and E. e. Stolk (Berlin, Germany: Springer), 129–152.
Hillier, B., and Iida, S. (2005). “Network and psychological e-ects in urban movement,” in Proceedings of COSIT 2005 – International conference on spatial information theory, Ellicottville, NY, USA, September, 2005, 475–490.
Holthaus, T., and Thiemermann, A. (2022). Identification of German road design classes in the OpenStreetMap road network. AGIT ‒ J. für Angewandte Geoinformatik, 93–105. doi:10.14627/537728010
IFF (2020). Multispectral georeferenced aerial images of northern Germany. Available online: https://mcloud.de/zh/web/guest/suche/-/results/detail/FFF618ED-B60B-42F7-8C75-F44A08D432E0 (accessed on June 28, 2021).
Jiang, B. (2009). Street hierarchies: a minority of streets account for a majority of traffic flow. Int. J. Geogr. Inf. Sci. 23 (8), 1033–1048. doi:10.1080/13658810802004648
Jiang, B., and Liu, C. (2009). Street-based topological representations and analyses for predicting traffic flow in GIS. Int. J. Geogr. Inf. Sci. 23, 1119–1137. doi:10.1080/13658810701690448
Kaoru, Y., Yusuke, K., and Yuji, Y. (2021). “Local betweenness centrality analysis of 30 european cities,” in Urban informatics and future cities. Editors En S. Geertman, C. Pettit, R. Goodspee, and A. Staffans (Berlin, Germany: Springer International Publishing), 527–547. doi:10.1007/978-3-030-76059-5_26
Kazerani, A., and Winter, S. (2009). “Can betweenness centrality explain traffic flow,” in Proceedings of the 12th AGILE International Conference on Geographic Information Science, Hannover, Germay, January, 2009.
Masucci, A., Smith, D., Crooks, A., and Batty, M. (2009). Random planar graphs and the London street network. Eur. Phys. J. B 71 (71), 259–271. doi:10.1140/epjb/e2009-00290-4
Noori, F., Kamangir, H., King, S. A., Sheta, A., Pashaei, M., and SheikhMohammadZadeh, A. (2020). A deep learning approach to urban street functionality prediction based on centrality measures and stacked denoising autoencoder. Int. J. Geo-Information 9 (7), 456. doi:10.3390/ijgi9070456
OpenStreetMap contributors, (2021). Planet dump retrieved from https://planet.osm.org.
OpenStreetMap contributors, (2023). OpenStreetMap Wiki-Key:highway. Retrieved 15/06/2023 from https://wiki.openstreetmap.org/wiki/Key:highway.
Ozuduru, B. H., Webster, C. J., Chiaradia, A., and Yucesoy, E. (2021). Associating street-network centrality with spontaneous and planned subcentres. Urban Stud. 58 (2), 2059–2078. doi:10.1177/0042098020931302
Page, L., Brin, S., Motwani, R., and Winograd, T. (1999). The PageRank citation ranking: bringing order to the web. Stanford, CA, USA: Stanford InfoLab.
Park, H. (2009). “Boundary effects on the intelligibility and predictability of spatial systems,” in Proceedings of the 7th international space syntax symposium. Editors D. Koch, L. Marcus, and J. Steen (Stockholm, Sweden: Royal Institute of Technology).
Paul, A. (2015). Understanding the influence of roadway configuration on traffic flows through a conventional traffic-assignment model. J. Transp. Literature 9 (2), 40–44. doi:10.1590/2238-1031.jtl.v9n2a8
Penn, A., Hillier, B., Banister, D., and Xu, J. (1998). Configurational modelling of urban movement networks. Environ. Plan. B Plan. Des. 25, 59–84. doi:10.1068/b250059
Pezzica, C., Cutini, V., and De Souza, C. B. (2019). “Rapid configurational analysis using OSM data: towards the use of Space Syntax to orient post-disaster decision making,” in 12th international space syntax symposium (12SSS) (Beijing, China: Space Syntax Network/ Sejong University Press). Accessed http://orca.cardiff.ac.uk/id/eprint/120103.
Porta, S., Crucitti, P., and Latora, V. (2006). The network analysis of urban streets: a primal approach. Environ. Plan. B Urban Anal. City Sci. 33 (5), 705–725. doi:10.1068/b32045
Porta, S., Strano, E., Venerandi, A., Adam, R., Romice, O., Pasino, P., et al. (2013). Multiple centrality assessment: understanding and designing mixed use streets in professional masterplanning. Urban Des. 125, 12–14.
Ravulaparthy, S., and Goulias, K. (2014). Characterizing the composition of economic activities in central locations: graph-theoretic approach to urban network analysis. J. Transp. Res. Board 2430, 95–104. doi:10.3141/2430-10
Schwander, C., Barnes, Y., Chiaradia, A., and Hillier, B. (2013). Compositional and urban form effects on residential property value patterns in Greater London. Urban Des. Plan. 166 (3), 176–199. doi:10.1680/udap.10.00030
Serra, M. (2013). Anatomy of an emerging metropolitan territory - towards an integrated analytical framework for metropolitan morphology. PhD thesis. Porto, Portugal: Faculdade de Engenharia da Universidade do Porto.
Serra, M., Gil, J., and Pinho, P. (2016). Towards an understanding of morphogenesis in metropolitan street-networks. Environ. Plan. B Urban Anal. City Sci. 44 (2), 272–293. doi:10.1177/0265813516684136
Serra, M., Hillier, B., and Kayvan, K. (2015). Exploring country-wide spatial systems: spatio-structural correlates at the regional and national scales. Proc. 10th Int. Space Syntax Symposium 84 (1–84), 18.
Sevtsuk, A., Kalvo, R., and Ekmekci, O. (2016). Pedestrian accessibility in grid layouts: the role of block, plot and street dimensions. Urban Morphol. 20 (2), 89–106. doi:10.51347/jum.v20i2.4056
Stamatiadis, N., Kirk, A., King, M., and Chellman, R. (2019). Development of a context sensitive multimodal functional classification system. Adv. Transp. Stud. 47, 5–20.
Tiarasari, R., and Kartidjo, W. (2021). Assesment of pedestrian walkability in the urban village with urban nework analysis. IOP Conf. Ser. Earth Environ. Sci. 738, 012065. doi:10.1088/1755-1315/738/1/012065
Tsigdinos, S., Nikitas, A., and Bakogiannis, E. (2021). Multimodal corridor development as a way of supporting sustainable mobility in Athens. Case Stud. Transp. Policy 9 (1), 137–148. doi:10.1016/j.cstp.2020.11.004
Tsigdinos, S., Paraskevopoulos, Y., and Latinopoulou, M. (2020). What about a different road network hierarchy? New perspectives towards sustainable mobility: the case of Thessaloniki, Greece. Eur. Transp. \ Trasporti Europei 76.
Turner, A. (2007). From axial to road-centre lines: a new representation for space syntax and a new model of route choice for transport network analysis. Environment and Planning B Planning and Design 34 (3), 539–555. doi:10.1068/b32067
Verma, D., Mumm, O., and Carlow, V. M. (2021). Identifying streetscape features using VHR imagery and deep learning applications. Remote Sensing 13 (17). doi:10.3390/rs13173363
Yerra, B. L., and Levinson, D. M. (2005). The emergence of hierarchy in transportation networks. The Annals of Regional Science 39 (3), 541–553. doi:10.1007/s00168-005-0230-4
Zhang, H., and Li, Z. (2011). Weighted ego network for forming hierarchical structure of road networks. International Journal of Geographical Information Science 25, 255–272. doi:10.1080/13658810903313534
Keywords: street segment categorisation, network analysis, multiple centrality assessment, cluster analysis, sustainable urban mobility
Citation: Chen H-H, Mumm O and Carlow VM (2024) A computational approach for categorizing street segments in urban street networks based on topological properties. Front. Built Environ. 9:1216888. doi: 10.3389/fbuil.2023.1216888
Received: 04 May 2023; Accepted: 10 November 2023;
Published: 09 January 2024.
Edited by:
Meta Berghauser Pont, Chalmers University of Technology, SwedenReviewed by:
Miguel Serra, University of Porto, PortugalIoanna Stavroulaki, Chalmers University of Technology, Sweden
Copyright © 2024 Chen, Mumm and Carlow. This is an open-access article distributed under the terms of the Creative Commons Attribution License (CC BY). The use, distribution or reproduction in other forums is permitted, provided the original author(s) and the copyright owner(s) are credited and that the original publication in this journal is cited, in accordance with accepted academic practice. No use, distribution or reproduction is permitted which does not comply with these terms.
*Correspondence: Olaf Mumm, by5tdW1tQHR1LWJyYXVuc2Nod2VpZy5kZQ==