 Malhar Khan1
 Muhammad Amir Raza
 Ghulam Abbas
 Salwa Othmen
 Amr Yousef
- 1Department of Electrical Engineering, Mehran University of Engineering and Technology, SZAB Campus, Khairpur Mirs’, Sindh, Pakistan
- 2School of Electrical Engineering, Southeast University, Nanjing, China
- 3Department of Computers and Information Technologies, College of Sciences and Arts Turaif, Northern Border University, Arar, Saudi Arabia
- 4Electrical Engineering Department, University of Business and Technology, Jeddah, Saudi Arabia
- 5Engineering Mathematics Department, Alexandria University, Alexandria, Egypt
Autonomous vehicles can transform the transportation sector by offering a safer and more effective means of travel. However, the success of self-driving cars depends on their ability to navigate complex road conditions, including the detection of potholes. Potholes pose a substantial risk to vehicles and passengers, leading to potential damage and safety hazards, making their detection a critical task for autonomous driving. In this work, we propose a robust and efficient solution for pothole detection using the “you look only once (YOLO) algorithm of version 8, the newest deep learning object detection algorithm.” Our proposed system employs a deep learning methodology to identify real-time potholes, enabling autonomous vehicles to avoid potential hazards and minimise accident risk. We assess the effectiveness of our system using publicly available datasets and show that it outperforms existing state-of-the-art approaches in terms of accuracy and efficiency. Additionally, we investigate different data augmentation methods to enhance the detection capabilities of our proposed system. Our results demonstrate that YOLO V8-based pothole detection is a promising solution for autonomous driving and can significantly improve the safety and reliability of self-driving vehicles on the road. The results of our study are also compared with the results of YOLO V5.
1 Introduction
Over the past few years, there has been a conspicuous emphasis on the advancement of autonomous vehicles, driven by their remarkable potential to revolutionize transportation and mobility (Parekh et al., 2022). These self-driving cars, an epitome of cutting-edge implementation, incorporate many intelligent transport systems technologies within innovative urban transport systems (Bala et al., 2022). Equipped with advanced sensors and algorithms, autonomous vehicles can navigate and operate autonomously, eliminating the need for human intervention (Alsalman et al., 2021). They have significant potential for enhancing road safety, mitigating traffic congestion, and providing sustainable mobility solutions for future cities (Alsalman et al., 2021). In addition to their potential benefits, the widespread adoption carries significant implications for the environment and public health, as shown in Figure 1 (Raza et al., 2022a; Hakak et al., 2022; Raza et al., 2023). By substantially reducing carbon emissions, air pollution, and noise pollution, autonomous vehicles offer the prospect of elevating the overall quality of life within urban centres (Wynn et al., 2014; Raza et al., 2022b; Raza et al., 2022c).
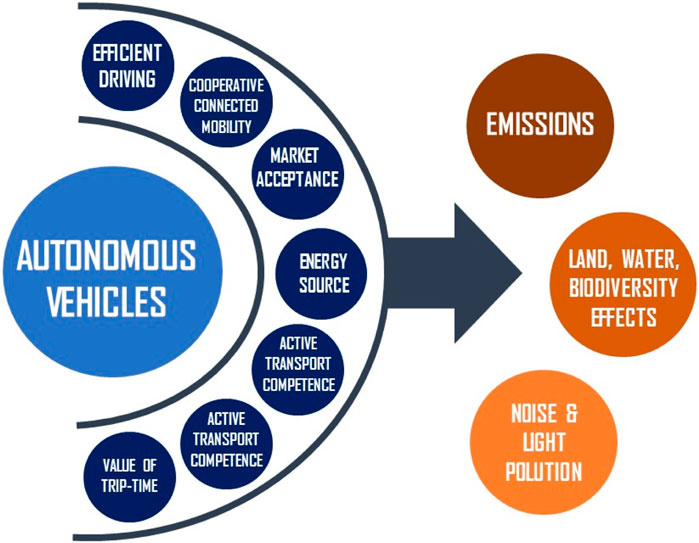
FIGURE 1. Environmental impacts of autonomous vehicles (Hakak et al., 2022).
Furthermore, their deployment can address one of the most pressing issues of road safety, namely, accidents caused by human error (Ahmed et al., 2022). As per the World Health Organization (WHO), a staggering 1.35 million lives are lost annually worldwide due to road accidents and bad climate (Iftikhar et al., 2022; Rehan et al., 2023a; Rehan et al., 2023b). The advent of autonomous vehicles promises to curb this distressing statistic (Iftikhar et al., 2022) significantly.
Integrating autonomous vehicles into the transportation ecosystem heralds a future characterized by enhanced road safety, reduced environmental impact, and improved public health (Zhang et al., 2021). However, realizing these aspirations necessitates addressing several challenges and intricacies (Abbas et al., 2023). These include developing sophisticated perception and decision-making systems, ensuring the seamless integration of autonomous and non-autonomous vehicles, establishing robust cyber security measures to safeguard against potential threats, and navigating the complex legal and regulatory landscape governing autonomous driving technologies (Azam et al., 2020). By actively addressing these challenges and capitalizing on the opportunities presented by autonomous vehicles, we can forge a path towards a sustainable, efficient, and safe future of transportation (Pendleton et al., 2017). As researchers, policymakers, and industry stakeholders unite their efforts, the transformative potential of autonomous vehicles will gradually unfold, revolutionizing how we travel and reshaping our cities for the better (Park et al., 2018).
Autonomous vehicles face numerous technical challenges as they strive to revolutionize transportation (Wang et al., 2021). Understanding and overcoming such challenges is essential to ensure autonomous vehicles’ successful deployment and integration into our daily lives (Wang et al., 2021). One significant challenge lies in perception and environment detection. Autonomous vehicles must accurately perceive and interpret their surroundings, including detecting and classifying objects, pedestrians, road conditions, and potential hazards (Collingwood, 2017). Ensuring robust perception capabilities is vital for safe navigation and decision-making. This challenge involves effectively handling diverse scenarios, dynamic environments, and sensor fusion to obtain precise and reliable information (Kavas-Torris et al., 2021). Another major hurdle is decision-making and planning. Autonomous vehicles must make real-time decisions based on sensor data, maps, and predefined rules (Woo et al., 2021). Handling complex scenarios such as navigating intersections, executing overtaking manoeuvres, and merging into traffic demands sophisticated decision-making algorithms that balance safety, efficiency, and legal compliance (Woo et al., 2021). Addressing this challenge involves managing uncertainty, accurately predicting the intentions of other road users, and optimizing decision-making under varying traffic conditions (Woo et al., 2021).
Safety is paramount in autonomous vehicle development. Ensuring the reliability and redundancy of systems is crucial (Acheampong and Cugurullo, 2019). Thoroughly validating the performance of sensors and algorithms through extensive testing and simulation is necessary to instil confidence in the technology (Acheampong and Cugurullo, 2019). Additionally, mitigating risks and addressing edge cases, such as rare events or challenging road situations, pose further challenges (Alghodhaifi and Lakshmanan, 2021). Autonomous vehicles also grapple with the complexities of communication and connectivity systems (Alghodhaifi and Lakshmanan, 2021). Reliable and high-bandwidth communication is essential for autonomous vehicles to exchange information with other vehicles, infrastructure, and cloud-based services (Alsulami et al., 2022). Establishing seamless communication, managing latency, ensuring data security, and developing robust communication protocols capable of handling the vast amount of data generated by autonomous vehicles are key challenges in this domain (Alsulami et al., 2022). Cyber security is another critical challenge. The reliance of autonomous vehicles on complex software systems and connectivity makes them vulnerable to cyber security threats (Kim et al., 2021). Protecting against hacking attempts, securing communication between vehicles and infrastructure, vehicle-to-vehicle connectivity, and ensuring data privacy are significant challenges that demand robust solutions (Rathore et al., 2022). Furthermore, integrating autonomous and non-autonomous vehicles poses challenges regarding coexistence and interaction (Wu et al., 2020). Ensuring smooth transitions, clear communication, and mutual understanding between these vehicles are essential for safe and efficient traffic flow (Wu et al., 2020).
Effectively addressing these technical challenges requires collaboration among researchers, policymakers, industry players, and the general public (Liu et al., 2020). Continuous research and development, establishing rigorous validation and testing methodologies, implementing robust policy frameworks, and raising public awareness are all crucial for overcoming these hurdles (Aldhyani and Alkahtani, 2022). Doing so can pave the way for the successful implementation of autonomous vehicles in our transportation systems (Taeihagh and Lim, 2019). Additionally, detecting potholes on the road presents a significant challenge for autonomous vehicles (Taeihagh and Lim, 2019). Potholes are common hazards on the road that can lead to substantial vehicle damage, endangering the safety of drivers and passengers (Kim et al., 2022). Detecting and avoiding potholes is crucial to ensure the safety of autonomous vehicles and passengers (Bhatia et al., 2022). To address this challenge, designing and developing computer vision algorithms for self-driving vehicles has become a prominent research field over the past decade. These algorithms are developed and extensively employed to detect potholes in the road (Madli et al., 2015; Ali et al., 2023d). One such technique is the YOLO V8 model, which is proposed in this research and is a well-known state-of-the-art algorithm for the application of object detection, which can efficiently identify potholes in real time. The YOLO V8 model works based on a deep neural network and employs a single-stage object detection approach, making it fast and efficient. It has been utilized successfully in various applications, such as surveillance and autonomous driving (Sharma and Sharma, 2019; Ma et al., 2022; Pandey et al., 2022).
In Section 2, the literature review revealed that other studies have considered some old modelling tools to detect potholes. However, our study presented the new and latest model, which helps to enhance the accuracy in detecting potholes for autonomous vehicles. Section 3 contains methodology which depicts the dataset of YOLO V8 and its configuration with data annotation, augmentation and performance evaluation matrices. Section 4 presented the complete results and the comparison of the YOLO V8 and YOLO V5 models. Finally, the conclusion is presented in Section 5.
2 Literature review
This work aims to investigate using the YOLO V8 model for pothole detection in autonomous vehicles. The paper will discuss the methodology employed for training and testing the model, evaluate its performance, and compare it with existing methods. The proposed work can improve the design and development of pothole detection systems for autonomous vehicles with improved robustness and reliability. These advancements will facilitate safer and more efficient operations on the road, ensuring the safety of passengers and fellow road users. Additionally, this research will have implications for road maintenance and safety, as it can help to identify and repair potholes before they become a hazard for drivers. Numerous methods have been proposed and employed with diverse techniques for pothole detection. For instance, in the study (KC, 2022), the authors of this paper used the YOLOX object detection algorithm to identify potholes on roads. The YOLOX is an enhanced iteration of the YOLO algorithm, integrating a backbone network to enhance detection accuracy while reducing computational costs (KC, 2022). Using a pothole dataset, the authors trained the YOLOX algorithm and assessed the findings by determining the accuracy, recall, and model size. The findings demonstrated an overall precision of 85.6%, and the model’s overall size amounted to 7.22 MB (KC, 2022).
In (Ali et al., 2023a), authors focused on evaluating the performance of YOLO, faster regions in addition to convolutional neural networks (R-CNN) together with a visual geometry group with 16 layers deep (VGG16) and residual network with 72 layer architecture layer with 18 deep layers to identify pothole. They further proposed an improved architecture for YOLO V2 to mitigate the problem of class imbalance of “pothole” and “normal road”. They have also compared its effectiveness to other object identification models by recall, precision, the number of frames processed in a second and the intersection over union. The authors could achieve better results for all the examined algorithms utilizing the least number of hyperparameters of 35 million and resulting in the highest number of frames processed in a second (28), precision at (0.87), and recall at (0.89) (Ali et al., 2023a). The study (Bučko et al., 2022) used YOLO V3 incorporating sparse R-CNN to detect potholes during changing weather conditions. The method was divided into two parts: dataset construction, processing data, and experiments on the dataset using YOLO V3. The authors obtained 77.1% and 72.6% accuracy on YOLO V3 and sparse R-CNN, respectively (Bučko et al., 2022).
There is increasing interest in connected and automated vehicles (CAVs) since their implementation will transform the nature of transportation and promote social and economic change. The transition toward cooperative driving still requires understanding some critical questions to assess the performances of CAVs and human-driven vehicles on roundabouts and to balance road safety and traffic efficiency requirements properly. In this view, this paper proposes a simulation-based methodological framework to assess increasing proportions of CAVs on roundabouts operating at a high-capacity utilization level. A roundabout was identified in Palermo City, Italy, and built in Aimsun (version 20) to describe the stepwise methodology (Tumminello et al., 2023).
The study (Magalhães et al., 2021) evaluated three different architectures, including YOLOV3, achieving an accuracy of 83.43%; YOLOV3 tiny, achieving 79.33%; and YOLOV3 single shot multi box detector (SSD), having 88.93% accuracy, and the area measurement accuracy was noted to be as 64.45%, 53.26%, and 72.10% for all above architectures respectively. The study (Kumar et al., 2020) deployed and tested different algorithms, including SSD tensor flow, YOLO V3 Darknet with 53 layers deep, and YOLO V4 cross-stage partial network (CSP) Darknet with 53 layers deep initially several images of potholes were captured by a cellphone-mounted on the car windshield then different object detection models were employed for identifying road potholes images given that YOLO V4 achieved a high recall, precision and mean average precision of 81%, 85% and 85.39% respectively.
This study (Wang et al., 2022) suggested a model using a darknet convolutional neural network for detecting potholes and approximating dimensions. The system gives the best results, precision-recall (0.5) of 0.665, 0.691 and 0.726, respectively, for the 270 epochs. The study (Ji et al., 2023) used the scaled YOLO V4 and developed two small models of small size that perform better, making the most of the vehicle’s constrained computational resources. Work showed the F1 score at 0.54 and 0.586, respectively. A semi-supervised learning technique based on the encodings learned through a combination of a class-conditional variation autoencoder and a Wasserstein generative adversarial network is proposed for classifying and identifying damage into various severity levels. Lastly, in the study (Jakubec et al., 2023), the risk and research evaluation method (SPFPN) YOLO V4 tiny is suggested by combining the two techniques of spatial pyramid pooling and feature pyramid network with Darknet-53. After the data augmentation, the dataset was divided into three sets: training, validation, and testing, with 70% of the data being used for training. The findings showed that the model performed better than YOLO V2, YOLO V3, YOLO V4, YOLO V4 small, and SPFPN-YOLO V4 tiny in terms of mean average precision, which improved by roughly 2%–5%.
Walking is an essential activity for every human being and has many advantages, including health, economic and environmental benefits. Every journey made using various means of transport begins and ends on foot. As is well known, the group of road users particularly exposed to the risk of serious injury in road accidents, apart from cyclists, also includes pedestrians. These are the so-called vulnerable road users. Pedestrians are a group of road users often deprecated by many drivers of motor vehicles, but they are essential in road traffic. Pedestrian injuries and pedestrian fatalities have enormous social and economic consequences. The problem of high pedestrian risk on roads is well known and has been widely described in the scientific literature over the last few years. However, the reasons for this state of affairs have yet to be fully explained, as evidenced by the statistics of road traffic incidents. Despite many studies in this area, the causes indicated in the research often differ depending on the area of analysis, the environment in which the incident took place, the location, participants of the incident, environmental conditions, behaviourism and many other features (Macioszek et al., 2023).
3 Research methodology
This study primarily focuses on developing a high-performing and accurate pothole detection system for autonomous vehicles using the YOLO V8 model. The YOLO V8 model was selected for pothole detection due to its high accuracy and efficiency. After downloading the dataset, the first step was to annotate the images using a suitable annotation tool. In this case, RoboFlow was used for annotation, which offers a simple and efficient way to annotate images. Once the annotation was complete, data augmentation techniques such as rotation, scaling, and flipping were used on data to create more variations of the same images. Such techniques generated an augmented dataset, which helped improve the model’s robustness and minimized overfitting. Once the data was annotated and augmented, it was divided in the ratio of 80:20 for training and testing the model. The training dataset consisted of 80% of the dataset used for training the model, while the remaining 20% of images were reserved for testing the model’s effectiveness. Then, the model was run on Google Colab, a platform that provides the necessary computing resources with 200 epochs, allowing it to learn and improve its pothole detection abilities. Figure 2 represents the detailed flow diagram for the proposed methodology.
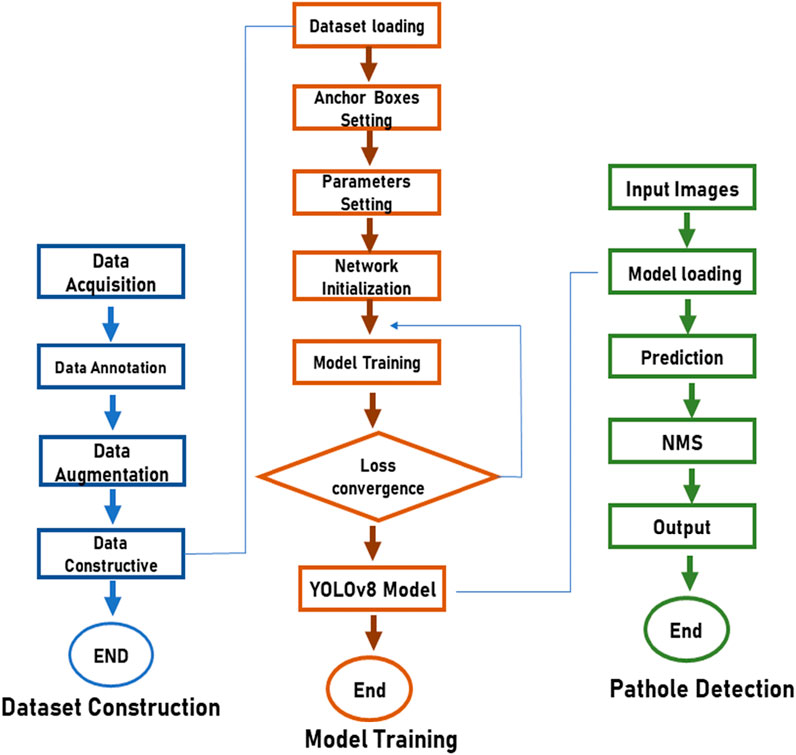
FIGURE 2. Shows the flow diagram of the proposed methodology.
3.1 YOLO V8 model description
YOLO V8 is the newest addition to the popular YOLO group of object detection models, which Ultralytics developed. This state-of-the-art model builds on the strengths of old versions of YOLO and provides a faster and more efficient detection system (Guo et al., 2023). One of the critical features of YOLO V8 is its new backbone network, which improves its accuracy and speed. The model also employs a new anchor-free head, eliminating the need for anchor boxes and improving its object detection performance (Al Muksit et al., 2022). In addition to object detection, YOLO V8 provides a unified framework to train the models for performing tasks such as image classification and instance segmentation (Al Muksit et al., 2022). The model demonstrates exceptional efficiency and versatility, accommodating a wide range of export formats and capable of functioning on both central processing units and graphics processing units (Raza et al., 2022d; Raza et al., 2022e; Borandag, 2023). The YOLO V8 package includes an extensive collection of models across detection, segmentation, and classification, with each category featuring five distinct models. These pre-trained models include object detection checkpoints, which are trained on the everyday object in context (COCO) detection dataset having a 640 resolution.
Moreover, the models encompass instance segmentation checkpoints trained on the COCO segmentation dataset at a 640 resolution and image classification models pre-trained on the ImageNet dataset at a resolution 224. YOLO V8 offers a powerful and versatile solution for various computer vision tasks with its new features and improved performance. It has rapidly gained popularity among computer vision researchers and developers (Habib et al., 2022).
The YOLO V8 model has demonstrated sufficient enhancements in performance compared to its predecessors. It outperforms YOLO V5, YOLO V7, and YOLO V6 models by a significant margin (Hussain, 2023). This is because YOLO V8 incorporates several new features, such as the recently developed backbone network, the innovative anchor-free head, and the loss function, which improve the model’s efficiency and speed. One of the notable improvements in the YOLO V8 model is its superior throughput compared to other YOLO algorithms, which are trained at 640 image resolution (Hussain, 2023). Despite having similar parameters, YOLO V8 demonstrates higher throughput, as shown in Figures 3A, B (Hussain, 2023; Ali et al., 2023b). This is due to its efficient design, which enables it to process large amounts of data quickly and accurately. A further detailed comparison is explained below in Table 1 (Hussain, 2023; Ali et al., 2023b).
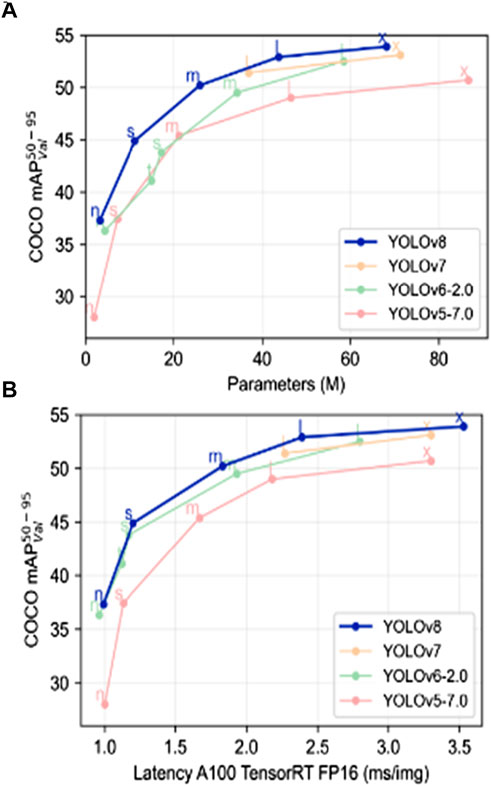
FIGURE 3. (A,B) Show the comparison between all the YOLO models trained at exact image resolution (Hussain, 2023; Ali et al., 2023b).
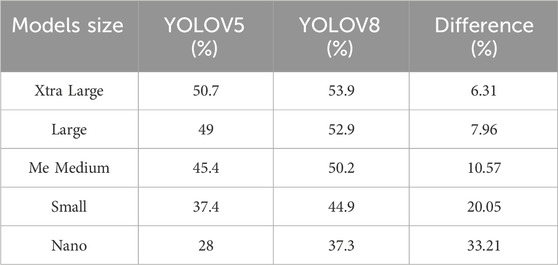
TABLE 1. Object detection comparison between YOLOV5 and YOLOV8 (Hussain, 2023; Ali et al., 2023b).
3.2 YOLOV5 model
YOLOV5, an evolution of the YOLO series, represents a state-of-the-art object detection model renowned for its speed, accuracy, and efficiency. Developed as an independent project, YOLOV5 adopts a streamlined architecture and leverages cutting-edge deep learning techniques. It is a versatile solution for many computer vision tasks, such as object detection, image classification, and image segmentation. In general applications, YOLOV5 excels in real-time object detection scenarios where speed is crucial. Its single-stage architecture lets it detect objects in a single pass, leading to remarkable inference times on various hardware platforms. It makes it a compelling choice for tasks requiring rapid processing without sacrificing accuracy. In the context of autonomous systems and vehicles, YOLOV5 plays a pivotal role in enabling robust and reliable autonomous navigation. The ability to quickly and accurately detect pedestrians, vehicles, traffic signs, and other objects in the surroundings empowers autonomous vehicles to make informed decisions, ensuring passenger safety and smooth operation on the road. YOLOV5’s efficiency and precision are paramount in autonomous driving, where real-time perception of the environment is essential for ensuring safe and efficient navigation. Furthermore, YOLO5 exhibits exceptional potential in pothole detection, which is critical to autonomous vehicles’ safety and infrastructure maintenance. Therefore, two different variants of YOLOV5, Yolov5 Small and YOLOv5 Large, have been implemented in this work as a benchmarking model to compare the effectiveness and superiority of the proposed YOLOv8 model for pothole detection.
3.3 Dataset
As part of this research project, authors sourced an openly available dataset from the Kaggle public library comprising 665 pothole images (Bučko et al., 2022; Thompson et al., 2022). Figure 4 provides a visual representation of a subset of these images utilized within the dataset (Bučko et al., 2022; Thompson et al., 2022). To pinpoint the pothole locations within the images, authors utilized the Pascal visual object class (VOC) annotation format, utilizing bounding boxes to mark the potholes accurately. The annotations for each image were stored in individual extensible markup language (XML) files. In contrast, a separate protobuf text file specified the dataset’s overall number and types of available classes. For our purposes, authors only needed one “pothole” class. However, the YOLOV8 model necessitates annotations in the COCO dataset format structured as a javascript object notation (JSON) file. A limitation of this format is the challenge of introducing more images to the dataset once it has been formatted. Splitting data between training and testing sets can be challenging, as all annotation information is saved in a single JSON file. To tackle these challenges, we converted the dataset into the Pascal VOC format, allowing every image to possess its annotation data saved in XML files. Subsequently, the authors divided the data into a ratio of 70:20:10 for training, validation and testing sets. The authors then converted the Pascal VOC annotations into the COCO format, consolidating all annotation details for the images into a single JSON file. Once the dataset was pre-processed and split, the authors used it to train the YOLOV8 model. After training, the authors tested the model’s effectiveness by making predictions on the testing set. This enabled us to analyze the model’s accuracy and determine whether its predictions were correct.
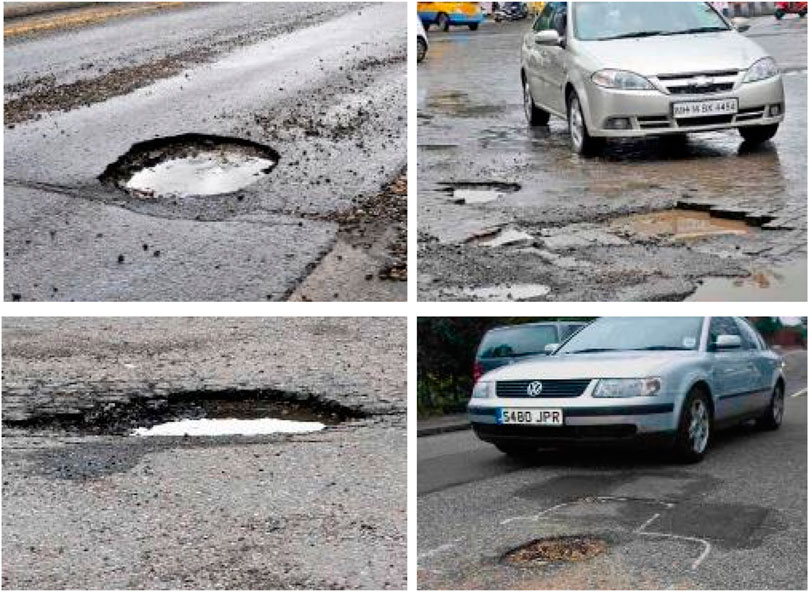
FIGURE 4. Shows some samples of Patholes’ images employed for testing the YOLOV8 model (Bučko et al., 2022; Thompson et al., 2022).
3.4 Data annotation
Data annotation is a well-known technique of labelling or tagging data in order to make it understandable for models. It involves adding metadata to raw data to make it more valuable and accessible to computer systems. In computer vision, data annotation involves adding labels or tags to images to mark the presence or absence of particular objects or features. For instance, in this case, the potholes were tagged to tell the YOLO model to understand the pothole, as shown in Figure 5. Data annotation is critical in developing computer vision models, providing the necessary information to learn and recognize objects. Accurate and detailed annotation can significantly improve the performance of computer vision models, while incorrect or incomplete annotation can result in inaccurate predictions and reduced model performance (KC, 2022). RoboFlow is a powerful tool for data annotation used in this study. It provides a simple and efficient way to label images for computer vision tasks. It offers a user-friendly interface that allows users to easily annotate images using a variety of annotation types, including bounding boxes, polygons, and points (Sharma et al., 2022; Shandilya et al., 2023). To perform data annotation using RoboFlow, the first image dataset was uploaded to the platform. Then, the annotation type was selected as Pascal VOC. Once the annotation was completed, the annotated images were exported in COCO format as YOLO requires this format. These annotated images were then employed to train and test the model for detecting potholes.

FIGURE 5. Shows some examples of annotated images.
3.5 Data augmentation
In machine learning, data augmentation is a technique that expands the training dataset by creating additional variations of existing data with diverse attributes (Shorten et al., 2021). This approach improves the model’s capacity to make generalizations and reduces the risk of overfitting (Shorten et al., 2021). Data augmentation can be done in several ways: rotation, zooming, contrast, blur, scaling, flipping, and adding noise (Chlap et al., 2021). The impact of data augmentation on the model is that it increases the robustness of the model by making it more capable of handling variations in the input data. This makes the model more reliable and accurate when predicting real-world data.
Additionally, data augmentation provides a solution to mitigate overfitting. In this situation, a model becomes overly specialized to the training data, leading to suboptimal performance when dealing with new and unfamiliar data (Lashgari et al., 2020). Our research used RoboFlow to perform data augmentation on our dataset. RoboFlow is a robust platform that offers various data augmentation techniques to enhance the model’s accuracy and robustness. It offers a user-friendly and efficient means of producing augmented data without requiring any coding skills. To use RoboFlow for data augmentation, authors first uploaded the annotated dataset to the platform. We then selected the augmentation techniques we wanted to apply to our images, such as rotation, contrast, and zooming, as shown in Figure 6.
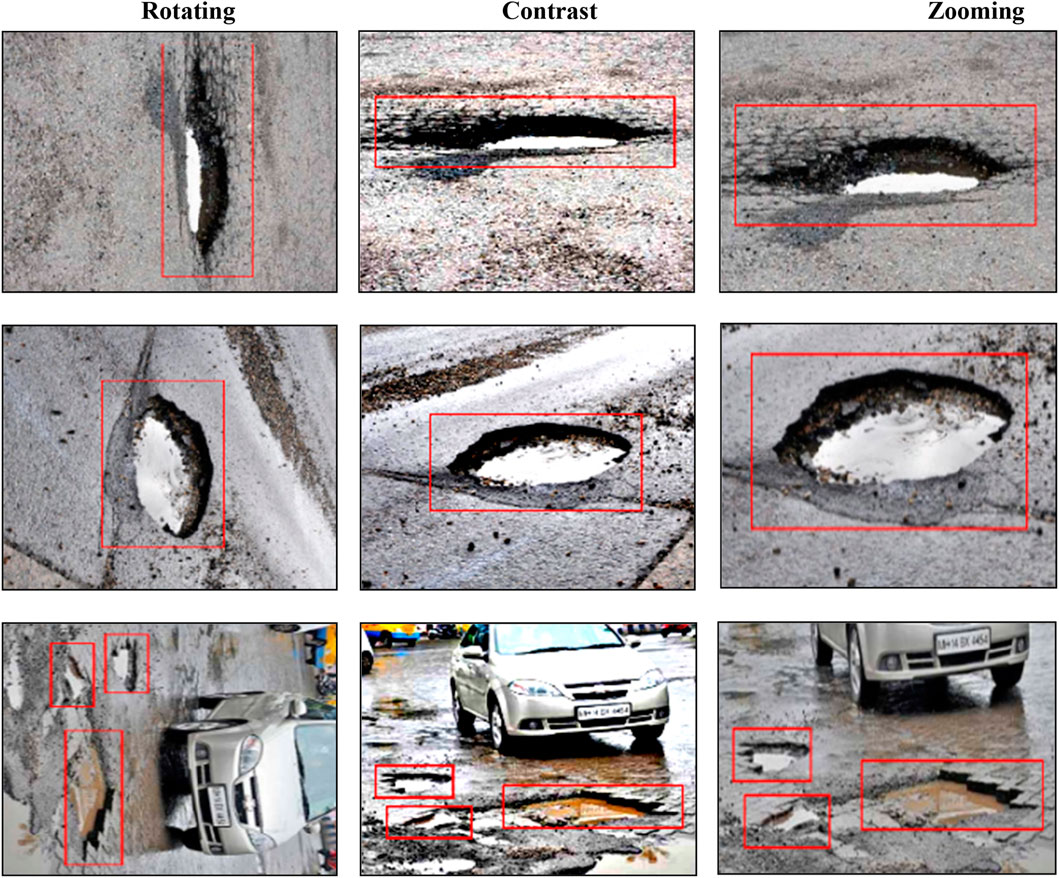
FIGURE 6. Shows some examples of data augmentation.
RoboFlow also offers advanced techniques like mosaic, mix-up, and cut mix, which can further enhance the model’s performance. After selecting the augmentation techniques, we applied them to our images and generated a new dataset with augmented images. This process helped increase our dataset’s diversity and reduced the risk of overfitting. Moreover, data augmentation helped the model to generalize better by improving its ability to recognize potholes in various lighting conditions, angles, and perspectives. RoboFlow also provides an option to preview the augmented images before downloading them. This helped to verify that the augmentation was performed correctly and that the images were suitable for training the model. Overall, the use of RoboFlow for data augmentation provided a valuable and efficient way to enhance the efficiency of our model, exclusive to the need for extensive coding or technical skills.
3.6 Dataset configuration
As shown in Table 2, the initial dataset comprised 665 images, with 465 images designated for training, 133 for validation, and 65 for testing purposes. Data augmentation methods were implemented to enrich the dataset and increase its diversity, including image rotation, contrast adjustment, and zooming. As a result, the dataset was expanded to contain 1,497 images. The augmented dataset was split into three similar sets for training, validation, and testing, following a division of 70:20:10. The approach of augmenting the dataset through image rotation, referred to as the Rotating-dataset augmentation method, was employed on 335 images within the dataset. This encompassed 235 images from the training, 65 from the validation, and 45 from the testing set. This technique enhances the model’s resilience in effectively dealing with diverse object orientations in real-world situations. In the next step, the augmentation process enhanced the dataset by adjusting the contrast of 310 images. Notably, this set comprised 215 images from the training dataset, 60 from the validation dataset, and 35 from the testing dataset. This technique involves changing the contrast of an image by scaling the pixel values, making the model more effective in handling images captured under varying lighting conditions. Finally, the Zooming augmentation technique was applied to 187 images in the dataset. This technique helps the model learn to detect objects at different scales and better handle objects of varying sizes. Among the images, 140 were from the training set, 42 were from the validation set, and 20 were from the test set. The resulting augmented dataset exhibits increased diversity and variability that is expected to improve the model’s generalization and performance in detecting objects, such as potholes, in the context of this study.
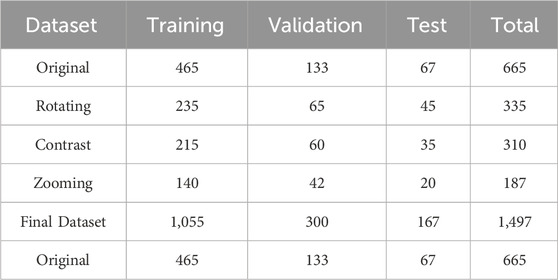
TABLE 2. The final dataset after the data augmentation techniques are applied.
3.7 Evaluation matrices
Evaluation parameters such as F1, confusion matrix, and recall are considered in assessing the model’s exceptional accuracy and precision.
3.7.1 F1 score
The F1 score is the most commonly considered performance metric in computer vision, particularly in binary classification tasks, to assess the model’s accuracy and balance between precision and recall (Laila et al., 2022). It is precious when dealing with imbalanced datasets, where one class significantly outweighs the other. The F1 score combines recall and precision into a single measure, providing a more comprehensive evaluation of the model’s performance (Laila et al., 2022). The F1 score includes the harmonic mean of precision and recall, and its value ranges from 0 to 1, with 1 being the best possible score (El-Hasnony et al., 2022). It balances the precision and recall value, providing a single value that considers both false positives and false negatives (Naudé et al., 2023). This is particularly important in scenarios like pothole detection for autonomous vehicles, where correctly identifying potholes is crucial for safety, and false negatives (missing actual potholes) can have significant consequences (Naudé et al., 2023). In pothole detection for autonomous vehicles using YOLOV8, the F1 score becomes a critical metric for model performance evaluation (Bosurgi et al., 2022). A high F1 score indicates that the model accurately detects potholes while minimizing false positives and negatives (Sathya and Saleena, 2022). This means the model can provide reliable and real-time information to the autonomous vehicle system about the presence of potholes on the road, enabling safe navigation and proactive measures to avoid potential hazards (Sathya and Saleena, 2022). Achieving a high F1 score in pothole detection is paramount to ensuring the safety and efficiency of autonomous driving systems, reducing accidents, and improving the overall driving experience for passengers and pedestrians (Sathya and Saleena, 2022).
The F1 score is calculated based on precision and recall, two performance metrics commonly used in binary classification tasks. In binary classification, there are two classes: positive and negative. Precision evaluates the fraction of true positive predictions among all positive predictions made by the model. In recall, the model’s true positive predictions are divided by the total number of positive instances in the dataset (Gajjar et al., 2022). To calculate the F1 score, we use the harmonic mean of precision and recall, as shown in Eq. 1 (Gajjar et al., 2022):
3.7.2 Confusion matrix
A confusion matrix is a table that helps evaluate the effectiveness of deep learning models by comparing their predicted results to actual results (Ali et al., 2023c). It provides a matrix-based representation of true positives, false positives, and false negatives. True positives denote correctly predicted positive instances, false positives indicate incorrectly predicted positive instances, true negatives represent correctly predicted negative instances, and false negatives signify incorrectly predicted negative instances (Ali et al., 2023c). The confusion matrix plays a pivotal role in the computation of evaluation metrics such as accuracy, precision, recall, and F1-score (Saisree and Kumaran, 2023). It offers a valuable understanding of the model’s strengths and weaknesses, identifies the errors made, and makes necessary improvements to the model to increase its performance (Saisree and Kumaran, 2023).
3.7.3 Precision
Precision is the most commonly employed evaluation parameter in machine learning which demonstrates the exactness of a classifier or model (Kim et al., 2022). It refers to the proportion of true positives (rightly predicted positive instances) to the overall number of instances which are predicted as positive. In other words, precision measures the accuracy of positive predictions carried out by a model (Zhou et al., 2019). A good precision value shows that the model has a low false positive rate, indicating that it is highly accurate in correctly identifying positive instances. Conversely, a low precision value shows that the model has a high false positive rate, which means it needs to be more accurate in identifying true positive instances (Salaudeen and Çelebi, 2022). Precision is a critical metric for a classifier’s performance evaluation, especially when false positives have severe consequences. For example, in a medical diagnosis scenario, a false positive diagnosis could lead to unnecessary medical treatments or surgeries, causing physical, emotional, and financial harm to the patient (KC, 2022). Hence, in such cases, high precision is of utmost importance. To calculate precision, we use Eq. 2 (KC, 2022). In Eq. 2 True positives refer to the rightly predicted positive instances, and false positives refer to those predicted as positive but negative.
3.7.4 Recall
In deep learning prediction models, recall is a performance parameter determining the model’s ability to predict all positive samples (Pandey et al., 2022) correctly. It is also referred to as sensitivity or true positive rate. When dealing with classification problems, recall is computed by dividing the number of true positive predictions by the sum of true positive and false negative predictions (Sathya et al., 2022). In simpler terms, recall represents the ratio of correctly predicted actual positive samples by the model. A good recall value shows that the model has fewer false negatives, which means it can effectively identify all relevant samples. To calculate recall, we use Eq. 3 (Sathya et al., 2022). Recall is an essential metric in many applications, such as medical diagnosis and fraud detection, where correctly identifying all positive instances is essential. However, a high recall score often comes at the cost of a lower precision score, as the model may also identify some false positives. Hence, it is crucial to consider both precision and recall when assessing the effectiveness of a deep-learning prediction model (Xin et al., 2023).
4 Results and discussion
The objective of this study is to develop an efficient and reliable solution for the detection of potholes for autonomous vehicles. The latest deep learning model, YOLOV8, known for its excellent performance in object detection, was chosen to achieve this objective. In this section, we present the performance metrics obtained from our proposed YOLOV8 model and compare them with two variants of YOLOV5: YOLOV5s and YOLOV5l. The results of all the models were evaluated based on various performance metrics. Figure 7 demonstrates the model’s F1 confidence, which was found to be at its maximum value of 1.0 for YOLOV8, 0.81 for YOLOV5s and 0.81 for YOLOV5L respectively, which indicates that the proposed model is highly accurate in detecting potholes. The precision-recall curve, as shown in Figure 8, also demonstrated high precision-recall rates at a high value of 0.995 compared to the precision-recall values of YOLOV5s and YOLOV5L which stood at 0.84 and 0.853, further highlighting the model’s effectiveness. The precision confidence curve, as shown in Figure 9, shows the precision values of all models, indicating that the model had a high level of confidence in its predictions, with all classes having a maximum value of 1.0, including the benchmark models’ which could also achieve a high precision value of 1.00.
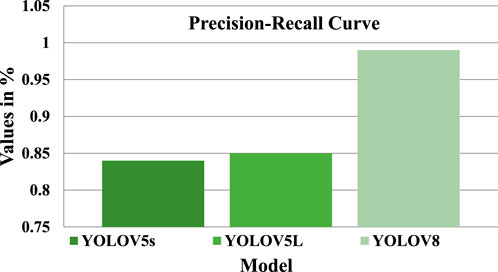
FIGURE 7. Shows the PR Curve scores of all models.
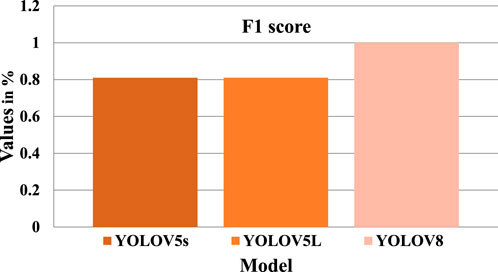
FIGURE 8. Shows the F1 scores of all models.
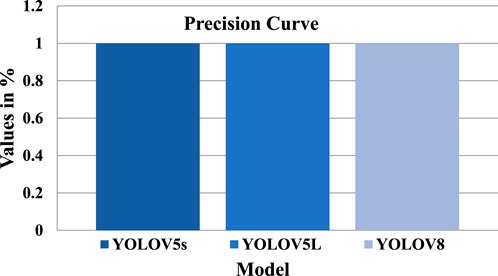
FIGURE 9. Shows the Precision scores of all models.
Similarly, the recall confidence was also at 1.0 for the proposed model, as shown in Figure 10, and the benchmark models’ YOLOV5s and YOLOV5L could achieve 0.90 and 0.86 only, which confirms the proposed model’s capability for accurately detecting potholes. Table 3 summarizes all the results for three models, proving that the pothole detection model using YOLOV8 is highly accurate and effective in its task. This research contributes to developing autonomous vehicles that can safely navigate roads with potholes, decreasing the risk of accidents and enhancing road safety.
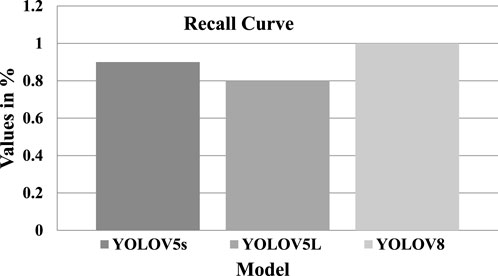
FIGURE 10. Shows the Recall scores of all models.
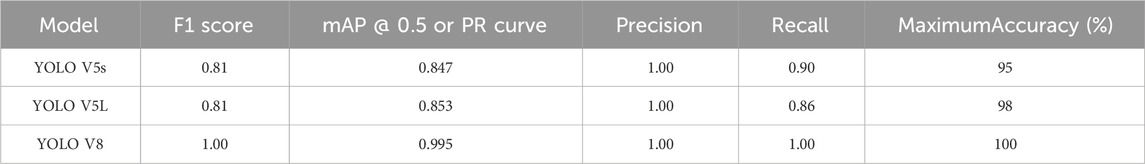
TABLE 3. Performance comparison of YOLOV5s, YOLOV5L and YOLOV8.
The F1 confidence curve for our pothole detection model is shown in Figure 11, which indicates that, at a confidence threshold of 0.248 (24.8%), the model achieved a perfect accuracy of 100% for all classes. This means the model consistently identifies potholes with high precision (low false positives) and high recall (low false negatives) across all confidence levels. Even at lower confidence thresholds, the model’s performance remains excellent, ensuring that almost all identified potholes are genuine while minimizing the risk of false alarms. The precision-recall curve of our pothole detection model is shown in Figure 12 with an accuracy of 0.995 at a confidence threshold of 0.5, demonstrating its excellent performance. At this threshold, the model achieves a high accuracy of 99.5% by accurately identifying potholes with minimal false positives, reducing false alarms. The curve illustrates the trade-off between precision and recall, indicating that precision improves as the confidence threshold increases while recall may decrease. The model’s reliable pothole detection capability, particularly at the chosen threshold, makes it a valuable tool for enhancing road safety and infrastructure maintenance.
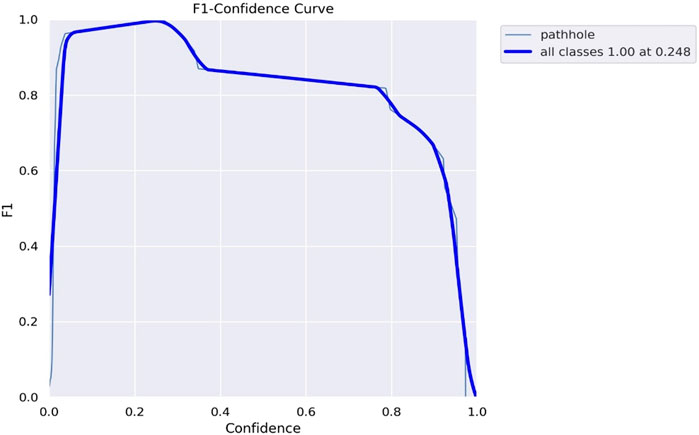
FIGURE 11. Shows the F1 confidence curve.
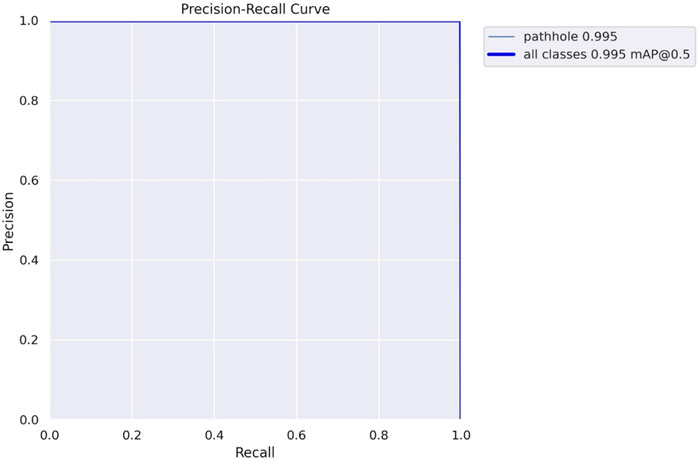
FIGURE 12. Shows the precision-recall curve.
The precision confidence curve is shown in Figure 13, which shows that, at a confidence threshold of 0.29, the model achieves a perfect accuracy of 100%. It accurately identifies potholes without any false positives, demonstrating excellent precision. As the confidence threshold increases, the model’s precision remains consistently high. This outstanding performance makes our pothole detection model a valuable tool for enhancing road safety and infrastructure maintenance. The recall confidence curve is shown in Figure 14, which indicates that, at a confidence threshold of 0.000, the model achieved a perfect accuracy of 100%. It accurately detected all potholes without false negatives, showcasing excellent recall performance. As the confidence threshold increased, the model’s recall remained consistently high, demonstrating its reliable ability to detect potholes accurately at higher confidence levels. This exceptional performance makes our pothole detection model a valuable and robust tool for enhancing road safety and infrastructure maintenance.
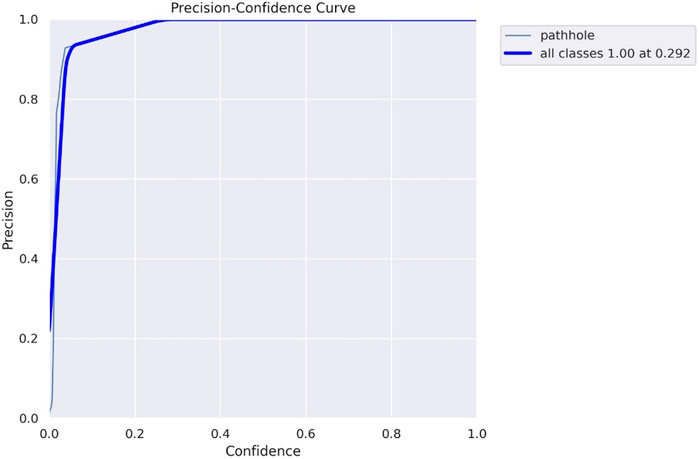
FIGURE 13. Shows precision-confidence curve.
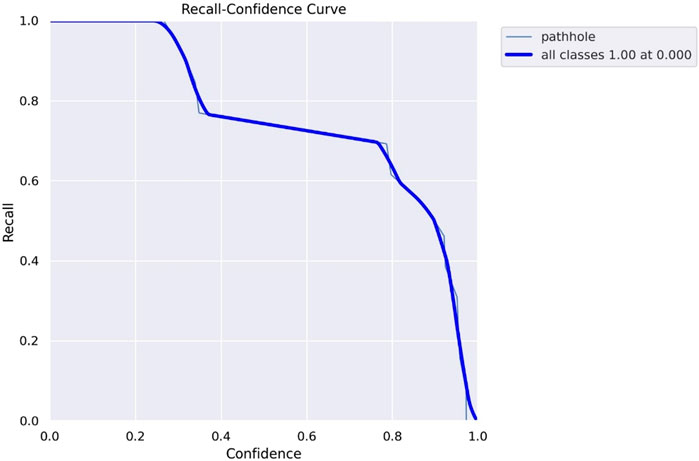
FIGURE 14. Shows recall-confidence curve.
The superior performance of the proposed YOLOV8 model in pothole detection is evident when compared to the results of YOLOV5s and YOLOV5L. As shown in Figure 15, YOLOV8 achieved a remarkable accuracy of 100% across all images, indicating that it successfully identified every pothole in the dataset. This consistent and perfect accuracy underscores the effectiveness and reliability of YOLOV8 in the context of pothole detection, positioning it as a promising solution for real-world applications. In contrast, YOLOV5s and YOLOV5L exhibited accuracy levels ranging from 69% to 95% and 93%–98%, respectively. While these accuracies are also commendable, they exhibit variations in their detection capabilities across different images. This variability may be attributed to the generalization nature of YOLOV5s and YOLOV5L, which are not explicitly fine-tuned for pothole detection like the proposed YOLOv8 model. The comparison between YOLOV8, YOLOV5s, and YOLOV5L demonstrates the superiority of YOLOV8 in pothole detection. Its consistent and perfect accuracy distinguishes it as the most reliable and efficient model for detecting potholes. The findings highlight the importance of customizing models for specific tasks, such as pothole detection, to achieve exceptional accuracy and enhance the system’s overall performance.
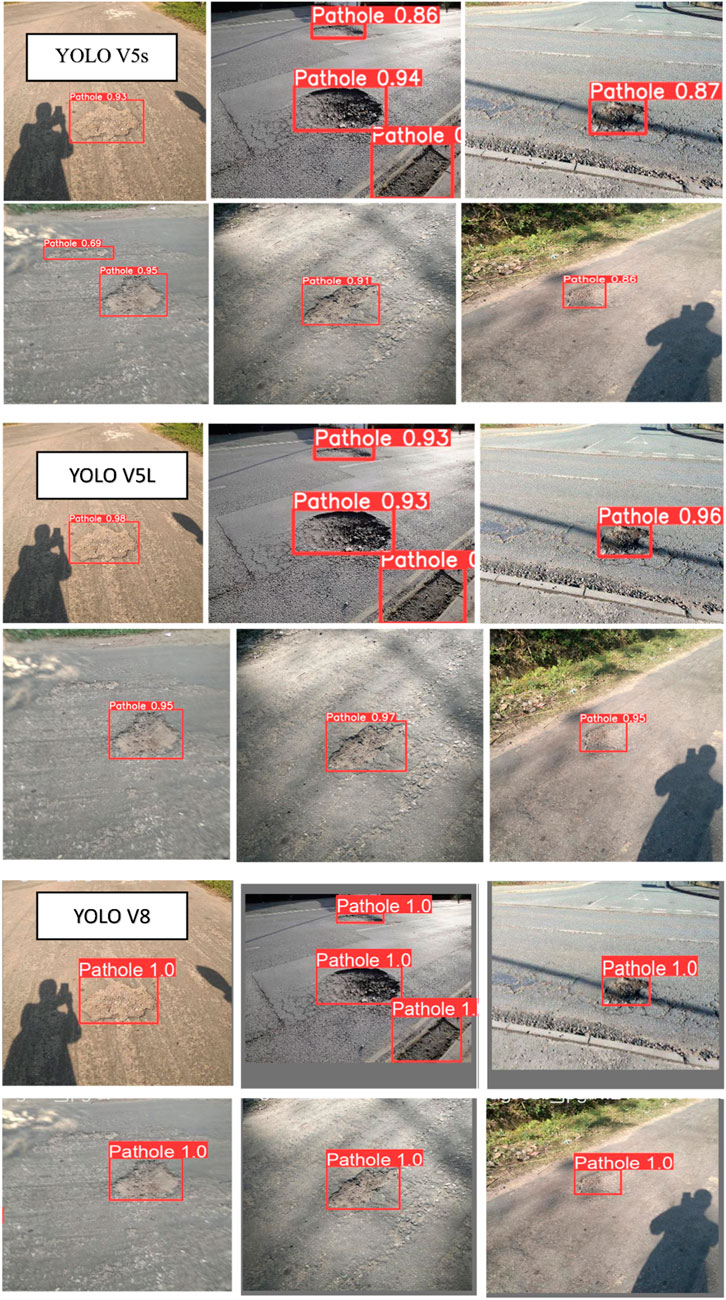
FIGURE 15. Shows the results of patholes detected by all three models.
The pothole detection model based on YOLOV8 achieved remarkable performance with 100% accuracy, confusion matrix as shown in Figure 16, with 100% accuracy and only a value of 1 in the true positive box indicates excellent performance. The model correctly predicted all images containing potholes (True Positive) without missing any potholes in the dataset (False Negative). Although the true negatives (images correctly classified as no potholes) are not explicitly shown in the confusion matrix, the model’s perfect accuracy implies that all non-pothole images were accurately identified. This exceptional accuracy underscores the effectiveness of the YOLOV8 approach for pothole detection, making it a significant accomplishment for pothole detection in autonomous vehicles.
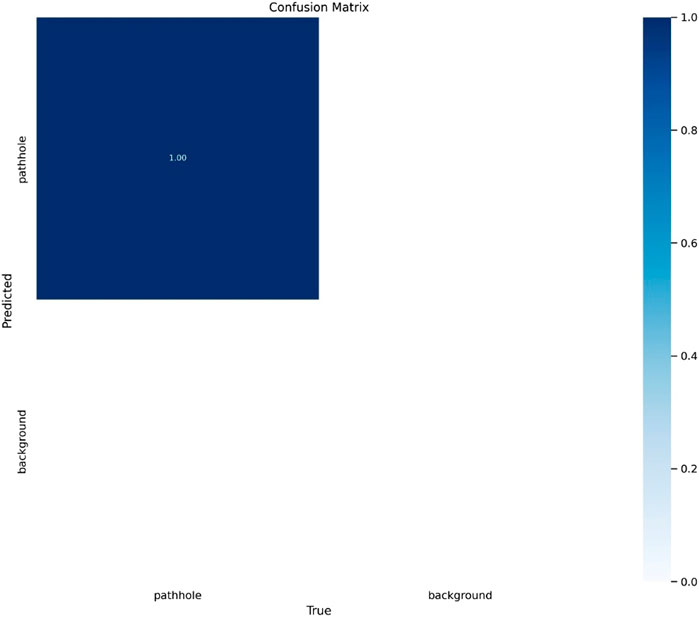
FIGURE 16. Shows the confusion matrix of YOLOv8 model.
5 Conclusion
This work presents a novel and efficient solution for pothole detection in autonomous vehicles using YOLOV8, a state-of-the-art deep learning model. The study was motivated by the critical need for accurate pothole detection to enhance the safety and reliability of autonomous navigation. The proposed YOLOV8 model was evaluated on various performance metrics, including the F1 confidence score, precision-recall curve, precision confidence curve, and recall confidence curve. The evaluation results demonstrate that the proposed model is highly accurate and detects potholes. The F1 confidence score of 1.0 achieved by YOLOV8 highlights its exceptional accuracy in detecting potholes, surpassing the performance of YOLOV5s and YOLOV5L, which obtained F1 scores of 0.81. The precision-recall curve demonstrated YOLOV8’s ability to achieve high precision-recall rates at an impressive value of 0.995, compared to YOLOV5s and YOLOV5l with values of 0.84 and 0.853, respectively, further validating its effectiveness.
Furthermore, the precision confidence curve showcased the model’s confidence in its predictions, with all classes, including the benchmark models YOLOV5s and YOLOV5L, achieving a maximum precision value of 1.0. Similarly, the recall confidence curve highlighted YOLOV8’s capability to achieve recall confidence of 1.0, while YOLOV5s and YOLOV5l achieved values of 0.90 and 0.86, respectively. The results of this study confirm that the proposed YOLOV8-based pothole detection model is highly accurate and effective in its task. The findings of this research have important implications for the development of autonomous vehicles that can safely navigate roads with potholes. By contributing to the development of safer autonomous vehicles, this research addresses a critical aspect of road safety, reducing the risk of accidents and enhancing overall transportation infrastructure.
Data availability statement
The original contributions presented in the study are included in the article/Supplementary material, further inquiries can be directed to the corresponding author.
Author contributions
MK: Conceptualization, Data curation, Investigation, Software, Writing–original draft, Writing–review and editing. MR: Software, Supervision, Validation, Writing–original draft, Writing–review and editing. GA: Validation, Visualization, Writing–original draft. Writing–review and editing. SO: Formal Analysis, Funding acquisition, Project administration, Resources, AY: Funding acquisition, Project administration, Writing–review and editing. TJ: Resources, Supervision, Writing–review and editing.
Funding
The author(s) declare that no financial support was received for the research, authorship, and/or publication of this article.
Acknowledgments
The authors extend their appreciation to the Deanship of Scientific Research at Northern Border University, Arar, KSA for funding this research work through the project number “NBU-FFR-2023-0193”.
Conflict of interest
The authors declare that the research was conducted in the absence of any commercial or financial relationships that could be construed as a potential conflict of interest.
Publisher’s note
All claims expressed in this article are solely those of the authors and do not necessarily represent those of their affiliated organizations, or those of the publisher, the editors and the reviewers. Any product that may be evaluated in this article, or claim that may be made by its manufacturer, is not guaranteed or endorsed by the publisher.
References
Abbas, G., Bhutto, A. A., Jumani, T. A., Mirsaeidi, S., Tunio, M. A., Alnuman, H., et al. (2023). Modified particle swarm optimization algorithm for power sharing and transient response improvement of a grid-tied solar PV based A.C. microgrid. Energies 16 (348). doi:10.3390/en16010348
Acheampong, R. A., and Cugurullo, F. (2019). Capturing the behavioural determinants behind the adoption of autonomous vehicles: conceptual frameworks and measurement models to predict public transport, sharing and ownership trends of self-driving cars. Transp. Res. part F Traffic Psychol. Behav. 62, 349–375. doi:10.1016/j.trf.2019.01.009
Ahmed, H. U., Huang, Y., Lu, P., and Bridgelall, R. (2022). Technology developments and impacts of connected and autonomous vehicles: an overview. Smart Cities 5 (1), 382–404. doi:10.3390/smartcities5010022
Aldhyani, T. H., and Alkahtani, H. (2022). Attacks to automatous vehicles: a deep learning algorithm for cybersecurity. Sensors 22 (1), 360. doi:10.3390/s22010360
Alghodhaifi, H., and Lakshmanan, S. (2021). Autonomous vehicle evaluation: a comprehensive survey on modeling and simulation approaches. IEEE Access 9, 151531–151566. doi:10.1109/access.2021.3125620
Ali, A., Abbas, G., Keerio, M. U., Koondhar, M. A., Chandni, K., and Mirsaeidi, S. (2023a). Solution of constrained mixed-integer multi-objective optimal power flow problem considering the hybrid multi-objective evolutionary algorithm. IET Gener. Transm. Distrib. 17, 66–90. doi:10.1049/gtd2.12664
Ali, A., Abbas, G., Keerio, M. U., Mirsaeidi, S., Alshahr, S., and Alshahir, A. (2023b). “Multi-objective optimal siting and sizing of distributed generators and shunt capacitors considering the effect of voltage-dependent nonlinear load models,” in IEEE Access 11, 21465–24318. doi:10.1109/ACCESS.2023.3250760
Ali, A., Abbas, G., Keerio, M. U., Mirsaeidi, S., Alshahr, S., and Alshahir, A. (2023c). “Pareto front-based multiobjective optimization of distributed generation considering the effect of voltage-dependent nonlinear load models,” in IEEE access 11, 12195–12217. doi:10.1109/ACCESS.2023.3242546
Ali, A., Keerio, M. U., Touti, E., Ahmed, Z., and Alsalman, O. (2023d). “A Bi-level techno-economic optimal reactive power dispatch considering wind and solar power integration,” in IEEE Access 11, 62799–62819. doi:10.1109/ACCESS.2023.3286930
Al Muksit, A., Hasan, F., Hasan Bhuiyan Emon, M. F., Haque, M. R., Anwary, A. R., and Shatabda, S. (2022). YOLO-Fish: a robust fish detection model to detect fish in realistic underwater environment. Ecol. Inf. 72, 101847. doi:10.1016/j.ecoinf.2022.101847
Alsalman, A., Assi, L. N., Ghotbi, S., Ghahari, S., and Shubbar, A. (2021). Users, planners, and governments perspectives: a public survey on autonomous vehicles future advancements. Transp. Eng. 3, 100044. doi:10.1016/j.treng.2020.100044
Alsulami, A. A., Abu Al-Haija, Q., Alqahtani, A., and Alsini, R. (2022). Symmetrical simulation scheme for anomaly detection in autonomous vehicles based on LSTM model. Symmetry 14 (7), 1450. doi:10.3390/sym14071450
Azam, S., Munir, F., Sheri, A. M., Kim, J., and Jeon, M. (2020). System, design and experimental validation of autonomous vehicle in an unconstrained environment. Sensors 20 (21), 5999. doi:10.3390/s20215999
Bala, J. A., Adeshina, S. A., and Aibinu, A. M. (2022). Advances in visual simultaneous localisation and mapping techniques for autonomous vehicles: a review. Sensors 22 (22), 8943. doi:10.3390/s22228943
Bhatia, Y., Rai, R., Gupta, V., Aggarwal, N., and Akula, A. (2022). Convolutional neural networks based potholes detection using thermal imaging. J. King Saud University-Computer Inf. Sci. 34 (3), 578–588. doi:10.1016/j.jksuci.2019.02.004
Borandag, E. (2023). A blockchain-based recycling platform using image processing, QR codes, and IoT system. Sustainability 15 (7), 6116. doi:10.3390/su15076116
Bosurgi, G., Modica, M., Pellegrino, O., and Sollazzo, G. (2022). An automatic pothole detection algorithm using pavement 3D data. Int. J. Pavement Eng. 24, 1–15. doi:10.1080/10298436.2022.2057978
Bučko, B., Lieskovská, E., Zábovská, K., and Zábovský, M. (2022). Computer vision-based pothole detection under challenging conditions. Sensors 22 (22), 8878. doi:10.3390/s22228878
Chlap, P., Min, H., Vandenberg, N., Dowling, J., Holloway, L., and Haworth, A. (2021). A review of medical image data augmentation techniques for deep learning applications. J. Med. Imaging Radiat. Oncol. 65 (5), 545–563. doi:10.1111/1754-9485.13261
Collingwood, L. (2017). Privacy implications and liability issues of autonomous vehicles. Inf. Commun. Technol. Law 26 (1), 32–45. doi:10.1080/13600834.2017.1269871
El-Hasnony, I. M., Elzeki, O. M., Alshehri, A., and Salem, H. (2022). Multi-label active learning-based machine learning model for heart disease prediction. Sensors 22 (3), 1184. doi:10.3390/s22031184
Gajjar, K., van Niekerk, T., Wilm, T., and Mercorelli, P. (2022). Vision-based deep learning algorithm for detecting potholes. J. Phys. Conf. Ser. 2162, 12019. doi:10.1088/1742-6596/2162/1/012019
Guo, J., Lou, H., Chen, H., Liu, H., Gu, J., Bi, L., et al. (2023). A new detection algorithm for alien intrusion on highway. Sci. Rep. 13 (1), 10667. doi:10.1038/s41598-023-37686-w
Habib, S., Abbas, G., Jumani, T. A., Bhutto, A. A., Mirsaeidi, S., and Ahmed, E. M. (2022). Improved Whale Optimization Algorithm for Transient Response, Robustness, and Stability Enhancement of an Automatic Voltage Regulator System. Energies 15, 5037. doi:10.3390/en15145037
Hakak, S., Gadekallu, T. R., Maddikunta, P. K. R., Ramu, S. P., M, P., De Alwis, C., et al. (2022). Autonomous vehicles in 5G and beyond: a survey. Veh. Commun. 39, 100551. doi:10.1016/j.vehcom.2022.100551
Hussain, M. (2023). YOLO-v1 to YOLO-v8, the rise of YOLO and its complementary nature toward digital manufacturing and industrial defect detection. Machines 11 (7), 677. doi:10.3390/machines11070677
Iftikhar, S., Asim, M., Zhang, Z., and El-Latif, A. A. A. (2022). Advance generalization technique through 3D CNN to overcome the false positives pedestrian in autonomous vehicles. Telecommun. Syst. 80 (4), 545–557. doi:10.1007/s11235-022-00930-1
Jakubec, M., Lieskovská, E., Bučko, B., and Zábovská, K. (2023). Comparison of CNN-based models for pothole detection in real-world adverse conditions: overview and evaluation. Appl. Sci. 13 (9), 5810. doi:10.3390/app13095810
Ji, S.-J., Ling, Q.-H., and Han, F. (2023). An improved algorithm for small object detection based on YOLO v4 and multi-scale contextual information. Comput. Electr. Eng. 105, 108490. doi:10.1016/j.compeleceng.2022.108490
Kavas-Torris, O., Lackey, N., and Guvenc, L. (2021). Simulating the effect of autonomous vehicles on roadway mobility in a microscopic traffic simulator. Int. J. Automot. Technol. 22 (3), 713–733. doi:10.1007/s12239-021-0066-7
Kc, S. (2022). Enhanced pothole detection system using YOLOX algorithm. Aut. Intell. Syst. 2 (1), 22. doi:10.1007/s43684-022-00037-z
Kim, K., Kim, J. S., Jeong, S., Park, J. H., and Kim, H. K.Cyber, Cybersecurity for autonomous vehicles: review of attacks and defense. Comput. Secur., 2021. 103: p. 102150, doi:10.1016/j.cose.2020.102150
Kim, Y.-M., Son, S. Y., Lim, S. Y., Choi, B. Y., Choi, D. H., et al. (2022). Review of recent automated pothole-detection methods. Appl. Sci. 12 (11), 5320. doi:10.3390/app12115320
Kumar, A., Zhang, Z. J., and Lyu, H. (2020). Object detection in real-time based on improved single shot multi-box detector algorithm. EURASIP J. Wirel. Commun. Netw. 2020, 204–218. doi:10.1186/s13638-020-01826-x
Laila, U. e., Mahboob, K., Khan, A. W., Khan, F., and Taekeun, W. (2022). An ensemble approach to predict early-stage diabetes risk using machine learning: an empirical study. Sensors 22 (14), 5247. doi:10.3390/s22145247
Lashgari, E., Liang, D., and Maoz, U. (2020). Data augmentation for deep-learning-based electroencephalography. J. Neurosci. Methods 346, 108885. doi:10.1016/j.jneumeth.2020.108885
Liu, N., Nikitas, A., and Parkinson, S. (2020). Exploring expert perceptions about the cyber security and privacy of Connected and Autonomous Vehicles: a thematic analysis approach. Transp. Res. part F traffic Psychol. Behav. 75, 66–86. doi:10.1016/j.trf.2020.09.019
Ma, N., Fan, J., Wang, W., Wu, J., Jiang, Y., Xie, L., et al. (2022). Computer vision for road imaging and pothole detection: a state-of-the-art review of systems and algorithms. Transp. Saf. Environ. 4 (4), tdac026. doi:10.1093/tse/tdac026
Macioszek, E., Granà, A., and Krawiec, S. (2023). Identification of factors increasing the risk of pedestrian death in road accidents involving a pedestrian with a motor vehicle. Archives Transp. 65 (1), 7–25. doi:10.5604/01.3001.0016.2474
Madli, R., Hebbar, S., Pattar, P., and Golla, V. (2015). Automatic detection and notification of potholes and humps on roads to aid drivers. IEEE Sensors J. 15 (8), 4313–4318. doi:10.1109/jsen.2015.2417579
Magalhães, S. A., Castro, L., Moreira, G., dos Santos, F. N., Cunha, M., Dias, J., et al. (2023). Evaluating the single-shot multi-box detector and YOLO deep learning models for the detection of tomatoes in a greenhouse. Sensors 21 (10), 3569. doi:10.3390/s21103569
Naudé, M., Adebayo, K. J., and Nanda, R. (2023). A machine learning approach to detecting fraudulent job types. AI Soc. 38 (2), 1013–1024. doi:10.1007/s00146-022-01469-0
Pandey, A. K., Iqbal, R., Maniak, T., Karyotis, C., Akuma, S., and Palade, V. (2022). Convolution neural networks for pothole detection of critical road infrastructure. Comput. Electr. Eng. 99, 107725. doi:10.1016/j.compeleceng.2022.107725
Parekh, D., Poddar, N., Rajpurkar, A., Chahal, M., Kumar, N., Joshi, G. P., et al. (2022). A review on autonomous vehicles: progress, methods and challenges. Electronics 11 (14), 2162. doi:10.3390/electronics11142162
Park, H.-G., Ahn, K. K., Park, M. K., and Lee, S. H. (2018). Study on robust lateral controller for differential GPS-based autonomous vehicles. Int. J. Precis. Eng. Manuf. 19, 367–376. doi:10.1007/s12541-018-0044-9
Pendleton, S. D., Andersen, H., Du, X., Shen, X., Meghjani, M., Eng, Y., et al. (2017). Perception, planning, control, and coordination for autonomous vehicles. Machines 5 (1), 6. doi:10.3390/machines5010006
Rathore, R. S., Hewage, C., Kaiwartya, O., and Lloret, J. (2022). In-vehicle communication cyber security: challenges and solutions. Sensors 22 (17), 6679. doi:10.3390/s22176679
Raza, M. A., Aman, M. M., Abro, A. G., Shahid, M., Ara, D., Waseer, T. A., et al. (2023). A simulation model of climate policy analysis for sustainable environment in Pakistan. Environ. Prog. Sustain. Energy 42, e14144. doi:10.1002/ep.14144
Raza, M. A., Aman, M. M., Abro, A. G., Tunio, M. A., Khatri, K. L., and Shahid, M. (2022a). Challenges and potentials of implementing a smart grid for Pakistan’s Electric Network. Energy Strategy Rev. 43, 100941. doi:10.1016/j.esr.2022.100941
Raza, M. A., Aman, M. M., Rajpar, A. H., Bashir, M. B. A., and Jumani, T. A. (2022b). Towards achieving 100% renewable energy supply for sustainable climate change in Pakistan. Sustainability 14 (24), 16547. doi:10.3390/su142416547
Raza, M. A., Khatri, K. L., and Hussain, A. (2022d). Transition from fossilized to defossilized energy system in Pakistan. Renew. Energy 190, 19–29. doi:10.1016/j.renene.2022.03.059
Raza, M. A., Khatri, K. L., Israr, A., Ul Haque, M. I., Ahmed, M., Rafique, K., et al. (2022e). Energy demand and production forecasting in Pakistan. Energy Strategy Rev. 39, 100788. doi:10.1016/j.esr.2021.100788
Raza, M. A., Khatri, K. L., Ul Haque, M. I., Shahid, M., Rafique, K., and Waseer, T. A. (2022c). Holistic and scientific approach to the development of sustainable energy policy framework for energy security in Pakistan. Energy Rep. 8, 4282–4302. doi:10.1016/j.egyr.2022.03.044
Rehan, M., Raza, M. A., Abro, A. G., Aman, M., Ismail, M. I., Nizami, A. S., et al. (2023a). A sustainable use of biomass for electrical energy harvesting using distributed generation systems. Energy 278, 128036. doi:10.1016/j.energy.2023.128036
Rehan, M., Raza, M. A., Aman, M., Abro, A. G., Ismail, I. M. I., Munir, S., et al. (2023b). Untapping the potential of bioenergy for achieving sustainable energy future in Pakistan. Energy 275, 127472. doi:10.1016/j.energy.2023.127472
Saisree, C., and Kumaran, U. (2023). Pothole detection using deep learning classification method. Procedia Comput. Sci. 218, 2143–2152. doi:10.1016/j.procs.2023.01.190
Salaudeen, H., and Çelebi, E. (2022). Pothole detection using image enhancement gan and object detection network. Electronics 11 (12), 1882. doi:10.3390/electronics11121882
Sathya, R., and Saleena, B. (2022). A framework for designing unsupervised pothole detection by integrating feature extraction using deep recurrent neural network. Wirel. Personal. Commun. 126 (2), 1241–1271. doi:10.1007/s11277-022-09790-z
Sathya, R., Saleena, B., and Cnn-, M. A. O. (2022). CNN-MAO: convolutional neural network-based modified aquilla optimization algorithm for pothole identification from thermal images. Signal, Image Video Process. 16 (8), 2239–2247. doi:10.1007/s11760-022-02189-0
Shandilya, S. K., Srivastav, A., Yemets, K., Datta, A., and Nagar, A. K. (2023). YOLO-Based segmented dataset for drone vs. Bird detection for deep and machine learning algorithms. Data Brief 50, 109355. doi:10.1016/j.dib.2023.109355
Sharma, S. K., and Sharma, R. C. (2019). “Pothole detection and warning system for Indian roads,” in Advances in Interdisciplinary Engineering: Select Proceedings of FLAME 2018 (Springer).
Sharma, T., Debaque, B., Duclos, N., Chehri, A., Kinder, B., and Fortier, P. (2022). Deep learning-based object detection and scene perception under bad weather conditions. Electronics 11 (4), 563. doi:10.3390/electronics11040563
Shorten, C., Khoshgoftaar, T. M., and Furht, B. (2021). Text data augmentation for deep learning. J. Big Data 8, 101–134. doi:10.1186/s40537-021-00492-0
Taeihagh, A., and Lim, H. S. M. (2019). Governing autonomous vehicles: emerging responses for safety, liability, privacy, cybersecurity, and industry risks. Transp. Rev. 39 (1), 103–128. doi:10.1080/01441647.2018.1494640
Thompson, E. M., Ranieri, A., Biasotti, S., Chicchon, M., Sipiran, I., Pham, M. K., et al. (2022). SHREC 2022: pothole and crack detection in the road pavement using images and RGB-D data. Comput. Graph. 107, 161–171. doi:10.1016/j.cag.2022.07.018
Tumminello, M. L., Macioszek, E., Granà, A., and Giuffrè, T. (2023). A methodological framework to assess road infrastructure safety and performance efficiency in the transition toward cooperative driving. Sustainability 15 (12), 9345. doi:10.3390/su15129345
Wang, D., Liu, Z., Gu, X., Wu, W., Chen, Y., and Wang, L. (2022). Automatic detection of pothole distress in asphalt pavement using improved convolutional neural networks. Remote Sens. 14 (16), 3892. doi:10.3390/rs14163892
Wang, H., Lu, B., Li, J., Liu, T., Xing, Y., Lv, C., et al. (2021). Risk assessment and mitigation in local path planning for autonomous vehicles with LSTM-based predictive model. IEEE Trans. Automation Sci. Eng. 19 (4), 2738–2749. doi:10.1109/tase.2021.3075773
Woo, S., Youtie, J., Ott, I., and Scheu, F. (2021). Understanding the long-term emergence of autonomous vehicles technologies. Technol. Forecast. Soc. Change 170, 120852. doi:10.1016/j.techfore.2021.120852
Wu, Z., Zhuang, Y., Zhou, S., Xu, S., Yu, P., Du, J., et al. (2020). Bi-level planning of multi-functional vehicle charging stations considering land use types. Energies 13, 1283. doi:10.3390/en13051283
Wynn, R. B., Huvenne, V. A., Le Bas, T. P., Murton, B. J., Connelly, D. P., Bett, B. J., et al. (2014). Autonomous Underwater Vehicles (AUVs): their past, present and future contributions to the advancement of marine geoscience. Mar. Geol. 352, 451–468. doi:10.1016/j.margeo.2014.03.012
Xin, H., Ye, Y., Na, X., Hu, H., Wang, G., Wu, C., et al. (2023). Sustainable road pothole detection: a crowdsourcing based multi-sensors fusion approach. Sustainability 15 (8), 6610. doi:10.3390/su15086610
Zhang, J., Shu, Y., and Yu, H. (2021). “Human-machine interaction for autonomous vehicles: a review,” in International Conference on Human-Computer Interaction (Springer).
Keywords: YOLO V8, deep learning, autonomous vehicles, pothole detection, image classification, intelligent technologies and cities
Citation: Khan M, Raza MA, Abbas G, Othmen S, Yousef A and Jumani TA (2024) Pothole detection for autonomous vehicles using deep learning: a robust and efficient solution. Front. Built Environ. 9:1323792. doi: 10.3389/fbuil.2023.1323792
Received: 18 October 2023; Accepted: 28 December 2023;
Published: 16 January 2024.
Edited by:
Paolo Mercorelli, Leuphana University Lüneburg, GermanyReviewed by:
Elżbieta Macioszek, Silesian University of Technology, PolandUneb Gazder, University of Bahrain, Bahrain
Copyright © 2024 Khan, Raza, Abbas, Othmen, Yousef and Jumani. This is an open-access article distributed under the terms of the Creative Commons Attribution License (CC BY). The use, distribution or reproduction in other forums is permitted, provided the original author(s) and the copyright owner(s) are credited and that the original publication in this journal is cited, in accordance with accepted academic practice. No use, distribution or reproduction is permitted which does not comply with these terms.
*Correspondence: Salwa Othmen, c2Fsd2Eub3RobWVuQG5idS5lZHUuc2E=