Corrigendum: Solar geoengineering modeling and applications for mitigating global warming: assessing key parameters and the urban heat island influence
Corrigendum: Solar geoengineering modeling and applications for mitigating global warming: Assessing key parameters and the urban heat island influence
 Alec Feinberg
- Department of Physics, Northeastern University, Boston, MA, United States
In this paper, solar geoengineering modeling is presented with a goal to simplify reverse forcing assessments and the capability to apply it to a wide variety of applications. Results find improvements on sun-shade space mirror and desert surface treatment estimates, stratosphere sun-dimming methods, and the Urban Heat Islands (UHIs) influence. A heat amplification parameter is added to the model allowing it to be applied to UHI estimates. UHI amplification effects are due to the large solar area of buildings, reduction of wind cooling, solar canyons, and so forth. The UHI reverse forcing requirements are assessed with amplification estimates of 3.1 and 5.2, yielding 7.6% to 12.7% of gross global warming could be due to the urbanization effect, respectively. The gross warming 7.6% estimate, accurately compares to the author's prior study, and the 12.7% represents very recent results by other authors from new measurement methods. Key issues are pointed out that without including a heat amplification estimate and other modeling parameters, the UHI intensity, that likely dominates the urbanization warming effect could be severely underestimated, yielding urbanization estimates possibly as low as 2.4%. It is important to identify possible reasons where underestimates may occur from a modeling perspective to help understand controversies that may be occurring. The new model helps to clarify such parameters, allows for a significant reduction in complexity and calibration, and is shown to be helpful for numerous solar geoengineering applications including the serious need to reduce the UHI effect worldwide. Solar geoengineering solutions will require a lot of creativity, in addition to modeling, suggestions are provided for drought relief ideas and Paris Accord goals required for any successful urban solar geoengineering coordinated effort.
Introduction
A versatile new solar geoengineering model is developed for simplified and improved reverse forcing estimates to mitigate global warming in the area of sun-shade space mirrors, stratosphere sun-dimming, desert surface treatment, and the Urban Heat Islands (UHIs) influence. The model is unique in simplicity and its capability to apply it to these numerous key geoengineering areas. Assessing model parameters is important for accuracy. In this case, global mean earth energy budget values are used, drawn from the author's recent work in this area (Feinberg, 2021b). Results can also be calibrated to measurements when applicable (see section Results).
Expansion of cities is increasing rapidly where 55% of the world's population live and this is expected to grow to near 70% by 2050 (Worldbank, 2020). With this growth, the UHI influence, which is thought to dominate the urbanization effect on global warming, is expected to intensify (Huang et al., 2019; Yang et al., 2019). Urbanization leads to the expansion of built-up areas and increases the number of darker surfaces such as pavements and black rooftops that absorbs more radiation and intensifies UHIs and generally leads to warming the climate (He et al., 2007; Chun and Guldmann, 2014; AzariJafari et al., 2020; Xu et al., 2020). Different types of land-cover/land-use (LCLU) associated with urban expansion can influence the land-surface air temperature (LST) pattern and the magnitude of the UHI effect (He et al., 2007; Tran et al., 2017). Zhang et al. (2021) found significant differences in the magnitudes of the urbanization effects on the LST in different regions, “The urbanization effect on the trends of annual mean and extreme temperature indices series in East Asia is generally the strongest, which is consistent with the rapid urbanization process in the region over the past decades, but it is generally small in Europe during the recent decades.” They also noted a significant urbanization LST contributing trend in North America. The small Europe urbanization effect on the LST trend that they observed in the past decades they suggested may be due to the stagnant growth of UHIs. Such observations support that UHI growth over the past decades likely dominates the urbanization influence on global mean LST trends due to their significant intense heat (Tran et al., 2017). In this paper, this is often referred to as heat pollution (Feinberg, 2021a). Heat pollution worldwide is currently unregulated and not included in the Paris Accord mitigation goals. This is possibly the result of numerous different estimates for the UHI and LCLU influences on the global mean LST trend. Several authors have reported little contributions (Hansen et al., 1999, 2010; Parker, 2006; Jacobson and Hoeve, 2012; Hausfather et al., 2013). The IPCC in AR5 (Hartmann et al., 2013) stated that “…it is unlikely that any uncorrected urban heat-island effects and LCLU change effects have raised the estimated centennial globally averaged land-surface air temperature trends by more than 10% of the reported trend.” However, Zhou et al. (2015) warns that “ignoring the footprint (FP) may underestimate the UHI intensity in most cases.” The footprint was not included in IPCC discussions. The FP is defined as the continuous extent emanating outward from urban centers to rural areas that have an evident UHI effect. Its assessment is important. It helps in identifying possible UHI heat pollution amplification estimates that are needed in modeling and assessing the FP environment. An early study by Zhang et al. (2004) in Eastern N. America found the ecological FP of 2.4, but the study was limited. As well, recent evidence has found a significant impact on a decrease in the vegetation growing season occurring near the UHI FP (Kabano et al., 2021). FP estimates improved over time and an average footprint of 3.1 was detailed by Zhou et al. (2015) based on 32 Chinese cities using MODIS datasets from 2003–2012. Yang et al. (2019) in a temporal study from 2003 to 2016 on 302 cities in China showed the day-night footprints rapidly growing at an alarming rate of about 4.4% per year. This is an indication of a rapid increase in heat pollution in China and may also be occurring worldwide so that the UHI global warming influence may also be increasing. This is only one important finding that helps show the serious need for solar geoengineering in cities (see section Discussion).
In the past, there have been a wide variety of estimates for UHI contributions to climate change assessed with measurements. Part of the issue in urbanization global warming assessment is ground-station measurement contamination. Despite this complication, many authors have shown that urbanization effects do significantly influence global mean LST warming trends (Zhao, 1991; Kalnay and Cai, 2003; McKitrick and Michaels, 2004, 2007; Feddema et al., 2005; De Laat and Maurellis, 2006; Ren et al., 2007, 2008; Jones et al., 2008; Schmidt, 2009; Stone, 2009; Yang et al., 2011; Zhang et al., 2013, 2021; Zhao et al., 2013; Huang and Lu, 2015; Sun et al., 2016; Huang et al., 2019).
According to Ren and Zhou (2014) and others (Hansen et al., 2001; Pielke et al., 2007; Ren et al., 2008), “It is crucial to have a set of representatively rural stations for evaluating the urbanization effect on trends of surface air temperature.” Most studies apply sophisticated methods to avoid using contaminated measurements at rural sites that have UHI interference. Several authors have demonstrated that significant urbanization measurement contamination can influence reported results (Tysa et al., 2019; Wen et al., 2019). Therefore, the key in measurement study accuracy to evaluate the significance of the UHI effects has been how best to identify representative uncontaminated rural stations as reference sites (Ren et al., 2008). Zhang et al. (2021) used the percentage of urban areas within a buffer radius of 1–12 km around the stations to fit the model in their recent study that used machine learning to qualify the measurements of thousands of stations (section Results and Discussion). Their findings are possibly the most careful in rural station selection and likely provide the most accurate and detailed global measurement results. Zhang et al.'s (Zhang's (2021)) results (see Table 2) found, “The magnitude of the urbanization effect on global land averaged annual mean surface air temperature change over 1951–2018 in this study is 0.038oC decade−1 and the corresponding urbanization contribution is 12.7%, which is larger than the results reported by the IPCC Fifth Assessment Report (of 10% in Hartmann et al., 2013).” This 12.7% gross warming equates to a percentage of the forcing (see Table 2 details in Section Assessing the Influence of Urbanization on Global Warming).
In comparison, albedo modeling estimates are unrelated to urban measurement stations so contamination is not a factor in the approach used in this paper. In this paper, the new versatile model is also capable of assessing the urbanization influence on the global mean LST. The author's prior geoengineering modeling results (Feinberg, 2020) agree with the current findings in this paper which is 7.6% gross warming and a percentage of the forcing (see Table 2 details in section Assessing the Influence of Urbanization on Global Warming), for the urbanization global warming influence. However, in solar geoengineering modeling, it is crucial to have an estimate of the UHI heat amplification parameter (Feinberg, 2020). In this work and the author's prior study, a value of 3.1 was justified (section HT Concept). However, calibrating to Zhang et al.'s result in section Assessing the Influence of Urbanization on Global Warming (which covered about the same period as this study, 1950–2019) yielded a UHI heat amplification parameter HT of 5.2 (section Assessing the Influence of Urbanization on Global Warming). Therefore, modeling and measurements have different challenges, but together they provide confidence in estimates of a strong UHI and LCLU global warming influence.
Geoengineering solutions are needed. Since CO2 is estimated to linger in the atmosphere for over 100 years and fossil fuels usage is difficult to impede, it appears unrealistic to reverse global warming by trying to focus solely on reducing fossil fuel usage. Yet, solar geoengineering solutions provide an opportunity to lower global temperature quickly and are needed as warming is escalating faster than expected (Hugonnet et al., 2021). There have been numerous solar geoengineering solutions proposed for reversing global warming (Gaskill and Reese, 2003; Crutzen, 2006; Royal Society, 2009; Levinson and Akbari, 2010; Ferraro et al., 2011, 2015; Dykema et al., 2014; Sánchez and McInnes, 2015; Weisenstein et al., 2015; Cho, 2016; Keith et al., 2016; Dunne, 2018; Field et al., 2018; Reynolds, 2019; Keutsch, 2020; Hoffmann and Feingold, 2021). Creative solar geoengineering may also be able to help drought-related problems and these are discussed in section Solar Geoengineering Ideas for Drought Relief. Also, a major concern is a need for solar geoengineering of urbanization (SGU) and related goals added to the Paris Accord (section Discussion). Without such coordinated goals, significant worldwide improvements likely cannot be accomplished and heat pollution from improper urbanization design will continue to increase.
The new model detailed in this paper, reduces complexities from the author's prior study (Feinberg, 2020), can be used for numerous applications, improves on our understanding of the urbanization effect, significantly improves many reverse forcing estimates (section Results), allows for calibration (see section Assessing the Influence of Urbanization on Global Warming), and accuracy is enhanced with the aid of global mean earth energy budget (GMEEB) parameters.
Data and Method
In this section, the main equations for reverse forcing and modeling concepts are detailed. This will help in applying the model to potential solar geoengineering solutions.
Solar Geoengineering Reverse Forcing Method
Solar reverse forcing can be achieved by increasing the albedo of a target area. This is associated with a radiation change of a target denoted as ΔPT (in Wm−2) reducing its solar absorption and increasing its reflectivity with a target's (T) albedo increase.
Cooling a target with an albedo increase not only reduces its surface solar absorption, but also reduces its subsequent related greenhouse gas (GHG) effect. The earth's average temperature is due to solar absorption warming and its subsequent GHG effect. The GHG portion can be estimated with a re-radiation parameter f (Feinberg, 2021b). GHGs re-radiation has been rigorously shown to have an average value of f = 62% found using a re-radiation model for the GMEEB (see Eqs 8, 20, and Table 3 in Feinberg, 2021b). This is close to estimates for the effective emissivity constant f ≈ εeff for the planetary system (Kimoto, 2009; Feinberg, 2021b—see Eq. 8 therein). Therefore, the overall GHG re-radiation reduction associated with a ΔPT reflectivity change is further reduced by a (1+f ) factor that includes the cooling of the target itself and the secondary associated GHG re-radiation reduction (Eq. 9 in Feinberg, 2021b) where f = 0.62 (see Eq. 1 below).
Lastly, it is assumed in this paper that there will be eventual secondary feedback changes proportional to reverse forcing. This factor is estimated through a feedback amplification factor AF and is also detailed in the author's GMEEB re-radiation model assessment (see Eq. 24 and Table 3 in Feinberg, 2021b) yielding 2.15. Feedback is considered to be dominated by water vapor which is higher in warmer humid climates (Chung et al., 2010; Feinberg, 2021c). Gordon et al. (2013) estimated an average water vapor feedback of about 2.4 Wm−2K−1. Dessler et al. (2008) estimated 2.2 Wm−2K−1. Feinberg (2021c) estimated an UHI water vapor feedback of about 3.4 Wm−2K−1 for cities in humid environments. Authors agree that water vapor feedback has the capacity to about double the forcing such as direct warming from greenhouse gas increases. A doubling value of AF = 2.15 was found by the author's GMEEB (see Eq. 24 and Table 3 in Feinberg, 2021b) assessment and is based on IPCC-related values and appears reasonable according to these authors.
In this paper, the UHI influence is studied from 1950 to 2019. In this period, the warming is about 0.95K (Earthobservatory, 2021) and is associated with a radiation increase of 5.11 Wm−2 (see also Table 3 in Feinberg, 2021b) due to the GMEEB change in this time period.
These factors are applied to obtain a total reversal goal. The resulting equation for reverse forcing from a solar target area reflectivity increase associated with a radiation target change ΔPT when secondary average GHG re-radiation and average feedback values are included is then
As described, an overview of the solar geoengineering reversal equation parameters is:
ΔPRev is the resulting reversal change due to reverse forcing of a target in Watts/m2
ΔPT is the reverse forcing albedo change from a target area T in Watts/m2
(1+f ) is the GHG re-radiation factor estimated secondary effect where f = 0.62 (Feinberg, 2021b).
AF is an estimate of the secondary feedback amplification, taken as 2.15 (Feinberg, 2021b) and assumed to follow a target's albedo increase
For example, the estimated GHG forcing in this period is 2.38 Wm−2 (Butler and Montzka, 2020) from 1950 to 2019 (see also Feinberg, 2021b). With the feedback factor, the overall change for this time period is (2.38Wm−2) (2.15) = 5.11 Wm−2. This yields a 0.95K increase agreeing with estimates between 1950 and 2019 (Earthobservatory, 2021; see also Table 3 in Feinberg, 2021b).
GMEEB Model Values
Estimating model parameters are important to provide a measure of accuracy. In this paper, the strategy is to mainly use estimates based on GMEEB values. Table 1 provides an overview of the model parameters used in making assessments in section Results.
TABLE 1
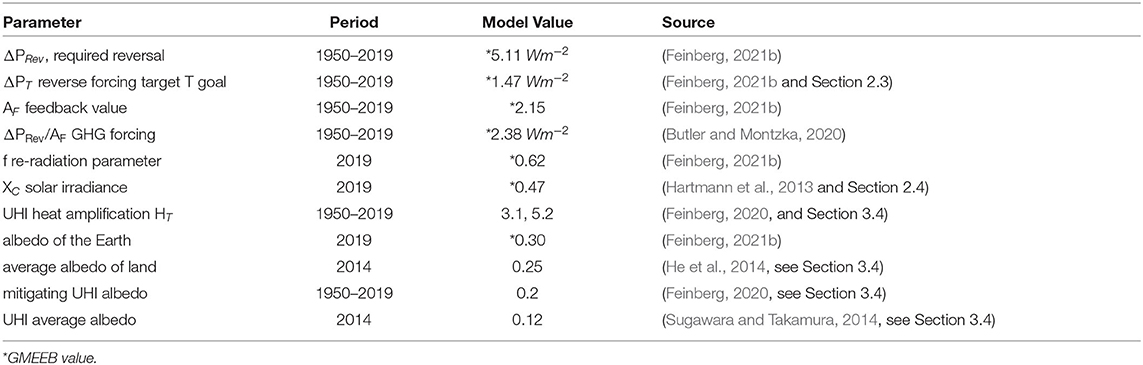
Table 1. Suggested model GMEEB* estimates and other values.
The Solar Reverse Forcing Goal
A reverse forcing solar target goal ΔPT using can now be obtained for the period 1950 to 2019 (Feinberg, 2021b). For this goal, then
Using AF = 2.15, and f = 0.62, the required reverse forcing target goal is
This value will be used throughout this paper to mitigate the estimated forcing that occurred between 1950 and 2019.
To achieve this goal the global albedo would need to increase from 30% to 30.432% to offset 5.11 Wm−2 (where 0.00432 So/4 = 1.47Wm−2 and So = 1361 Wm−2). This assumes global warming feedback (AF) would also reverse trends. This estimate shows consistency with other authors in the applications (section Results) for space mirrors (Sánchez and McInnes, 2015), desert modification (Gaskill, 2004), and the author's GMEEB study (Feinberg, 2021b) detailed in section Results.
Note the albedo advantage (Feinberg, 2021b) with the help of re-radiation reduction. The actual reverse forcing target reduction reduces to ΔPT = 1.47 Wm−2 in Eq. 3 compared to the required GHG reverse forcing needing the full 2.38 Wm−2 to reverse global warming. This is a 38% (=(2.38–1.47)/2.38) solar geoengineering albedo advantage (Feinberg, 2021b).
Nevertheless increasing the albedo of the earth's reflectivity from an albedo of 30% to 30.43% requires a lot of area modification as discussed in sec Results.
Converting the Reverse Forcing Goal to a Target Area
The target area model is similar to the author's work on urban heat islands (Feinberg, 2020). Earth's absorbed solar power P (W/m2) is given by
Let small p indicate the power in watts so that
This is useful for re-writing Eq. 4 in terms of the earth's areas AE for solar surface area AS and cloud coverage area AC which can be written as
Note XC is the sunlight irradiance reaching the earth's surface. For specific locations, this varies as it depends on the area selected for the target. For an estimate of XC parameter's average value, the IPCC global mean earth's energy budget summarized in the IPCC report (Hartmann et al., 2013) can be used. The average solar power that reaches the earth's surface is 161 Wm−2 out of 340 Wm−2. This yields an average irradiance of 47% for XC. Using this value, the solar area is
Then expanding out the earth's areas
Then dividing through by So/4 and AE, and separating out the ith earth components
The final form including the target area and its potential heat amplification parameter HT (see next section) is
Here  hat indicates all areas on the earth except the target area AT. Then the change in radiation associated with a target albedo modification from αT to is,
HT Concept
In general, any hotspot on the earth, like Death Valley, or UHIs may amplify or intensify solar heat (somewhat like a magnifying glass). Here an HT (≥1) parameter is assigned for the heat land amplification effect. For example, a common reason that land heat can intensify is often due to wind reduction issues. In the author's previous study, this amplification effect is explored. Many factors affect UHI heat amplification. For example, UHIs main amplification influence is likely the effective solar area due to tall buildings. Other UHI amplification effects include loss of natural cooling due to wind reduction, evapotranspiration, heat inversions, solar canyons that trap and increase solar absorption, reduction in wetlands, local water vapor feedback (Feinberg, 2021c), increase in heat capacity, dark impermeable surfaces having complex issues, and so forth. One method used by the author (Feinberg, 2020) for an amplification estimate is related to the UHI footprint (FP) observations. The FP was defined (Zhou et al., 2015) as the continuous extent emanating outward from urban centers to rural areas that have an evident UHI effect (i.e., where ΔT=TUHI-TRural is statistically larger than zero). It is an observation of the extent of the UHIs heat which goes beyond the boundaries of the UHI and can be thought of as a measure of the UHI's ability for amplifying heat. The most comprehensive footprint study was done by Zhou et al. (2015) that spanned the period from 2003 to 2012. They found that the FP was proportional to area. Results found an average footprint value of 3.1 times the UHI area in this time period. This result agrees with an estimate of the UHI area growth factor from 1950 to 2019 (Feinberg, 2020). This value is used in section Assessing the Influence of Urbanization on Global Warming.
An alternate estimate by the author is to use the average UHI dome area (Fan et al., 2017) which provides both horizontal and vertical heat extent. Here the extent of the dome from 1950 to 2019 showed a spherical surface areas increase in this period by a factor of about 8.4 (Feinberg, 2020). This can be thought of as an upper bound for HT. In section Assessing the Influence of Urbanization on Global Warming, based on the results of Zhang et al.'s (Zhang et al., 2021) data on urbanization warming, an HT calibration factor of 5.2 is realized in roughly the same time period. This is in between the footprint and dome amplification estimates and close to their average. It provides a reasonable calibration value. In section Assessing the Influence of Urbanization on Global Warming, both HT estimated values of 3.1 and 5.2 will be assessed.
Results
In section Space Mirror Model Estimate and section Sun-Dimming With Reflecting Particles in the Stratosphere, this model is used to compare results with some literature estimates on reverse forcing needed for space mirrors, desert modification and also indicate how one might assess sun-dimming. In section Assessing the Influence of Urbanization on Global Warming, estimates are provided on the urbanization global warming effect.
Space Mirror Model Estimate
Sánchez and McInnes (2015) provided estimates that were applicable for space mirrors or a non-reflecting black occulting disk or disks, with a shading proportion of ΔS/(So/4) = 1.7% solar flux reduction, where ΔS = 5.81 W/m2 and So/4 = 340 W/m2. Using Eq. 11, one can let XC = 100% (and HT = 1). Sun-shading can effectively translate to changing a target on earth reflectivity to ~100% from its prior average of 30% so that . For space mirror, the irradiance occurs 24 h a day and the earth's curvature is not a factor, this increases So/4 to So, and then Eq. 11 is written.
yielding
This indicates that if we fully block the sun from 0.154% of the earth, it effectively increases the area's reflectivity to 100%, and a reverse forcing of 1.47 Wm−2 will result. From Eq. 1, the resulting final goal achieved would be a reversal of (section The Solar Reverse Forcing Goal)
This is close to Sanchez et al.'s goal of ΔS = 5.81 Wm−2 (Sánchez and McInnes, 2015), but the objective is a little lower at 5.1 Wm−2 in Eq. 2.
One notes the resulting shaded earth or disc required area in Eq. 13 equates to 510 × 106 km2 (0.00154) = 0.787 × 10⁶ km2, yielding a radius of about 500.5 km. For almost similar goals, the improvement found in this paper is about a factor of 8.4 in the required disc reduced area. This is mainly because, in this paper, the goal is a little smaller, a maximum reflectivity of 100% is used (Sanchez et al. goal was roughly a little lower than 100%), and secondary effects of GHG re-radiation (1 + f ) = 1.62 and feedback AF = 2.15 (section Solar Geoengineering Reverse Forcing Method; Table 1; Eq. 1) are incorporated in Eq. 14. As well, Sánchez and McInnes (2015) used their Equation 1 in their assessment. This is not comparable to Eq. 12 used in this paper's assessment.
The one main problem with sun-shading is the enormous space disk size. Sanchez et. al. described a non-reflecting black occulting disk with an area of 6.4 x 10⁶ km2 and indicated an area weight conversion of 4 x 10³ kg/km2. This equates to 25.7 million tons.
We note that the space disk radius is reduced by a factor of 3 compared to Figure 6 in Sánchez and McInnes, 2015. Further disc reductions will likely be found in the author's planned future work on solar geoengineering to stop annual global warming.
Nevertheless, weight issues are obviously problematic. For example, by comparison to the international space station that weighs about 420 ton (Garcia, 2021), reduced area estimates found here are better than Sanchez et al.'s estimates but still lead to weights that are much higher than the space station. However, further research in this area is still strongly encouraged. There are lightweight reflective foils or maybe alternate shading methods that could improve practicability further. A study by NASA, for example, could be helpful to detail possible achievable methods and is highly recommended as this is an important solar geoengineering solution.
Desert Estimate
In 2004, Gaskill et al. proposed covering deserts with a reflective polyethylene-aluminum surface to increase the mean desert albedo from 0.36 to 0.8, and estimated a significant reverse forcing of −2.75 Wm−2. In their estimate, they used about 2% desert area of the earth (~ 4 million sq. miles done incrementally over 60 years). Most deserts have more than 80% irradiance. If one uses XC = 92% and HT = 1, with their same target change into the model, one finds results that match the Gaskill et al. estimate where
yielding
This indicates that if we increase the reflectivity of 2% of the earth by 44%, the reverse forcing will equate to 2.75 Wm−2.
However, using the goal in Eq. 3, this model shows an improved estimate finding the actual area needed can be reduced to about half of the Gaskill results, since
yielding
Furthermore, the desert heat amplification factor HT while not modeled, is likely greater than one due to the area size and temperature differences with neighboring non-desert regions which would further reduce area requirements substantially (see section Natural Hotspots).
In the case where HT = 1, the proportionate maintenance price (Eq. 18) could be reduced by half of the Gaskill and Reese (2003) estimate. Desert modification is an important solar geoengineering solution and more research should be done and promoted in this area. Advanced technologies could likely provide improved cost-effective methods.
Sun-Dimming With Reflecting Particles in the Stratosphere
As noted in section Space Mirror Model Estimate, space mirrors require a lot of effort and cost due to their size and weight. An alternative less expensive method proposed is sun-dimming with temporary reflecting particles into the stratosphere (Crutzen, 2006; Dykema et al., 2014; Ferraro et al., 2015; Keith et al., 2016; Tollefson, 2018; Keutsch, 2020). The likely particle choice is calcium carbonate which has good reflectivity and is an inexpensive substance. In terms of geoengineering shading requirements, a reasonable way to approach this is by looking at the sun's transmissibility change before and after the application of the sunlight-reflecting particles. Here the stratosphere solar transmissibility TR can be defined as
From Eq. 3, the incoming radiation needs to decrease by the stated goal of 1.47 Wm−2.
Considering the earth's solar absorbed radiation , a reduction estimate can be found from
Solving yields . This is a reduction of 9.6 Wm−2 required for the incoming sunlight.
If we measure the transmission of the incoming sunlight above and below the particle stratosphere treatment, the transmissibility from sun-dimming should be
This might provide an improvement for determining anticipated results. It is also important to assess possible large-scale effects (see section Discussion). Measuring the transmissibility is likely a helpful method. It is impossible to treat the entire stratosphere. If only half of the stratosphere were treated it would need a change of 2 x 9.6 Wm−2, and for a quarter of the stratosphere, 4 x 9.6 Wm−2, and so forth. Sun-dimming while considered an important temporary geoengineering solution, actually has larger area requirements than space mirrors, making it highly challenging.
Assessing the Influence of Urbanization on Global Warming
Modeling can be used to assess the influence of urbanization on global warming, its reverse forcing goals, detail the HT parameter through calibration, and identify issues where it can be underestimated. Results can be compared to the author's prior work (Feinberg, 2020) and recent studies. In so doing, one can see how the key parameters involved and area complexities can influence the outcome.
The first major consideration is to provide an estimate for the change in the urban growth area from 1950 to 2019, the period of interest in this paper. An estimate has been provided in Appendix A and the resulting increase in urban growth extent in this period is
• 0.28% increase in urbanized occurred from 1950 to 2019
This estimate will be used in our assessment. However, if better estimates are eventually found they can be easily substituted into this model.
Also required in this model is an estimate for the UHI heat amplification parameter. This was discussed in section HT Concept and two values are of interest, HT = 3.1 and 5.2. The value 5.2 will be identified in this section as calibrated from Zhang et al.'s (Zhang et al., 2021) results.
The same model in Eq. 11 can be used to estimate global warming contributions due to urbanization. In this case, it is desirable to restore UHIs and LCLU areas to their original estimated albedo value before their existence. In a prior study (Feinberg, 2020) it was estimated that a value of αT' = 0.2 (pre-UHI era) removes the urbanization forcing effect. This albedo value is comparable to that observed by He et al. (2014) that found that land albedo varies from 0.1 to 0.4 with an average of 0.25. Also, note that an average UHI albedo value from the author's prior study (Feinberg, 2020), used a value of αT = 0.12 due to Sugawara and Takamura (2014).
Solar geoengineering of UHIs has been studied and increasing the UHI albedo by about 0.1 is feasible. In a paper by Akbari et al. (2012), it was estimated that “white rooftops and light-colored pavements, can increase the albedo of urban areas by about 0.1…. and could potentially offset some of the anticipated temperature increase caused by global warming.”
Then to restore the average UHIs' reflectivity, their albedo change requires an increase from αT = 0.12 (Sugawara and Takamura, 2014) to αT' = 0.2 (He et al., 2014; Feinberg, 2020) so that . Then considering an average irradiance of 0.47, from Eq. 11
Then from Eq. 1, including secondary GHG and feedback effects, the urbanization effect denoted as PRev_U is
Solving for the HT values of interest then
Then according to Eq. 2, where ΔPRev = 5.11 Wm−2, the global warming percentage for each HT value is
These are the estimated magnitudes of the urbanization effect on global averaged LST change from 1950 to 2019. These estimates can be considered reverse forcing SGU goals. Here the model finds that HT = 5.22 matches the global warming measurement results of Zhang et al.'s (Zhang et al., 2021) work finding 12.7% of warming due to urbanization in this approximate time period and can be considered as a calibration estimate for HT.
Results from Eqs 24 and 25 are summarized in Column 2 and 3, respectively, in Table 2.
TABLE 2
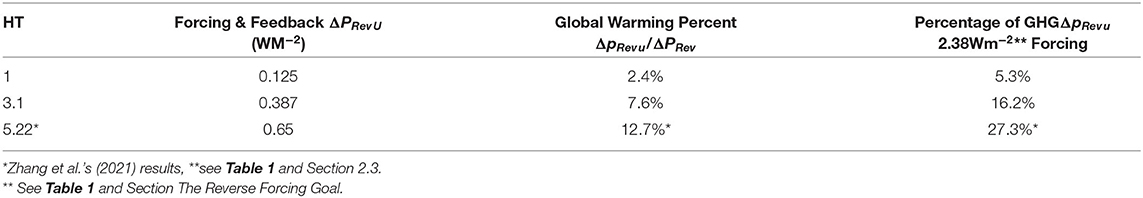
Table 2. UHI Global warming estimates (1950–2019).
The estimate of 7.6% gross warming using the HT = 3.1 in Column 3 along with all the model's parameter estimates yields about the same results as the author's prior findings of 7.5% gross warming (16.2% for the forcing percent, Col. 4) in Feinberg (2020). However, this model is less complex. This 7.6% result is lower than Zhang et al.'s (Zhang et al., 2021) recent findings of 12.7% (last row of Table 2, Col. 3). Results of Zhang et al. (2021) are somewhat higher than the IPCC's upper anticipated range of 10% (Hartmann et al., 2013). When comparing to Zhang et al. (2021) findings, which used complex measurement methods in the same approximate period (1951–2018), this study finds that the HT factor is a key parameter. Effectively, Zhang et al. (2021) results point to a higher amplification than the footprint estimate but lower than our dome estimate of 8.4 (see section HT Concept). This is likely an indication of both horizontal (footprint) and vertical (dome) UHI extent. Therefore, it is an important calibrated value for HT. Also note that in Table 2, the last column provides the forcing percent relative to the total forcing estimate of 2.38 Wm−2 shown in Table 1 (also see Eq. 3) in this time period. These are also SGU reverse forcing goals.
It is difficult to make projections, but one might anticipate that heat pollution's influence on global warming will increase further by 2050 along with the UHI footprint as Yang et al. (2019) reported footprints rapidly growing at a rate of 4.4% per year in China. This further illustrates the strong need for solar geoengineering of urbanization (discussed in section Discussion).
Lastly, note the results in Table 2 when HT = 1, this is discussed in section Discussion.
Solar Geoengineering Ideas for Drought Relief
Global warming creates high evaporation rates which have increased precipitation worldwide (EPA, 2020). However, in many areas, high evaporation rates lead to drought. Drought-prone areas have major concerns with water supplies for many reasons. A recent study by Milly and Dunne (2020) indicated that
• “Drought and warming have been shrinking Colorado River flow for many years. Milly and Dunne used a hydrologic model and historical observations to show that this decrease is due mainly to increased evapotranspiration caused by a reduction of albedo from snow loss and the associated rise in the absorption of solar radiation.”
Out-of-the-box ideas are likely needed to fight drought as many areas are near crisis levels in water supplies requiring creative solutions. In 2011–2012, the Peruvian Andes mountain tops were painted white to cool the atmosphere and bring back the shrinking glaciers. There a team painted over 50,000 square feet of rock white with a mixture of lime, water, and sand which was at an elevation of about 14,000 feet above sea level. This lowered rock temperatures some 30oF cooler than unpainted areas in hopes to save glaciers and water supplies. We see from Eq. 26 results, dark rocks can emit a significant amount of solar heat. Those experiments did curb glacial retreat on a small scale but were unable to bring ice fully back (Grossman, 2012).
Solar geoengineering's state-of-the-art potential is a lot higher today. Drone technology has had major advances for painting buildings (Maghazel and Netland, 2019) and in agriculture spray methods (Klauser and Pauschinger, 2021). Possibly other technologies could be developed specifically for mountain top brightening. New bright white surface treatments are being developed to help cool the earth (Li et al., 2021). Possibly an agency like SpaceX or NASA could vastly improve drones or hover aircraft to brighten needed mountain top areas. Furthermore, studies could help assess the best strategies to try and improve winter snow coverage by identifying needed areas in the Rockys' for example, where snow coverage has been lost due to global warming effects. This could be done in the summer months. Improvement in winter precipitation through local mountain top cooling using this method is not unrealistic where some proof of concept has been demonstrated in Peru.
Furthermore, advanced intelligent drone technology should also be used to brighten buildings and rooftops to cool UHIs.
Another likely drought-related issue is that most reservoirs are located near Urban Heat Islands (UHI). This is true of the many urban reservoirs in the western part of the U.S. While many of these urban reservoirs may appear to be away from the city limits, the UHI footprint effect likely still impacts evaporation rates, especially in dry climates where evaporation is accelerated. Lake Mead reservoir in NV is having water problems and is reasonably close to Las Vegas, well within 3.1 times the area's footprint estimates (radius of ) used in section Assessing the Influence of Urbanization on Global Warming that can affect lake evaporation rates by the city's heat pollution. Water loss due to evaporation can be in the millions of gallons per day. Lake Shasta, near Shasta County, Ca. for example, on a July 19, 2017 measurement, 210 million gallons of water evaporated (Arthur, 2017) were observed. In a remote sensing and modeling study by Zhao and Gao (2019) on 721 reservoirs, they found annual evaporation “equivalent to 93% of the annual public water supply of the United States (in 2010).” Implementing cool roads and roofs on the reservoir side could reduce these evaporation rates. In Section Heat Pollution from Dark Surfaces for example, results illustrate that on average heat pollution from black roads and roofs equated to 2.5 GWh per acre per year when secondary effects are included. This equated to 74,000 gallons of gasoline energy per year per acre of black roads or roofs or 7.5 times more energy than a solar power plant produces per acre.
Heat Pollution From Dark Surface
Considering the land albedo to average about 25% reflectivity (He et al., 2014), one definition of heat pollution is that any manmade surface or combination of surfaces with resulting lower reflectivity than 25% and H ≥ 1, creates ‘heat pollution’ (i.e., improper land-cover and land-use) contributing to global warming.
To understand how heat pollution makes incremental warming contributions and the importance of key parameters, a comparison can be made between the energy from heat pollution due to black roads and roofs, to solar cells and gasoline energy. Consider an acre (4046 m2) of black roads or roofs with an average albedo of 0.125 (Ramirez and Munoz, 2014) compared to the average land albedo of 0.25 (He et al., 2014) so that . Then from Eq. 5 and Eq. 11
Then in a year, the total watt-hours are 80,820 watts x 24hrs/day x 365 days = 0.71 GWh per acre per year. If we include key parameter secondary effects from GHG re-radiation (1+f) = 1.62 and feedback AF = 2.15 (Sec. 2.1, Table 1 and Eq. 1), it increases this estimate to 2.5 GWh. This is about 7.5 times more energy in heat pollution than a solar power plant produces where studies have found they average about 0.33 GWh per acres per year (Ong et al., 2013). Furthermore, a gallon of gas equates to 33.6 kWh (Wikipedia, 2021). Then this heat pollution equates to 74,200 gallons of gasoline energy per year per acre.
This illustrates the enormous energy in an acre of heat pollution and how black roads and roofs make significant incremental warming contributions. This offsets much of the benefits created by solar power plants and produces a large amount of heat pollution energy up to 2.5 GWh per year per acre (with secondary effects are included).
To offset the effect of black roofs, cool roofs in a mixture of climates across the U.S. has been studied by Levinson et al. in Levinson and Akbari (2010) with a “heat transfer module to simulate in each of 236 US cities (well distributed in many climates in the U.S. see their Fig. 5) the annual heating and cooling energy uses of new and old office and retail building prototypes…. when roof solar reflectance is increased to 0.55 (weathered cool white roof) from 0.20 (weathered conventional gray roof)”. They reported results showing, “an annual CO2 reduction … offsetting the annual CO2 emissions of 1.20 million cars or 25.4 peak power plants; an annual NOx reduction offsetting the annual NOx emissions of 0.57 million cars or 65.7 peak power plants; an annual SO2 reduction offsetting the annual SO2 emissions of 815 peak power plants; and an annual Hg reduction of 126 kg.
Discussion
Certainly, a key value in assessing UHI and LCLU warming is its estimated urban growth area as it will influence a model's outcome. For example, a 2012 Stanford modeling study (Jacobson and Hoeve, 2012) used a UHI area of 0.128%, where a Schneider et al. (2009) available estimate recognized in IPCC references (Satterthwaite et al., 2014) would have extrapolated to 0.17%, in 2012, yielding a 33% discrepancy (Feinberg, 2021d).
Without applying any amplification effect (HT = 1) in the urbanization estimate, results would be about 2.4% (Table 2, Column 3). We see the model also helps improve our understanding of the UHI influence on global warming. Many authors have assessed UHIs' importance in a wide variety of ranges both with modeling and measurements (Zhao, 1991; McKitrick and Michaels, 2004, 2007; Feddema et al., 2005; De Laat and Maurellis, 2006; Ren et al., 2007, 2008; Jones et al., 2008; Schmidt, 2009; Stone, 2009; Yang et al., 2011; Zhang et al., 2013; Zhao et al., 2013; Huang and Lu, 2015; Sun et al., 2016).
• The Zhang et al. (2021) study reference in section Assessing the Influence of Urbanization on Global Warming is the most comprehensive recent global measurement study and used a new method based on machine learning to classify the observatory stations into rural and urban retaining 12,505 stations out of 33,878 worldwide. Based on their new method, it was estimated from 1951 to 2018, urbanization is contributing about 12.7% to global land average annual mean surface air warming (shown in Table 2).
Such findings support the use of amplification in modeling and that all the parameters in Eqs 1 and 11 are required for solar geoengineering estimates as detailed in section Assessing the Influence of Urbanization on Global Warming.
Solar geoengineering can be limiting since large-scale effects such as weather, hydrological cycle (Bala and Nag, 2012), agricultural issues, etc. can be a concern in governance and uncertainty (Royal Society, 2009; Reynolds, 2019). This is especially true in sun-dimming, desert modifications, or any large area that is modified in earth brightening. However, cool roofs, roads (Cambridge Systematics, 2005; NYC Regional Heat Island Initiative, 2006; Zinzi and Agnoli, 2012; Albers et al., 2015), and the regulations suggested below would not create problems on a large scale (Levinson and Akbari, 2010) and would be highly advantageous with numerous advantages where 55% of the world's population live which is likely to increase to near 70% by 2050 (Worldbank, 2020). It could have an important impact on global warming trends to cool off cities including local health effects.
For UHI and LCLU heat pollution global warming effect, there are many assessments both with measurements and modeling estimates. A true estimation of the impact of urbanization on global warming is very difficult and may be hard to fully realize. Nevertheless, given the advantages of solar geoengineering for cooling off cities including health benefits, it is clear that heat pollution needs to be addressed better.
Heat Pollution is an immediate danger in cities (see also Section Heat Pollution from Dark Surfaces), affecting health and death rates (Buechley et al., 1972; Changnon et al., 1996; Kovats and Hajat, 2008; Liao et al., 2018; Tuholske et al., 2021; Watts et al., 2021), and hurting economies (Burke et al., 2015; Day et al., 2019).
Also, the UHI footprint affects vegetation phenology (Zhang et al., 2004) and their growing season (Kabano et al., 2021). Furthermore, evidence exists for synergistic effects with heatwaves and UHIs. Liao et al. (2018) in a study on heatwave exacerbation from UHIs showed a strong synergistic heatwave effect observed both in duration and frequency. Liao also noted that “in wet climates, the increasing trends of heatwaves in urban areas are greater than those in rural areas, suggesting a positive contribution of urbanization to heatwave trends.” This is supported by higher UHI water-vapor feedback estimates in humid climates (Feinberg, 2021c). Zhao et al. (2014) found higher temperatures in humid vs dry climates in UHIs. In China, Kong et al. (2020) found “the occurrence probability of human-perceived heatwaves nearly doubled in China over recent decades, of which urbanization and greenhouse gases contribute to 21.9% and 72.9% of the intensification of heatwaves, respectively.
The fact that Yang et al. (2019) reported from 2003 to 2016 in 302 cities in China, day-night footprints rapidly growing at a rate of 4.4% per year, is an alarming finding. This is much larger than the population growth rate in China which has been under 0.75% for this time period (Statista, 2022) and is, therefore, an unexpected disturbing finding. This is further proof of the rapid increase in heat pollution that may also be occurring worldwide.
The rapid growth of city footprints, heatwave frequencies and durations in cities, and their significant contributions to global warming, all illustrate the serious need for solar geoengineering in cities to reduce heat pollution worldwide requiring coordinated efforts through needed Paris Accord goals as suggested below.
Results indicate the need for heat pollution Paris Accord restriction goals. In Australia for example, mandatory national construction codes are being implemented to require cooler roofs in the suburb of Sydney's southwest area and there is an effort to require it nationwide by the end of 2022 (William, 2021). A similar worldwide effort could be included in the Paris Accord goals. The inclusion of solar geoengineering goals in the Paris Accord would ensure coordinated efforts, for improving needed mitigation. Successful SGU would require regulations and Paris Accord goals for major manmade surfaces exposed to solar radiation to be at least as reflective as the earth's land (He et al., 2014) necessitating regulations (see Section Heat Pollution from Dark Surfaces). For example, suggested goals are:
• Roofs: 25% reflective or greater.
• Roofs in warm climates: 85% reflective where solar heat absorption is not needed for heating homes.
• Roads: 35% reflective or greater.
• Sides of buildings: 25% reflective or greater.
• Cars: 85% reflective or greater.
Natural Hotspots
Natural hotspots like deserts discussed in section Desert Estimate on the earth are likely good geoengineering targets to consider cooling to help reduce climate change. Similar to UHIs, natural hotspots likely have measurable footprints that could help assess their HT amplification estimate. Certainly, natural hotspots would be highly controversial geoengineering targets. Nevertheless, their amplification of heat and its effect on the earth's temperature will likely be related to their area and temperature differences to neighboring non-hotspots areas similar to how the UHI effect is treated in section Assessing the Influence of Urbanization on Global Warming. Some examples of such hotspots include:
• Flaming Mountains, China
• Bangkok, Thailand (planet's hottest city)
• Death Valley California
• Deserts
• Tirat Zvi, Israel
• Badlands of Australia
Conclusions
Geoengineering solar solutions, while extremely challenging, are vital to helping mitigate global warming and cooling off cities. Today, technology has numerous advances that could help in earth brightening (such as drone devices as discussed in section Solar Geoengineering Ideas for Drought Relief) and/or sun-dimming. Humankind has addressed many technological challenges successfully. This paper provided a helpful new versatile solar geoengineering model used in a broad range of applications. Estimates for solar geoengineering using this model showed significant improvements in feasibility when compared to the literature in the area of space mirrors and desert surface estimates. It is recommended that these areas be reassessed for solar geoengineering. Also suggested was a method to estimate stratosphere sun-dimming. Solar geoengineering solutions have two main advantages; they produce fast results and have a 38% improved albedo advantage compared to GHG removal (section The Solar Reverse Forcing Goal; Feinberg, 2021b).
In assessing the urbanization effect on global warming, important parameters that need careful consideration are the UHI heat amplification value, the GHG re-radiation factor, feedback, an estimate of urbanization area growth, and GMEEB values (Table 1). Modeling results indicate that the urbanization effect that is likely dominated by the UHIs' influence are about 7.6% to 12.7% of the LST warming trend that occurred between 1950 and 2019. These correspond to forcing percentages of 16% to 27% (see Table 2). Estimates depended on the value used for the heat amplification parameter HT.
Section Discussion indicated the serious need for solar geoengineering especially in cities, not only due to the contributions of urbanization to global warming but for related health and economic reasons due to exposure of increases in heatwave synergy effects with UHIs and the rapid increase of footprint growth that affects many environmental issues (section Discussion). Some data suggest that UHI heat pollution footprint growth is occurring at a much faster pace than the population growth rate (section Discussion) and mitigation requires mainly albedo management of black roads and rooftops.
Paris Accord goals were suggested in section Discussion for the successful implementation of a coordinated worldwide SGU efforts. This would provide climate help in cities where 55% of the population lives which is expected to increase to almost 70% by 2050 (Worldbank, 2020). SGU is capable of making a large difference with a worldwide effort. However, currently improper urbanization design is dominating growth and heat pollution is rampant.
Solar geoengineering represents a practical and efficient way (Feinberg, 2021b, see also section The Solar Reverse Forcing Goal on the albedo advantage) to lower temperatures quickly in UHIs and globally in this climate crisis and is therefore highly recommended.
Data Availability Statement
The original contributions presented in the study are included in the article/Supplementary Material, further inquiries can be directed to the corresponding author.
Author Contributions
The author confirms being the sole contributor of this work and has approved it for publication.
Conflict of Interest
The author declares that the research was conducted in the absence of any commercial or financial relationships that could be construed as a potential conflict of interest.
Publisher's Note
All claims expressed in this article are solely those of the authors and do not necessarily represent those of their affiliated organizations, or those of the publisher, the editors and the reviewers. Any product that may be evaluated in this article, or claim that may be made by its manufacturer, is not guaranteed or endorsed by the publisher.
Supplementary Material
The Supplementary Material for this article can be found online at: https://www.frontiersin.org/articles/10.3389/fclim.2022.870071/full#supplementary-material
References
Akbari, H., Matthews, D., and Seto, D. (2012). The long-term effect of increasing the albedo of urban areas. Environ. Res. Lett. 7, 024004. doi: 10.1088/1748-9326/7/2/024004
Albers, W., Bosch, P., Blocken, B., Van Den, D, Van Hove, L., Spit, T., et al. (2015). Overview of challenges and achievements in the climate adaptation of cities and in the climate proof cities program. Build. Environ. 83, 1–10. doi: 10.1016/j.buildenv.2014.09.006
Arthur, D. (2017). Lake Shasta Loses Hundreds of Millions of Gallons Daily Through Evaporation. Available online at: https://www.redding.com/story/news/local/2017/07/14/lake-shasta-loses-hundreds-millions-gallons-daily-through-evaporation/472147001/ (accessed January 5, 2022).
AzariJafari, H., Kirchain, R., and Gregory, J. (2020). Mitigating Climate Change with Reflective Pavements, CSHub Topic Summary. Available online at: https://cshub.mit.edu/sites/default/files/images/Albedo%201113_0.pdf (accessed October 15, 2021).
Bala, G., and Nag, B. (2012). Albedo enhancement over land to counteract global warming: impacts on hydrological cycle. Clim. Dyn. 39, 1527–1542. doi: 10.1007/s00382-011-1256-1
Buechley, R., and Van Bruggen, J., Trippi, L. E. (1972). Heat island equals death island? Environ. Res. 5, 85–92. doi: 10.1016/0013-9351(72)90022-9
Burke, M., Hsiang, S., and Miguel, E. (2015). Global non-linear effect of temperature on economic production. Nature 527, 235–239. doi: 10.1038/nature15725
Butler, H., and Montzka, A. (2020). The NOAA Annual Greenhouse Gas Index, Earth System Research Lab. Boulder, CO: Global Monitoring Laboratory. Available online at: https://www.esrl.noaa.gov/gmd/aggi/aggi.html (accessed October 4, 2021)
Cambridge Systematics (2005). Cool Pavement Report, Heat Island Reduction Initiative. Available online at: https://citeseerx.ist.psu.edu/viewdoc/download?doi=10.1.1.648.3147&rep=rep1&type=pd (accessed January 5, 2022).
Changnon, S., Kunkel, K., and Reinke, B. (1996). Impacts and responses to the 1995 heat wave: a call to action. Bull. Am. Meteorol. Soc. 77, 1497–1506. doi: 10.1175/1520-0477(1996)077<1497:IARTTH>2.0.CO;2
Cho, A. (2016). To Fight Global Warming, Senate Calls for a Study of Making Earth Reflect More Light. Available online at: https://www.sciencemag.org/news/2016/04/fight-global-warming-senate-calls-study-making-earth-reflect-more-light, (accessed June 4, 2021).
Chun, B., and Guldmann, J. (2014). Spatial statistical analysis and simulation of the urban heat island in high-density central cities. Landsc. Urban Plan. 125, 76–88 doi: 10.1016/j.landurbplan.2014.01.016
Chung, E., Yeomans, D., and Soden, B. (2010). An assessment of climate feedback processes using satellite observations of clear-sky OLR. Geophys. Res. Lett. 37, 2. doi: 10.1029/2009GL041889
Crutzen, P. (2006). Albedo enhancement by stratospheric sulfur injections: a contribution to resolve a policy dilemma? Clim. Change 77, 211. doi: 10.1007/s10584-006-9101-y
Day, E., Fankhauser, S., Kingsmill, N., Costa, H., and Mavrogianni, A. (2019). Upholding labor productivity under climate change: an assessment of adaptation options. Clim. Policy 19, 367–385. doi: 10.1080/14693062.2018.1517640
De Laat, A. T. J., and Maurellis, A. N. (2006). Evidence for the influence of anthropogenic surface processes on lower tropospheric and surface temperature trends. Int. J. Climatol. 26, 897–913. doi: 10.1002/joc.1292
Dessler, A., Zhang, Z., and Yang, P. (2008). Water-vapor climate feedback inferred from climate fluctuations, 2003–2008. Geophys. Res. Lett. 35, 20. doi: 10.1029/2008GL035333
Dunne, D. (2018). Six Ideas to Limit Global Warming With Solar Geoengineering. Available online at: https://www.carbonbrief.org/explainer-six-ideas-to-limit-global-warming-with-solar-geoengineering (accessed January 7, 2022).
Dykema, J., Keith, D., Anderson, J., and Weisenstein, D. (2014). Stratospheric controlled perturbation experiment: a small-scale experiment to improve understanding of the risks of solar geoengineering Phil. Trans. R. Soc. A. 372, 2031. doi: 10.1098/rsta.2014.0059
Earthobservatory (2021). Available online at: https://earthobservatory.nasa.gov/world-of-change/global-temperatures (accessed January 2, 2022).
EPA (2020). Climate Change Indicators: U.S. and Global Precipitation. Available online at: https://www.epa.gov/climate-indicators/climate-change-indicators-us-and-global-precipitation#:~:text=As%20average%20temperatures%20at%20the,increase%20precipitation%20in%20many%20areas (accessed December 01, 2021).
Fan, Y., Li, Y., and Bejan, A. (2017). Horizontal extent of the urban heat dome flow. Sci. Rep. 7, 11681. doi: 10.1038/s41598-017-09917-4
Feddema, J. J., Oleson, K. W., Bonan, G. B., Mearns, L. O., Buja, L. E., Meehl, G. A., et al. (2005). The importance of land-cover change in simulating future climates. Science 310, 1674–1678. doi: 10.1126/science.1118160
Feinberg, A. (2020). Urban heat island amplification estimates on global warming using an albedo model. SN Appl. Sci. 2, 2178. doi: 10.1007/s42452-020-03889-3
Feinberg, A. (2021a). Heat Pollution – 25% of Global Warming & Paris Accord Issues. Available online at: www.heatpollution.org
Feinberg, A. (2021b). A re-radiation model for the earth's energy budget and the albedo advantage in global warming mitigation. Dyn. Atmos. Oceans 97, 101267. doi: 10.1016/j.dynatmoce.2021.101267
Feinberg, A. (2021c). Urban Heat Island high Water-Vapor Feedback Estimates and Heatwave Issues, in Peer Review. Available online at: https://www.researchgate.net/publication/348280678_Urban_Heat_Island_High_Water-Vapor_Feedback_Estimates_and_Heatwave_Issues (accessed March 3, 2022).
Feinberg, A. (2021d). Comment on “Effects of urban surfaces and white roofs on global and regional climate” by Jacobson, M.Z., Ten Hoeve, J.E. (2012). J of Climate, finding UHI contribute only 2-4% to global warming. doi: 10.13140/RG.2.2.35146.49608
Ferraro, A., Charlton-Perez, A., and Highwood, E. (2015). Stratospheric dynamics and midlatitude jets under geoengineering with space mirrors and sulfate and titania aerosols. J. Geophys. Res. 120, 414–429. doi: 10.1002/2014JD022734
Ferraro, A., Highwood, E., and Charlton-Perez, A. (2011). Stratospheric heating by potential geoengineering aerosols. Geophys. Res. Lett. 38, 24. doi: 10.1029/2011GL049761
Field, L., hattacharyya, I., Mlaker, V, Sholtz, A., Decca, R., Manzara, A., et al. (2018). Arctic Sea Ice Albedo, using localized reversible geoengineering. AGU 6, 882–901. doi: 10.1029/2018EF000820
Garcia, M. (2021). International Space Station Facts and Figures. Available online at: https://www.nasa.gov/feature/facts-and-figures (accessed January 4, 2022).
Gaskill, A. (2004). Summary of meeting with U.S. DOE to discuss geoengineering options to prevent abrupt and long-term climate change. Available online at: http://www.homepages.ed.ac.uk/shs/Climatechange/Geo-politics/Gaskill%20DOE.pdf
Gaskill, A., and Reese, C. (2003). Global Warming Mitigation by Reduction of Outgoing Longwave Radiation Through Large-Scale Surface Albedo Enhancement of Desert Using White Plastic Polyethylene Film - the Global Albedo Enhancement Project (GAEP). Available online at: https://www.slideshare.net/AlviaGaskillJr/theglobalalbedoenhancementproject-53664037
Gordon, N. D., Jonko, A. K., Forster, P. M., and Shell, K. M. (2013). An observationally based constraint on the water-vapor feedback. J. Geophys. Res. 118, 12435–12443. doi: 10.1002/2013JD020184
Grossman, D. (2012). With Sawdust and Paint, Locals Fight to Save Peru's Glaciers. Available online at: https://theworld.org/stories/2012-09-25/sawdust-and-paint-locals-fight-save-perus-glaciers (accessed December 4, 2021)
Hansen, J., Ruedy, R., Glascoe, J., and Sato, M. (1999). GISS analysis of surface temperature change. J. Geophys. Res. 104, 30997–31022. doi: 10.1029/1999JD900835
Hansen, J., Ruedy, R., Sato, M., Imhoff, M., Lawrence, W., Easterling, D., et al. (2001). A closer look at the United States and global surface temperature change. J. Geophys. Res. 106, 23947–23963. doi: 10.1029/2001JD000354
Hansen, J., Ruedy, R., Satto, M., and Lo, K. (2010). Global surface temperature change. Rev. Geophys. 48, 4. doi: 10.1029/2010RG000345
Hartmann, D. L., Klein, A. M. G., Tank, M., Rusticucci, L. V., Alexander, S., Brönnimann, Y., et al. (2013). “Observations: Atmosphere and Surface,” in: Climate Change 2013: The Physical Science Basis. Contribution of Working Group I to the Fifth Assessment Report of the Intergovernmental Panel on Climate Change, eds T. F. Stocker, D. Qin, G.-K. Plattner, M. Tignor, S. K. Allen, J. Boschung, A. Nauels, Y. Xia, V. Bex, and P. M. Midgley (Cambridge; New York, NY: Cambridge University Press), 162. p, 181. p.
Hausfather, Z., Menne, M., Williams, C., Masters, T., Broberg, R., and Jones, D. (2013). Quantifying the effect of urbanization on U.S. historical climatology network temperature records. JGR Atmospheres 118, 481–494. doi: 10.1029/2012JD018509
He, J., Liu, J., Zhuang, D., Zhang, W., and Liu, M. (2007). Assessing the effect of land use/land cover change on the change of urban heat island intensity. Theor. Appl. Climatol. 90, 217–226, doi: 10.1007/s00704-006-0273-1
He, T., Liang, S., and Song, D. X. (2014). Analysis of global land surface albedo climatology and spatial-temporal variation during 1981–2010 from multiple satellite products. J. Geophys. Res. Atmos. 119, 10281–10298. doi: 10.1002/2014JD021667
Hoffmann, F., and Feingold, G. (2021). Cloud microphysical Implication for marine cloud brightening: the importance of the seeded particle size distribution. J. Atmos. Sci. 78, 3247–3262. doi: 10.1175/JAS-D-21-0077.1
Huang, K., Li, X., Liu, X., and Seto, K. (2019). Projecting global urban land expansion and heat island intensification through 2050. Environ. Res. Lett. 14, 114037. doi: 10.1088/1748-9326/ab4b71
Huang, Q., and Lu, Y. (2015). Effect of urban heat island on climate warming in the Yangtze River Delta Urban Agglomeration in China. Int. J. Environ. Res. Public Health 12, 8773–8789. doi: 10.3390/ijerph120808773
Hugonnet, R., McNabb, R., Berthier, E., Menounos, B., Nuth, C., Girod, L., et al. (2021). Accelerated global glacier mass loss in the early twenty-first century. Nature 592, 726–731. doi: 10.1038/s41586-021-03436-z
Jacobson, M., and Hoeve, J. (2012). Effects of urban surfaces and white roofs on global and regional climate. J. Clim. 25, 1028–1044. doi: 10.1175/JCLI-D-11-00032.1
Jones, P. D., Lister, D. H., and Li, Q. X. (2008). Urbanization e?ects in large-scale temperature records, with an emphasis on China. J. Geophys. Res. 113, D16122. doi: 10.1029/2008JD009916
Kabano, P., Lindley, S., and Harris, A. (2021). Evidence of urban heat island impact on the vegetation growing season length in a tropical city, Landsc. Urban Plan. 206, 1–9. doi: 10.1016/j.landurbplan.2020.103989
Kalnay, E., and Cai, M. (2003). Impact of urbanization and land-use change on climate. Nature 423, 528–531. doi: 10.1038/nature01675
Keith, D., Weisenstein, D., Dykema, J., and Keutsch, F. (2016). Stratospheric solar geoengineering without ozone loss. Proc. Natl. Acad. Sci. 113, 14910–14914. doi: 10.1073/pnas.1615572113
Keutsch, F. (2020). The Stratospheric Controlled Perturbation Experiment (SCoPEx). Available online at: https://scopexac.com/wp-content/uploads/2021/03/1.-Scientific-and-Technical-Review-Foundational-Document.pdf (accessed October 15, 2021).
Kimoto, K. (2009). On the confusion of planck feedback parameters. Energy Environ. 20, 1057–1066. doi: 10.1260/095830509789876835
Klauser, F., and Pauschinger, D. (2021). Entrepreneurs of the air: sprayer drones as mediators of volumetric agriculture. J. Rural Stud. 84, 55–62. doi: 10.1016/j.jrurstud.2021.02.016
Kong, D., Gu, X., Li, J., Ren, G., and Liu, J. (2020). Contributions of global warming and urbanization to the intensification of human-perceived heatwaves over China. J. Geophys. Res. 125, 18. doi: 10.1029/2019JD032175
Kovats, S., and Hajat, S. (2008). Heat stress and public health: a critical review. Annu. Rev. Public Health 29, 41–44. doi: 10.1146/annurev.publhealth.29.020907.090843
Levinson, R., and Akbari, H. (2010). Potential benefits of cool roofs on commercial buildings: conserving energy, saving money, and reducing emission of greenhouse gases and air pollutants. Energy Efficiency 3, 53–109. doi: 10.1007/s12053-008-9038-2
Li, X., Peoples, J., Yao, P., and Ruan, X. (2021). Ultrawhite BaSO4 paints and films for remarkable daytime subambient radiative cooling. ACS Appl. Mater. Interfaces 13, 21733–21739. doi: 10.1021/acsami.1c02368
Liao, W., Liu, X., Li, D., Luo, M., Wang, D., Wang, S., et al. (2018). Stronger contributions of urbanization to heat wave trends in wet climates. Geophys. Res. Lett. 45, 11310–11317. doi: 10.1029/2018GL079679
Maghazel, O., and Netland, T. (2019). Drones in manufacturing: exploring opportunities for research and practice. J. Manufact. Technol. Manag. 31, 1237-1259. doi: 10.1108/JMTM-03-2019-0099
McKitrick, R., and Michaels, J. (2004). A test of corrections for extraneous signals in gridded surface temperature data. Clim. Res. 26, 159–173. doi: 10.3354/cr026159
McKitrick, R., and Michaels, P. (2007). Quantifying the influence of anthropogenic surface processes and inhomogeneities on gridded global climate data. J. Geophys. Res. 112, D24. doi: 10.1029/2007JD008465
Milly, P., and Dunne, A. (2020). Colorado River flow dwindles as warming-driven loss of reflective snow energizes evaporation. Science 367, 1252–1255. doi: 10.1126/science.aay9187
NYC Regional Heat Island Initiative (2006). Mitigating New York City's Heat Island With Urban Forestry, Living Roofs, and Light Surfaces. New York, NY: New York State Energy Research and Development Authority.
Ong, S., Campbell, C., Denholm, P., Magolis, R., and Heath, G. (2013). Land-Use Requirements for Solar Power Plants in the United States, NREL, Technical Report NREL/TP-6A20-56290. Available online at: https://www.nrel.gov/docs/fy13osti/56290.pdf
Parker, D. E. (2006). A demonstration that large-scale warming is not urban. J. Clim. 19, 2882–2895. doi: 10.1175/JCLI3730.1
Pielke, R. A. Sr, Nielsen-Gammon, J., Davey, C., Angel, J., Bliss, O., et al. (2007). Documentation of uncertainties and biases associated with surface temperature measurement sites for climate change assessment. Bull. Amer. Meteor. Soc. 88, 913–928. doi: 10.1175/BAMS-88-6-913
Ramirez, A. Z., and Munoz, C. B. (2014). Albedo Effect and Energy Efficiency of Cities. Madrid: Polytechnic University of Madrid Press. Available online at: http://cdn.intechopen.com/pdfs/29929/InTech-Albedo_effect_and_energy_efficiency_of_cities.pdf (accessed March 4, 2021).
Ren, G., Chu, Z., Chen, Z., and Ren, Y. (2007). Implications of temporal change in urban heat island intensity observed at Beijing and Wuhan stations. Geophys. Res. Lett. 34, L05711. doi: 10.1029/2006GL027927
Ren, G., and Zhou, Y. (2014). Urbanization effect on trends of extreme temperature indices of national stations over mainland China, 1961–2008. J. Clim. 27, 2340–2360. doi: 10.1175/JCLI-D-13-00393.1
Ren, G., Zhou, Y., Chu, Z., Zhou, J., Zhang, A., Guo, J., et al. (2008). Urbanization effects on observed surface air temperature trends in north China. J. Clim. 21, 1333–1348. doi: 10.1175/2007JCLI1348.1
Reynolds, J. (2019). Solar geoengineering to reduce climate change: a review of governance proposals. Proc. R. Soc. A.475:2019025520190255. doi: 10.2139/ssrn.3462306
Royal Society (2009). Geoengineering the Climate, Science, Governance and Uncertainty. Available online at: https://eprints.soton.ac.uk/156647/1/Geoengineering_the_climate.pdf (accessed October 15, 2021).
Sánchez, J.-P., and McInnes, C. R. (2015). Optimal sunshade configurations for space-based geoengineering near the Sun-Earth L1 point. PLoS ONE 10:e0136648. doi: 10.1371/journal.pone.0136648
Satterthwaite, D. E., Aragón-Durand, F., Corfee-Morlot, J., Kiunsi, R. B. R., Pelling, M., Roberts, D. C., et al. (2014). “Urban areas,” in Climate Change Impacts, Adaptation, and Vulnerability. Part A: Global and Sectoral Aspects. Contribution of Working Group II to the Fifth Assessment Report of the Intergovernmental Panel on Climate Change (IPCC) (Cambridge; New York, NY), 535–612.
Schmidt, G. A. (2009). Spurious correlations between recent warming and indices of local economic activity. Int. J. Climatol. 29, 2041–2048. doi: 10.1002/joc.1831
Schneider, A., Friedl, M., and Potere, D. (2009). A new map of global urban extent from MODIS satellite data. Environ. Res. Lett. 4, 044003. doi: 10.1088/1748-9326/4/4/044003
Statista (2022). Population Growth in China From 2000 to 2020. Available online at: https://www.statista.com/statistics/270129/population-growth-in-china (accessed January 3, 2022).
Stone, B. (2009). Land use as climate change mitigation. Environ. Sci. Technol. 43, 9052–9056. doi: 10.1021/es902150g
Sugawara, H., and Takamura, T. (2014). Surface Albedo in Cities (0.12) case study in Sapporo and Tokyo, Japan. Bound. Layer Meteorol. 153, 539–553. doi: 10.1007/s10546-014-9952-0
Sun, Y., Zhang, X., Ren, G., Zwiers, F., and Hu, T. (2016). Contribution of urbanization to warming in China. Nat. Clim. Change 6, 706–709. doi: 10.1038/nclimate2956
Tollefson, J. (2018). First Sun-Dimming Experiment Will Test a Way to Cool the Earth. Available online at: https://www.nature.com/articles/d41586-018-07533-4, (accessed June 4, 2021).
Tran, D., Pla, F., Latorre-Carmona, P., Myint, S., Caetano, M., and Kieu, H. (2017). Characterizing the relationship between land use land cover change and land surface temperature. ISPRS J. Photogr. Remote Sens. 124, 119–132. doi: 10.1016/j.isprsjprs.2017.01.001
Tuholske, C., Caylor, K., Funk, C., Verdin, A., Sweeney, S., Grace, K., et al. (2021). Global urban population exposure to extreme heat. Proc. Natl. Acad. Sci. 118, e2024792118. doi: 10.1073/pnas.2024792118
Tysa, S. K., Ren, G., Qin, Y., Zhang, P., Ren, Y., Jia, W., et al. (2019). Urbanization effect in regional temperature series based on a remote sensing classification scheme of stations. J. Geophys. Res. 124, 10646–10661. doi: 10.1029/2019JD030948
Watts, N., Amann, M., Arnell, N., Ayeb-Karlsson, S., Beagley, J., Belesova, K., et al. (2021). The 2020 report of the lancet countdown on health and climate change: responding to converging crises. Lancet 397, 129–170. doi: 10.1016/S0140-6736(20)32290-X
Weisenstein, D., Keith, D., and Dykema, J. (2015). Solar geoengineering using solid aerosol in the stratosphere. Atmos. Chem. Phys. 15, 11835–11859. doi: 10.5194/acp-15-11835-2015
Wen, K., Ren, G., Li, J., Zhang, A., Ren, Y., Sun, X., et al. (2019). Recent surface air temperature change over mainland China based on an urbanization-bias adjusted dataset. J. Clim. 32, 2691–2705. doi: 10.1175/JCLI-D-18-0395.1
Wikipedia. (2021). Gasoline Gallon Equivalent. Available online at: https://en.wikipedia.org/wiki/Gasoline_gallon_equivalent (accessed December 4, 2021).
William, S. (2021). Push for Cooler Rooftops to Put Ceiling on Rising Temperatures. Available online at: https://www.smh.com.au/property/news/push-for-cooler-rooftops-to-put-ceiling-on-rising-temperatures-20211208-p59fxy.html (accessed January 3, 2022)
Worldbank (2020). Urban Development. Available online at: https://www.worldbank.org/en/topic/urbandevelopment/overview#1 (accessed December 4, 2021).
Xu, X., Swei, O., Xu, L., Schlosser, C., Gregory, J., and Kirchain, R. (2020). Quantifying location-specific impacts of pavement albedo on radiative forcing using an analytical approach. Environ. Sci. Technol. 54, 2411–2421. doi: 10.1021/acs.est.9b04556
Yang, Q., Huang, X., and Tang, Q. (2019). The footprint of urban heat island effect in 302 Chinese cities: temporal trends and associated factors. Sci. Total Environ. 665, 652–662. doi: 10.1016/j.scitotenv.2018.11.171
Yang, X., Hou, Y., and Chen, B. (2011). Observed surface warming induced by urbanization in east China. J. Geophys. Res. Atmos. 116, 1–12. doi: 10.1029/2010JD015452
Zhang, G., Cai, M., and Hu, A. (2013). Energy consumption and the unexplained winter warming over northern Asia and N Morth America. Nat. Clim. Change 3, 466–470. doi: 10.1038/nclimate1803
Zhang, P., Ren, G., Qin, Y., Zhai, Y., Zhai, T., Tysa, S. K., et al. (2021). Urbanization effects on estimates of global trends in mean and extreme air temperature. J. Clim. 34, 1923–1945. doi: 10.1175/JCLI-D-20-0389.1
Zhang, X., Friedl, M. A., Schaaf, C. B., Strahler, A. H., and Schneider, A. (2004). The footprint of urban climates on vegetation phenology. Geophys. Res. Lett. 31, L12209. doi: 10.1029/2004GL020137
Zhao, G., and Gao, H. (2019). Estimating reservoir evaporation losses for the United States: fusing remote sensing and modeling approaches. J. Remote Sens. Environ. 226, 109–124. doi: 10.1016/j.rse.2019.03.015
Zhao, L., Lee, X., Smith, R. B., and Oleson, K. (2014). Strong, contributions of local background climate to urban heat islands. Nature 511, 216–219. doi: 10.1038/nature13462
Zhao, Z., Luo, Y., and Huang, J. (2013). Are there impacts of urban heat islands on future climate change? Adv. Clim. Chang. Res. 4, 133–136. doi: 10.3724/SP.J.1248.2013.133
Zhao, Z. C. (1991). Temperature change in China for the last 39 years and urban e?ects. Meteorol. Monthly (in Chinese) 17, 14–17.
Zhou, D., Zhao, S., Zhang, L., Sun, G., and Liu, Y. (2015). The footprint of urban heat island effect in China. Sci. Rep. 5, 1–10. doi: 10.1038/srep11160
Keywords: solar geoengineering, UHI global warming estimates, UHI footprint, heat pollution, land-cover/land-use, drought relief, reservoir evaporation, Paris Accord suggested goals
Citation: Feinberg A (2022) Solar Geoengineering Modeling and Applications for Mitigating Global Warming: Assessing Key Parameters and the Urban Heat Island Influence. Front. Clim. 4:870071. doi: 10.3389/fclim.2022.870071
Received: 05 February 2022; Accepted: 21 March 2022;
Published: 12 May 2022.
Edited by:
Yuanjian Yang, Nanjing University of Information Science and Technology, ChinaReviewed by:
Yongjing Ma, Institute of Atmospheric Physics (CAS), ChinaKun Wu, Nanjing University of Information Science and Technology, China
Copyright © 2022 Feinberg. This is an open-access article distributed under the terms of the Creative Commons Attribution License (CC BY). The use, distribution or reproduction in other forums is permitted, provided the original author(s) and the copyright owner(s) are credited and that the original publication in this journal is cited, in accordance with accepted academic practice. No use, distribution or reproduction is permitted which does not comply with these terms.
*Correspondence: Alec Feinberg, dfrsoft@gmail.com