 Fernando G. Luna1*
 María Julieta Aguirre1
 Elisa Martín-Arévalo2
 Agustín Ibáñez3,4,5
 Juan Lupiáñez2
 Pablo Barttfeld1
- 1Cognitive Science Group, Instituto de Investigaciones Psicológicas (IIPsi, CONICET-UNC), Facultad de Psicología, Universidad Nacional de Córdoba, Córdoba, Argentina
- 2Department of Experimental Psychology, and Brain, Mind, and Behavior Research Center (CIMCYC), University of Granada, Granada, Spain
- 3Latin American Institute for Brain Health (BrainLat), Universidad Adolfo Ibanez, Santiago, Chile
- 4Cognitive Neuroscience Center (CNC), Universidad de San Andrés & CONICET, Buenos Aires, Argentina
- 5Global Brain Health Institute (GBHI), University of California San Francisco (UCSF), San Francisco, CA, United States and Trinity College Dublin (TCD), Dublin, Ireland
Introduction: Vigilance is the challenging ability to maintain attention during long periods. When performing prolonged tasks, vigilance failures are often observed, reflecting a decrease in performance. Previous research has shown that changes in oscillatory rhythms are associated with states of vigilance loss. The present study aimed to investigate whether changes in different oscillatory rhythms anticipate failures in two vigilance components: (a) executive vigilance –necessary to detect infrequent critical signals– and (b) arousal vigilance –necessary to maintain a fast reaction to environmental stimuli without much control–.
Methods: 37 young adults (age: M = 25.86; SD = 4.99) completed two experimental sessions in which high-density electroencephalography signal was recorded while they performed the Attentional Networks Test for Interactions and Vigilance – executive and arousal components, a task that simultaneously measures executive and arousal vigilance along with others attentional functions. Changes in delta, theta, alpha, beta, and gamma power before target onset were analyzed at the trial level in the executive and the arousal vigilance subtasks and as a function of the behavioral response.
Results: Changes in different oscillatory rhythms were observed prior to failures in executive and arousal vigilance. While increased alpha power in left occipital regions anticipated misses in the executive vigilance subtask, increased delta power in frontal-central regions anticipated very slow responses in the arousal vigilance subtask.
Discussion: The present results further support an empirical dissociation at the neural level between executive and arousal vigilance. Changes in alpha –in left occipital regions– and delta –in frontal-central regions– power might be identified as different brain states associated with loss in vigilance components when performing prolonged tasks.
1. Introduction
Sustaining attention for prolonged periods is a challenging although imperatively necessary ability for many daily life situations (Neigel et al., 2020). When performing prolonged activities (as, for instance, driving a car in a route, taking a lecture, or monitoring critical signals in security environments), sustained attention usually decreases with time-on-task, a phenomenon scientifically known as “vigilance decrement” (Davies and Parasuraman, 1982; Basner et al., 2008; Warm et al., 2008; Stearman and Durso, 2016; Hancock, 2017). In the lab, the vigilance decrement is observed as a progressive increase in vigilance failures, i.e., as a higher miss rate in detecting infrequent signals and slower reaction times (RT) as time-on-task progresses (Thomson et al., 2016). With the aim to elucidate how changes in brain states may be underlying vigilance loss, there has been extensive interest in examining electroencephalographic (EEG) oscillatory rhythms across vigilance tasks (Oken et al., 2006; Kim et al., 2017; Karamacoska et al., 2019; Reteig et al., 2019; Pershin et al., 2023). Nevertheless, to date, it has been particularly challenging to determine whether specific oscillatory rhythms anticipate different vigilance failures in prolonged tasks.
According to some theoretical proposals, vigilance should not be conceived as a single mechanism (Sarter et al., 2001; Sturm and Willmes, 2001; Oken et al., 2006; van Schie et al., 2021). Several models have been proposed to account for vigilance loss in prolonged tasks, most of them predicting a depletion in attentional resources and variations in physiological states of arousal (Thomson et al., 2015; Esterman and Rothlein, 2019; Schumann et al., 2022). According to Sarter et al. (2001), sustained attention can be described as the interaction of two independent neural mechanisms: (a) a top-down mechanism modulating vigilance responses to detect infrequent signals that is regulated by the cholinergic system, and (b) a bottom-up mechanism modulating the arousal levels of attention, which is regulated by noradrenergic's release from the locus coeruleus and might be necessary to modulate the behavioral responsiveness of vigilance. Importantly, Esterman and Rothlein (2019) highlight the critical role of an optimal state of physiological arousal to maintain vigilance, as hypoarousal could lead to reduced task-engagement while hyperarousal might induce distractibility.
Moreover, behavioral tasks measuring vigilance seem to assess different components of this process. While in signal-detection tasks like the Mackworth Clock Test (Mackworth, 1948) participants must detect a critical signal (e.g., a double jump of the clock's hand) that occurs quite rarely, in single RT tasks like the Psychomotor Vigilance Test (Lim and Dinges, 2008) participants are required to stop a single stimulus (i.e., a millisecond counter) as fast as possible, by pressing any available key. Noting the diversity in the theoretical frameworks and behavioral paradigms developed to investigate vigilance, in the last years it has been proposed that vigilance can be dissociated in two independent components, which are measured in different behavioral paradigms (Luna et al., 2018, 2020; Sanchis et al., 2020). On the one hand, executive vigilance (EV) is defined as the ability to monitor and detect infrequent critical signals by executing a specific response. The EV decrement is usually observed in signal-detection tasks like the Mackworth Clock Test as a drop in hit rate on critical signals (Mackworth, 1948; Robertson et al., 1997; Epling et al., 2016). On the other hand, arousal vigilance (AV) is conceived as the capacity to sustain a fast reaction to environmental stimuli without implementing much control on the response. In single RT tasks like the Psychomotor Vigilance Test, the AV decrement is commonly observed as a progressive increase in mean and variability of RT as time-on-task progresses (Drummond et al., 2005; Lim and Dinges, 2008; Basner and Dinges, 2011). Changes in AV have been observed as changes in variability of RT in short inter-stimulus intervals (Steinborn and Langner, 2012) and have been associated with “out of the task” states, wherein increased variability of RT and reduced accuracy is observed (Esterman et al., 2013).
Although extensive research has examined changes in EEG oscillatory rhythms across vigilance tasks, several frequency bands have been associated with vigilance loss, showing relatively inconsistent evidence across studies (Boksem et al., 2005; Oken et al., 2006; Braboszcz and Delorme, 2011; Molina et al., 2019). According to the cortical oscillations model of sustained attention proposed by Clayton et al. (2015), the ability to maintain attention for long periods is regulated by the interaction between theta oscillations in frontomedial cortical regions and alpha and gamma oscillations in posterior areas. Evidence from experimental studies shows that vigilance loss is associated with changes in delta (Braboszcz and Delorme, 2011; Hoedlmoser et al., 2011; Groot et al., 2021), theta (Gorgoni et al., 2014; Molina et al., 2019), alpha (Dockree et al., 2004; Boksem et al., 2005; Clayton et al., 2019; Molina et al., 2019), beta (Braboszcz and Delorme, 2011; Ramautar et al., 2013; Molina et al., 2019; Pershin et al., 2023), and gamma (Kim et al., 2017; Pershin et al., 2023) rhythms. Nonetheless, despite the observed variety of findings, there seems to be a general consensus that states of vigilance loss are associated with increased alpha power (Sadaghiani et al., 2010; Clayton et al., 2018; Benwell et al., 2019; Karamacoska et al., 2019).
In studies measuring EV with signal-detection tasks, changes in different frequency power have been associated with vigilance loss. Boksem et al. (2005) found that the EV decrement in a signal-detection task was accompanied by an increase in theta, alpha, and beta power. In studies measuring frequency power at the trial level, Dockree et al. (2004) analyzed changes in alpha power while participants completed the Sustained Attention to Response Task by Robertson et al. (1997). The authors observed a decline in alpha power in some trials prior to the one wherein the infrequent critical signal was correctly detected, a mechanism that might be interpreted as a state of increased vigilance prior to target detection. Groot et al. (2021) reported that, during mind-wandering periods (i.e., when attention is directed to internal irrelevant thoughts and out of the external task), alpha but also delta and theta power were increased, while beta power was reduced. In this vein, Arnau et al. (2020) observed increased alpha power in inter-trial periods during mind-wandering states. However, other studies failed to observe changes in alpha power across prolonged signal-detection tasks (Kim et al., 2017; Reteig et al., 2019).
Similarly, in studies measuring AV loss with single RT tasks, changes in different frequency power have been observed. In Hoedlmoser et al. (2011), the AV decrement observed across a night of sleep deprivation was accompanied by a progressive increase in delta and theta power. Theta power has been also positively correlated with RT in the Psychomotor Vigilance Test and subjective ratings of fatigue after 40 h of sleep deprivation (Gorgoni et al., 2014). In a study measuring changes in AV along several weeks, Witkowski et al. (2015) found that slower RT were accompanied by a decrease in alpha power at rest. However, when frequencies' power were analyzed as the average change measured in each trial after the target stimuli in the Psychomotor Vigilance Test, similar but also opposite findings were observed. In particular, in Molina et al. (2019), slower RT were associated with increased theta, alpha, and beta power.
While several studies have examined changes in oscillatory rhythms associated with vigilance loss across long periods, as time-on-task (Boksem et al., 2005; Kim et al., 2017; Pershin et al., 2023), sleep deprivation (Hoedlmoser et al., 2011; Gorgoni et al., 2014; Hao et al., 2022), or even weeks (Witkowski et al., 2015), evidence seems to be relatively scarce regarding whether changes in frequency power can anticipate vigilance failures (Dockree et al., 2004; Chua et al., 2012; Molina et al., 2019; Arnau et al., 2020). Moreover, noting that vigilance might be supported by two independent components, it could be possible that EV and AV failures are anticipated by changes in different oscillatory rhythms. Previous research has supported an empirical dissociation of EV and AV at the physiological and neural levels by simultaneously measuring vigilance components, under the same participant's attentional state (Feltmate et al., 2020; Luna et al., 2020; Sanchis et al., 2020). In particular, whereas the EV decrement has been reduced by exercise intensity (Sanchis et al., 2020) and anodal transcranial direct current stimulation over the right fronto-parietal network (Luna et al., 2020; Hemmerich et al., 2023), AV has been modulated by caffeine intake (Sanchis et al., 2020) and fatigue due to ~6 h of extensive testing (Feltmate et al., 2020). Critically, different event-related potentials have been observed for vigilance components in the same task period; whereas EV loss was associated with changes in P3 and slow-positivity in centro-parietal regions, AV loss was associated with changes in N1 and P2 in occipital regions (Luna et al., 2023).
The aim of the present study was to examine whether failures in EV and AV are anticipated by changes in power in specific oscillatory rhythms. To this end, participants completed the Attentional Networks Test for Interactions and Vigilance—executive and arousal components (ANTI-Vea; Luna et al., 2018) while high-density EEG signal was recorded. The ANTI-Vea combines three subtasks that are simultaneously and randomly completed within a single session, in particular: (a) the ANTI task by Callejas et al. (2004), a flanker paradigm combined with visual and warning cues that is suitable to assess the main effects and interactions of classic attentional networks functions (i.e., phasic alertness, orienting, and executive control); (b) a signal-detection subtask similar to the Mackworth Clock Test, suitable for measuring the EV decrement; and (c) a RT subtask similar to the Psychomotor Vigilance Test, suitable to assess the AV decrement (Luna et al., 2018, 2021a,b). Importantly, to increase the number of vigilance trials as well as the statistical power of our study, participants completed the same procedure in two repeated sessions.
To examine whether changes in oscillatory rhythms anticipate vigilance failures, delta, theta, alpha, beta, and gamma power were computed at the trial level prior to target onset and separately for EV and AV components. For each vigilance component, frequency power changes for all bands were analyzed in different vigilance states as a function of the behavioral response, i.e., as optimal performance (hits in EV and fastest RT in AV) or failures in performance (misses in EV and slowest RT in AV). Importantly, in a recent study conducted in our lab, differences in EV and AV states were associated with changes in different event-related potentials: while P1 amplitude in central-parietal regions was larger in hits than misses for EV, N1, and P2 amplitude in occipital channels was smaller in fastest RT than slowest RT for AV (Luna et al., 2023). We expect the present study to contribute in characterizing whether different neural states, described as changes in power in specific oscillatory rhythms, may be useful to anticipate specific vigilance failures when performing prolonged tasks without breaks.
2. Materials and methods
2.1. Participants
Forty healthy adults (34 women; age: M = 25.96; SD = 4.96), who were undergraduate or graduate students from the Universidad Nacional de Córdoba, Argentina, volunteered to participate in the present study. All of them had normal or corrected to normal vision and none of them self-reported any neurological or psychiatric illness. Prior to participation, participants signed an informed consent approved by the local ethics committee. The study was conducted according to the ethical standards of the 1964 Declaration of Helsinki (last update: Seoul, 2008) and was positively evaluated by a local ethics committee (Comité Institucional de Ética de Investigaciones en Salud of the Hospital Nacional de Clínicas, CIEIS HNC, Universidad Nacional de Córdoba, Argentina).
Five participants were excluded from data analysis due to the following reasons: three participants did not complete the second EEG session, one participant had an extreme error percentage in the ANTI trials (3 SD above the group mean), and one participant had an overly high mean power (3 SD above the group mean) in four frequency bands. Therefore, the final sample size of the present study was N = 35.
Sample size was a-priori estimated based on previous studies with 40 participants per group in which the decrement in hits across six blocks measured with the ANTI-Vea showed an effect size of = 0.05 (Luna et al., 2018, 2021a). Using G*Power 3.1.9.4 (Faul et al., 2007), power analysis showed that considering α = 0.05 and 1 - β = 0.90, the minimum sample size required to observe a decrease in hits across blocks considering an effect size of = 0.05, two sessions, and seven blocks, was of 35 participants (i.e., as the final sample included in data analysis). Given that in the present study participants performed two experimental sessions of seven blocks, the statistical power of our study was much higher than in previous studies with a lower number of trials (i.e., one session of six blocks in Luna et al., 2018, 2021a; Baker et al., 2021).
2.2. Behavioral task: ANTI-Vea
The experimental task was designed and run with E-Prime 2.0 software (Psychology Software Tools, 2012). The ANTI-Vea comprises three embedded subtasks that are randomly completed across three separated types of trials: (a) ANTI (60%), a flanker paradigm combined with auditory and visual cues suitable to assess the main effects and interactions of the classic attentional networks functions (i.e., phasic alertness, orienting, and executive control); (b) EV (20%), a signal-detection subtask similar to the Mackworth Clock Test to assess the EV component; and (c) AV (20%), a RT subtask that mimics the Psychomotor Vigilance Test to assess the AV component. Importantly, as depicted in Figure 1, stimuli timing was the same for the three type of trials. Further details on the procedure, stimuli, and instructions of the ANTI-Vea can be reviewed in previous studies (Luna et al., 2018, 2021a,b). Importantly, the ANTI-Vea has shown acceptable split-half reliability scores for hits in EV and mean RT in AV (i.e., mean r corrected by the Spearman-Brown prophecy above 0.90) and at least similar split-half reliability for phasic alertness, orienting, and executive control as the ANT (MacLeod et al., 2010) and ANTI (Ishigami and Klein, 2010) tasks (Luna et al., 2021b).
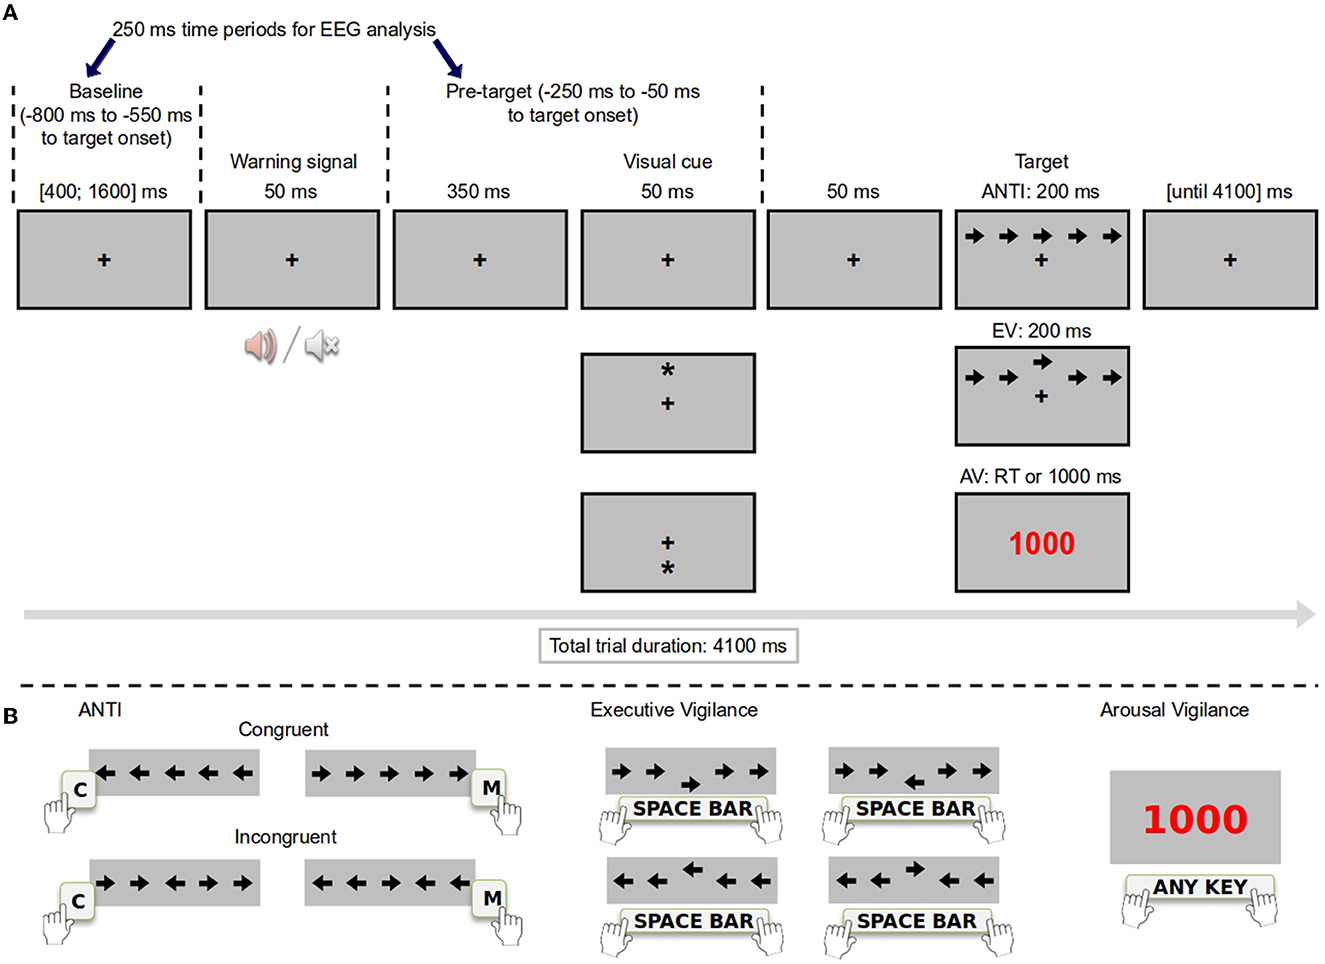
Figure 1. Experimental procedure and timing of ANTI-Vea trials. (A) Stimuli and timing for ANTI-Vea trials. Warning signal and visual cue were only present in ANTI and EV trials, although only counterbalanced in ANTI trials. (B) Correct responses in examples of the three type of trials of the ANTI-Vea. Responses were allowed since target onset until 2,000 ms in each type of trial.
Participants were encouraged to fix on the fixation cross at all times. As depicted in Figure 1A, ANTI trials followed the procedure of the ANTI task (Callejas et al., 2004). In these trials, participants had to select the direction (left/right) pointed by the central arrow of a five-arrow horizontal string—which could appear either above or below the fixation point—, ignoring the direction pointed by the surrounding flanking arrows (see Figure 1B). Importantly, ANTI trials serve a double purpose in the ANTI-Vea. On the one hand, the main effects and interactions of classic attentional functions were measured in ANTI trials as follows: (a) to assess executive control, the direction of the target and flanking arrows were congruent in half of these trials and incongruent in the other half; (b) to assess phasic alertness, a tone (i.e., warning signal) could anticipate the target in half of these trials, whereas no tone was presented in the other half; and (c) to assess attentional orienting, the target's position (i.e., above/below the fixation point) could be preceded either by a valid (i.e., the same location in 1/3 of ANTI trials), an invalid (i.e., the opposite location in 1/3 of ANTI trials) spatial visual cue, or by no cue at all in the remaining 1/3 of ANTI trials. On the other hand, ANTI trials were considered as the noise events for the embedded signal-detection subtask in the ANTI-Vea, as the infrequent critical signal (i.e., a large vertical displacement of the target) was not present in ANTI trials.
EV trials had the same procedure than ANTI trials, except that the target was largely displaced (i.e., 8 pixels –px–) from its central position in the five-arrow horizontal string either upwards or downwards (see Figure 1A). To perform EV trials, participants were instructed to continuously monitor and detect the infrequent vertical displacement of the target (i.e., the critical signal of the embedded signal-detection subtask of the ANTI-Vea) by pressing the space bar key, ignoring in these cases the direction the target pointed to (see Figure 1B). Note that, if participants pressed the space bar key in the ANTI trials (i.e., the noise events of the signal-detection subtask), the response was categorized as a false alarm. Lastly, AV trials had the same timing than the ANTI and EV ones but, importantly, no warning signal nor visual cue was presented (i.e., the fixation point remained on the screen) and the target of the ANTI/EV trials was replaced by a millisecond counter (see Figure 1A). In AV trials, participants had to stop the millisecond counter as fast as possible by pressing any key from keyboard (see Figure 1B).
2.3. EEG data acquisition and pre-processing
A high density 128 channels BioSemi ActiveTwo system, controlled with the ActiView software (BioSemi, Amsterdam), was used for EEG signal recording. Electrical reference channels were set with two flat-type active-electrodes placed over the right and left mastoids. Signal was registered with a sampling rate of 1,024 Hz and keeping electrode's impedance below 1 Ohm.
EEG data pre-processing was conducted using EEGLAB v2020.0 toolbox (Delorme and Makeig, 2004) on MATLAB R2016a (The MathWorks, Inc.). Raw data format was converted to the EEGLAB format and resampled at 512 Hz. The signal was filtered between 0.5 and 45 Hz and then decomposed into 128 components (i.e., the same number of channels) using Independent Component Analysis. Using ADJUST v.1.1.1 (Mognon et al., 2011), artifactual components were automatically classified as horizontal eye movements (M = 3.36; SD = 2.50), vertical eye movements (M = 6.96; SD = 5.46), blinks (M = 3.99; SD = 3.29), and generic discontinuities (M = 14.71; SD = 8.59), and were removed from signal.
Data was epoched in 3,400 ms periods from the initial fixation point onset in each trial. Epochs were visually inspected to interpolate artifactual channels or to reject the entire epoch if it was too noisy (trials rejected by participant in the collapsed two sessions: M = 10.30; SD = 17.46). Finally, following Clayton et al. (2015), signal was filtered in five frequency bands as follows: delta (1–4 Hz), theta (4–8 Hz), alpha (8–14 Hz), beta (14–30 Hz), and gamma (30–45 Hz). Frequency power was calculated as the squared signal in each frequency band.
2.4. Procedure and design
Prior to the experimental sessions in the lab, participants performed a practice session outside the lab to familiarize themselves with the task by completing the online ANTI-Vea (https://www.ugr.es/~neurocog/ANTI/; Luna et al., 2021b). Then, aiming at increasing the number of vigilance trials for EEG analysis, each participant completed two experimental sessions at the lab (average time between sessions: M = 11.94 days; SD = 16.10). At the lab, participants received the standard instructions to complete each type of trial and performed one practice block of 40 (24 ANTI, 8 EV, and 8 AV) randomly presented trials, without visual feedback. Each experimental session comprised seven experimental blocks without any pause or visual feedback, consisting in 80 (48 ANTI, 16 EV, and 16 AV) randomly presented trials within each block. The ANTI trials had the following design: Warning signal (no tone/tone) × Visual cue (invalid/no cue/valid) × Congruency (congruent/incongruent). The 16 executive vigilance trials per block were randomly selected from any possible combination of the ANTI trials design.
2.5. Data analysis
Data analyses were conducted using RStudio 2022.07.1 Build 554 (RStudio Team, 2022) in R 4.1.2 (R Core Team, 2021). Aiming at increasing the number of EV/AV trials, both behavioral and EEG data was collapsed across sessions. Analyses of variance (ANOVA) were conducted with the afex package (Singmann et al., 2021) and planned contrasts were performed with the emmeans package (Lenth, 2021). Partial eta-squared () are reported as measure of the ANOVAs' effect size and Cohens' d as a measure of t-tests' effect size (Kelley and Preacher, 2012). All effect sizes are reported with the 95% confidence intervals around them (Cumming, 2014). In those ANOVAs wherein the sphericity assumption was violated (i.e., Mauchly's test p < 0.05), degrees of freedom are reported with Greenhouse-Geisser correction.
Behavioral data was plotted with Matplotlib (Hunter, 2007). EEG data figures were performed using ggplot2 (Wickham, 2016), purrr (Henry and Wickham, 2020), Rmisc (Hope, 2013), and magrittr (Bache and Wickham, 2020) packages in RStudio for time-frequency plots and MNE-Python code (Gramfort et al., 2013) for topoplots.
2.5.1. Behavioral data
Given that the main aim of the present study was to analyze vigilance failures, behavioral data analyses were focused on EV and AV components measured with the ANTI-Vea. Data analyses on the main effects and interactions of the classic attentional functions measured in the ANTI trials were analyzed and reported in a separated study aiming to analyze event-related potentials associated with attentional networks functions (Luna et al., 2023).
First, to analyze the EV and AV decrements across time-on-task, data was averaged as a function of blocks of trials. For EV trials, data were collapsed across warning signal, visual cue, and congruency conditions, following standard analysis of the ANTI-Vea (Luna et al., 2021a). The EV decrement was analyzed with a repeated-measures ANOVA, with hits rate as dependent variable and blocks (seven levels) as a within-participant factor. The AV decrement was analyzed with a repeated-measures ANOVA, with mean RT in AV trials as dependent variable and blocks (seven levels) as a within-participant factor. To determine the significance of a linear EV/AV decrement, planned comparisons of the polynomial linear component were performed.
Then, and more importantly for the goal of this study, to describe EV and AV failures, overall responses in EV and AV trials were categorized as follows. For EV trials, whereas hits (i.e., correct responses) described an adequate EV performance, misses (i.e., incorrect responses) were considered as EV failures. Overall AV performance was analyzed following standard scores usually computed in the Psychomotor Vigilance Test (Basner and Dinges, 2011). In particular, for AV trials, whereas fastest RT (i.e., first quintile of RT responses) described an adequate AV performance, slowest RT (fifth quintile of RT responses) were considered as AV failures. Trials with RT equal to 0 ms (i.e., “no responses”) were removed from AV data analyses (0.38% of AV trials).
2.5.2. EEG data
To analyze whether changes in oscillatory rhythms might anticipate vigilance failures, power in frequency bands was analyzed in the 800 ms preceding the EV or AV target onset at the trial level. For each frequency band, mean power was calculated at two time periods of 250 ms in each trial (see Figure 1A): (a) baseline (−800 to −550 ms prior to target onset) and (b) pre-target (−300 to −50 ms prior to target onset). Power in frequency bands was computed in EV trials as a function of hits/misses and in AV trials as a function of fastest/slowest RT.
For EV analyses, given that the difference in trial count between hits and misses might biases the outcomes, we performed a randomized selection of EV trials to equate the number of hits and misses by participant (Cohen, 2014). Noting that hits decrease with time-on-task (see below section 3.1), following Reteig et al. (2019), first hits/misses trials were randomly selected in two task periods: between blocks 1 and 4 and between blocks 5 and 7. The randomized selection of trials was performed only for the largest subset of trials (i.e., hits or misses) in each task period to equate the smallest subset of trials and was repeated 1,000 times. Each subset of randomly selected trials was averaged and, after that, all 1,000 subsampled trials-averaged were averaged together. Finally, data was collapsed between task periods (i.e., blocks 1–4 and blocks 5–7) and averaged as a function of hits/misses.
Next, to determine whether the change in frequency power prior to target onset anticipates EV/AV performance, we computed a normalized change as a function of hits/misses for EV trials and as a function of fastest/slowest responses for AV trials. The normalized change was separately computed for delta, theta, alpha, beta, and gamma power as follows:
Mean power in baseline and the normalized power change in the pre-target period of each frequency band were computed in nine a-priori defined channels across the whole brain, in particular: O1, Oz, O2, P3, Pz, P4, F3, Fz, F4. Then, analyses were separately conducted for EV/AV performance, by analyzing each frequency band in separated repeated-measures ANOVAs for baseline (with mean power as dependent variable) and pre-target (with normalized change power as dependent variable) periods, with channels of interest (nine levels) and performance (hits/misses for EV or fastest/slowest RT for AV) as within-participant factors. To determine whether the normalized power change in a specific frequency band was significantly different as a function of performance in a singular or multiple channels of interest, paired-wise comparisons were conducted.
3. Results
3.1. Behavioral performance
As reported in Luna et al. (2023) and similarly to previous studies with the ANTI-Vea (Luna et al., 2018, 2021a,b), the EV decrement was observed as a significant change in hits across time-on-task [F(4.55, 154.58) = 9.70, p < 0.001, = 0.22, CI95% (0.11, 0.30); see Figure 2A]. Polynomial contrasts demonstrated a significant and negative linear component for hits across blocks [t(34) = −5.23, p < 0.001, = 0.45, CI95% (0.24, 1.00)]. Unexpectedly, however, the AV decrement was not observed in the present study and Luna et al. (2023) (see Figure 2B): the change of mean RT across blocks was not significant [F(3.93, 133.78) = 0.46, p = 0.764, = 0.01, CI95%(0.00, 0.03)].
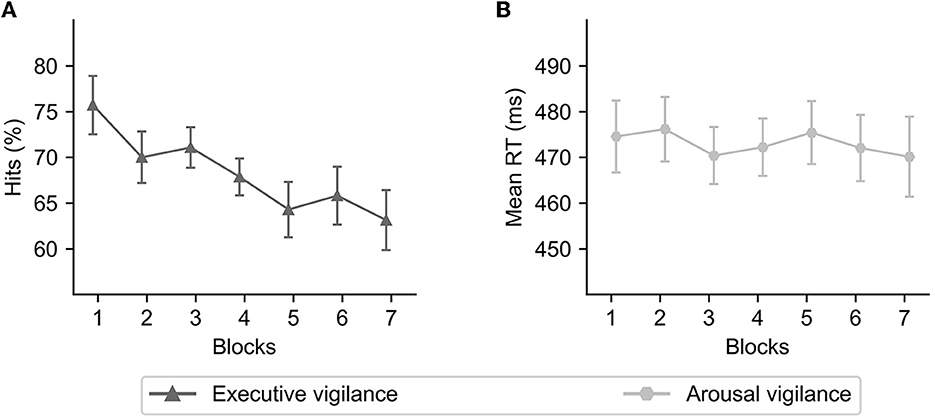
Figure 2. Executive (A) and arousal (B) vigilance performance as a function of time-on-task. Error bars represent 95% confidence intervals and were computed with the Cousineau-Morey method (Morey, 2008).
A summary of EV and AV overall performance is presented in Table 1.
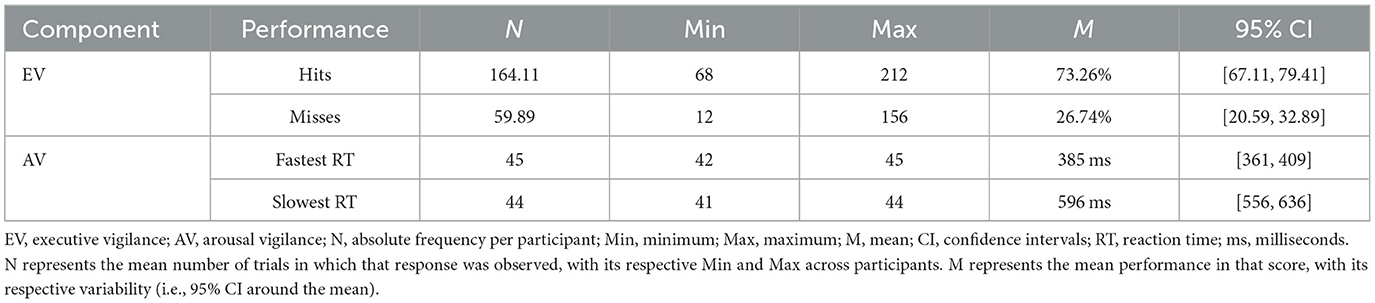
Table 1. Descriptive statistics of executive and arousal vigilance overall performance.
3.2. Frequency power
For the sake of clarity, the report of each ANOVA is focused on the interaction between channels and performance, which examines whether differences in power in channels of interest was modulated by vigilance performance. Main effects of channels (i.e., whether frequency power was different among channels of interest) and performance (i.e., whether frequency power was different as a function of the EV/AV response) are summarized in Tables 3, 5.
3.2.1. Executive vigilance
In the baseline period, mean frequency power in channels of interest was not significantly modulated by performance (i.e., hit or miss) for delta, theta, alpha, beta, or gamma band (see Table 2). Importantly, as depicted in Figure 3A and detailed in Table 2, in the pre-target period, the normalized change from baseline in channels of interest was significantly modulated by performance only for alpha power, but not for delta, theta, beta, or gamma band.
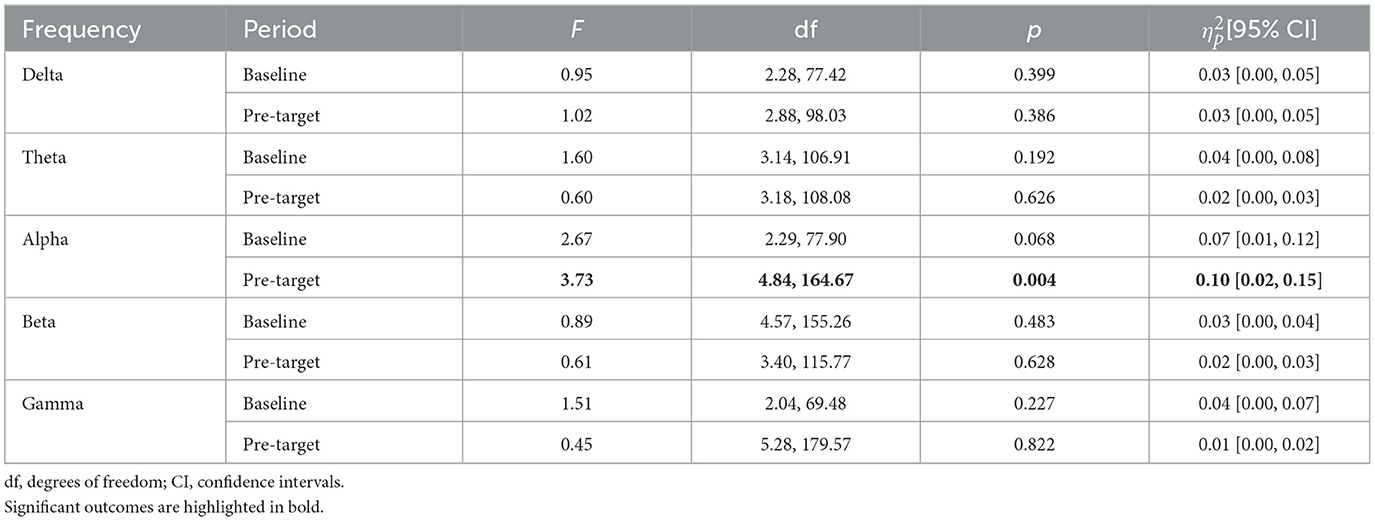
Table 2. Statistics of the interaction between channel and performance (i.e., hits vs. misses) factors analyzed in repeated-measures ANOVAs for executive vigilance.
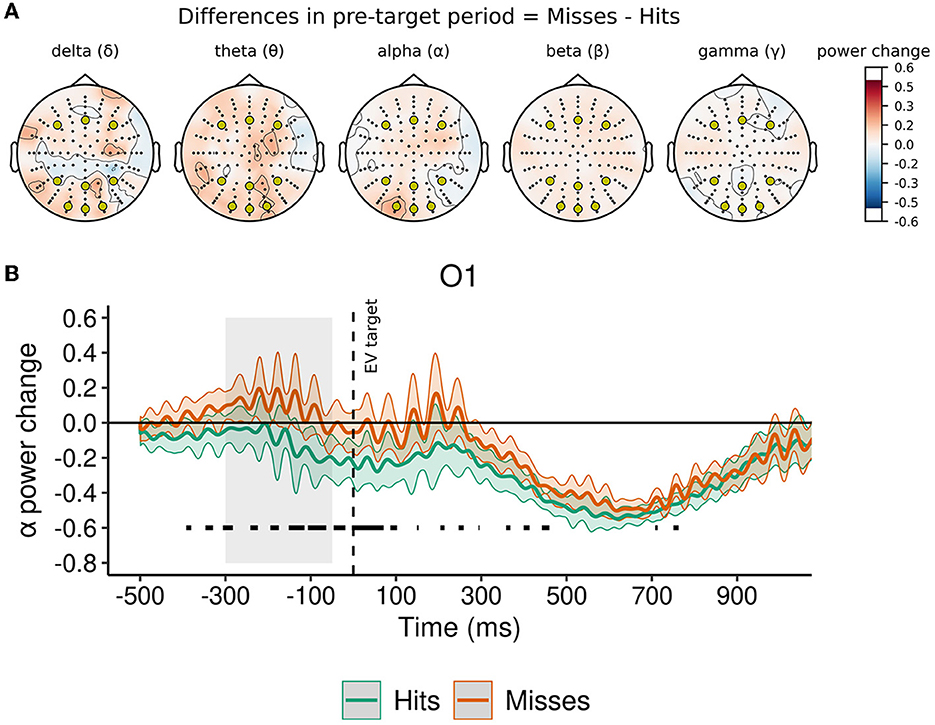
Figure 3. Normalized change in power of oscillatory rhythms in pre-target period as a function of executive vigilance performance. (A) Topoplots represent the difference between conditions in mean power change from baseline in the pre-target period for each frequency band. In all topoplots, a-priori channels of interest (O1, Oz, O2, P3, Pz, P4, F3, Fz, F4) are represented with yellow markers. (B) Alpha power change from baseline in O1. Significant differences (p < 0.05) between conditions at each time point are highlighted with a black line above the x-axis. The gray area prior to target onset (i.e., between −350 and −50 ms) represents the pre-target period. Shadowed traces around mean signal represent within-participant 95% CI of mean for that condition and were computed with the Cousineau-Morey method (Morey, 2008).
Pairwise comparisons in the pre-target period for alpha band determined that the normalized power change between trials with hits and misses was significantly different only in O1 [t(34) = −3.09, p = 0.004, Cohen's d = 0.53, CI95% (0.17, 0.88)], but not in the other channels of interest (all ps > 0.110). As can be observed in Figure 3B, the normalized change of alpha power was smaller in trials with hits than in trials with misses in the pre-target period.
As can be observed in Table 3, mean power in the baseline period and the normalized change in the pre-target period were not significantly different as a function of EV performance for delta, theta, alpha, and gamma bands. However, in the analyses for beta band, in the baseline period mean power was not significantly different between trials with hits and misses, but there was a significant difference in the pre-target period as a function of EV performance (see Table 3). In the pre-target period, beta power decreased from baseline in trials with hits (normalized change M = −0.05, 95% CI[−0.07, −0.03]) but not in trials with misses (normalized change M = 0.00, [−0.04, 0.04]).
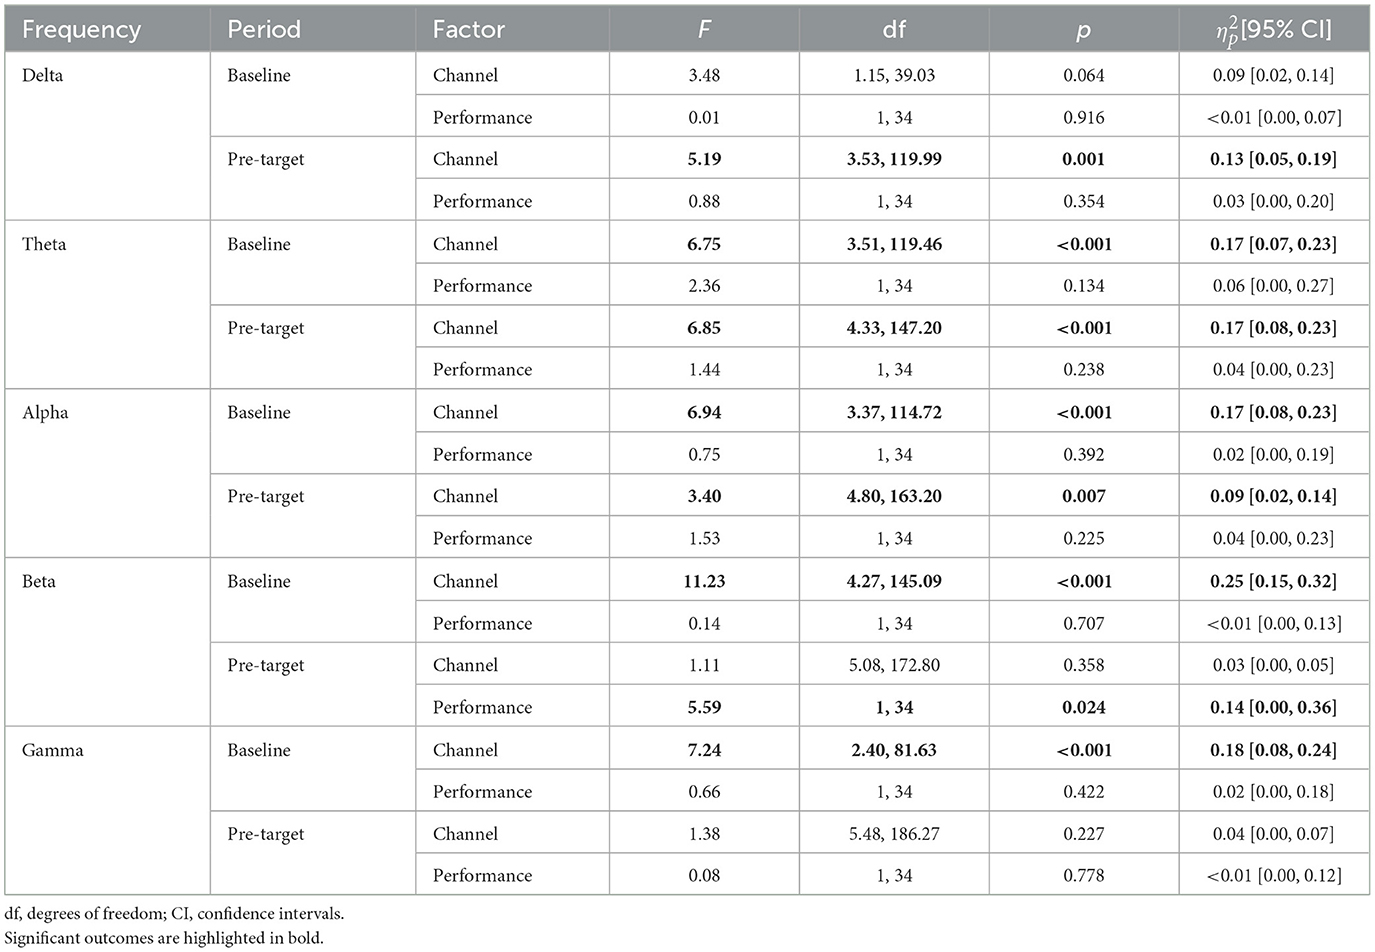
Table 3. Statistics of channel and performance (i.e., hits vs. misses) factors analyzed in repeated-measures ANOVAs for executive vigilance.
3.2.2. Arousal vigilance
Similarly to analysis for EV, in the baseline period, mean frequency power in channels of interest was not modulated by performance (i.e., fastest or slowest RT) for delta, theta, alpha, beta, and gamma band (see Table 4). As observed in Figure 4A and detailed in Table 4, in the pre-target period, the normalized change from baseline in a-priori channels of interest was not significantly modulated by performance in delta, theta, alpha, beta, and gamma band.
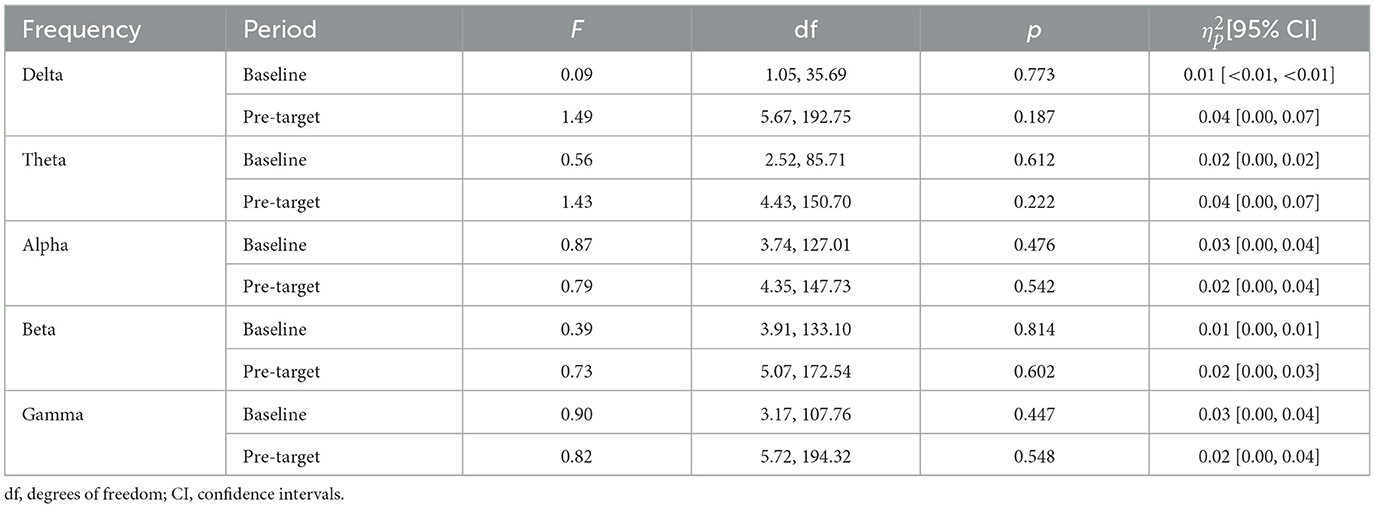
Table 4. Statistics of the interaction between channel and performance (i.e., hits vs. misses) factors analyzed in repeated-measures ANOVAs for arousal vigilance.
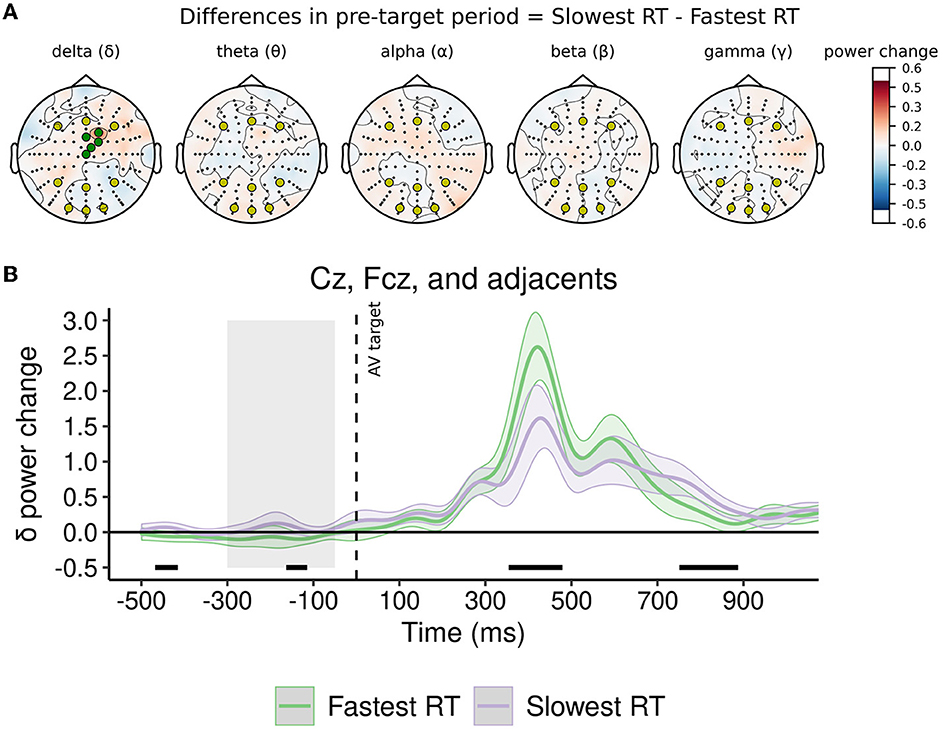
Figure 4. Normalized change in power of oscillatory rhythms in pre-target period as a function of arousal vigilance performance. (A) Topoplots represent the difference between conditions in mean power change from baseline in the pre-target period for each frequency band. In all topoplots, a-priori channels of interest (O1, Oz, O2, P3, Pz, P4, F3, Fz, F4) are represented with yellow markers. In topoplot for delta, exploratory channels of interest (Fcz, Cz, and adjacent channels) are represented with green markers. (B) Delta power change from baseline in frontal-central channels. Significant differences (p < 0.05) between conditions at each time point are highlighted with a black line above the x-axis. The gray area prior to target onset (i.e., between −350 and −50 ms) represents the pre-target period. Shadowed traces around mean signal represent within-participant 95% CI of mean for that condition and were computed with the Cousineau-Morey method (Morey, 2008).
Interestingly, noting the differences observed in some regions in the high-density topoplot of delta band in Figure 4A, exploratory repeated-measures ANOVAs on these oscillatory rhythms were conducted. Exploratory analysis included as a tenth region of interest a set of five frontal-central channels (Cz, Fcz, and three adjacent channels) where clear differences were observed in a-priori analysis. In channels included in exploratory analysis, performance did not significantly modulate mean power in the baseline period [F(1.05, 35.85) = 0.09, p = 0.776, = < 0.01, CI95% (< 0.01, < 0.01)], nor the normalized change from baseline in the pre-target period [F(6.35, 215.91) = 1.83, p = 0.090, = 0.05, CI95% (0.00, 0.10)]. Following the differences observed in high-density topoplot (see green channels in Figure 4A), post-hoc comparisons showed that, in the pre-target period, the normalized delta power change was significantly smaller in trials with fastest RT than in trials with slowest RT only in exploratory frontal-central channels [t(34) = −2.12, p = 0.041, Cohen's d = 0.36, CI95% (0.01, 0.71)] (see Figure 4B), but not in the other a-priori channels of interest (all ps > 0.090).
As can be observed in Table 5, mean power in the baseline period and the normalized change in the pre-target period were not significantly different in any frequency band as a function of AV performance.
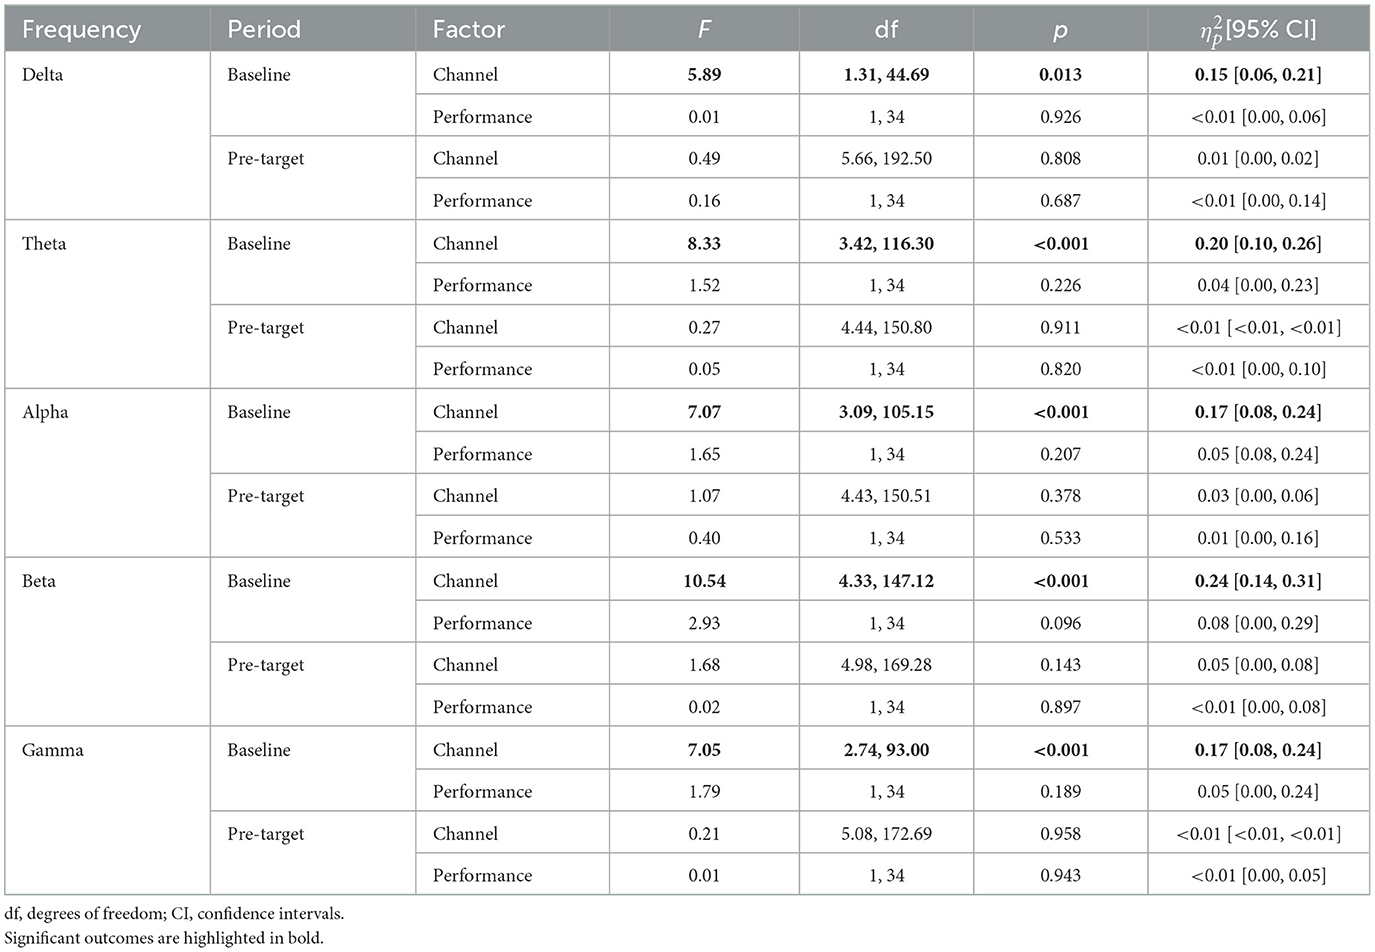
Table 5. Statistics of channel and performance (i.e., fastest RT vs. slowest RT) factors analyzed in repeated-measures ANOVAs for arousal vigilance.
4. Discussion
The present study aimed at examining whether failures in two dissociated vigilance components, i.e., EV and AV, are anticipated by changes in power of different oscillatory rhythms. Although previous research has extensively examined changes in oscillatory rhythms associated with states of vigilance loss (Boksem et al., 2005; Oken et al., 2006; Braboszcz and Delorme, 2011; Molina et al., 2019), evidence reported so far seems to be relatively inconsistent about whether changes in specific frequency bands might serve as indicators of failures in different vigilance components (Boksem et al., 2005; Chua et al., 2012; Kim et al., 2017; Molina et al., 2019; Reteig et al., 2019; Groot et al., 2021). A critical limitation to identify whether different brain states are independently associated with EV or AV might rely in the difficulty to simultaneously assess vigilance components, thus observing failures in EV and AV under the same participants' attentional state. To overcome this limitation, in the present study, changes in power of several frequency bands were analyzed while participants completed the ANTI-Vea, a behavioral task that simultaneously measures EV and AV along with others classic attentional components in a single session (Luna et al., 2018, 2021a,b). Importantly, failures in vigilance components were anticipated by changes in different oscillatory rhythms. Whereas, increased alpha power in left occipital areas and beta power (independently of the brain region) anticipated misses in EV, increased delta power in frontal-central regions was observed prior to slowest responses in AV.
The cortical oscillations model of sustained attention posits that alpha oscillations play an important role in task-irrelevant cortical areas (as, for instance, auditory cortices during a visual task) aiding to sustain attention by suppressing distracting information from the environment (Clayton et al., 2015). However, when alpha oscillations are present in task-relevant areas (as in visual cortex when performing a visual signal-detection task), alpha oscillations may impair attentional focus (Clayton et al., 2015). In the present study, changes in alpha oscillations were specifically observed in task-relevant areas, i.e., left occipital regions (O1). As predicted by Clayton et al. (2015), when performing prolonged tasks without breaks, increased alpha power in task-relevant areas as the occipital cortex in a visual signal-detection task should hinder vigilance performance, leading to vigilance failures due to the loss of attentional focus. Critically, as proposed by the cortical oscillations model of sustained attention (Clayton et al., 2015), in the present study increased alpha power in left occipital regions was observed prior to target onset in trials with failures in EV (i.e., misses on the critical signal), impairing attentional focus in the ongoing EV subtask. In line with the model proposed by Clayton et al. (2015) and the present results, previous research has found that stabilizing alpha oscillations at 10 Hz through transcranial alternating current stimulation over occipital regions prevents the EV decrement in visual detection tasks (Clayton et al., 2019), thus further supporting the prediction that increased alpha oscillations in occipital regions might lead to states of reduced EV. Importantly, the present outcomes also fit well with previous research in which increased alpha power was associated with states of EV loss (Dockree et al., 2004; Boksem et al., 2005; Arnau et al., 2020; Groot et al., 2021).
Interestingly, similar to the pattern observed in alpha rhythms, increased beta power prior to target onset was observed in trials with misses in the EV subtask. However, in contrast to alpha rhythms, beta power changes seem to be region–independent, as the observed effect was not modulated by channels of interest. The observed results in beta rhythms seem to be in contrast with some previous research in which reduced (rather than increased, as in the present study) beta power was associated with states of vigilance loss (Braboszcz and Delorme, 2011; Pershin et al., 2023). Note that beta rhythms seem to not play a critical role in the cortical oscillations model of sustained attention (Clayton et al., 2015). Taking all this into account, we consider that the observed outcomes in beta rhythms should be taken with caution and, most importantly, further explored in future research. Some indices combining beta with alpha and also theta rhythms have been proposed to account for changes in vigilance in prolonged periods (Kamzanova et al., 2014; Coelli et al., 2018). Future studies may further address whether changes in beta rhythms associated with EV performance in the ANTI-Vea are rather independent of the cortical region and/or if changes in beta power are related with other frequency bands, as alpha and theta.
Regarding failures in AV, only increased delta power in frontal-central regions was observed prior to AV target onset in trials with slowest RT. Note that the cortical oscillations model of sustained attention seems to be specifically developed for vigilance in visual detection tasks (Clayton et al., 2015), in which the EV component is mainly involved. Indeed, the model proposed by Clayton et al. (2015) does not predict changes in delta rhythms associated with sustained attention. Importantly, while in the present study changes in AV were measured in a single and daytime session, note that previous research has mainly examined changes in oscillatory rhythms associated with AV loss in sleep deprivation periods (Hoedlmoser et al., 2011; Chua et al., 2012; Gorgoni et al., 2014) or in several sessions across weeks (Witkowski et al., 2015). Moreover, it is important to note that some previous studies analyzing changes in frequency bands in single RT tasks have not analyzed delta power (Witkowski et al., 2015; Molina et al., 2019). However, in studies measuring AV with single RT tasks in which delta power was analyzed, increased delta power was associated with vigilance loss states (Hoedlmoser et al., 2011; Chua et al., 2012; Gorgoni et al., 2014). Whereas Hoedlmoser et al. (2011) and Gorgoni et al. (2014) observed that AV loss during the course of sleep deprivation was accompanied by increased delta –but also others frequency bands– power, Chua et al. (2012) found that delta power in frontal-central regions (i.e., Fz) was positively correlated with lapses (i.e., responses slower than 500 ms in the Psychomotor Vigilance Test) during sleep deprivation. Therefore, the present outcomes seem to fit well with those observed in Chua et al. (2012), supporting that increased delta power in frontal-central regions might be identified as a neural state associated with AV loss states at the trial level.
The present outcomes further support an empirical dissociation at the neural level between EV and AV as two independent vigilance components. There is a long-standing discussion concerning whether vigilance is better understood as a set of independent brain mechanisms rather than as a single component (Sarter et al., 2001; Sturm and Willmes, 2001; Oken et al., 2006; van Schie et al., 2021). According to some conceptual and theoretical reviews, the concept of vigilance has been used to describe different mechanisms associated with alertness and sustained attention (Oken et al., 2006; van Schie et al., 2021). Following, Oken et al. (2006), vigilance can define either: (a) the ability to maintain attention in prolonged periods to perform the task at hand, (b) a hypervigilance state to increase alertness for detecting potential threats from the environment and avoid dangers, or (c) the arousal levels of attention, which oscillate during the sleep-wake cycle. Although it has been proposed that the arousal levels of attention would not be associated with a particular behavioral response (Sarter et al., 2001; Oken et al., 2006), empirical research has demonstrated that changes in arousal and readiness can be observed by measuring AV through simple RT tasks, like the Psychomotor Vigilance Test (Lim and Dinges, 2008; Basner and Dinges, 2011). In particular, the slowness in readiness has been associated to AV loss in prolonged RT tasks, which seems to be related with mental fatigue although unaffected by temporal preparation after warning signals presented at different foreperiods (Langner et al., 2010).
Previously, McIntire et al. (2014) observed some dissociable effects of transcranial direct current stimulation on vigilance components, although EV and AV were measured at different moments of the session through different behavioral tasks. During a night of sleep deprivation, it was observed that while stimulation reduced the drop in hits in the Mackworth Clock Test for EV, stimulation did not affect mean RT in the Psychomotor Vigilance Test for AV (McIntire et al., 2014). In the last years, by simultaneously measuring vigilance components in a single session under the same participants' state, the proposed conceptual dissociation between EV and AV has been supported by empirical evidence at the behavioral (Luna et al., 2022a,b), physiological (Feltmate et al., 2020; Sanchis et al., 2020), and neural (Luna et al., 2020, 2023; Hemmerich et al., 2023) levels. In particular, at the behavioral level, the EV but not the AV decrement was modulated by the cognitive load of the task at hand (Luna et al., 2022a) and was associated with the decrement in cognitive control across time-on-task (Luna et al., 2022b). At the physiological level, while only the AV decrement was mitigated by caffeine intake, exercise intensity modulated only EV performance (Sanchis et al., 2020). Moreover, Feltmate et al. (2020) observed that after performing ~6 h of cognitive tasks, fatigue particularly impaired AV but not EV. Finally, at the neural level, anodal transcranial direct current stimulation over the right fronto-parietal network mitigated the EV but not the AV decrement (Luna et al., 2020; Hemmerich et al., 2023) and different event-related potentials have been associated with changes in EV and AV (Luna et al., 2023). In the present study, a novel dissociation between EV and AV at the neural level was observed: whereas increased alpha power in left occipital regions anticipates failures in EV, increased delta power in frontal-central regions anticipates failures in AV.
Lastly, it is important to note that the present study is not exempt of some limitations. Unexpectedly, the typical AV decrement, usually observed as an increase in mean RT across blocks, was not found in our data. A similar outcome was observed in a previous study conducted with the ANTI-Vea, in which participants completed the task while receiving anodal/sham transcranial direct current stimulation and EEG signal was recorded (Luna et al., 2020). Indeed, in the present study, the AV decrement was also not observed in SD of RT across blocks [F(3.81, 129.41) = 0.58, p = 0.667, = 0.02, CI95%(0.00, 0.03)]. Nonetheless, given that the aim of the present study was to analyze brain states at the trial level associated with states of vigilance loss, analyses on AV were focused on other classic scores usually computed in single RT tasks, i.e., as fastest and slowest RT (Basner and Dinges, 2011). In this vein, previous research has associated different brain states described by changes in BOLD signal (Drummond et al., 2005) and theta, alpha, and beta power (Molina et al., 2019) with the speed of responses in the Psychomotor Vigilance Test. Fastest and slowest RT are two of the most used scores in the Psychomotor Vigilance Test (Basner and Dinges, 2011). Indeed, a typical score to assess AV changes in RT tasks is the lapses' rate, a score that averages responses ≥500 ms in the Psychomotor Vigilance Test (Basner and Dinges, 2011) or ≥600 ms in the ANTI-Vea (Luna et al., 2018, 2021a,b). Note that these thresholds are relatively similar to the mean of slowest RT observed in the present study (see Table 1). To assess differences in AV states by a similar number of trials, we decided to compare changes in frequencies' power as a function of trials with slowest vs. fastest RT. Therefore, despite the AV decrement was not observed in the present study, we consider that fastest and slowest RT are appropriate scores for describing AV states.
Finally, it should be acknowledged that changes in delta power associated with AV states were not observed in a-priori analyses, as no significant differences in frequency power were observed between trials with fastest and slowest RT in the nine a-priori defined channels. However, it must be noticed that differences observed in delta power in central regions as a function of fastest/slowest RT trials were not observed in high-density topoplots for theta, alpha, beta, and gamma bands. Therefore, although changes in delta power in central regions seems to be specifically associated with AV states, we recognize that these outcomes should be further explored.
To conclude, the present study provides novel and high-powered evidence about changes in different oscillatory rhythms as predictors of failures in vigilance components. For EV, misses in a signal-detection subtask were anticipated by increased alpha power in left occipital regions prior to the infrequent critical signal onset. For AV, slowest responses in a single RT subtask were anticipated by increased delta power in frontal-central regions prior to target onset. The increment in alpha power associated with EV loss seem to fit well with the role of alpha oscillations in visual detection tasks accounted by the cortical oscillations model of sustained attention of Clayton et al. (2015). The increment in delta power associated with AV loss in frontal-central regions are in line with previous findings observed in single RT tasks (Chua et al., 2012). The present outcomes further support an empirical dissociation at the neural level between EV and AV as two independent components. Changes in alpha power left occipital regions in EV and in delta power in frontal-central regions in AV might serve as indicators of vigilance loss states across prolonged periods.
Data availability statement
The datasets presented in this article are not readily available because expressed consent to publicly share data collected was not required to participants. Requests to access the datasets should be directed to FL (Zmx1bmFAdW5jLmVkdS5hcg==) and PB (cGFibG9iQGNvbmljZXQuZ292LmFy).
Ethics statement
The studies involving human participants were reviewed and approved by Comité Institucional de Ética de Investigaciones en Salud of the Hospital Nacional de Clínicas, CIEIS HNC, Universidad Nacional de Córdoba, Argentina. The patients/participants provided their written informed consent to participate in this study.
Author contributions
FL: conceptualization, data curation, formal analysis, investigation, methodology, resources, software, validation, visualization, writing—original draft, review, and editing. MA: conceptualization, data curation, formal analysis, investigation, methodology, software, validation, visualization, and writing—review and editing. EM-A: conceptualization, formal analysis, methodology, software, supervision, validation, and writing—review and editing. AI: conceptualization, resources, software, validation, and writing—review and editing. JL: conceptualization, formal analysis, methodology, project administration, software, supervision, validation, and writing—review and editing. PB: conceptualization, data curation, formal analysis, funding acquisition, investigation, methodology, project administration, resources, software, supervision, validation, visualization, and writing—review and editing. All authors contributed to the article and approved the submitted version.
Funding
This study was supported by the Agencia Nacional de Promoción Científica y Tecnológica (Argentina)—Préstamo BID PICT (#2018-03614 and Cat 1 #83 to PB and #2020-1557 to FL) and the Secretaría de Ciencia y Tecnología, Universidad Nacional de Córdoba (Proyecto Estimular to FL). JL was supported by the Spanish MCIN/ AEI/10.13039/501100011033/, through grant number PID2020-114790GB-I00 and by a research project grant from the Junta de Andalucía (PY20_00693). In addition, FL received post-doctoral scholarship support and MA received Ph.D. scholarship support from the Consejo Nacional de Investigaciones Científicas y Técnicas (CONICET), Argentina. AI is partially supported by grants from CONICET; ANID/FONDECYT Regular (1210195, 1210176, and 1220995); ANID/FONDAP/15150012; ANID/PIA/ANILLOS ACT210096; FONDEF ID20I10152, ID22I10029; ANID/FONDAP 15150012; Takeda CW2680521 and the Multi-Partner Consortium to expand dementia research in Latin America [ReDLat, supported by National Institutes of Health, National Institutes of Aging (R01 AG057234), Alzheimer's Association (SG-20-725707), Rainwater Charitable foundation—Tau Consortium, and Global Brain Health Institute].
Acknowledgments
This project was possible thanks to the James McDonnell Foundation grant (Understanding Human Cognition) to Mariano Sigman.
Conflict of interest
The authors declare that the research was conducted in the absence of any commercial or financial relationships that could be construed as a potential conflict of interest.
Publisher's note
All claims expressed in this article are solely those of the authors and do not necessarily represent those of their affiliated organizations, or those of the publisher, the editors and the reviewers. Any product that may be evaluated in this article, or claim that may be made by its manufacturer, is not guaranteed or endorsed by the publisher.
Author disclaimer
The contents of this publication are solely the responsibility of the authors and do not represent the official views of the institutions listed in Funding section.
Abbreviations
EV, executive vigilance; AV, arousal vigilance.
References
Arnau, S., Löffler, C., Rummel, J., Hagemann, D., Wascher, E., Schubert, A. (2020). Inter-trial alpha power indicates mind wandering. Psychophysiology 57, 1–14. doi: 10.1111/psyp.13581
Bache, S. M., Wickham, H. (2020). magrittr: A Forward-Pipe Operator for R. Available online at: https://cran.r-project.org/package=magrittr
Baker, D. H., Vilidaite, G., Lygo, F. A., Smith, A. K., Flack, T. R., Gouws, A. D., et al. (2021). Power contours: optimising sample size and precision in experimental psychology and human neuroscience. Psychol. Methods 26, 295–314. doi: 10.1037/met0000337
Basner, M., Dinges, D. F. (2011). Maximizing sensitivity of the psychomotor vigilance test (PVT) to sleep loss. Sleep 34, 581–591. doi: 10.1093/sleep/34.5.581
Basner, M., Rubinstein, J., Fomberstein, K. M., Coble, M. C., Ecker, A., Avinash, D., et al. (2008). Effects of night work, sleep loss and time on task on simulated threat detection performance. Sleep 31, 1251–1259. doi: 10.5665/sleep/31.9.1251
Benwell, C. S. Y., London, R. E., Tagliabue, C. F., Veniero, D., Gross, J., Keitel, C., et al. (2019). Frequency and power of human alpha oscillations drift systematically with time-on-task. NeuroImage 192, 101–114. doi: 10.1016/j.neuroimage.2019.02.067
Boksem, M. A. S., Meijman, T. F., Lorist, M. M. (2005). Effects of mental fatigue on attention: an ERP study. Cogn. Brain Res. 25, 107–116. doi: 10.1016/j.cogbrainres.2005.04.011
Braboszcz, C., Delorme, A. (2011). Lost in thoughts: neural markers of low alertness during mind wandering. NeuroImage 54, 3040–3047. doi: 10.1016/j.neuroimage.2010.10.008
Callejas, A., Lupiáñez, J., Tudela, P. (2004). The three attentional networks: on their independence and interactions. Brain Cogn. 54, 225–227. doi: 10.1016/j.bandc.2004.02.012
Chua, E. C.-P., Tan, W.-Q., Yeo, S.-C., Lau, P., Lee, I., Mien, I. H., et al. (2012). Heart rate variability can be used to estimate sleepiness-related decrements in psychomotor vigilance during total sleep deprivation. Sleep 35, 325–334. doi: 10.5665/sleep.1688
Clayton, M. S., Yeung, N., Cohen Kadosh, R. (2015). The roles of cortical oscillations in sustained attention. Trends Cogn. Sci. 19, 188–195. doi: 10.1016/j.tics.2015.02.004
Clayton, M. S., Yeung, N., Cohen Kadosh, R. (2018). The many characters of visual alpha oscillations. Eur. J. Neurosci. 48, 2498–2508. doi: 10.1111/ejn.13747
Clayton, M. S., Yeung, N., Cohen Kadosh, R. (2019). Electrical stimulation of alpha oscillations stabilizes performance on visual attention tasks. J. Exp. Psychol. Gen. 148, 203–220. doi: 10.1037/xge0000502
Coelli, S., Barbieri, R., Reni, G., Zucca, C., Bianchi, A. M. (2018). EEG indices correlate with sustained attention performance in patients affected by diffuse axonal injury. Med. Biol. Eng. Comput. 56, 991–1001. doi: 10.1007/s11517-017-1744-5
Cohen, M. X. (2014). Analyzing Neural Time Series Data: Theory and Practice. Cambridge: MIT Press. doi: 10.7551/mitpress/9609.001.0001
Cumming, G. (2014). The new statistics: why and how. Psychol. Sci. 25, 7–29. doi: 10.1177/0956797613504966
Delorme, A., Makeig, S. (2004). EEGLAB: an open source toolbox for analysis of single-trial EEG dynamics including independent component analysis. J. Neurosci. Methods 134, 9–21. doi: 10.1016/j.jneumeth.2003.10.009
Dockree, P. M., Kelly, S. P., Roche, R. A. P., Hogan, M. J., Reilly, R. B., Robertson, I. H. (2004). Behavioural and physiological impairments of sustained attention after traumatic brain injury. Cogn. Brain Res. 20, 403–414. doi: 10.1016/j.cogbrainres.2004.03.019
Drummond, S. P., Bischoff-Grethe, A., Dinges, D. F., Ayalon, L., Mednick, S. C., Meloy, M. J. (2005). The neural basis of the psychomotor vigilance task. Sleep 28, 1059–1068. doi: 10.1093/sleep/28.9.1059
Epling, S. L., Russell, P. N., Helton, W. S. (2016). A new semantic vigilance task: vigilance decrement, workload, and sensitivity to dual-task costs. Exp. Brain Res. 234, 133–139. doi: 10.1007/s00221-015-4444-0
Esterman, M., Noonan, S. K., Rosenberg, M., Degutis, J. (2013). In the zone or zoning out? Tracking behavioral and neural fluctuations during sustained attention. Cereb. Cortex 23, 2712–2723. doi: 10.1093/cercor/bhs261
Esterman, M., Rothlein, D. (2019). Models of sustained attention. Curr. Opin. Psychol. 29, 174–180. doi: 10.1016/j.copsyc.2019.03.005
Faul, F., Erdfelder, E., Lang, A.-G., Buchner, A. (2007). G*Power 3: a flexible statistical power analysis program for the social, behavioral, and biomedical sciences. Behav. Res. Methods 39, 175–191. doi: 10.3758/BF03193146
Feltmate, B. B. T., Hurst, A. J., Klein, R. M. (2020). Effects of fatigue on attention and vigilance as measured with a modified attention network test. Exp. Brain Res. 238, 2507–2519. doi: 10.1007/s00221-020-05902-y
Gorgoni, M., Ferlazzo, F., Ferrara, M., Moroni, F., D'Atri, A., Fanelli, S., et al. (2014). Topographic electroencephalogram changes associated with psychomotor vigilance task performance after sleep deprivation. Sleep Med. 15, 1132–1139. doi: 10.1016/j.sleep.2014.04.022
Gramfort, A., Luessi, M., Larson, E., Engemann, D. A., Strohmeier, D., Brodbeck, C., et al. (2013). MEG and EEG data analysis with MNE-Python. Front. Neurosci. 7:267. doi: 10.3389/fnins.2013.00267
Groot, J. M., Boayue, N. M., Csifcsák, G., Boekel, W., Huster, R., Forstmann, B. U., et al. (2021). Probing the neural signature of mind wandering with simultaneous fMRI-EEG and pupillometry. NeuroImage 224:117412. doi: 10.1016/j.neuroimage.2020.117412
Hancock, P. A. (2017). On the nature of vigilance. Hum. Factors 59, 35–43. doi: 10.1177/0018720816655240
Hao, C., Li, M., Ning, Q., Ma, N. (2022). One night of 10-h sleep restores vigilance after total sleep deprivation: the role of delta and theta power during recovery sleep. Sleep Biol. Rhythms. doi: 10.1007/s41105-022-00428-y Available online at: https://link.springer.com/article/10.1007/s41105-022-00428-y
Hemmerich, K., Lupiáñez, J., Luna, F. G., Martín-Arévalo, E. (2023). The mitigation of the executive vigilance decrement via HD-tDCS over the right posterior parietal cortex and its association with neural oscillations. Cereb. Cortex 2023:bhac540. doi: 10.1093/cercor/bhac540
Henry, L., Wickham, H. (2020). purrr: Functional Programming Tools. Available online at: https://cran.r-project.org/package=purrr
Hoedlmoser, K., Griessenberger, H., Fellinger, R., Freunberger, R., Klimesch, W., Gruber, W., et al. (2011). Event-related activity and phase locking during a psychomotor vigilance task over the course of sleep deprivation. J. Sleep Res. 20, 377–385. doi: 10.1111/j.1365-2869.2010.00892.x
Hope, R. M. (2013). Rmisc: Ryan Miscellaneous. Available online at: https://cran.r-project.org/package=Rmisc
Hunter, J. D. (2007). Matplotlib: a 2D graphics enviroment. Comput. Sci. Eng. 9, 90–95. doi: 10.1109/MCSE.2007.55
Ishigami, Y., Klein, R. M. (2010). Repeated measurement of the components of attention using two versions of the Attention Network Test (ANT): stability, isolability, robustness, and reliability. J. Neurosci. Methods 190, 117–128. doi: 10.1016/j.jneumeth.2010.04.019
Kamzanova, A. T., Kustubayeva, A. M., Matthews, G. (2014). Use of EEG workload indices for diagnostic monitoring of vigilance decrement. Hum. Factors J. Hum. Factors Ergon. Soc. 56, 1136–1149. doi: 10.1177/0018720814526617
Karamacoska, D., Barry, R. J., De Blasio, F. M., Steiner, G. Z. (2019). EEG-ERP dynamics in a visual continuous performance test. Int. J. Psychophysiol. 146, 249–260. doi: 10.1016/j.ijpsycho.2019.08.013
Kelley, K., Preacher, K. J. (2012). On effect size. Psychol. Methods 17, 137–152. doi: 10.1037/a0028086
Kim, J.-H., Kim, D.-W., Im, C.-H. (2017). Brain areas responsible for vigilance: an EEG Source imaging study. Brain Topogr. 30, 343–351. doi: 10.1007/s10548-016-0540-0
Langner, R., Steinborn, M. B., Chatterjee, A., Sturm, W., Willmes, K. (2010). Mental fatigue and temporal preparation in simple reaction-time performance. Acta Psychol. 133, 64–72. doi: 10.1016/j.actpsy.2009.10.001
Lenth, R. (2021). emmeans: Estimated Marginal Means, aka Least-Squares Means. Available online at: https://cran.r-project.org/package=emmeans.
Lim, J., Dinges, D. F. (2008). Sleep deprivation and vigilant attention. Ann. N.Y. Acad. Sci. 1129, 305–322. doi: 10.1196/annals.1417.002
Luna, F. G., Aguirre, M. J., Martín-Arévalo, E., Ibáñez, A., Lupiáñez, J., Barttfeld, P. (2023). Events-related potentials associated with attentional networks evidence changes in executive and arousal vigilance. Psychophysiology. e14272. doi: 10.1111/psyp.14272
Luna, F. G., Barttfeld, P., Martín-Arévalo, E., Lupiáñez, J. (2021a). The ANTI-Vea task: analyzing the executive and arousal vigilance decrements while measuring the three attentional networks. Psicológica 42, 1–26. doi: 10.2478/psicolj-2021-0001
Luna, F. G., Barttfeld, P., Martín-Arévalo, E., Lupiáñez, J. (2022a). Cognitive load mitigates the executive but not the arousal vigilance decrement. Conscious. Cogn. 98:103263. doi: 10.1016/j.concog.2021.103263
Luna, F. G., Marino, J., Roca, J., Lupiáñez, J. (2018). Executive and arousal vigilance decrement in the context of the attentional networks: the ANTI-Vea task. J. Neurosci. Methods 306, 77–87. doi: 10.1016/j.jneumeth.2018.05.011
Luna, F. G., Roca, J., Martín-Arévalo, E., Lupiáñez, J. (2021b). Measuring attention and vigilance in the laboratory vs. online: the split-half reliability of the ANTI-Vea. Behav. Res. Methods 53, 1124–1147. doi: 10.3758/s13428-020-01483-4
Luna, F. G., Román-Caballero, R., Barttfeld, P., Lupiáñez, J., Martín-Arévalo, E. (2020). A High-Definition tDCS and EEG study on attention and vigilance: brain stimulation mitigates the executive but not the arousal vigilance decrement. Neuropsychologia 142:107447. doi: 10.1016/j.neuropsychologia.2020.107447
Luna, F. G., Tortajada, M., Martín-Arévalo, E., Botta, F., Lupiáñez, J. (2022b). A vigilance decrement comes along with an executive control decrement: testing the resource-control theory. Psychon. Bull. Rev. 29, 1831–1843. doi: 10.3758/s13423-022-02089-x
Mackworth, N. H. (1948). The breakdown of vigilance during prolonged visual search. Q. J. Exp. Psychol. 1, 6–21. doi: 10.1080/17470214808416738
MacLeod, J. W., Lawrence, M. A., McConnell, M. M., Eskes, G. A., Klein, R. M., Shore, D. I. (2010). Appraising the ANT: psychometric and theoretical considerations of the Attention Network Test. Neuropsychology 24, 637–651. doi: 10.1037/a0019803
McIntire, L. K., McKinley, R. A., Goodyear, C., Nelson, J. (2014). A comparison of the effects of transcranial direct current stimulation and caffeine on vigilance and cognitive performance during extended wakefulness. Brain Stimul. 7, 499–507. doi: 10.1016/j.brs.2014.04.008
Mognon, A., Jovicich, J., Bruzzone, L., Buiatti, M. (2011). ADJUST: an automatic EEG artifact detector based on the joint use of spatial and temporal features. Psychophysiology 48, 229–240. doi: 10.1111/j.1469-8986.2010.01061.x
Molina, E., Sanabria, D., Jung, T. P., Correa, Á. (2019). Electroencephalographic and peripheral temperature dynamics during a prolonged psychomotor vigilance task. Accid. Anal. Prev. 126, 198–208. doi: 10.1016/j.aap.2017.10.014
Morey, R. D. (2008). Confidence intervals from normalized data: a correction to cousineau (2005). Tutor. Quant. Methods Psychol. 4, 61–64. doi: 10.20982/tqmp.04.2.p061
Neigel, A. R., Claypoole, V. L., Smith, S. L., Waldfogle, G. E., Fraulini, N. W., Hancock, G. M., et al. (2020). Engaging the human operator: a review of the theoretical support for the vigilance decrement and a discussion of practical applications. Theor. Issues Ergon. Sci. 21, 239–258. doi: 10.1080/1463922X.2019.1682712
Oken, B. S., Salinsky, M. C., Elsas, S. M. (2006). Vigilance, alertness, or sustained attention: physiological basis and measurement. Clin. Neurophysiol. 117, 1885–1901. doi: 10.1016/j.clinph.2006.01.017
Pershin, I., Candrian, G., Münger, M., Baschera, G.-M., Rostami, M., Eich, D., et al. (2023). Vigilance described by the time-on-task effect in EEG activity during a cued Go/NoGo task. Int. J. Psychophysiol. 183, 92–102. doi: 10.1016/j.ijpsycho.2022.11.015
Psychology Software Tools, Inc. (2012). [E-Prime 2.0]. Available online at: http://www.pstnet.com
R Core Team (2021). R: A Language and Environment for Statistical Computing. Available online at: https://www.r-project.org
Ramautar, J. R., Romeijn, N., Gómez-Herrero, G., Piantoni, G., Van Someren, E. J. W. (2013). Coupling of infraslow fluctuations in autonomic and central vigilance markers: skin temperature, EEG beta power and ERP P300 latency. Int. J. Psychophysiol. 89, 158–164. doi: 10.1016/j.ijpsycho.2013.01.001
Reteig, L. C., van den Brink, R. L., Prinssen, S., Cohen, M. X., Slagter, H. A. (2019). Sustaining attention for a prolonged period of time increases temporal variability in cortical responses. Cortex 117, 16–32. doi: 10.1016/j.cortex.2019.02.016
Robertson, I. H., Manly, T., Andrade, J., Baddeley, B. T., Yiend, J. (1997). “Oops!”: Performance correlates of everyday attentional failures in traumatic brain injured and normal subjects. Neuropsychologia 35, 747–758. doi: 10.1016/S0028-3932(97)00015-8
RStudio Team (2022). RStudio: Integrated Development Environment for R. Available online at: http://www.rstudio.com/
Sadaghiani, S., Scheeringa, R., Lehongre, K., Morillon, B., Giraud, A.-L., Kleinschmidt, A. (2010). Intrinsic connectivity networks, alpha oscillations, and tonic alertness: a simultaneous electroencephalography/functional magnetic resonance imaging study. J. Neurosci. 30, 10243–10250. doi: 10.1523/JNEUROSCI.1004-10.2010
Sanchis, C., Blasco, E., Luna, F. G., Lupiáñez, J. (2020). Effects of caffeine intake and exercise intensity on executive and arousal vigilance. Sci. Rep. 10:8393. doi: 10.1038/s41598-020-65197-5
Sarter, M., Givens, B., Bruno, J. P. (2001). The cognitive neuroscience of sustained attention: where top-down meets bottom-up. Brain Res. Rev. 35, 146–160. doi: 10.1016/S0165-0173(01)00044-3
Schumann, F., Steinborn, M. B., Kürten, J., Cao, L., Händel, B. F., Huestegge, L. (2022). Restoration of attention by rest in a multitasking world: theory, methodology, and empirical evidence. Front. Psychol. 13:867978. doi: 10.3389/fpsyg.2022.867978
Singmann, H., Bolker, B., Westfall, J., Aust, F., Ben-Shachar, M. S. (2021). afex: Analysis of Factorial Experiments. Available online at: https://cran.r-project.org/package=afex
Stearman, E. J., Durso, F. T. (2016). Vigilance in a dynamic environment. J. Exp. Psychol. Appl. 22, 107–123. doi: 10.1037/xap0000075
Steinborn, M. B., Langner, R. (2012). Arousal modulates temporal preparation under increased time uncertainty: evidence from higher-order sequential foreperiod effects. Acta Psychol. 139, 65–76. doi: 10.1016/j.actpsy.2011.10.010
Sturm, W., Willmes, K. (2001). On the functional neuroanatomy of intrinsic and phasic alertness. NeuroImage 14, S76–S84. doi: 10.1006/nimg.2001.0839
Thomson, D. R., Besner, D., Smilek, D. (2015). A resource-control account of sustained attention: evidence from mind-wandering and vigilance paradigms. Perspect. Psychol. Sci. 10, 82–96. doi: 10.1177/1745691614556681
Thomson, D. R., Besner, D., Smilek, D. (2016). A critical examination of the evidence for sensitivity loss in modern vigilance tasks. Psychol. Rev. 123, 70–83. doi: 10.1037/rev0000021
van Schie, M. K. M., Lammers, G. J., Fronczek, R., Middelkoop, H. A. M., Gert van Dijk, J. (2021). Vigilance: discussion of related concepts and proposal for a definition. Sleep Med. 83:175–181. doi: 10.1016/j.sleep.2021.04.038
Warm, J. S., Parasuraman, R., Matthews, G. (2008). Vigilance requires hard mental work and is stressful. Hum. Factors 50, 433–441. doi: 10.1518/001872008X312152
Wickham, H. (2016). ggplot2: Elegant Graphics for Data Analysis. New York, NY: Springer-Verlag. doi: 10.1007/978-3-319-24277-4
Keywords: frequency power, vigilance, attention, EEG, failures
Citation: Luna FG, Aguirre MJ, Martín-Arévalo E, Ibáñez A, Lupiáñez J and Barttfeld P (2023) Different oscillatory rhythms anticipate failures in executive and arousal vigilance. Front. Cognit. 2:1128442. doi: 10.3389/fcogn.2023.1128442
Received: 20 December 2022; Accepted: 22 February 2023;
Published: 13 March 2023.
Edited by:
Stefano Lasaponara, Sapienza University of Rome, ItalyReviewed by:
Michael B. Steinborn, Julius Maximilian University of Würzburg, GermanyFabio Marson, Sapienza University of Rome, Italy
Copyright © 2023 Luna, Aguirre, Martín-Arévalo, Ibáñez, Lupiáñez and Barttfeld. This is an open-access article distributed under the terms of the Creative Commons Attribution License (CC BY). The use, distribution or reproduction in other forums is permitted, provided the original author(s) and the copyright owner(s) are credited and that the original publication in this journal is cited, in accordance with accepted academic practice. No use, distribution or reproduction is permitted which does not comply with these terms.
*Correspondence: Fernando G. Luna, Zmx1bmFAdW5jLmVkdS5hcg==