 Rob H. J. Van der Lubbe
 Bartłomiej Panek2,3
 Dariusz Asanowicz
- 1Faculty of Behavior, Management, and Social Sciences, University of Twente, Enschede, Netherlands
- 2Faculty of Physics, Adam Mickiewicz University, Poznań, Poland
- 3Institute of Psychology, Jagiellonian University, Kraków, Poland
Introduction: External spatial attention refers to the selection of currently present information at a specific external location, whereas internal spatial attention refers to the selection of stored information in short-term memory initially presented at a specific location. Electroencephalographic (EEG) and magnetoencephalographic (MEG) studies revealed that these two types of selection may involve the same underlying neural mechanism as in both cases a reduction in posterior alpha power was observed. However, the posterior alpha rhythm may consist of different components, which can even be related to opposite behavioral effects. Furthermore, the employed paradigms to study both selection processes are often quite different, which makes a proper comparison cumbersome.
Methods: In the current EEG experiment, two-stimulus displays were preceded or followed by non-spatial pre-cues and post-cues that specified the target, thereby minimizing procedural differences.
Results: Results of time-frequency analyses revealed that in both cue conditions the selection of relevant information was associated with an increase of ipsilateral vs. contralateral posterior alpha power. An opposite effect, an increase in contralateral vs. ipsilateral posterior power was observed in the theta-band, but only in the pre-cue condition. This activity was related to stimulus onset and likely reflects target selection. To assess attention-related connectivity, we separated posterior alpha power in a medial-parietal and two parieto-occipital sources and computed alpha phase coherence between these sources. Results revealed that in both cue conditions, increased ipsilateral vs. contralateral connectivity in the alpha band was present between the medial-parietal and parieto-occipital sources.
Discussion: The results seem to reflect a modulation from parietal to occipital areas, providing support for the view that internal and external spatial attention share a common neural mechanism.
1. Introduction
A common observation when people try to recall a visual scene from memory is that they move their eyes upwards or even close them. This behavior may be interpreted as an attempt to reduce interference from the outside world, thereby facilitating the retrieval from memory. Recent studies employing electroencephalography (EEG) or magneto-encephalography (MEG) suggest that the alpha rhythm (~8–14 Hz) reflects a related brain mechanism that suppresses neural activity that otherwise might disrupt ongoing processing and appropriate behavior (e.g., see Klimesch et al., 2007; Jensen and Mazaheri, 2010; Foxe and Snyder, 2011; Benedek et al., 2014). Several studies in the last decade (e.g., Van der Lubbe et al., 2014; Poch et al., 2017; Cona et al., 2020; for a review see Frey et al., 2015) revealed that focal changes in alpha power (and/or phase) are present not only when selecting visual information from a location in the outside world—i.e., external spatial attention, but also when retrieving information from visuospatial memory—i.e., internal spatial attention. There is quite some discussion on whether these changes are comparable, as they are often demonstrated within different experimental paradigms (e.g., see Kizilirmak et al., 2022). Furthermore, recent studies suggest that observed effects in the alpha band actually have different generators in occipital and parietal cortex that may fulfill different functional roles (e.g., see Sokoliuk et al., 2019; Rodriguez-Larios et al., 2022; Zhigalov and Jensen, 2022). This makes a comparison of results even harder. Apart from the alpha band, some studies indicated that in the case of external spatial attention an additional focal effect may be present in the theta band (~4–8 Hz; e.g., see Van der Lubbe et al., 2014), which was interpreted as signal enhancement (Harris et al., 2017) or encoding of the relevant information (Hanslmayr et al., 2009). The question may be raised whether this potential effect in the theta band is present in both external and internal spatial attention conditions.
In the current EEG study, a previously employed paradigm of Van der Lubbe et al. (2014) was modified to minimize the differences between conditions related to external and internal spatial attention. Furthermore, by using the generalized eigenvalue decomposition (GED) technique (e.g., see de Cheveigné and Arzounian, 2015), we separated occipital and parietal sources of alpha activity, and examined whether connectivity between these sources during spatial orienting of external and internal attention is comparable.
The terms external and internal attention were introduced by Chun et al. (2011), and since then have been used in several influential papers (e.g., see Kiyonaga and Egner, 2013; Van Ede and Nobre, 2021). External attention refers to the selection and modulation of sensory information, while internal attention relates to the selection, modulation, and maintenance of internally generated information (Chun et al., 2011). Van der Lubbe et al. (2014) decided to use the terms external and internal “spatial” attention to zoom in on the process of selection of information at a location either present at that specific moment, or selection of earlier presented information at a specific location (i.e., retrieval from visuospatial memory).
Inspired by the studies of Griffin and Nobre (2003), Nobre et al. (2004), and Kuo et al. (2009), Van der Lubbe et al. adapted a paradigm introduced by Hommel (2002) that enables to contrast external and internal spatial attention in highly similar conditions, and study focal changes in EEG alpha power over time. Visual search or memory search displays were used containing four stimuli, two squares and two circles, all presented in different colors. Each stimulus was presented in one quadrant of a centrally positioned frame. In the pre-cue condition, the color of the frame indicated 1 s before the search display which stimulus, the one with the same color, was the target. The target required a left or right response depending on the shape (circle or square) of the stimulus. In the post-cue condition, the stimulus display was presented first, then masked for 33 ms (to avoid sensory after effects), and finally, after another 967 ms the color of the frame indicated which of the previously presented stimuli was the target. The study also included a simultaneous cue condition, wherein the colored frame was presented together with the four-stimulus display. Focal changes in alpha, beta, and theta power over time were assessed by computing lateralized power spectra (LPS; see Van der Lubbe and Utzerath, 2013), which are ipsilateral vs. contralateral power indices in specific frequency bands. An advantage of using the LPS index is that overall hemispherical differences in power unrelated to the location of the stimulus are subtracted out (see Section 2). Van der Lubbe et al. (2014) observed an increase in alpha power at ipsilateral vs. contralateral sites relative to the relevant stimulus location above posterior brain areas both in the pre-cue, the simultaneous cue, and the post-cue conditions (see also Poch et al., 2017). Furthermore, they observed that the Simon or spatial correspondence effect (i.e., the tendency to react toward the side of the task-irrelevant spatial location of a stimulus; Simon, 1969, 1990; Van der Lubbe et al., 2012), was present in all conditions, even when the stimulus was retrieved from memory. Finally, increased contralateral vs. ipsilateral power was observed in the theta band in all cue conditions. The LPS and behavioral findings led them to conclude that internal and external spatial attention may share their underlying mechanism.
In a recent study, Willems (2020) tried to replicate and extend these results with the same set of stimuli and responses. However, no convincing lateralized changes in alpha power were observed in two post-cue conditions, one with the same time interval as Van der Lubbe et al. (2014), and another condition with a longer time interval of 3,000 ms. Evaluation of post-experimental interviews revealed that several participants in the post-cue conditions adopted a strategy that no longer required retrieval from visuospatial memory. Instead, after being presented with the stimulus displays, they simply memorized that circles (or squares) had color C1 (e.g., green) and C2 (e.g., red), and upon presentation of the frame they selected the proper response (e.g., left) when the frame had color C1/C2, and if it had a different color they selected the alternative response (e.g., right). This strategy no longer requires any retrieval from visuospatial memory and may be responsible for the absence of clear lateralized changes in alpha power in the two post-cue conditions. The motivation to develop this strategy could have been induced by the use of the condition with a longer time interval between display onset and the post-cue, which might make retrieval from visuospatial memory more difficult. Based on these observations, several modifications in the employed paradigm were implemented in the current study that should reduce the likelihood of using this alternative strategy (see below).
In their review, Frey et al. (2015) suggested that the same oscillatory processes support different types of attention such as spatial attention, which is often examined with the Posner paradigm, and internal attention, which is often examined with a delayed match-to-sample task or a Sternberg task. However, different paradigms may imply different processing demands (see Kizilirmak et al., 2022), and results of recent studies indicate that oscillations in the alpha band may actually reflect different functions. In their EEG study, Sokoliuk et al. (2019) distinguished between a source in visual cortex and another source in parietal cortex that showed different sensitivities to experimental manipulations. They used unimodal (i.e., only visual or somatosensory stimuli) and multimodal (both visual and somatosensory stimuli) tasks. The occipital source showed a decrease in power when more attention had to be directed to visual stimuli, while the parietal source appeared more sensitive to the overall amount of attention required, as the power decrease was largest when attention had to be divided across modalities or locations. These observations suggest that it may be crucial to disentangle these different generators of alpha activity (see also Zhigalov and Jensen, 2020, 2022).
Rodriguez-Larios et al. (2022) measured MEG while participants performed a visual working memory task. Participants had to remember a first directional cue that pointed either to the upper-left, upper-right, down-left, or down-right corner. After a delay interval they had to indicate, depending on a second stay or switch cue, either the same or the opposite direction of the first cue. In one condition, distracting directional cues were presented during the delay interval, while in another condition, no distractors were presented. The use of independent component analyses (ICA) at a single-subject level revealed the existence of two dissociable alpha components during the delay interval relative to a fixation period, referred to as Alpha 1 and Alpha 2. Alpha 1 increased during the delay interval and became larger when distractors occurred during this interval. Alpha 1 power was also positively related with accuracy. Alpha 2, however, showed a decrease during the delay interval, it decreased when distractors occurred, and it showed a negative relation with accuracy. Alpha 1 was argued to be related to the effective inhibition of distractors, while Alpha 2 was suggested to be more related to overall lapses of attention or mind wandering. Although these different patterns were observed during the retention interval, and therefore do not tell much about memory retrieval,1 these findings underline the view that effects on the posterior alpha rhythm may reflect the contribution of rather different underlying neurophysiological processes that may even have opposite effects on behavior.
In the present study, we separated posterior alpha activity, now in both an external and an internal spatial attention task, by using the GED technique (de Cheveigné and Arzounian, 2015). Separate GED analyses were performed to obtain spatial filters for a priori specified medial-parietal, and lateral-occipital sources of alpha activity, in line with the findings of Sokoliuk et al. (2019). After separating these activities, we estimated the communication between these areas by computing the inter-site (here source) phase coherence (ISPC; Lachaux et al., 1999), which can be considered as a new and critical test for assessing the similarities between external and internal spatial attention. Additionally, in line with the study of Van der Lubbe et al. (2014), we determined the LPS index and expected to observe increased ipsilateral vs. contralateral power in the posterior alpha band both in the external and the internal spatial attention conditions. Effects in the posterior theta band were additionally explored, as a contralateral increase in theta power has been observed in the case of both external and internal spatial attention (Harris et al., 2017; see also Van der Lubbe et al., 2014). Furthermore, we expected to replicate the previously observed Simon effect in both conditions.
To avoid the use of alternative strategies in the internal spatial attention task as indicated above, and to reduce the tendency to make eye movements, we made some adaptations to the tasks used by Van der Lubbe et al. (2014). First, we extended the type of possible stimuli from two to four, and also increased the number of response options from two to four. This should reduce the likelihood of the aforementioned alternative strategy, as the simple rule of relating two colors to a single response will no longer work. At the same time, we also minimized the load on visuospatial memory by reducing the number of stimuli on a trial from four to two. This should make the maintenance and subsequent retrieval from visuospatial memory easier. We employed a long time-interval of 2,000 ms between offset of the stimulus array and onset of the post-cue to ensure that the observed effect is not due to residual activity in a sensory buffer. Finally, instead of using a large frame as pre- or post-cue, which might promote lateral eye movements, the cue was simply a change in color of the surrounding of the fixation cross. This may be an additional incentive for participants to keep their eyes at fixation.
2. Methods
2.1. Participants
Twenty-seven healthy volunteers (21 females) participated in the experiment, mostly in return for course credits. Their mean age was 22.8 years (SD 7.4) and they were all right-handed, which was assessed with Annett (1970)'s handedness questionnaire. Most of the participants were students at the University of Twente, but two participants were recruited using convenience sampling and participated on a voluntarily basis. Due to the COVID-19 pandemic, the Dutch government implemented strict measures to minimize the risk of spreading the virus. When entering the lab, participants were asked to disinfect their hands and they received FFP2 face masks. During the preparation for the experiment, both the participants and the researchers were wearing FFP2 masks. However, during the experiment, participants were allowed to take off their masks. The participants and researchers kept their distance whenever possible and windows in the lab were regularly opened, allowing the air to circulate. Participants were explicitly asked not to take part if they were experiencing any COVID-19 symptoms or if they had been in close contact with someone who was infected. All participants had normal or corrected-to-normal vision, which was checked with the Freiburg Vision Test (Version 3.10.5), and they all showed normal color vision, which was examined with the Ishihara test. None of the participants reported a history of neurological or psychiatric disorders. Informed written consent was obtained from each participant before the start of the experiment, in accordance with the Declaration of Helsinki. The study was approved by the Ethics Committee of the Faculty of Behavioral, Management, and Social Sciences at the University of Twente (request number 210676).
Due to error rates exceeding two standard deviations above the sample mean, data of one participant was excluded from the pre-cue and post-cue datasets, and data of another participant was excluded from the pre-cue dataset. Thus, the pre-cue dataset included 25 subjects, and the post-cue dataset −26 subjects.
2.2. Task, stimuli, and procedure
The stimuli and examples of trials for the pre-cue and post-cue conditions are shown in Figure 1. The task is a modified version of the cued spatial selection task employed by Van der Lubbe et al. (2014). Each trial of the task began with a fixation cross displayed at the center of the computer screen, together with an auditory warning stimulus. We used a fixation stimulus recommended by Thaler et al. (2013) as this stimulus is most effective in maintaining central fixation. The height and width of the fixation stimulus were set at 6 mm (0.46°). On every trial, two geometrical shapes were displayed simultaneously on the computer screen, one on the left and other on the symmetrical right side of the fixation cross (at 3.8°). The left and right shapes always differed in two dimensions: shape and color. The stimulus was either a circle, a diamond, a star, or a triangle, displayed in either blue, green, red, or purple (RGB: 43,87,154; 36,126,77; 191,65,35; and 141,63,135, respectively). The stimuli were presented on a light gray background (RGB: 127, 127, 127). The shapes were each 8 mm (0.6°) high and wide. The shapes, colors, shape and color locations, and target visual field were all counterbalanced. The trial order was randomized per participant. The participant's task was to give a response depending on the shape in the color indicated by the central visual cue. Thus, the cue signaled which of the two shapes was the target stimulus on a given trial. The cue was a small circle—either blue, green, red, or purple—referring to the target color, and was displayed behind the fixation cross. The height and width of the cue were 6 mm (0.46°).
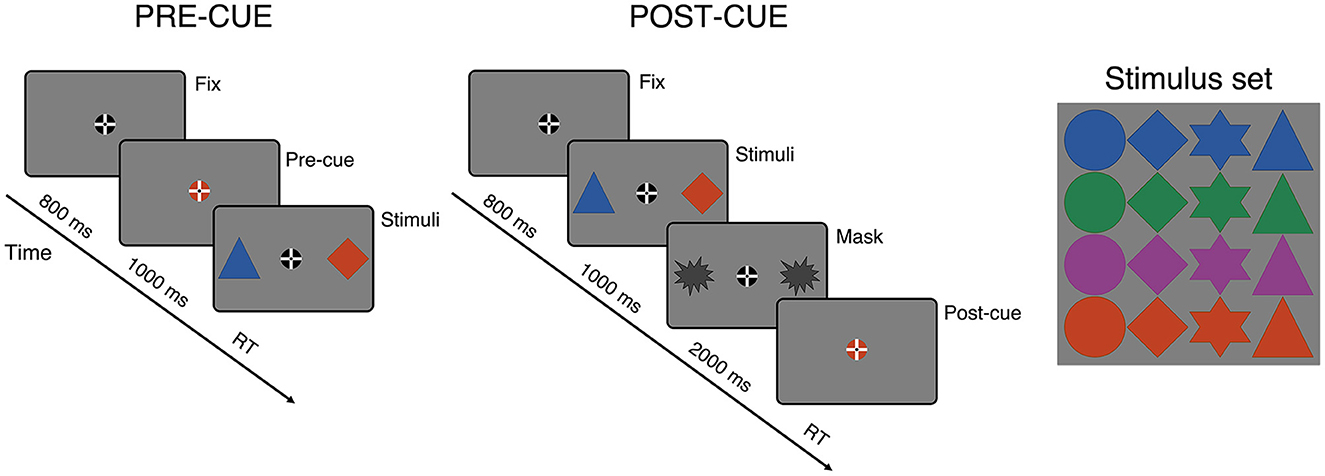
Figure 1. The task stimuli and examples of trials from the two main conditions of the experiment. Participants' task was to respond to the shape displayed in the color indicated by a central color cue. The color cue could appear either before or after target onset, which constituted the pre-cue and post-cue conditions, respectively. In the pre-cue condition, the color cue was presented 1,000 ms before the two-stimulus displays. In the post-cue condition, the order of the cue and the stimulus display was reversed, thus, the relevant information had to be selected from visuospatial memory. The post-cue was presented 3,000 ms after onset of the stimulus display.
The color cue appeared either before or after target onset, which constituted the two main task conditions: the pre-cue and the post-cue conditions. In the pre-cue condition, the color cue was presented 1,000 ms before the two shapes, and was present until target onset. In this condition, the shapes were displayed until a response was made. In the post-cue condition, the order of the cue and shapes was flipped, which implies that the target had to be retrieved from visual short-term memory. The exact stimulus sequence in the post-cue condition was as follows: after an initial fixation period of 800 ms, the two shapes were displayed for 1,000 ms, then they were both masked, and after 2,000 ms the color cue appeared and remained present until a response was made. In both cue conditions, the inter-trial time varied randomly between 700, 1,000, and 1,300 ms.
Participants were instructed to base their responses on the shapes indicated by the color cues. A standard QWERTY keyboard was used to gather the responses. They had to press the “A” key with the left middle finger, the “Z” key with the left index finger, the “/” key with the right index finger, and the “ ‘ ” key with the right middle finger. Half of the participants responded with the left hand to circles (“A”) and diamonds (“Z”), and the right hand to stars (“ ‘ ”) and triangles (“/”). The other half of the participants were assigned the opposite hand mapping. Both reaction times and response accuracy were determined. A new trial started automatically after the response, or after 3,000 ms if the participant did not respond.
The pre-cue and post-cue conditions were administrated in one session, and were separated by a break. The order of these conditions was counterbalanced between participants. At the start of each condition, participants received written, and subsequently verbal instructions describing the task. They were asked to respond as quickly, but especially as accurately as possible. They were also instructed to keep central fixation and were explained why proper fixation was necessary during the EEG measurements. Participants were seated in an armchair in a dimly lit room at a distance of ~75 cm in front of a 22′ LED monitor. Each condition started with a practice block consisting of 32 trials in total in which participants received accuracy feedback after each response. Each of the two experimental conditions consisted of 480 experimental trials administered in five blocks of 96 trials, and lasted up to 1 h. No feedback was given during the experimental trials. Participants were allowed to take a short break between the blocks. Presentation software (Neurobehavioral Systems, Inc., Version 20.1) was used for experimental control and sending external triggers to the EEG amplifier.
Response time (RT) and accuracy data were submitted to a 2 × 2 repeated-measures ANOVA with Cue Condition (pre-cue, post-cue) and Spatial S-R Correspondence (corresponding, non-corresponding) as within-subjects factors. Trials with responses longer than 3 SD above the mean (in overall 1.8 % of trials) and trials with an incorrect response were excluded before the RT analysis.
2.3. EEG data recording and preprocessing
The EEG was recorded using an ActiChamp amplifier and BrainVision Recorder® (1.21.0403) software (Brain Products, Munich, Germany). Electrodes were placed on standard scalp sites according to the extended 10–20 system at 63 locations mounted in an elastic cap (Braincap, Brain Products GmbH). The online reference electrode was located at the TP8 electrode position. The ground electrode was placed at the forehead. The horizontal and vertical electro-oculogram (hEOG and vEOG) were measured by using electrodes located above and below the left eye and at the outer canthi of the left and right eye. Electrode gel and standard procedures were applied to keep the electrode impedance below 10 kΩ. The data sampling rate was 1,000 Hz. An online high cutoff filter of 200 Hz and a notch filter of 50 Hz was applied.
Offline EEG preprocessing was done using BrainVision Analyzer® software (version 2, Brain Products, Munich, Germany). Data were re-referenced to the mean signal from all electrodes, and filtered with 0.1–90 Hz band-pass filters and a 50 Hz notch filter (Butterworth zero-phase filters, attenuation of 12 dB/octave). The EEG from the pre-cue condition was split into segments from −1,800 to 2,000 ms relative to target onset, and baselined to the first 200 ms before target onset. For the post-cue condition, the segments were split from −3,800 to 2,000 ms relative to cue onset, and baselined to the first 200 ms before cue onset. Trials with an incorrect response, or with reaction times shorter than 200 ms or longer than 2,000 ms were automatically excluded from further analyses.
To exclude trials with horizontal eye movements, segments were marked if the horizontal EOG activity (right minus left EOG) exceeded ±35 μV and/or voltage steps between adjacent data points exceeding 16 μV. The marked segments were inspected manually and removed if a distinctive “boxcar” shape, characteristic for saccadic eye movements, was found in these marked segments within about 500 ms after target onset in the pre-cue condition and after cue onset in the post-cue condition. On average 25 segments (3%) per participant (range 1–121) were removed due to horizontal eye movements toward the target. Surprisingly, less eye movements were found in the pre- than post-cue condition, on average in 7 vs. 19 segments (p = 0.001).
ICA was carried out to correct the EEG for ocular artifacts and other activity that had non-cortical origins. Next, after resetting the baseline, the segmented data were checked for residual artifacts using BrainVision Analyzer semi-automatic artifact rejection method. Rejected were segments with absolute amplitudes ≥250 μV, minimum-maximum voltage differences within 1 second time-interval ≥300 μV, and voltage steps between adjacent data points ≥75 μV. If necessary, the rejection criteria were adjusted according to signal characteristics in individual subjects (such as unusually small or large EEG amplitudes). On average 4 % of segments per participant (SD 6, range 0–23%) were excluded due to artifacts at this step. The averages of accepted segments were 416 segments (range 293–472) for the pre-cue condition and 371 segments (range 224–457) for the post-cue condition.
2.4. Time-frequency decomposition
Subsequent analyses were performed in Matlab (version R2020a, The Mathworks, Natick, MA, USA) using custom written code based on published scripts (Cohen, 2014, 2017, 2022) and the Brainstorm toolbox (Tadel et al., 2011). To decompose the EEG signal into its time-frequency representation, the Fast Fourier Transformation (FFT) power spectrum of the single-trial data was convolved with complex Morlet wavelets, defined as: ei2πfte−t2/(2σ2), where i is the complex operator, t is the time, f is the frequency from 1 to 30 Hz in 30 logarithmically spaced steps, and σ is the width of each frequency band defined as σ = n/(2πf), where n is the number of wavelet cycles. The wavelet cycles varied from 3 to 8 in logarithmically spaced steps, to obtain an optimal trade-off between temporal and frequency resolutions (Trujillo and Allen, 2007). After the convolution operation, instantaneous EEG power and phase were extracted from the resulting signal by taking, respectively, the squared magnitude and phase angle at each time-frequency point.
2.5. Lateralized power spectra (LPS)
To examine attention-related ipsilateral–contralateral modulations of local power in the alpha-and theta-bands, we calculated lateralized power spectra (LPS), based on the method described by Van der Lubbe and Utzerath (2013); see also Van der Lubbe et al. (2014, 2019). The LPS indices were calculated by a double subtraction of all symmetrical electrode pairs at each time-frequency point. First, the ipsilateral–contralateral subtraction was calculated separately for segments with targets in the left and right visual fields, then scaled by the sum of activation from both hemispheres (ipsilateral + contralateral), and averaged, according to the formula:
where Wipsi is trial-averaged power from the ipsilateral channel (relative to target visual field), Wcontra is power from the contralateral channel; both measured within the same frequency- band (fn) and time-window.
The LPS values vary from −1 to +1. A positive LPS value indicates larger power at the ipsilateral site relative to the contralateral site, which may reflect a stronger desynchronization of a given frequency band at the contralateral site; zero indicates no hemispherical difference, thus no directing attention-related modulations. For visualization, the obtained LPS topographies were plotted on a map of the left hemisphere. The topographical results (see Section 3) showed that in the pre-cue condition, alpha-band LPS peaked at PO3/4; whereas in the post-cue condition, the lateralized alpha power was slightly more anterior, with a peak at P5/6. Therefore, further analysis of alpha LPS was restricted to these sites.
To evaluate the statistical significance of the LPS in the pre-cue and post-cue conditions, nonparametric permutation tests with cluster-level correction for multiple comparisons were performed (Nichols and Holmes, 2002; Maris and Oostenveld, 2007). One thousand iterations of randomization were created for each analysis. At each iteration, the time-frequency points from an interval of 1,300 ms—beginning from target onset in the post-cue condition, and from cue onset in the post-cue condition—were randomly shuffled. Next, a two-tailed t-test was performed for each time-frequency point against the null-hypothesis of no change from the baseline interval (−500 to 0 ms). The obtained t-value maps were corrected at cluster-level with the significance threshold set at p = 0.01. Additionally, for statistical evaluation of possible differences between the two cue conditions, LPS values were measured as mean activity in the time-frequency windows indicated in the permutation test results: 400–600 ms and 10–14 Hz for the pre-cue condition, and 550–750 ms and 10–14 Hz for the post-cue condition. The obtained alpha LPS values were submitted into a repeated-measures ANOVA with Cue Condition (pre-cue, post-cue) as a within-subjects factor (The comparisons between two cue conditions were done with N = 25).
2.6. Source-level inter-site phase coherence
To examine attention-related contra-ipsilateral modulations of functional connectivity in the alpha-band, we analyzed source-level inter-site phase coherence (ISPC). Before the analysis, the surface Laplacian filter (or current source density or current scalp density, CSD) was applied to the single-trial data. The Laplacian is commonly used to increase spatial selectivity and minimize volume conduction effects (Cohen, 2015a,b).
2.6.1. Spatio-spectral source separation
Source separation was performed by means of the GED technique. The GED is a multivariate source separation method that maximally separates two matrices of channel covariance between a priori specified signal features (Parra and Sajd, 2004; de Cheveigné and Arzounian, 2015; Cohen, 2022). The first matrix is the channel covariance of the relevant signal. Our a priori specified frequency band was the alpha, thus the signal matrix (S) was derived from data narrow band-filtered in this frequency band (cf. Nikulin et al., 2011; Zuure and Cohen, 2021). The filter was centered at 11 Hz, and the Gaussian spectral full-width at half-maximum (FWHM) range was set at 3 Hz. The second matrix is the channel covariance of the reference signal. Our reference matrix (R) was derived from the broadband (unfiltered) EEG. The S and R matrices were computed for a 100–600 ms time-window, relative to target onset in the pre-cue condition and cue onset in the post-cue condition. Additionally, the phase-locked part of the signal was removed from the single-trial data before the GED analyses to avoid potential stimulus-evoked transient artifacts (Cohen, 2018).
Separate GED analyses were performed to obtain spatial filters for the a priori specified medial-parietal, and the left and right lateral-occipital sources of alpha activity. To separate the medial-parietal source, the covariance matrices were calculated for each participant on condition-averaged data, and then the result was group-averaged. A similar procedure has been previously used for group-level ICA analyses (Calhoun et al., 2001, 2009). Next, the GED was applied to the group-averaged matrices, which produced a set of 63 spatial components of group-level condition-averaged alpha activity, where each component was a weighted combination of all 63 channels. The GED components are specified by their eigenvalues that show the S/R ratio indicating the importance of each component, and eigenvectors that provide the parameters of the spatial filters (i.e., the sensor weights constituting each spatial component). The medial-parietal source was isolated by the first of the 63 components—showing the largest S/R ratio, and this component was retained for ISPC analysis (cf. Zuure et al., 2020; Cohen, 2022). To obtain spatial filters for the lateral-occipital (visual) sources, the described GED analysis was performed separately for data from trials with targets presented in the left and right visual fields (pooled across all other conditions). In both analyses, the first component again isolated the medial-parietal source, as in the first GED analysis above, and the second largest components isolated, respectively, the left and right lateral parieto-occipital areas (see Section 3). These second-largest components were retained for the ISPC analysis.
To create visualizations of the components' anatomical distributions, forward models of the three selected GED components were correlated with a lead field matrix containing the coefficients relating the source space to the sensor-level EEG topography (Hild and Nagarajan, 2009; Cohen and Gulbinaite, 2017). The forward models were computed by multiplication between the eigenvector and covariance matrix S (Haufe et al., 2014). The lead field matrix was generated in the Matlab Brainstorm toolbox using a Boundary Element Method (BEM) model. The obtained correlation coefficients were visualized on the standard cortical surface (MRI model: ICBM 152; see Section 3).
2.6.2. Inter-site phase coherence (ISPC)
To assess attention-related functional connectivity, ipsilateral and contralateral (relative to the target visual field) alpha-band ISPC was computed between the isolated medial-parietal and lateral parieto-occipital sources. ISPC estimates the consistency between band-specific phase angle values at two sites or areas of activity (Lachaux et al., 1999; Cohen et al., 2008). In the literature, this measure has also been referred to as inter-site phase connectivity, inter-site phase clustering, inter-channel phase synchrony (ICPS), and inter-site phase-locking value (PLV). Component-specific time-series data, i.e., the component eigenvectors multiplied by the single-subject EEG signal, were decomposed into their time-frequency representations through convolution with complex Morlet wavelets (as described above for sensor-level analysis), separately for all retained components. This yielded medial-parietal and lateral parieto-occipital time-frequency activity for each task condition per participant. Next, alpha-band (10–14 Hz) ISPC was computed by taking the length of the mean vector of differences between the distribution of obtained phase angle differences over trials, for each time-frequency point of the spatially-filtered signal, according to the formula:
where, x and y stands for two distinct sources, Φ indicates instantaneous phase at single time-frequency point (fn, t). The resulting ISPC index varies between 0 and 1, where 0 indicates no phase synchrony between two sites (i.e., random distributed phases), and 1 indicates a fully consistent phase synchrony between two sites. The obtained ISPC values were baseline-corrected as the percentage of change at each frequency band relative to a pre-stimulus baseline (−700 to 200 ms).
Statistical significance of the differences between ipsilateral and contralateral alpha ISPC over time was examined using non-parametric permutation testing with cluster-level correction for multiple comparisons (Nichols and Holmes, 2002; Maris and Oostenveld, 2007). First, t values were computed for every time-point of the ipsilateral vs. contralateral difference, which produced clusters of significant time-points (threshold set at p = 0.05). Next, the direction of the hemispheric difference was randomly shuffled in 1,000 iterations, to create a distribution for the null-hypothesis of no ipsilateral–contralateral difference. At each iteration, a two-tailed t-test was performed for each time-point of the shuffled data against the null-hypothesis, and the size of the largest time-point cluster of significant t values was determined, to obtain a distribution of maximal cluster sizes expected under the null-hypothesis. Finally, the significant time-point clusters from the true t-statistic map of the ipsilateral vs. contralateral difference were determined by setting a threshold at the level of the 95th percentile of the null-hypothesis distribution, which indicated as significant any cluster that was equal to or larger than the 95% of the distribution of null hypothesis cluster sizes (p = 0.05 was applied here because the ISPC effects did not reach the more conservative 0.01 threshold). Additionally, to test for possible differences between the cue conditions, alpha ISPC was measured as mean activity in the time-windows approximated to the epochs indicated in the permutation results: 400–600 ms for the pre-cue condition, and 550–750 ms for the post-cue condition; and submitted into a 2 × 2 repeated-measures ANOVA with Hemisphere (ipsilateral, contralateral) and Cue Condition (pre-cue, post-cue) as within-subjects factors.
To examine whether the observed ISPC reflected a non-zero lag connectivity, the circular “V-test” was conducted, which is a nonparametric method that allows to determine if an observed phase angle difference is significantly different from a specified phase angle (Zar, 1999; Cohen, 2014). Following the implementation by Van Driel et al. (2012), first the distributions of single-trial alpha-band (10 Hz) phase-angle-differences over time were computed. This was done separately for the left and right ipsilateral connections between the medial-parietal and parieto-occipital sources, in both cue conditions, for each participant. Next, the V-test was performed over trials within-subjects, against “0” and “π,” on the randomly sampled phase-angle data (cf. Cohen, 2014). This was done for the time-intervals in which significant differences between ipsilateral and contralateral alpha-band ISPC were observed (380–590 ms in pre-cue condition, and 540–780 ms in post-cue condition). The obtained V-test results were averaged across participants (cf. Van Driel et al., 2012). Confirmation of the null hypothesis would indicate a difference between the tested phase angle directions; thus, a non-significant p-value indicates that the phase angle lag is not zero or π. A non-zero or non-π lag difference implies true inter-regional connectivity, whereas zero-lag or π-lag connectivity might reflect a volume conduction artifact or real zero-phase-lag inter-site synchrony (Roelfsema et al., 1997; Bastos et al., 2015a).
3. Results
3.1. Response time and accuracy
RT and accuracy data are displayed in Figure 2. RT in both cue conditions were rather slow, which may be ascribed to the relatively difficult four-choice response task and the emphasis on accuracy. The average RT was 858 ms (SD 127) in the pre-cue condition and 860 ms (SD 188) in the post-cue condition, F < 1.0, n.s. The two cue conditions differed in accuracy, indicating that the retrieval from visual memory in the post-cue condition (88 %, SD 6) was more difficult than the selection of the visual target in the pre-cue condition (94 %, SD 4), F(1, 24) = 37.78, p < 0.001, = 0.61.
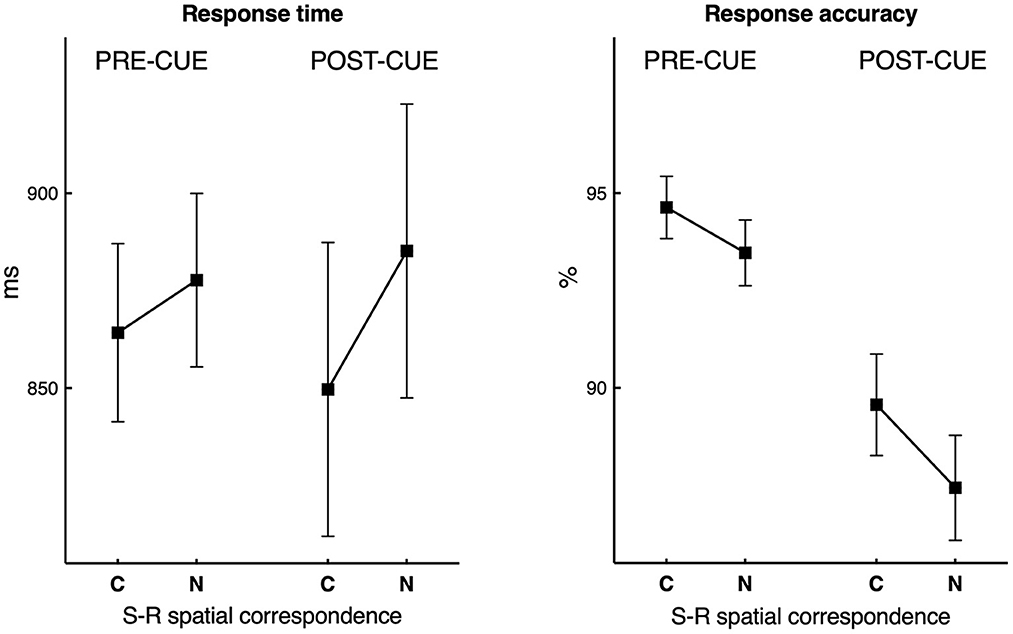
Figure 2. Response time and response accuracy data obtained in the pre-cue and the post-cue conditions as a function of correspondence (C) and non-correspondence (N) between the (former) location of the relevant stimulus (S) and the response (R) side. The vertical bars are standard errors of the mean.
Furthermore, RTs were faster by about 25 ms, F(1, 24) = 30.82, p < 0.001, = 0.56, and accuracy higher by about 2 %, F(1, 24) = 13.08, p = 0.001, = 0.35, in trials with S(stimulus)-R(Response) spatial correspondence (C) than non-corresponding (N) trials. Interestingly, in RTs, significant was also the interaction between Cue Condition and Spatial S-R Correspondence, F(1, 24) = 4.89, p = 0.037, = 0.17, indicating that the S-R correspondence effect in the post-cue (35 ms), F(1, 24) = 26.35, p < 0.001, = 0.52, was significantly larger than in the pre-cue condition (14 ms), F(1, 24) = 4.47, p = 0.045, = 0.16. In accuracy, the interaction was not significant, F = 1.35, n.s. In sum, the behavioral results replicated the findings of Van der Lubbe et al. (2014), with the additional result of a larger spatial correspondence effect in the post-cue condition on RT.
3.2. Lateralized power spectra
Figure 3 shows time-frequency representations of the LPS results for the two cue conditions. Black contours outline the time-frequency regions in which power lateralization was significant with permutation testing with a threshold set at p ≤ 0.01 (cluster-level corrected for multiple comparisons). The head maps show topographies of LPS in windows approximated to the significant time-frequency areas. As can be seen in Figure 3, there was a significant transient lateralization of power in the alpha-band (~10–14 Hz) in both cue conditions, indicating that contralateral alpha power was smaller than ipsilateral alpha power. In the pre-cue condition the alpha lateralization peaked at about 400–600 ms after target onset; whereas in the post-cue condition the peak was at about 550–750 ms after onset of the cue. The topographies show that the alpha LPS effects were present over parieto-occipital areas, with a slightly more anterior focus in the post-cue condition. The magnitude of the lateralization within the 200 ms time windows that was determined based on the outcome of the permutation tests was slightly larger in the pre-cue than in the post-cue condition, F(1, 24) = 5.42, p = 0.029, = 0.18.
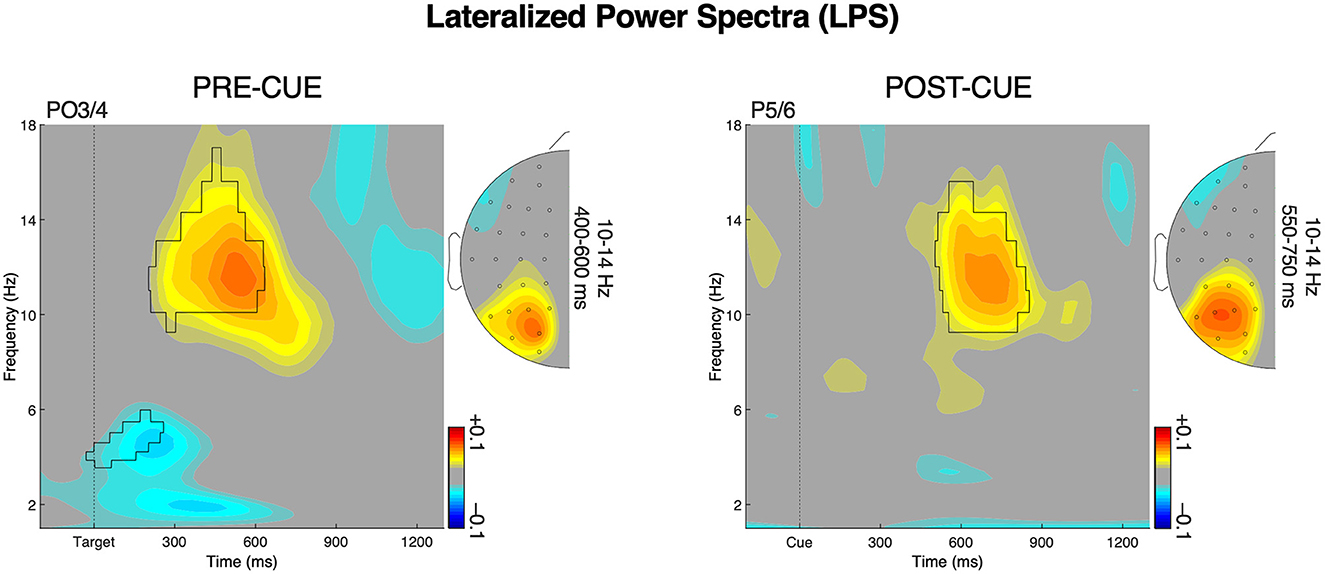
Figure 3. Lateralized power spectra (LPS). The time-frequency plots show the LPS from the indicated posterior electrode pairs for the pre-cue and post-cue conditions [(Left, Right panels), respectively]. Black contours outline the time-frequency regions in which power lateralization was significant in the permutation tests (cluster-level corrected for multiple comparisons). Time-zero in the pre-cue condition is the target onset, and in the post-cue condition it is the cue onset. The head maps show topographies of the alpha-band LPS (10–14 Hz) in the indicated time-windows, plotted on the left hemisphere. The maps are min-max scaled, with positive values in red and negative in blue. The head view is from above. The results show a significant transient lateralization of power in the alpha-band (~10–14 Hz) in both cue conditions, indicating that contralateral alpha power was smaller than ipsilateral alpha power. The results additionally show that contralateral theta power was larger than ipsilateral theta power shortly after target onset in the pre-cue condition.
In the pre-cue condition, we also observed an LPS effect in the theta-band (~4–6 Hz), indicating an early target-related contralateral vs. ipsilateral increase of theta power over occipital areas, at about 100–300 ms after target onset. No such effect was present in the post-cue condition. A similar effect was actually observed by Van der Lubbe et al. (2014). This theta-band lateralization may reflect an event-related activity evoked in the process of target selection (cf. Bastos et al., 2015b; Landau et al., 2015). To establish whether this effect is indeed event-related, we separated phase-locked LPS (“evoked” activity) from non-phase-locked LPS (“induced” activity) by subtracting the evoked activity (ERP) from single-trial total power (for details see Cohen and Donner, 2013; Asanowicz et al., 2021). The results of the LPS analyses on evoked and induced activity are displayed in Figure 4. Increased contralateral vs. ipsilateral theta power was only present in evoked activity, whereas increased ipsilateral vs. contralateral alpha power was only present in induced activity. The results therefore indicate that the effect in the theta-band in the pre-cue condition is strongly related to the onset of the two-stimulus display.
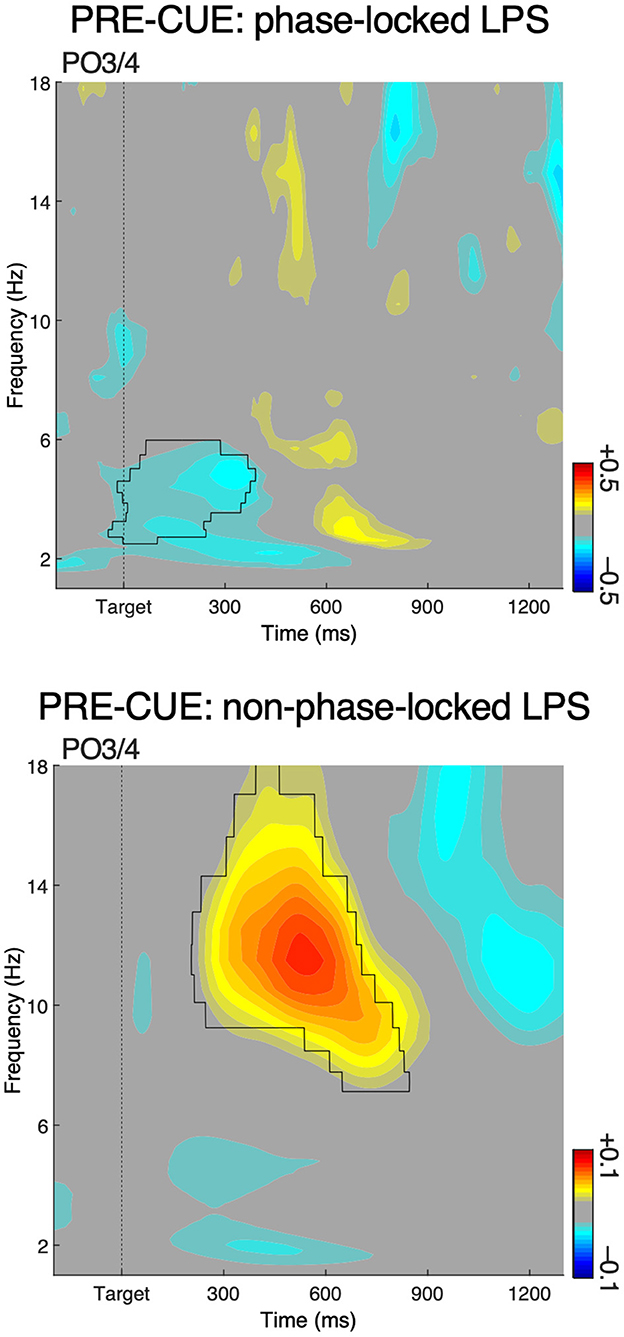
Figure 4. A separation of phase-locked (upper panel) lateralized power spectra (LPS) and non-phase-locked LPS (lower panel) in the pre-cue condition for the most relevant parieto-occipital electrode pair. The results show that the effect in the theta band (cf. the left panel of Figure 3) can be considered as evoked, while the effect in the alpha band can be considered as induced.
3.3. Inter-site phase coherence
To isolate the a priori specified source components of alpha-band activity, we used a multivariate spatio-spectral GED decomposition technique (see Section 2 for details). The results of the source separation are displayed in Figure 5A. The medial-parietal areas for both hemispheres were isolated in the first, strongest GED component. The second-largest component isolated the parieto-occipital areas, ipsilateral to the left and right targets, respectively. Next, we analyzed source-level inter-site phase coherence (ISPC) to estimate attention-related ipsilateral and contralateral modulations of alpha phase synchrony between the obtained components.
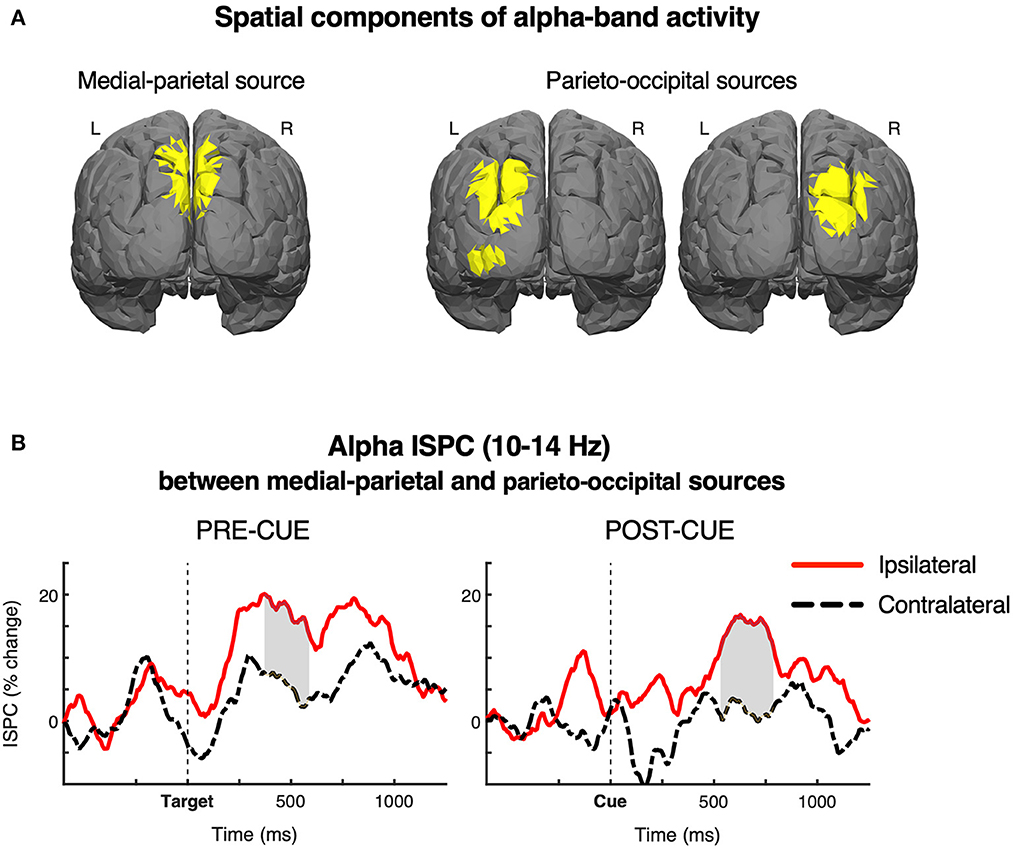
Figure 5. (A) Source components of the alpha-band activity. The components were isolated using a multivariate spatio-spectral filtering based on the generalized eigenvalue decomposition (GED), and visualized by correlating the obtained forward models with a leadfield matrix generated using a standard boundary element method model in the Matlab Brainstorm toolbox. The medial-parietal areas were isolated in the first, strongest GED component. The second-largest component of GED isolated the parieto-occipital areas, ipsilaterally to the left and right targets, respectively. (B) Source-level alpha inter-site phase coherence (ISPC) between the medial-parietal and parieto-occipital sources for the two conditions. Dashed black and solid red lines show the ISPC, respectively from the ipsilateral and contralateral hemispheres, relative to the target visual field. Gray fills indicate the time-points where the ipsilateral-contralateral difference was significant in permutation tests (cluster-level corrected for multiple comparisons). The depicted results showed significant target-related lateralizations of alpha ISPC in both cue conditions, suggesting that both external and internal spatial attention entail an increased inter-regional connectivity ipsilaterally to the target visual field.
Figure 5B shows the time-course of alpha-band (10–14 Hz) ISPC between the medial-parietal and parieto-occipital sources for the ipsilateral and contralateral hemispheres, relative to the target visual field, in the two cue conditions. Gray fills indicate the time-windows in which the ipsilateral-contralateral difference was indicated significant in permutation tests at p ≤ 0.05 (cluster-level corrected for multiple comparisons).
The results showed significant target-related lateralizations of alpha-band ISPC in both cue conditions, indicating an increase of inter-regional alpha coherence ipsilateral vs. contralateral to the target visual field. The effect was significant from 380 to 590 ms in the pre-cue condition, and from 540 to 780 ms in the post-cue condition, which corresponds with the direction and timing of the LPS effects in the two cue conditions. The ANOVA showed that the magnitude of ISPC lateralization did not differ between the two cue conditions, F < 1.0, n.s., while confirming significance of the main effect of the ipsilateral-contralateral difference, F(1, 24) = 21.60, p < 0.001, = 0.47 (Hemisphere × Cue was also not significant, F < 1.0, n.s.).
Lastly, given the relatively short distances between the sources, we decided to check whether the observed ipsilateral ISPC reflected a non-zero lag connectivity, which would disfavor an explanation in terms of volume conduction. The group-level circular V-test p values (see Section 2 for details) were 0.48 for zero and 0.51 for π in the pre-cue condition, and 0.67 for zero and 0.32 for π in the post-cue condition. These results indicate that the observed phase angle differences are not distributed around zero or π. Therefore, it may be concluded that the observed ipsilateral vs. contralateral alpha-band phase synchrony between the medial-parietal and parietal-occipital sources is unlikely to be due to volume conduction.
4. Discussion
Earlier studies revealed strong support for similarities between the selection of visual information from a location in the external world (external spatial attention) and the retrieval of former “visual” information from memory (internal spatial attention). This support comes from the application of various approaches, such as assessing gaze bias (Van Ede et al., 2020; Van Ede and Nobre, 2021), examining stimulus-response correspondence effects like the Simon effect (Hommel, 2002; Van der Lubbe et al., 2014), and using neuroimaging measures like fMRI (e.g., Zhou et al., 2022), EEG (e.g., Magosso et al., 2021), and MEG (e.g., Cona et al., 2020). Our primary focus in the current paper was directed at EEG activity in the alpha band, as numerous studies revealed that there is an inverse relation between alpha power and the allocation of visuospatial attention (e.g., Worden et al., 2000; Thut et al., 2006; Van der Lubbe and Utzerath, 2013; Bacigalupo and Luck, 2019; Asanowicz et al., 2021), and comparable effects have been observed in studies focusing on the retrieval from visuospatial memory on the basis of non-spatial cues (e.g., see Van der Lubbe et al., 2014; Poch et al., 2017). Although the previous support based on alpha modulations seemed straightforward (Van der Lubbe et al., 2014), the demonstration of effects within rather different experimental paradigms (see Kizilirmak et al., 2022), and the observation that the posterior alpha rhythm may actually consist of different components (Sokoliuk et al., 2019; Rodriguez-Larios et al., 2022) have complicated a straightforward answer. Moreover, a later study by Willems (2020) was not able to provide support for similar effects in the alpha band, which may be due to the employment of alternative strategies that sidestep the use of visuospatial memory. Finally, on the basis of a few studies it may be suggested that similar effects in the case of external and internal spatial attention could be present in the theta band as the relevant stimulus still needs to be selected/encoded (see Hanslmayr et al., 2009; Van der Lubbe et al., 2014; Harris et al., 2017).
We modified a previously employed task (in Van der Lubbe et al., 2014) to further reduce experimental differences and diminish the possibility of using alternative strategies. Furthermore, we used the GED technique to separate the posterior alpha rhythm in two parieto-occipital and one medial-parietal sources, and examined whether the phase coherence between these sources shows comparable effects in conditions that should highlight external and internal spatial attention. First, however, we will focus on the expected replication of previous behavioral and LPS results.
The behavioral data (see Figure 2) confirmed the presence of a Simon effect, the tendency to respond to the (former) side of the target shape, both in the pre-cue and the post-cue conditions, which replicates the results of Hommel (2002) and Van der Lubbe et al. (2014). Observing this effect strongly suggests that the location of the relevant shape plays a role not only when the shape is present, which is the common Simon effect, but also when it is retrieved from memory. This observation suggests that a spatial code is generated or reactivated when retrieving the shape. According to Van der Lubbe et al. (2012), this reflects the shift of attention toward the location of the previously presented shape. These data also nicely correspond with the gaze biases related to memorized locations reported by Van Ede et al. (2020). Thus, these behavioral data are in line with the view that external and internal spatial attention share a common mechanism. The behavioral data additionally indicated that retrieval from memory is more difficult than selection from the external world, as more errors were made in the post-cue condition. This observation may actually be taken as an argument why there is a need to reduce interference when retrieving information from memory.
As indicated before, the alpha rhythm seems to fulfill this role of reducing interference (Jensen and Mazaheri, 2010; Foxe and Snyder, 2011; Klimesch, 2012; Benedek et al., 2014). This interference may not only arise from external stimuli (i.e., distractors) but also from internal neural activity (see Rodriguez-Larios et al., 2022). Our results on lateralized alpha power, assessed with the LPS index, clearly replicated previous findings with non-spatial post-cue conditions (Van der Lubbe et al., 2014; Poch et al., 2017). A reduction in contralateral vs. ipsilateral posterior alpha power was indeed observed in both the pre-cue and the post-cue conditions (see Figure 3), suggesting that neural activity related to the irrelevant side was suppressed and/or neural activity related to the relevant side was facilitated. Thus, we were able to show that these effects can also be observed in the case of a longer time interval in the post-cue condition. The magnitude of the lateralized effect appeared slightly larger in the pre-cue condition. This observation, however, should not be interpreted as increased relevance of this underlying process for external spatial attention, as very likely the temporal variability of the suppressive effect is simply smaller in the pre-cue condition (for a similar argument, see Van der Lubbe et al., 2014), which implies overall a larger lateralized effect. Nevertheless, we observed some small differences in the topographies of the lateralized effects, with a slightly more anterior focus in the post-cue condition. This potential difference was not statistically assessed, so, we decided not to speculate on possible reasons. The current LPS results appear more pronounced than in the study of Van der Lubbe et al. (2014). This may be due to the implemented changes in the current experiment, an increase in the number of participants, and improved procedures for analyzing the EEG. Clearly, the absence of lateralized effects in the study of Willems (2020) seems to be an exception, also for the longer time interval between the stimulus display and the post-cue, and is indeed likely due to the use of alternative strategies.
With the use of the GED technique, it was possible to separate the posterior alpha rhythm in a medial-parietal source and two sources in lateral parieto-occipital cortex (see Figure 5A). The subsequently estimated source activities in the alpha band were used to examine the connectivity between the medial-parietal and the parieto-occipital sources for the two cue conditions, where we contrasted ipsilateral with contralateral connectivity (see Figure 5B). In both cue conditions, we observed increased ipsilateral vs. contralateral connectivity in the time windows wherein the LPS effects were demonstrated, suggesting that this small parieto-occipital network plays a role in reducing interference. These findings provide new support for the idea that external and internal spatial attention share their underlying mechanism. Still, some extra caution is needed when interpreting connectivity results. As the sources are quite close to each other, one could argue that the observed effects might reflect the effect of volume conduction across the scalp. In principle, this potential problem is much smaller when determining source-connectivity (Schoffelen and Gross, 2009) as the GED procedure should separate different activity patterns (de Cheveigné and Arzounian, 2015; Cohen, 2022), especially in conjunction with the Laplacian spatial filtering that additionally attenuates volume conduction artifacts (Cohen, 2015a,b). Importantly, in both cue conditions, the observed ipsilateral inter-site phase coherence had non-zero phase-lags, which provides further evidence for true connectivity (A spurious effect due to volume conduction would display a zero phase-lag). Moreover, similar alpha-band connectivity between the parietal and occipital areas has previously been demonstrated for external spatial attention (Siegel et al., 2008; Capotosto et al., 2015; Liu et al., 2016; Lobier et al., 2018), which aligns with the present results. Thus, to conclude, our findings indicate that the connectivity between medial-parietal and parieto-occipital areas is highly comparable when selecting visual information in the outside world and when retrieving “visual” information from our inner world.
We also observed larger theta power at contralateral vs. ipsilateral sites but only in the pre-cue condition (see Figure 3, left panel; see also Van der Lubbe et al., 2014). Increased posterior theta power has been interpreted as a reflection of target encoding (Hanslmayr et al., 2009) and signal enhancement (Harris et al., 2017), while a recent study suggested that it is also related to conflict detection in the Stroop task (Haciahmet et al., 2023). Results of another recent study (Marturano et al., 2021) indicate that the lateralized effect in the theta band2 may actually be the spectral counterpart of the N2pc (e.g., Eimer, 1996) or PCN (posterior contralateral negativity) component (e.g., Van der Lubbe et al., 2001), which is a lateralized ERP component usually interpreted as the allocation of attention to a lateral target (e.g., see Bacigalupo and Luck, 2019; Forschack et al., 2022). The idea that the observed effect in the theta band is related to the N2pc would imply that it concerns an evoked rather than an induced effect. To explore this issue further, separate LPS analyses were performed on evoked (phase-locked) and induced (non-phase-locked) activity. Results of these analyses (see Figure 4) confirmed that the contralateral vs. ipsilateral increase in posterior theta power concerns an evoked effect, which favors the idea that this effect may be the spectral counterpart of the N2pc.
The N2pc was present in both external and internal spatial attention conditions in the study of Kuo et al. (2009). They presented four-stimulus displays that were either preceded by a to-be-searched target or followed by a match-to-sample target. One possibility is that the signal-to-noise ratio in the current study was too low to clearly demonstrate effects in the theta band in the post-cue condition. Indeed, in the study of Van der Lubbe et al. (2014), increased contralateral vs. ipsilateral theta was present in both the pre-cue and the post-cue conditions (see their Table 2), which aligns with the findings from Kuo et al. (2009). Nevertheless, with match-to-sample targets (where the target is repeated) the retrieval process is rather easy as it only requires recognition, while in the current study, only the color of the target is cued, which makes the retrieval process more similar to recall. Furthermore, in the current study the time interval between offset of the stimulus display and onset of the post-cue was twice as long (2 vs. 1 s) as in the study of Van der Lubbe et al. (2014). The latter difference may be responsible for the absence of the theta effect in our post-cue condition. Future studies may very well-confirm the earlier findings from Van der Lubbe et al. (2014), who demonstrated increased contralateral vs. ipsilateral theta power in the post-cue condition.
The demonstration of highly comparable data patterns, either based on behavioral or neuroimaging measures in conditions, that highlight external and internal spatial attention may not be considered as decisive. Strong support, however, would be obtained if interference of processing in medial-parietal cortex (e.g., with transcranial magnetic stimulation [TMS]) would deteriorate both external and internal spatial attention. The report on neglect patients from Bisiach and Luzzatti (1978) relates to this suggestion. They described two patients that suffered from unilateral neglect following brain injuries in the right hemisphere. The patients were not only ignoring the left part of their visual field but were also unable to recall buildings from the left side of a famous square in Milan when they were imagining to be at a specific spot, even though they could recall those previously ignored buildings when they imagined to move to the opposite side of the square. The problems of these patients are obviously not related to visual impairments but to the ability of attending to both actual and virtual space, and seem related to damage in right parietal cortex. These early findings already support the idea that there is overlap between spatial attention and the possibility to recall from visuospatial memory, and that parietal areas play a crucial role in these selection processes.
In our introduction, we mentioned that in the study of Willems (2020) several participants may have used a strategy [if the post-cue has color C1/C2 then response R1 (left), else response R2 (right)] that no longer relied on visuospatial memory, which was held responsible for the absence of a clear lateralized effect on posterior alpha power in the post-cue condition. For the current study, such a strategy seemed unlikely, as a four-choice task was employed. However, also in the current experiment, participants could have invented an alternative strategy. Upon presentation of the two-stimulus display, they might pre-select the two out of four possible responses related to the two stimuli [e.g., left middle finger (R1), and right index finger (R3)], and relate one of the responses with its color [e.g., R1–C1 (e.g., blue)]. At the moment of presenting the post-cue, they might notice if the color (C1) relates to R1, and if not they could simply respond with R2. As our data displayed the expected effects, it seems that this strategy was not or at least not often employed. Nevertheless, there are probably several conditions wherein the retrieval of previously presented visual information may no longer involve visuospatial memory. One reason why this might happen is when the amount of visual information presented is simply too much and the viewing time is too short. This was obviously the case in the experiments reported by Sperling (1960) and maybe also in the study of Willems (2020). It may also be easier to recode the information presented, for example, by using semantic labels. In such a case, participants would still be able to properly report the presented information but no longer rely on a visuospatial representation. This idea might imply that the capacity of visual working memory may be even smaller than the average of four elements as proposed by Cowan (2001).3
Although the current study focused on short-term memory, it is relevant to know that there are indications that some of the observed effects may extend to episodic memory, which is an important component of long-term memory. Waldhauser et al. (2016) used an approach that resembles the approach employed by Kuo et al. (2009). During an initial encoding phase, participants were instructed to either simply judge the size of a laterally presented object or to memorize the object. After an intermediate distractor task to prevent rehearsal of the previously presented objects, participants took part in the retrieval phase. During that phase, they were presented with old and new objects that were now centrally presented. They first had to indicate whether the presented object was old or new, and subsequently were asked whether the object was presented to the left or the right. EEG4 measured during the retrieval phase showed a reduction in alpha and beta power contralateral to the encoding position of the old objects, in line with the idea that retrieval of the object reactivated sensory information during the encoding phase. They also revealed that repetitive TMS that interfered with this contralateral change deteriorated memory retrieval, suggesting that this contralateral reduction is indeed crucial for the ability to recall whether a presented object was old or new. Thus, even after a very long time interval, retrieval may involve visuospatial memory. This observation suggests that the distinction between short-term memory and long-term memory is less strict or at least different than commonly assumed (for relevant theoretical ideas, e.g., see Oberauer, 2013).
An issue ignored in the current study is individual differences. There are not only individual differences in the capacity of visuospatial memory but also individual differences in peak frequency of the alpha rhythm. In the study of Klimesch et al. (1993) participants that had better memory performance had a higher individual alpha frequency, while bad performers displayed a larger reduction in alpha power than good performers. A distinction between different individual alpha rhythms might therefore provide even clearer results. In this respect, the study of Rodriguez-Larios et al. (2022) is also very informative, as they reported that not all of the participants showed their Alpha 1 or Alpha 2 effects. Clearly, future studies will need to focus more on individual differences (e.g., see Pahor and Jaušovec, 2016).
In conclusion, the current study provides new support for the view that external and internal spatial attention rely on a shared neural mechanism. This mechanism may be related to a medial-parietal to parieto-occipital local network as connectivity between these areas was demonstrated in conditions that highlight external and internal spatial attention. Results from previous studies—an increase in ipsilateral vs. contralateral posterior alpha power and a Simon effect in both attention conditions—were replicated, while an increase in contralateral vs. ipsilateral posterior theta power could only be demonstrated for external spatial attention.
Data availability statement
Data files used for the analyses reported in the paper will be made available from the DANS repository under: https://doi.org/10.17026/dans-x2m-ug9s.
Ethics statement
The studies involving human participants were reviewed and approved by the Ethics Committee of the Faculty of Behavioral, Management, and Social Sciences at the University of Twente (request number 210676). The patients/participants provided their written informed consent to participate in this study.
Author contributions
The study was conceptualized by RV and DA. Design and implementation was performed by RV, DA, and BP. The data were acquired by IJ. IJ, BP, DA, and RV analyzed different aspects of the data. BP and DA wrote the first and final draft of the Sections 2, 3. RV wrote the first and final draft of the the Sections 1, 4 and finalized the draft for submission. All authors commented on earlier drafts. All authors contributed to the article and approved the submitted version.
Funding
This study was supported by grant OPUS 2019/33/B/HS6/00096 from the National Science Centre of Poland awarded to RV.
Acknowledgments
The authors want to thank Marta Bartoszek for her contribution in preprocessing the EEG data.
Conflict of interest
The authors declare that the research was conducted in the absence of any commercial or financial relationships that could be construed as a potential conflict of interest.
Publisher's note
All claims expressed in this article are solely those of the authors and do not necessarily represent those of their affiliated organizations, or those of the publisher, the editors and the reviewers. Any product that may be evaluated in this article, or claim that may be made by its manufacturer, is not guaranteed or endorsed by the publisher.
Footnotes
1. ^It might be argued that participants perform this task by simply keeping their attention at the corner indicated by the directional cue rather than by keeping the direction in visuospatial memory. Furthermore, the distractors might then also be seen as interfering with the attentional focus rather than interfering at the level of visuospatial memory.
2. ^Interestingly, Bastos et al. (2015b) revealed that in the primate visual system, feedforward effects (from primary sensory to higher order areas) are related to the theta band, so, one could argue that our effect, and results focusing on the N2pc/PCN are related to projections from lower to higher visual brain areas. Van der Lubbe et al. (2014) already suggested that “the PCN may be characterized as a reflection of evoked posterior increased contralateral θ power” (p. 187). Van der Lubbe et al. (2016) additionally confirmed that the amplitudes of early visual ERP components strongly relate to modulations in alpha and theta power.
3. ^Recent studies actually indicate that a conceptualization of the capacity in terms of number of elements (i.e., the so-called slot theory) is inappropriate (e.g., Ma et al., 2014) and may better be formulated in terms of available resources, as it appears that the preciseness of memories (e.g., a specific color, orientation or size) decreases in a gradual way, and not in an all or none manner.
4. ^One could argue that this second instruction is actually responsible for these lateralized effects as participants may already be orienting toward the remembered side, this alternative account, however, does not explain the observations from their second experiment.
References
Annett, M. (1970). A classification of hand preference by association analysis. Br. J. Psychol. 61, 303–321. doi: 10.1111/j.2044-8295.1970.tb01248.x
Asanowicz, D., Panek, B., Kotlewska, I. (2021). Selection for action: the medial frontal cortex is an executive hub for stimulus and response selection. J. Cogn. Neurosci. 33, 1442–1469. doi: 10.1162/jocn_a_01727
Bacigalupo, F., Luck, S. J. (2019). Lateralized suppression of alpha-band EEG activity as a mechanism of target processing. J. Neurosci. 39, 900–917. doi: 10.1523/JNEUROSCI.0183-18.2018
Bastos, A. M., Vezoli, J., Bosman, C. A., Schoffelen, J. M., Oostenveld, R., Dowdall, J. R., et al. (2015b). Visual areas exert feedforward and feedback influences through distinct frequency channels. Neuron 85, 390–401. doi: 10.1016/j.neuron.2014.12.018
Bastos, A. M., Vezoli, J., Fries, P. (2015a). Communication through coherence with inter-areal delays. Curr. Opin. Neurobiol. 31, 173–180. doi: 10.1016/j.conb.2014.11.001
Benedek, M., Schickel, R. J., Jauk, E., Fink, A., Neubauer, A. C. (2014). Alpha power increases in right parietal cortex reflects focused internal attention. Neuropsychologia 56, 393–400. doi: 10.1016/j.neuropsychologia.2014.02.010
Bisiach, E., Luzzatti, C. (1978). Unilateral neglect of representational space. Cortex 14, 129–133. doi: 10.1016/S0010-9452(78)80016-1
Calhoun, V. D., Adali, T., McGinty, V. B., Pekar, J. J., Watson, T. D., Pearlson, G. D. (2001). fMRI activation in a visual-perception task: network of areas detected using the general linear model and independent components analysis. Neuroimage 14, 1080–1088. doi: 10.1006/nimg.2001.0921
Calhoun, V. D., Liu, J., Adali, T. (2009). A review of group ICA for fMRI data and ICA for joint inference of imaging, genetic, and ERP data. Neuroimage 45, S163–S172. doi: 10.1016/j.neuroimage.2008.10.057
Capotosto, P., Spadone, S., Tosoni, A., Sestieri, C., Romani, G. L., Penna, S. D., et al. (2015). Dynamics of EEG rhythms support distinct visual selection mechanisms in parietal cortex: a simultaneous transcranial magnetic stimulation and EEG study. J. Neurosci. 35, 721–730. doi: 10.1523/JNEUROSCI.2066-14.2015
Chun, M. M., Golomb, J. D., Turk-Browne, N. B. (2011). A taxonomy of external and internal attention. Annu. Rev. Psychol. 62, 73–101. doi: 10.1146/annurev.psych.093008.100427
Cohen, M. X. (2014). Analyzing Neural Time Series Data: Theory and Practice. Cambridge, MA: MIT Press. doi: 10.7551/mitpress/9609.001.0001
Cohen, M. X. (2015a). Effects of time lag and frequency matching on phase-based connectivity. J. Neurosci. Methods 250, 137–146. doi: 10.1016/j.jneumeth.2014.09.005
Cohen, M. X. (2015b). Comparison of different spatial transformations applied to EEG data: a case study of error processing. Int. J. Psychophysiol. 97, 245–257. doi: 10.1016/j.ijpsycho.2014.09.013
Cohen, M. X. (2018). Using spatiotemporal source separation to identify prominent features in multichannel data without sinusoidal filters. Eur. J. Neurosci. 48, 2454–2465. doi: 10.1111/ejn.13727
Cohen, M. X. (2022). A tutorial on generalized eigendecomposition for denoising, contrast enhancement, and dimension reduction in multichannel electrophysiology. Neuroimage 247, 118809. doi: 10.1016/j.neuroimage.2021.118809
Cohen, M. X., Donner, T. H. (2013). Midfrontal conflict-related theta-band power reflects neural oscillations that predict behavior. J. Neurophysiol. 110, 2752–2763. doi: 10.1152/jn.00479.2013
Cohen, M. X., Gulbinaite, R. (2017). Rhythmic entrainment source separation: optimizing analyses of neural responses to rhythmic sensory stimulation. Neuroimage 147, 43–56. doi: 10.1016/j.neuroimage.2016.11.036
Cohen, M. X., Ridderinkhof, K. R., Haupt, S., Elger, C. E., Fell, J. (2008). Medial frontal cortex and response conflict: evidence from human intracranial EEG and medial frontal cortex lesion. Brain Res. 1238, 127–142. doi: 10.1016/j.brainres.2008.07.114
Cona, G., Chiossi, F., Di Tomasso, S., Pellegrino, G., Piccione, F., Bisiachi, P., et al. (2020). Theta and alpha oscillations as signatures of internal and external attention to delayed intentions: a magnetoencephalography (MEG) study. Neuroimage 205, 116295. doi: 10.1016/j.neuroimage.2019.116295
Cowan, N. (2001). The magical number 4 in short-term memory: a reconsideration of mental storage capacity. Behav. Brain Sci. 24, 87–185. doi: 10.1017/S0140525X01003922
de Cheveigné, A., Arzounian, D. (2015). Scanning for oscillations. J. Neural Eng. 12, 066020. doi: 10.1088/1741-2560/12/6/066020
Eimer, M. (1996). The N2pc component as an indicator of attentional selectivity. Electroencephalogr. Clin. Neurophysiol. 99, 225–234. doi: 10.1016/0013-4694(96)95711-9
Forschack, N., Gundlach, C., Hillyard, S., Müller, M. M. (2022). Dynamics of attentional allocation to targets and distractors during visual search. Neuroimage 264, 119759. doi: 10.1016/j.neuroimage.2022.119759
Foxe, J. J., Snyder, A. C. (2011). The role of alpha-band brain oscillations as a sensory suppression mechanism during selective attention. Front. Psychol. 2, 154. doi: 10.3389/fpsyg.2011.00154
Frey, J. N., Ruhnau, P., Weisz, N. (2015). Not so different after all: the same oscillatory processes support different types of attention. Brain Res. 1626, 183–197. doi: 10.1016/j.brainres.2015.02.017
Griffin, I. C., Nobre, A. C. (2003). Orienting attention to locations in internal representations. J. Cogn. Neurosci. 15, 1176–1194. doi: 10.1162/089892903322598139
Haciahmet, C. C., Frings, C., Beste, C., Münchau, A., Pastötter, B. (2023). Posterior delta/theta activity as an early signal of Stroop conflict detection. Psychophysiology 60, e14195. doi: 10.1111/psyp.14195
Hanslmayr, S., Spitzer, B., Bäuml, K.-H. (2009). Brain oscillations dissociate between semantic and nonsemantic encoding of episodic memories. Cereb. Cortex 19, 16731–11640. doi: 10.1093/cercor/bhn197
Harris, A. M., Dux, P. E., Jones, C. N., Mattingley, J. B. (2017). Distinct roles of theta and alpha oscillations in the involuntary capture of goal-directed attention. Neuroimage 152, 171–183. doi: 10.1016/j.neuroimage.2017.03.008
Haufe, S., Meinecke, F., Görgen, K., Dähne, S., Haynes, J. D., Blankertz, B., et al. (2014). On the interpretation of weight vectors of linear models in multivariate neuroimaging. Neuroimage 87, 96–110. doi: 10.1016/j.neuroimage.2013.10.067
Hild, K. E. II., Nagarajan, S. S. (2009). Source localization of EEG/MEG data by correlating columns of ICA and lead field matrices. IEEE Trans. Biomed. Eng. 56, 2619–2626. doi: 10.1109/TBME.2009.2028615
Hommel, B. (2002). Responding to object files: automatic integration of spatial information revealed by stimulus-response compatibility effects. Quart. J. Exp. Psychol. 55A, 567–580. doi: 10.1080/02724980143000361
Jensen, O., Mazaheri, A. (2010). Shaping functional architecture by oscillatory alpha activity: gating by inhibition. Front. Hum. Neurosci. 4, 1–8. doi: 10.3389/fnhum.2010.00186
Kiyonaga, A., Egner, T. (2013). Working memory as internal attention: toward an integrative account of internal and external selection processes. Psychon. Bull. Rev. 20, 228–242. doi: 10.3758/s13423-012-0359-y
Kizilirmak, J. M., Glim, S., Darna, M., Khader, P. H. (2022). Selective attention to stimulus representations in perception and memory: commonalities and differences. Psychol. Res. 86, 150–169. doi: 10.1007/s00426-020-01469-z
Klimesch, W. (2012). Alpha-band oscillations, attention, and controlled access to stored information. Trends Cogn. Sci. 16, 606–617. doi: 10.1016/j.tics.2012.10.007
Klimesch, W., Sauseng, P., Hanslmayr, S. (2007). EEG alpha oscillations: the inhibition-timing hypothesis. Brain Res. Rev. 53, 63–88. doi: 10.1016/j.brainresrev.2006.06.003
Klimesch, W., Schimke, H., Pfurtscheller, G. (1993). Alpha frequency, cognitive load and memory performance. Brain Topogr. 5, 241–251. doi: 10.1007/BF01128991
Kuo, B. C., Rao, A., Lepsien, J., Nobre, A. C. (2009). Searching for targets within the spatial layout of visual short-term memory. J. Neurosci. 29, 8032–8038. doi: 10.1523/JNEUROSCI.0952-09.2009
Lachaux, J., Rodriguez, E., Martinerie, J., Varela, F. J. (1999). Measuring phase synchrony in brain signals. Human Brain Mapp. 8, 194–208. doi: 10.1002/(SICI)1097-0193(1999)8:4<194::AID-HBM4>3.0.CO;2-C
Landau, A. N., Schreyer, H. M., van Pelt, S., Fries, P. (2015). Distributed attention is implemented through theta-rhythmic gamma modulation. Curr. Biol. 25, 2332–2337. doi: 10.1016/j.cub.2015.07.048
Liu, Y., Bengson, J., Huang, H., Mangun, G. R., Ding, M. (2016). Top-down modulation of neural activity in anticipatory visual attention: control mechanisms revealed by simultaneous EEG-fMRI. Cereb. Cortex 26, 517–529. doi: 10.1093/cercor/bhu204
Lobier, M., Palva, J. M., Palva, S. (2018). High-alpha band synchronization across frontal, parietal and visual cortex mediates behavioral and neuronal effects of visuospatial attention. Neuroimage 165, 222–237. doi: 10.1016/j.neuroimage.2017.10.044
Ma, W. J., Husain, M., Bays, P. M. (2014). Changing concepts of working memory. Nat. Neurosci. 17, 347–356. doi: 10.1038/nn.3655
Magosso, E., Ricci, G., Ursino, M. (2021). Alpha and theta mechanisms operating in internal-external attention competition. J. Integr. Neurosci. 20, 1–19. doi: 10.31083/j.jin.2021.01.422
Maris, E., Oostenveld, R. (2007). Nonparametric statistical testing of EEG- and MEG-data. J. Neurosci. Methods 164, 177–190. doi: 10.1016/j.jneumeth.2007.03.024
Marturano, F., Brigadoi, S., Doro, M., DellÁcuq, R., Sparacino, G. (2021). A neural network predicting the amplitude of the N2pc in individual EEG datasets. J. Neural Eng. 18, 056044. doi: 10.1088/1741-2552/ac2849
Nichols, T. E., Holmes, A. P. (2002). Nonparametric permutation tests for functional neuroimaging: a primer with examples. Hum. Brain Mapp. 15, 1–25. doi: 10.1002/hbm.1058
Nikulin, V. V., Nolte, G., Curio, G. (2011). A novel method for reliable and fast extraction of neuronal EEG/MEG oscillations on the basis of spatio-spectral decomposition. Neuroimage 55, 1528–1535. doi: 10.1016/j.neuroimage.2011.01.057
Nobre, A. C., Coull, J. T., Maquet, P., Frith, C. D., Vandenberghe, R., Mesulam, M. M. (2004). Orienting attention to locations in perceptual versus mental representations. J. Cogn. Neurosci. 16, 363–373. doi: 10.1162/089892904322926700
Oberauer, K. (2013). The focus of attention in working memory- from metaphors to mechanisms. Front. Hum. Neurosci. 7, 673. doi: 10.3389/fnhum.2013.00673
Pahor, A., Jaušovec, N. (2016). Making brains run faster: are they becoming smarter? Spanish J. Psychol. 19, E88. doi: 10.1017/sjp.2016.83
Parra, L., Sajda, P. (2004). Blind source separation via generalized eigenvalue decomposition. 4, 1261–1269. Available online at: https://www.scopus.com/inward/record.uri?eid=2-s2.0-8344236020&partnerID=40&md5=6bdeb8ffad80e4348699d7b4afbeabc8
Poch, C., Capilla, A., Hinojosa, J. A., Campo, P. (2017). Selection within working memory based on a color retro-cue modulates alpha oscillations. Neuropsychologia 106, 133–137. doi: 10.1016/j.neuropsychologia.2017.09.027
Rodriguez-Larios, J., ElShafei, A., Wiehe, M., Haegens, S. (2022). Visual working memory recruits two functionally distinct alpha rhythms in posterior cortex. ENEURO 9, 1–12. doi: 10.1523/ENEURO.0159-22.2022
Roelfsema, P. R., Engel, A. K., König, P., Singer, W. (1997). Visuomotor integration is associated with zero time-lag synchronization among cortical areas. Nature 385, 157–161. doi: 10.1038/385157a0
Schoffelen, J., Gross, J. (2009). Source connectivity analysis with MEG and EEG. Hum. Brain Mapp. 30, 1857–1865. doi: 10.1002/hbm.20745
Siegel, M., Donner, T. H., Oostenveld, R., Fries, P., Engel, A. K. (2008). Neuronal synchronization along the dorsal visual pathway reflects the focus of spatial attention. Neuron 60, 709–719. doi: 10.1016/j.neuron.2008.09.010
Simon, J. R. (1969). Reactions toward the source of stimulation. J. Exp. Psychol. 81, 174–176. doi: 10.1037/h0027448
Simon, J. R. (1990). “The effects of an irrelevant directional cue on human information processing,” in Stimulus-Response Compatibility: An Integrated Perspective, eds R. W. Proctor and T. G. Reeve (Amsterdam: North Holland), 31–86. doi: 10.1016/S0166-4115(08)61218-2
Sokoliuk, R., Mayhew, S. D., Aquino, K. M., Wilson, R., Brookes, M. J., Francis, S. T., et al. (2019). Two Spatially distinct posterior alpha sources fulfill different functional roles in attention. J. Neurosci. 39, 7183–7194. doi: 10.1523/JNEUROSCI.1993-18.2019
Sperling, G. (1960). The information available in brief visual presentations. Psychol. Monogr. Gen. Appl. 74, 1–29. doi: 10.1037/h0093759
Tadel, F., Baillet, S., Mosher, J. C., Pantazis, D., Leahy, R. M. (2011). Brainstorm: a user-friendly application for MEG/EEG analysis. Comput. Intell. Neurosci. 2011, 879716. doi: 10.1155/2011/879716
Thaler, L., Schütz, A. C., Goodale, M. A., Gegenfurtner, K. R. (2013). What is the best fixation target? The effect of target shape on stability of fixational eye movements. Vis. Res. 76, 31–42. doi: 10.1016/j.visres.2012.10.012
Thut, G., Niezel, A., Brandt, S. A., Pascual-Leone, A. (2006). Alpha-band electroencephalographic activity over occipital cortex indexes visuospatial attention bias and predicts visual target detection. J. Neurosci. 26, 9494–9502. doi: 10.1523/JNEUROSCI.0875-06.2006
Trujillo, L. T., Allen, J. J. B. (2007). Theta EEG dynamics of the error-related negativity. Clin. Neurophysiol. 118, 645–668. doi: 10.1016/j.clinph.2006.11.009
Van der Lubbe, R. H. J., Abrahamse, E. L., De Kleine, E. (2012). The premotor theory of attention as an account for the Simon effect. Acta Psychol. 140, 25–34. doi: 10.1016/j.actpsy.2012.01.011
Van der Lubbe, R. H. J., Bundt, C., Abrahamse, E. L. (2014). Internal and external spatial attention examined with lateralized power spectra. Brain Res. 1583, 179–192. doi: 10.1016/j.brainres.2014.08.007
Van der Lubbe, R. H. J., De Kleine, E., Rataj, K. (2019). Dyslexic individuals orient but do not sustain visual attention: electrophysiological support from the lower and upper alpha bands. Neuropsychologia 125, 30–41. doi: 10.1016/j.neuropsychologia.2019.01.013
Van der Lubbe, R. H. J., Jaśkowski, P., Wauschkuhn, B., Verleger, R. (2001). Influence of time pressure in a simple response task, a choice-by-location task, and the Simon task. J. Psychophysiol. 15, 241–255. doi: 10.1027//0269-8803.15.4.241
Van der Lubbe, R. H. J., Szumska, I., Fajkowska, M. (2016). Two sides of the same coin: ERP and Wavelet analyses of visual potentials evoked and induced by task-relevant faces. Adv. Cogn. Psychol. 12, 150–164. doi: 10.5709/acp-0195-3
Van der Lubbe, R. H. J., Utzerath, C. (2013). Lateralized power spectra of the EEG as an index of visuospatial attention. Adv. Cogn. Psychol. 9, 184–201. doi: 10.5709/acp-0144-7
Van Driel, J., Ridderinkhof, K. R., Cohen, M. X. (2012). Not all errors are alike: theta and alpha EEG dynamics relate to differences in error-processing dynamics. J. Neurosci. 32, 16795–16806. doi: 10.1523/JNEUROSCI.0802-12.2012
Van Ede, F., Board, A. G., Nobre, A. C. (2020). Goal-directed and stimulus-driven selection of internal representations. Proc. Natl. Acad. Sci. U. S. A. 202013432. doi: 10.1073/pnas.2013432117
Van Ede, F., Nobre, A. C. (2021). Toward a neurobiology of internal selective attention. Trends Neurosci. 44, 513–515. doi: 10.1016/j.tins.2021.04.010
Waldhauser, G. T., Braun, V., Hanslmayr, S. (2016). Episodic memory retrieval functionally relies on very rapid reactivation of sensory information. J. Neurosci. 36, 251–260. doi: 10.1523/JNEUROSCI.2101-15.2016
Willems, N. (2020). Overlap Between Internal and External Spatial Attention Over Longer Time Intervals (Master thesis). University of Twente. Student Theses. Available online at: https://essay.utwente.nl/80365 (accessed February 27, 2023).
Worden, M. S., Foxe, J. J., Wang, N., Simpson, G. (2000). Anticipatory biasing of visuospatial attention indexed by retinotopically specific α-band electroencephalography increases over occipital cortex. J. Neurosci. 20, 1–6. doi: 10.1523/JNEUROSCI.20-06-j0002.2000
Zhigalov, A., Jensen, O. (2020). Alpha oscillations do not implement gain control in early visual 462 cortex but rather gating in parieto-occipital regions. Hum. Brain Mapp. 41, 5176–5186. doi: 10.1002/hbm.25183
Zhigalov, A., Jensen, O. (2022). Travelling waves observed in MEG data can be explained by two discrete sources. bioRxiv [Preprint]. doi: 10.1101/2022.09.28.509870
Zhou, Y., Curtis, C. E., Sreenivasan, K. K., Fougnie, D. (2022). Common neural mechanisms control attention and working memory. J. Neurosci. 42, 7110–7120. doi: 10.1523/JNEUROSCI.0443-22.2022
Zuure, M. B., Cohen, M. X. (2021). Narrowband multivariate source separation for semi-blind discovery of experiment contrasts. J. Neurosci. Methods 350, 109063. doi: 10.1016/j.jneumeth.2020.109063
Keywords: internal spatial attention, external spatial attention, EEG, lateralized alpha power, lateralized theta power, source connectivity
Citation: Van der Lubbe RHJ, Panek B, Jahangier I and Asanowicz D (2023) Lateralized connectivity in the alpha band between parietal and occipital sources when spatial attention is externally and internally directed. Front. Cognit. 2:1145854. doi: 10.3389/fcogn.2023.1145854
Received: 16 January 2023; Accepted: 21 February 2023;
Published: 15 March 2023.
Edited by:
Stefano Lasaponara, Faculty of Medicine and Psychology, Sapienza University of Rome, ItalyReviewed by:
Julie A. Onton, University of California, San Diego, United StatesLeanne Chukoskie, Northeastern University, United States
Copyright © 2023 Van der Lubbe, Panek, Jahangier and Asanowicz. This is an open-access article distributed under the terms of the Creative Commons Attribution License (CC BY). The use, distribution or reproduction in other forums is permitted, provided the original author(s) and the copyright owner(s) are credited and that the original publication in this journal is cited, in accordance with accepted academic practice. No use, distribution or reproduction is permitted which does not comply with these terms.
*Correspondence: Rob H. J. Van der Lubbe, ci5oLmoudmFuZGVybHViYmVAdXR3ZW50ZS5ubA==