 Daniel S. Cooper1*
 Eric M. Wood2
 Nurit D. Katz3
 Kat Superfisky4
 Fiona M. Osborn5
 Anna Novoselov6
 Jo Tarczynski6
 Lara K. Bacasen7
- 1Department of Ecology and Evolutionary Biology, University of California, Los Angeles, Los Angeles, CA, United States
- 2Department of Biological Sciences, California State University Los Angeles, Los Angeles, CA, United States
- 3Department of Sustainability, University of California, Los Angeles, Los Angeles, CA, United States
- 4Department of City Planning, City of Los Angeles, Los Angeles, CA, United States
- 5Department of Geography, University of California, Los Angeles, Los Angeles, CA, United States
- 6Institute of Environment and Sustainability, University of California, Los Angeles, Los Angeles, CA, United States
- 7Department of Ecology and Evolutionary Biology, University of California, Los Angeles, Los Angeles, CA, United States
Urbanization is a major driver of global species loss. While cities with suitable habitats and conservation policies may support locally-high biodiversity levels, we suspected that the complexity of managing very large cities might counteract the advantage of large geographic area, and these cities may be less effective at biodiversity conservation. To answer this, we examined the relationship between the number of native indicator wildlife species (mean and maximum) in 112 cities across three metropolitan areas in California (Los Angeles, San Diego, and San Jose), with metrics related to scale and environmental variables. We found that indicator species richness is positively related to area, income (the luxury effect), and pervious cover—including trees, shrubs, and grasses. Despite having a high maximum number of indicator species within their boundaries, the largest cities in our study, Los Angeles, San Jose, and San Diego, do a relatively poor job compared with smaller cities at distributing native biodiversity throughout neighborhoods, as measured by their mean species richness. Such variation in “neighborhood biodiversity” may exacerbate existing inequities in residents' access to nature. Using Los Angeles County as a case study, we compared biodiversity management within the County's 88 cities of various sizes and characteristics. We ranked General Plan wording in terms of references to biodiversity and conservation and created a management metric. We found that municipalities of various sizes that had high management scores generally had high indicator species richness. This suggests that robust policies may be able to overcome the challenges posed by city size and population.
Introduction
Globally, metropolitan areas continue to grow in size (Grimm et al., 2015). Los Angeles County (L.A. County) alone spans over 4,753 miles squared (1.2M ha), a land area equivalent to four Yosemite National Parks. The City of Los Angeles, by far the largest in L.A. County with four million people, has set a goal of no net loss of biodiversity by 2050 (https://plan.lamayor.org/targets/targets_plan.html). It faces major challenges in implementation, including budgetary challenges and complex governance—a conundrum shared by most cities (Pregitzer et al., 2020). Biodiversity loss shows no sign of slowing (Wilting et al., 2017; McDonald et al., 2019), and understanding how cities of various sizes and settings support and manage biodiversity will be key in achieving conservation goals in the coming decades (Spotswood et al., 2021). Urban biodiversity often depends on the maintenance of often overlooked “informal open space,” for example, in unprotected fragments of undeveloped land behind houses, along rail lines, highway verges, and vegetated storm drain channels (Faeth et al., 2011). These areas are now understood to be critical to conserving biodiversity within urban areas (e.g., Beninde et al., 2015; Wintle et al., 2019) but are often not addressed in management plans.
Uchida et al. (2020) presented a framework for understanding urban biodiversity conservation and management at different scales. The authors point to the ongoing development of “novel ecosystems” in highly-urbanized areas which demand that “alternative management goals should be applied to large cities that recognize these new dynamic realities.” At the same time, the biodiversity of cities is strongly influenced by their ecological setting (Spotswood et al., 2021), making generalizing across biomes challenging. We suggest that larger cities may be able to support high levels of diversity, yet may ultimately fail to protect their own biological resources due to population pressure overwhelming management resources. This failure to protect biodiversity in cities robs its populace of the health and wellness benefits of access to nature (see Panlasigui et al., 2021).
We examined how scale interacts with species richness by characterizing and comparing levels of biodiversity, as measured by wildlife indicator species richness, in individual cities within three separate metropolitan areas in the state of California (Los Angeles, San Diego, and San Jose). Further, we used municipalities within Los Angeles County as a case study to demonstrate how scale relates to the management of biodiversity across cities of different sizes in similar ecological settings, by examining the General Plans and policies related to biodiversity. We explored how “success” in biodiversity conservation scales with city size (area), population, degree of urbanization (as defined by % pervious cover), and other factors.
Measuring Biodiversity in Urban Areas
We used an indicator species framework (Siddig et al., 2015) of 17 widespread, easily-identifiable native terrestrial wildlife species characteristic of natural communities of California. Several of these also occur in suburban and urban settings with some natural habitat, including in the wildland areas that surround each of our focal metropolitan regions (refer to Supplemental Material for list and description of species). We do not treat non-native species as part of biodiversity, because they largely do not contribute to global biodiversity in the same way as native species (Pauchard et al., 2018). We downloaded confirmed, geo-referenced sightings from the Global Biodiversity Information Center (GBIF) submitted between January 1, 2016 and April 23, 2021, and overlaid a 1 km × 1 km grid across each city in each of three metropolitan areas within the California Floristic Province, Los Angeles (n = 88 cities; 98,226 observations), San Diego (n = 18 cities; 72,115 observations), and San Jose (n = 14 cities; 94,433 observations), to calculate both the mean count of indicator species in each grid cell (within each city), as well as the maximum count of indicator species for each city. We term these variables “mean richness” and “maximum richness” throughout.
Species Richness and Scale
Incorporating the “Urban Biodiversity Assessment Framework” introduced by Li et al. (2019), we used public databases to assemble independent variables that we hypothesized would explain patterns of indicator species richness (Supplementary Table 2). We demarcated four variables that were associated with “city scale,” including total (city) area, human population, human population density, and median income; and five variables that we categorized as “environmental variables,” including the percent cover of agriculture, water, tree, shrub/grass, and pervious surface (see Supplementary Table 3 for values of selected variables).
To understand relationships of scale and environmental variables with mean and maximum richness (dependent variables), we fitted linear-mixed models, with “County” as a random effect (random shift in the intercept based on County status) to account for sources of variation that were not attributable to our dataset (e.g., political differences among counties that may influence conservation planning). We assessed all model assumptions using the “qqnorm” function in the R statistical software package R Core Team., 2019 and if we found hump-shaped patterns based on visual inspections of initial scatterplots, we included a quadratic term. As many of the metrics were highly correlated (Supplementary Figure 1), we did not assess multiple variable models due to collinearity issues. Rather, we fitted univariate models of either scale or environmental variables against the two dependent variables and ranked models within a set using AIC (Supplementary Table 4). This approach enabled us to identify the top predictor scale and environmental variables. We fitted the linear mixed models using the “lme4” (Bates et al., 2015) and “lmerTest” packages (Kuznetsova et al., 2017), and we created all plots using the “ggplot2” (Wickham, 2016) and “ggpubr” (Kassambara, 2020) packages in R.
The top models for explaining maximum richness were the scale variable Area and the environmental variable Pervious (Supplementary Table 4). We observed an inflection point around the 0.10 value of Pervious for both maximum and mean richness, suggesting that cities should maintain a minimum of 10% of their land undeveloped to retain high biodiversity levels. Population Density was the top scale predictor variable for mean richness, whereas the cover of shrubs and grasses was the top environmental model explaining mean richness. Nearly all models we fit had significant slopes, indicating that a variety of scale and environmental factors influence richness patterns of indicator species in the cities examined. We report additional correlations between indicator species richness and scale variables in Supplementary Figure 1, including a positive relationship (quadratic) of both maximum and mean richness with income, which appears to support the “luxury effect,” where affluent areas tend to support more vegetation and parks, and thereby more wildlife (Leong et al., 2018; Schell et al., 2020; Wood and Esaian, 2020).
Neighborhood Biodiversity
One may think of mean richness as a “neighborhood biodiversity” variable, as it represents the “saturation” of indicator species across an entire city. Looking at neighborhood biodiversity as a function of area, we see that the positions of the largest three cities in each metropolitan area drop when compared to their rank in maximum richness to area, as some smaller and mid-sized ones rise toward the top (Figure 1). More than 20 cities (of 112 examined) have higher neighborhood biodiversity scores than the largest city (Los Angeles) (Figure 1B). Although these cities have high levels of indicator species in natural areas such as parks, wildlife preserves, and open space, they also have many “dead” grid cells in the largest cities—where no indicator species have been observed, and where few are likely to exist due to low perviousness and near total lack of native habitat (e.g., South LA), resulting in unequal distribution of biodiversity. Thus, one needs to consider both max and mean, because unevenly distributed biodiversity results in some neighborhoods being deprived of nature, producing unequal access to the benefits of biodiversity. From a wildlife perspective, less-evenly distributed biodiversity may mean lower levels of habitat connectivity, which would be expected to eventually reduce overall species richness (Vega and Küffer, 2021).
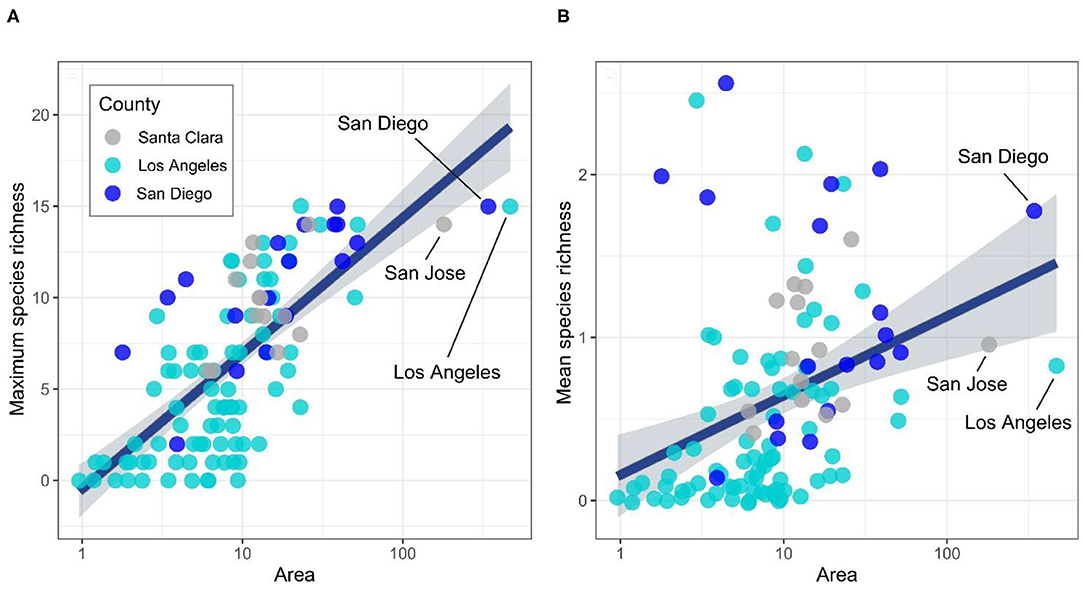
Figure 1. Scatterplot and least-squares fitted line with confidence intervals (gray shaded area) depicting the relationship between city size (Area) and (A) maximum and (B) mean indicator species richness. Each dot represents a city, and colors denote the county of city origin. The three largest cities of this analysis are marked for visualization purposes. In (B), we noted that while all three largest cities fall significantly in their ranking in mean species, San Diego lies above the fit line, whereas Los Angeles and San Jose fall below.
Los Angeles County as a Case Study for Biodiversity Management
We selected Los Angeles County as a case study to examine biodiversity management and scale due to the high variation in size, population, income level, and land development characteristics of its cities. We evaluated General Plans and related policies and ordinances from each city in L.A. County, and assigned a score based on references to biodiversity and conservation to create a metric, which we term “biodiversity management score” (see Nilon et al., 2017). The policies and ordinances we focused on were based on best practices identified by Los Angeles Sanitation and Environment (LASAN), including the Conservation and Open Space Elements of the General Plans, tree ordinances, and landscape ordinances.
We noted the dates of plan approvals as well as any language related to biodiversity such as “biodiversity,” “nature,” “wildlife,” “species conservation,” and “native species.” To develop the biodiversity management score (0–4 points), we first assigned each city 2 points if these plans made specific reference to preserving and supporting biodiversity citywide; a score of 1 point if they made only vague reference to citywide biodiversity, or in cases where such policies were only designed for a portion of the city (e.g., a single reserve or park); and a score of 0 in cases where plans failed to set forth any policies relating to biodiversity (mean = 1.55, SE = 0.166). We provide sample excerpts of this wording in Table 1. In addition, we added single points in cases where cities had commissioned either a citywide or specific EIR addressing development (1 point), and if they had landscaping and/or tree ordinances that promoted native species (1 point). We note that many “conservation” policies may not have been driven by supporting biodiversity (e.g., the use of drought tolerant plants may have a goal of reducing water use). We also note that a city's policies may purport to support conservation, but do not explicitly mention biodiversity, habitat, or species protection; in these cases, we used our collective judgment in evaluating whether these would be counted as promoting biodiversity. For example, Chapter 26 of the City of West Covina's 1999 Municipal Code defines the main goals of protecting trees as “preserving the cultural and historic heritage they represent, as well as promoting beauty, mitigating erosion, improving air quality and enhancing the city's environment.” In this case, biodiversity conservation was not explicitly mentioned and only implied.
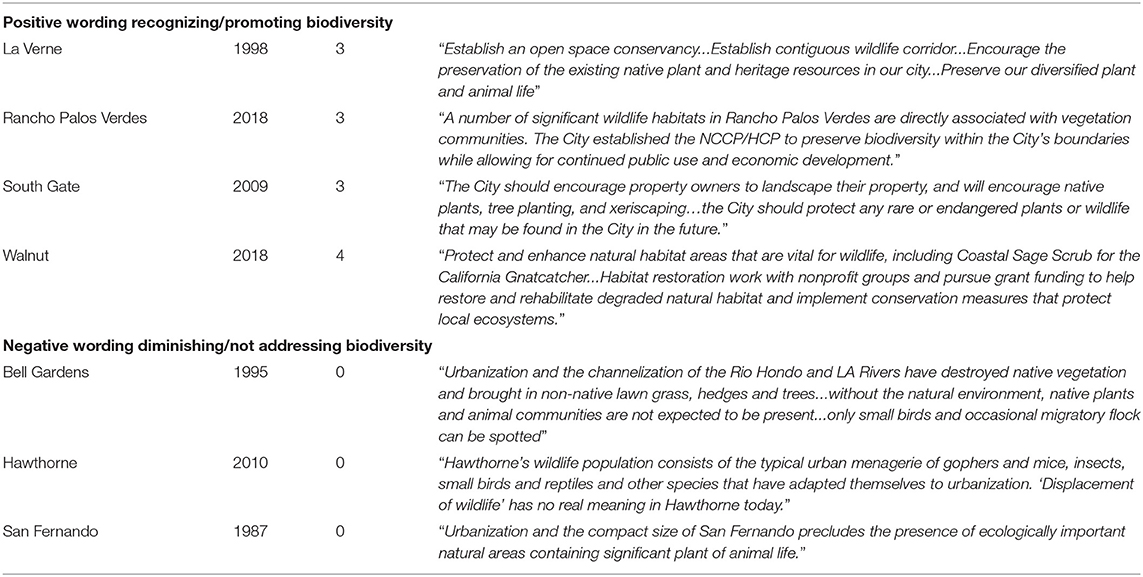
Table 1. Excerpts from General Plans and related elements, Los Angeles County cities.
Out of the 88 cities examined in L.A. County, we found only three that explicitly mentioned the term “biodiversity.” We found “Biological Resources” sections in some General Plans, which contained valuable biodiversity policies (notably those of Westlake Village, Arcadia, and La Verne). We found that several cities appeared to recognize their rare and endangered habitats or species as protected/important resources, specifically calling out the names of species like the Federally Threatened California Gnatcatcher (Polioptila californica) in the case of Montebello or the Federally Endangered El Segundo blue butterfly (Euphilotes allyni) in Redondo Beach. More than a third of the cities in L.A. County (34 of 88) received biodiversity management scores of zero, indicating no specific wording related to biodiversity in their General Plans and related documents.
We compared patterns of maximum and mean richness, along with top performing models from the mixed-model analysis, to the biodiversity management scores, using one-way analysis of variance (ANOVA). If the initial model was significant, we employed a Tukey–Kramer multiple-comparisons routine to assess significance among biodiversity management score categories. As there were 10 comparisons among the five biodiversity management score categories, we used a Bonferroni adjusted to the alpha-value (α = 0.05/10 = 0.005) to assess significance among paired comparisons (see Appendix B for full results). We found that the degree of development appears to closely track management score, in that the less-developed cities (i.e., those with more pervious land) had much higher management scores than fully-urbanized cities. Further, we found that maximum and mean richness were higher in municipalities with a high management score (Figure 2; see Appendix B for ANOVA results).
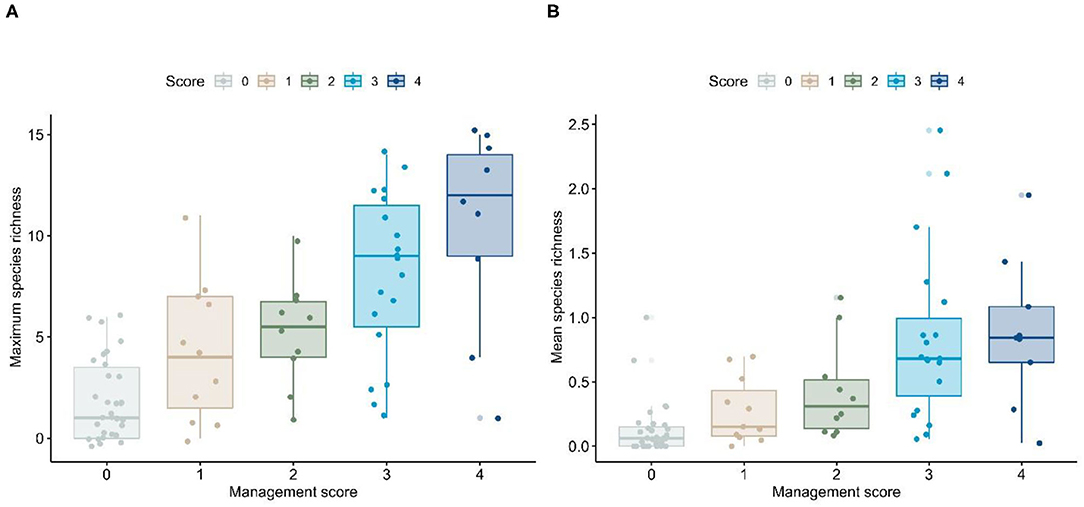
Figure 2. Patterns of (A) maximum and (B) mean species richness based on management score for Los Angeles County cities. Horizontal lines within a box plot represent the median value, whereas the limits of a box represent the first and third quartiles. Lines extending beyond a box represent the general range of data, and dots represent cities. Some dots appear below the zero value. However, there are no values <0. Rather, we display dots using a “jitter” function to allow visualization of overlapping points.
While the highest-scoring cities were both wealthier and larger than the lowest-scoring ones, interesting exceptions were frequent. Several small and urbanized cities appear to be “punching above their weight” in biodiversity management planning, such as tiny Cudahy—a city with the fifth-lowest median income of the 88 cities evaluated, almost no indicator species (1 of 17), and no measurable undeveloped pervious surface. Though results are years away, its General Plan has multiple references to the importance of nature and native habitats, including one of its Open Space and Conservation policies (OSCE 1.16) that directs the city to “Promote and participate in efforts to restore the riparian environment of the Los Angeles River and facilitate its use for educational and recreational uses.” Because the Los Angeles River is fully-cemented and channelized through Cudahy, we have categorized such statements as “aspirational,” and feel they represent an acknowledgment of (lost) biodiversity, are sensitive to a broader environmental setting, and reflect regional conservation goals such as restoring the rich riparian and wetland habitats that once characterized the lower Los Angeles and San Gabriel river systems (Stein et al., 2010). Our analysis also highlights cities that are opposite, with high levels of biodiversity or undeveloped land and lacking in robust statements and policies. These cities, such as Irwindale, Palos Verdes Estates, San Marino, and Pomona should be considered at highest risk of biodiversity loss due to lack of protection for important habitat areas.
We found that large cities were more likely to have multiple plans specifically related to environmental issues/conservation (e.g., Pasadena boasts an “urban wildlife management plan” related to co-existence with coyote Canis latrans and black bear Ursus americanus). By contrast, we found that many of the smaller, more urbanized cities lack biodiversity policies, often claiming to not support natural habitats or rare/endangered species, or any significant wildlife at all in some cases. While this may be true for some small urbanized cities (e.g., Bell, Huntington Park, and Commerce), other small cities may actually have sensitive species and habitats, yet have not committed resources to surveying or protecting them, in contrast to neighboring cities with similar and often contiguous habitat (cf. Hermosa Beach and Redondo Beach). Hermosa Beach makes little reference to sensitive species or habitat restoration whereas Redondo Beach has numerous specific references, e.g., “Revegetate the bluffs with native plants and reintroduce the Federally Endangered species, the El Segundo Blue Butterfly (Euphilotes bernardino allyni).”
In addition to examining L.A. County, we also reviewed the policies and plans for the largest cities of each of the three counties we studied to determine if there was a difference in management in San Diego that might account for the much higher mean richness as compared to Los Angeles and San Jose (referenced in the Species Richness and Scale section, above). The City of San Diego is notable for its pioneering multi-species conservation planning, specifically the Natural Communities Conservation Plan (https://wildlife.ca.gov/Conservation/Planning/NCCP/Plans/San-Diego-MSCP), one of the first of its kind in the nation. While the City of Los Angeles has a growing biodiversity program in the Bureau of Sanitation and Environment (LASAN; https://www.lacitysan.org), it does not share this long history of more comprehensive species conservation. The City of San Diego also lacks the areas of fully urbanized flats that characterize the City of Los Angeles, and to a lesser extent San Jose, which may also account for differences in mean richness. We cannot conclude definitively whether high species richness is a result of conservation plans in place, or simply a result of ecological context and conditions that existed before plans were conceived.
Discussion
Should we care more about maximizing biodiversity within cities (maximum richness), or distribution (mean richness)? This question recalls the perennial “single large or several small (SLOSS)” debate in conservation, and is simply not resolvable. Both are important for different reasons. We argue that the growth of cities has implications for the equitable distribution of biodiversity, which is particularly concerning with the continued global population expansion into urban areas United Nations Department of Economics Social Affairs, 2018. Given the propensity of cities with limited pervious surfaces (i.e., lacking in undeveloped open space) to have very few indicator species and scores of zero in our ranking of biodiversity management policies, it seems likely that urbanization and species loss becomes something of a self-fulfilling prophecy. Policy-makers and the public view urbanized areas of the city as ecologically “irredeemable” and resist efforts to conserve and restore elements of nature that would have outsized relevance to (human) residents of such neighborhoods, many of whom are economically and socially marginalized, and frequently excluded from discussions around conservation science (Evans, 2021). This feedback loop denying the importance of natural systems while permitting more development (and less land conservation) is evident in the language of certain cities' plans (Table 1).
Many cities we evaluated claimed to have no open space or protected species, and thus had no provisions for wildlife and habitat preservation. Most General Plans, and many open space elements, did not acknowledge the existence and importance of “informal open spaces” that stand in contrast to the expanses of residential and commercial landscaping characteristic of many California cities which are often comprised of globally-widespread taxa and often provide a vector for invasive species. Infill development or small sliver development and accessory dwelling unit (ADU) development, while useful in reducing other impacts like commute emissions, represent a threat to biodiversity in urban areas as they diminish and degrade the pockets of habitat that boost neighborhood biodiversity, and sever the habitat connectivity that species depend on to persist in and move through cities. We argue that species in these interstitial fragments will require robust city biodiversity policies to thrive in the future. Such policies also represent the best hope of rewilding what has already been lost.
The fact that biodiversity management score is related to mean and maximum richness but is not related to the scale variables of city area, income, or population size (Supplementary Table 5) suggests that great potential exists for a wide range of cities to enact meaningful policies that could enhance biodiversity, and for large cities to address gaps in “neighborhood biodiversity.” As the field of urban biodiversity management evolves, we hope to see more standardized policy approaches enabling more meaningful and swift comparisons. We emphasize however, that the existence of biodiversity goals does not guarantee implementation or enforcement of policies. The effectiveness of these plans can only be measured on a longer timeframe, against a known baseline and would be worth further study.
Data Availability Statement
The original contributions presented in the study are included in the article/Supplementary Material, further inquiries can be directed to the corresponding author/s.
Author Contributions
DC conceived of the paper, gathered and analyzed data, and wrote the majority of the early drafts, including tables. EW devised the statistical analysis, produced figures, and contributed to writing and editing. NK contributed to the analysis, structure, framing of the concept, data collection, writing, and editing. KS contributed conceptual ideas, early writing, and editing. FO collected data and conducted the spatial analysis. AN collected data and contributed to writing and editing. JT and LB collected data. All authors met regularly and collaborated on the project in dialogue.
Conflict of Interest
The authors declare that the research was conducted in the absence of any commercial or financial relationships that could be construed as a potential conflict of interest.
Publisher's Note
All claims expressed in this article are solely those of the authors and do not necessarily represent those of their affiliated organizations, or those of the publisher, the editors and the reviewers. Any product that may be evaluated in this article, or claim that may be made by its manufacturer, is not guaranteed or endorsed by the publisher.
Supplementary Material
The Supplementary Material for this article can be found online at: https://www.frontiersin.org/articles/10.3389/fcosc.2021.734931/full#supplementary-material
References
Bates, D., Mächler, M., Bolker, B., and Walker, S. (2015). Fitting linear mixed-effects models using lme4. J. Stat. Softw. 67, 1–48. doi: 10.18637/jss.v067.i01
Beninde, J., Veith, M., and Hochkrich, A. (2015). Biodiversity in cities needs space: a meta-analysis of factors determining intra-urban biodiversity variation. Ecol. Lett. 18, 581–592. doi: 10.1111/ele.12427
Evans, M. C. (2021). Re-conceptualizing the role(s) of science in biodiversity conservation. Environ. Conserv. 48, 151–160. doi: 10.1017/S0376892921000114
Faeth, S. H., Bang, C., and Saari, S. (2011). Urban biodiversity: patterns and mechanisms. Ann. N Y Acad Sci. 1223, 69–81. doi: 10.1111/j.1749-6632.2010.05925.x
Grimm, N. B., Faeth, S. H., Golubiewski, N. E., Redman, C. L., Wu, J., Bai, X., et al. (2015). Global change and the ecology of cities. Science 319, 756–760. doi: 10.1126/science.1150195
Kassambara, A. (2020). ggpubr: ‘ggplot2’ Based Publication Ready Plots. R Package Version 0.3.0. Available online at: https://CRAN.R-project.org/package=ggpubr (accessed June 25, 2021).
Kuznetsova, A., Brockhoff, P. B., and Christensen, R. H. B. (2017). lmerTest Package: tests in linear mixed effects models. J. Stat. Softw. 82, 1–26. doi: 10.18637/jss.v082.i13
Leong, M., Dunn, R. R., and Trautwein, M. D. (2018). Biodiversity and socioeconomics in the city: a review of the luxury effect. Biol. Lett. 14:20180082. doi: 10.1098/rsbl.2018.0082
Li, E., Parker, S. S., Pauly, G. B., Randall, J. M., Brown, B. V., and Cohen, B. S. (2019). An urban biodiversity assessment framework that combines an urban habitat classification scheme and citizen science data. Front. Ecol. Evol. 7:277doi: 10.3389/fevo.2019.00277
McDonald, R. I., Mansur, A. V., Ascensão, F., Colbert, M., Crossman, K., and Elmqvist, T. (2019). Research gaps in knowledge of the impact of urban growth on biodiversity. Nat. Sustain. 3, 16–24. doi: 10.1038/s41893-019-0436-6
Nilon, C. H., Aronson, M. F. J., Cilliers, S. S., Dobbs, C., Frazee, L. J., Goddard, M. A., et al. (2017). Planning for the future of urban biodiversity: a global review of city-scale initiatives. BioScience 67, 332–342. doi: 10.1093/biosci/bix012
Panlasigui, S., Spotswood, S. E., Beller, E., and Grossinger, R. (2021). Biophilia beyond the building: applying the tools of urban biodiversity planning to create biophilic cities. Sustainability 13:2450. doi: 10.3390/su13052450
Pauchard, A., Meyerson, L. A., Bacher, S., Blackburn, T. M., Brundu, G., Cadotte, M. W., et al. (2018). Biodiversity assessments: origin matters. PLoS Biol. 16:e2006686. doi: 10.1371/journal.pbio.2006686
Pregitzer, C. C., Charlop-Powers, S., and Bradford, M. A. (2020). Natural area forests in U.S. cities: opportunities and challenges. J. For. 119, 141–151. doi: 10.1093/jofore/fvaa055
R Core Team. (2019). R: A Language and Environment for Statistical Computing. Vienna: R Foundation for Statistical Computing. Available online at: https://www.R-project.org/ (accessed June 25, 2021).
Schell, C. J., Dyson, K., Fuentes, T. L., Des Roches, S., Harris, N. C., Miller, D. S., et al. (2020). The ecological and evolutionary consequences of systemic racism in urban environments. Science 369:6510. doi: 10.1126/science.aay4497
Siddig, A. A. H., Ellison, A. M., Ochs, A., Villar-Leeman, C., and Lau, M. K. (2015). How do ecologists select and use indicator species to monitor ecological change? Insights from 14 years of publication in Ecological Indicators. Ecol. Indic. 60, 223–230. doi: 10.1016/j.ecolind.2015.06.036
Spotswood, E. N., Beller, E. E., Grossinger, R., Grenier, J. L., Heller, N. E., and Aronson, M. F. J. (2021). The biological deserts fallacy: cities in their landscapes contribute more than we think to regional biodiversity. BioScience 71, 148–160. doi: 10.1093/biosci/biaa155
Stein, E., Dark, S., Longcore, T., Grossinger, R., Hall, N., and Beland, M. (2010). Historical ecology as a tool for assessing landscape change and informing wetland restoration priorities. Wetlands 30, 58–601. doi: 10.1007/s13157-010-0050-x
Uchida, K., Blakey, R. V., Burger, J. R., Cooper, D. S., Niesner, C. A., and Blumstein, D. T. (2020). Opinion: urban biodiversity and the importance of scale. Trends Ecol. Evol. 36, 123–131. doi: 10.1016/j.tree.2020.10.011
United Nations Department of Economics Social Affairs (2018). 68% of the World Population Projected to Live in Urban Areas by 2050 Says UN. Available online at: https://tinyurl.com/wupcvc73 (accessed March 28, 2021).
Vega, K. A., and Küffer, C. (2021). Promoting wildflower biodiversity in dense and green cities: the important role of small vegetation patches. Urban For. Urban Green. 62:127165. doi: 10.1016/j.ufug.2021.127165
Wickham, H. (2016). ggplot2: Elegant Graphics for Data Analysis. New York, NY: Springer-Verlag. ISBN 978-3-319-24277-4. Available online at: https://ggplot2.tidyverse.org (accessed June 25, 2021).
Wilting, H. C., Schipper, A. M., Bakkenes, M., Meijer, J. R., and Huijbregts, M. A. J. (2017). Quantifying biodiversity loss due to human consumption: a global-scale footprint analysis. Environ. Sci. Technol. 51, 3298–3306. doi: 10.1021/acs.est.6b05296
Wintle, B. A., Kujala, H., Whitehead, A., Cameron, A., Veloz, S., Kukkala, A., et al. (2019). Global synthesis of conservation studies reveals the importance of small habitat patches for biodiversity. Proc. Natl. Acad. Sci. U. S. A. 116, 909–914. doi: 10.1073/pnas.1813051115
Keywords: urban ecology, scale, distribution, equity, urbanization, urban ecosystem, biodiversity
Citation: Cooper DS, Wood EM, Katz ND, Superfisky K, Osborn FM, Novoselov A, Tarczynski J and Bacasen LK (2021) Large Cities Fall Behind in “Neighborhood Biodiversity”. Front. Conserv. Sci. 2:734931. doi: 10.3389/fcosc.2021.734931
Received: 01 July 2021; Accepted: 29 September 2021;
Published: 27 October 2021.
Edited by:
Mayukh Chatterjee, Wildlife Trust of India, IndiaReviewed by:
Shelly L. Volsche, Boise State University, United StatesNishant Kumar, Wildlife Institute of India, India
Copyright © 2021 Cooper, Wood, Katz, Superfisky, Osborn, Novoselov, Tarczynski and Bacasen. This is an open-access article distributed under the terms of the Creative Commons Attribution License (CC BY). The use, distribution or reproduction in other forums is permitted, provided the original author(s) and the copyright owner(s) are credited and that the original publication in this journal is cited, in accordance with accepted academic practice. No use, distribution or reproduction is permitted which does not comply with these terms.
*Correspondence: Daniel S. Cooper, ZGFuQGNvb3BlcmVjb2xvZ2ljYWwuY29t