 Jamey D. McClinton
 Sarah M. Kulpa3
 Elizabeth A. Leger
- 1Department of Biology, University of Nevada, Reno, Reno, NV, United States
- 2Nevada Department of Conservation and Natural Resources, Division of Natural Heritage, Carson, NV, United States
- 3United States Department of Interior, Fish and Wildlife Service, Reno, NV, United States
Introduction: Rare plant species comprise >36.5% of the world’s flora and disproportionately support ecosystem function and resilience. However, rare species also lead global plant extinctions, and unique ecological characteristics can make them vulnerable to anthropogenic pressure. Despite their vulnerability, many rare plants receive less monitoring than is needed to inform conservation efforts due to limited capacity for field surveys.
Methods: We used field observations and geospatial data to summarize how 128 imperiled, rare vascular plant species in Nevada are affected by various threats. We assessed correlations between threats predicted by geospatial data and threats observed on the ground and asked how historic and current threats compare.
Results: The most commonly observed threats were from recreation, invasive and non-native/alien species, and livestock farming and ranching. Threat prevalence varied by elevation (e.g., a greater variety of threats at lower elevations, greater threat from climate change observed at higher elevations) and land management. There was a 28.1% overall correlation between predicted and observed threats, which was stronger for some threats (e.g., development of housing and urban areas, livestock farming and ranching) than others. All species experienced extreme climatic differences during 1990-2020 compared to baseline conditions, with the most extreme change in southern Nevada. The average number of threats observed per occurrence increased by 0.024 each decade.
Discussion: While geospatial data did not perfectly predict observed threats, many of these occurrences have not been visited in over 30 years, and correlations may be stronger than we were able to detect here. Our approach can be used to help guide proactive monitoring, conservation, and research efforts for vulnerable species.
Introduction
Plants are foundational in nearly all environments that sustain macro-organisms, supporting biological diversity and ecosystem function. However, plants are often overlooked by the public and by the conservation community (Balding and Williams, 2016), and are consequently under-represented in the designation of protected areas and receipt of conservation funding in the United States (Havens et al., 2014; Negrón-Ortiz, 2014). This is in direct contrast to threats: in the United States, over 31% of native plant species are considered at risk of extinction (Negrón-Ortiz, 2014). The nature of threat varies by species; however, climate change and large, interconnected human populations underlie a multitude of factors that are driving increasing biodiversity declines globally and nationally (Duraiappah et al., 2005; Pimm et al., 2014; Nic Lughadha et al., 2020). These pressures can be especially devastating for rare species, which lead global extinctions (Pimm et al., 2014). Rare plants are species with low proportional abundance, surface cover, and/or number of occurrences in comparison with common species at either regional or global scales (Mouillot et al., 2013; Enquist et al., 2019). While not all rare species have been observed to be threatened and some are locally abundant (Lesica et al., 2006), all are inherently vulnerable to natural and anthropogenic threats because of small global populations, restricted geographic distributions, and/or specialized ecological requirements (Coates et al., 2015; Humphreys et al., 2019; Corlett and Tomlinson, 2020; Staude et al., 2020; Gosper et al., 2021).
Despite the relatively small proportion of the landscape occupied by rare plants in comparison with common species, their ecological value should not be underestimated— rare plant species comprise over 36.5% of the global flora (Enquist et al., 2019) and disproportionately contribute to supporting ecosystem function and diversity (Mouillot et al., 2013; Leitão et al., 2016; Dee et al., 2019). Rare plants are also economically valuable: they support outdoor recreation and ecotourism as sources of aesthetic beauty and spiritual inspiration, contribute to global food production (e.g., maintaining genetic diversity of staple crops, informing strategies for agriculture in challenging environments), and are used in medicine (e.g., novel pharmaceutical compounds) and bioremediation (e.g., heavy metal accumulation, pioneering species after disturbance), among many other benefits (Millennium Ecosystem Assessment, 2005; Corlett, 2018; Corlett, 2020). Thus, conservation of rare plant species in the face of rising threats is urgently needed and important from both ecological and human perspectives.
In the United States, laws protecting species that are currently or potentially at risk of extinction such as the Endangered Species Act of 1973, as amended (ESA), and other federal and state policies (e.g., BLM, 2008; USFS, 2005; NRS, 2012) place significant management responsibility for these species on public agencies (Havens et al., 2014). This creates unique opportunities for rare plant conservation in states such as Nevada, which is biologically diverse (home to >2,800 vascular plant species, of which 154 are endemic and 352 are rare and classified as vulnerable, imperiled, or critically imperiled by the Nevada Division of Natural Heritage) and has a high proportion of public land (>80%, second only to Alaska) where managers can enact changes in policy or infrastructure to protect rare species (Stein et al., 2000; Kier et al., 2005; NDNH, 2022). The state of Nevada (284,332 km2) encompasses large swaths of the Northern, Central, and Mojave Basin and Range ecoregions (cold deserts and northern portions of warm deserts) (Level III (II) Ecoregions, Omernik and Griffith, 2014), and represents core habitat for many plants and animals. Approximately 15% of all public land in the state is currently managed to minimize threats and prioritize rare species conservation while the rest is managed for multiple uses (Greenwald and Bradley, 2008; Bargelt et al., 2020; Gap Analysis Project, 2022). This is a relatively high proportion of protected land compared to other areas in the United States (Jenkins et al., 2015; Bargelt et al., 2020); however, there is evidence that existing protected areas do not fully encompass the range of imperiled biodiversity in the state, and that many species in Nevada face increasing threats even inside protected areas (Jenkins et al., 2015).
In order to prioritize site choices and funding for creation of additional protected areas or for implementation of other conservation strategies and monitoring, there is a need to understand the threats facing rare species in Nevada, particularly those that are considered imperiled or critically imperiled. These species occupy a variety of habitat types at all latitudes and elevations, including alkaline wetlands and meadows, salt desert scrub, outcrops of rock and scree, unique soils formed through processes such as hydrothermal alteration and weathering of sedimentary deposits, alluvial fans, sagebrush steppes, and coniferous forests and alpine zones in mountain ranges of granitic, andesitic, and limestone parent materials, among other habitat types (Morefield, 2001). Low average annual precipitation across the state exaggerates differences among habitats (especially for physiologically stressful substrates), contributes to often-slow ecosystem recovery after disturbances, and combines with geographic isolation among valleys and mountains in the Basin and Range to promote local adaptation, resulting in a taxonomically and biologically diverse suite of rare plants across the state (Wells, 1983; Harrison, 2015; Baughman et al., 2019). In the continental U.S., the most prevalent threats to rare plants include outdoor recreation, livestock, and residential development, all of which are under-studied relative to their prevalence (Hernández-Yáñez et al., 2016). No formal assessment has yet been performed that summarizes the prevalence of different threats for the rare plants of Nevada.
Our current understanding of threats to rare plants in the state stems primarily from individual species assessments and general knowledge of which threats are more or less likely to impact species based on their distributions within and outside of protected areas (e.g., Greenwald and Bradley, 2008; Caicco et al., 2012). Species with restricted distributions, such as many of the rare plants in Nevada, are less likely than common species to be represented in existing protected areas (Jenkins et al., 2015) and, despite the relatively high proportion of protected land in the state, 68% of all species classified by NatureServe as critically imperiled or imperiled in Nevada (including plants, mammals, birds, amphibians, reptiles, fishes, and invertebrates) have less than half of their occurrences on protected land (Greenwald and Bradley, 2008; NatureServe, 2021). Populations outside of protected areas face more threats and decline more rapidly than those within protected areas and are also usually less studied; therefore, species with high proportions of unprotected populations are the most vulnerable to extinction (Butchart et al., 2012; Akasaka et al., 2017; Cuena-Lombrana et al., 2021). Even within protected areas, where surface disturbances such as off-highway vehicle use and resource extraction are not allowed and land is managed for biodiversity preservation, rare plant species still face numerous threats such as trampling due to recreation, competition from invasive species, pollution such as nitrogen deposition, and climate change (Jones et al., 2018; Schulze et al., 2018). Therefore, understanding threats for species that occur both within and outside of protected areas is critical to successful conservation.
Limitations to monitoring have created interest in ways to predict what species or regions might be most threatened, and therefore most in need of monitoring attention; this knowledge could be used to efficiently allocate future conservation efforts for rare plants (Kramer and Havens, 2015; Corlett, 2020). Geospatial data are increasingly being used to aid in rare species conservation, from the use of remotely sensed data to identify suitable habitat and intensity of human influences (Gogol-Prokurat, 2011; Fois et al., 2018; Cerrejón et al., 2021) to models incorporating geoclimatic and biological variables to predict species’ responses to climate change (Anacker et al., 2013). Here, we aim to better understand the nature of known threats to imperiled and critically imperiled rare plants in Nevada, and to ascertain to what degree geospatial data can be used to predict threats to rare species. To our knowledge, this is the first study to compare the correlation between predicted and observed threats in this way and could create a new method for prioritizing the monitoring of remote, isolated populations. We ask: 1) How are rare species in Nevada affected by various types of threats? 2) Do observed threats differ in prevalence among different elevations and/or different land management types? 3) To what extent are the threats predicted by geospatial data observed on the ground? 4) How do perceived historical and current threats compare?
Methods
Species choice and occurrence data
We used NatureServe’s global (G) and state (S) conservation status rankings (https://www.natureserve.org/) to select focal vascular plant species. We included species with “rounded” state or global conservation status rankings of S1 and/or G1 (i.e., the highest listed imperilment level), which indicate that a species is critically imperiled at the state or global level (Figure 1). This approach included some species with “range” rankings, such as S1S2, which indicate uncertainty in imperilment level [e.g., either imperiled (S2) or critically imperiled (S1) at the state level]. We also included six rare, imperiled S2/G2 or state not-ranked (SNR) species of interest to the Nevada Division of Natural Heritage or the U.S. Fish and Wildlife Service (FWS) office in Reno, NV (Appendix 1). This led to a total of 128 taxa considered here. The imperiled taxa considered here do not necessarily represent a comprehensive list of imperiled species in Nevada. The Nevada Division of Natural Heritage has historically focused on globally imperiled species (G1-G3 taxa), so data coverage is incomplete for more globally secure taxa with limited distributions in Nevada. Therefore, some potential S1-S2 taxa for Nevada were not included here due to limited information about occurrences and threats.
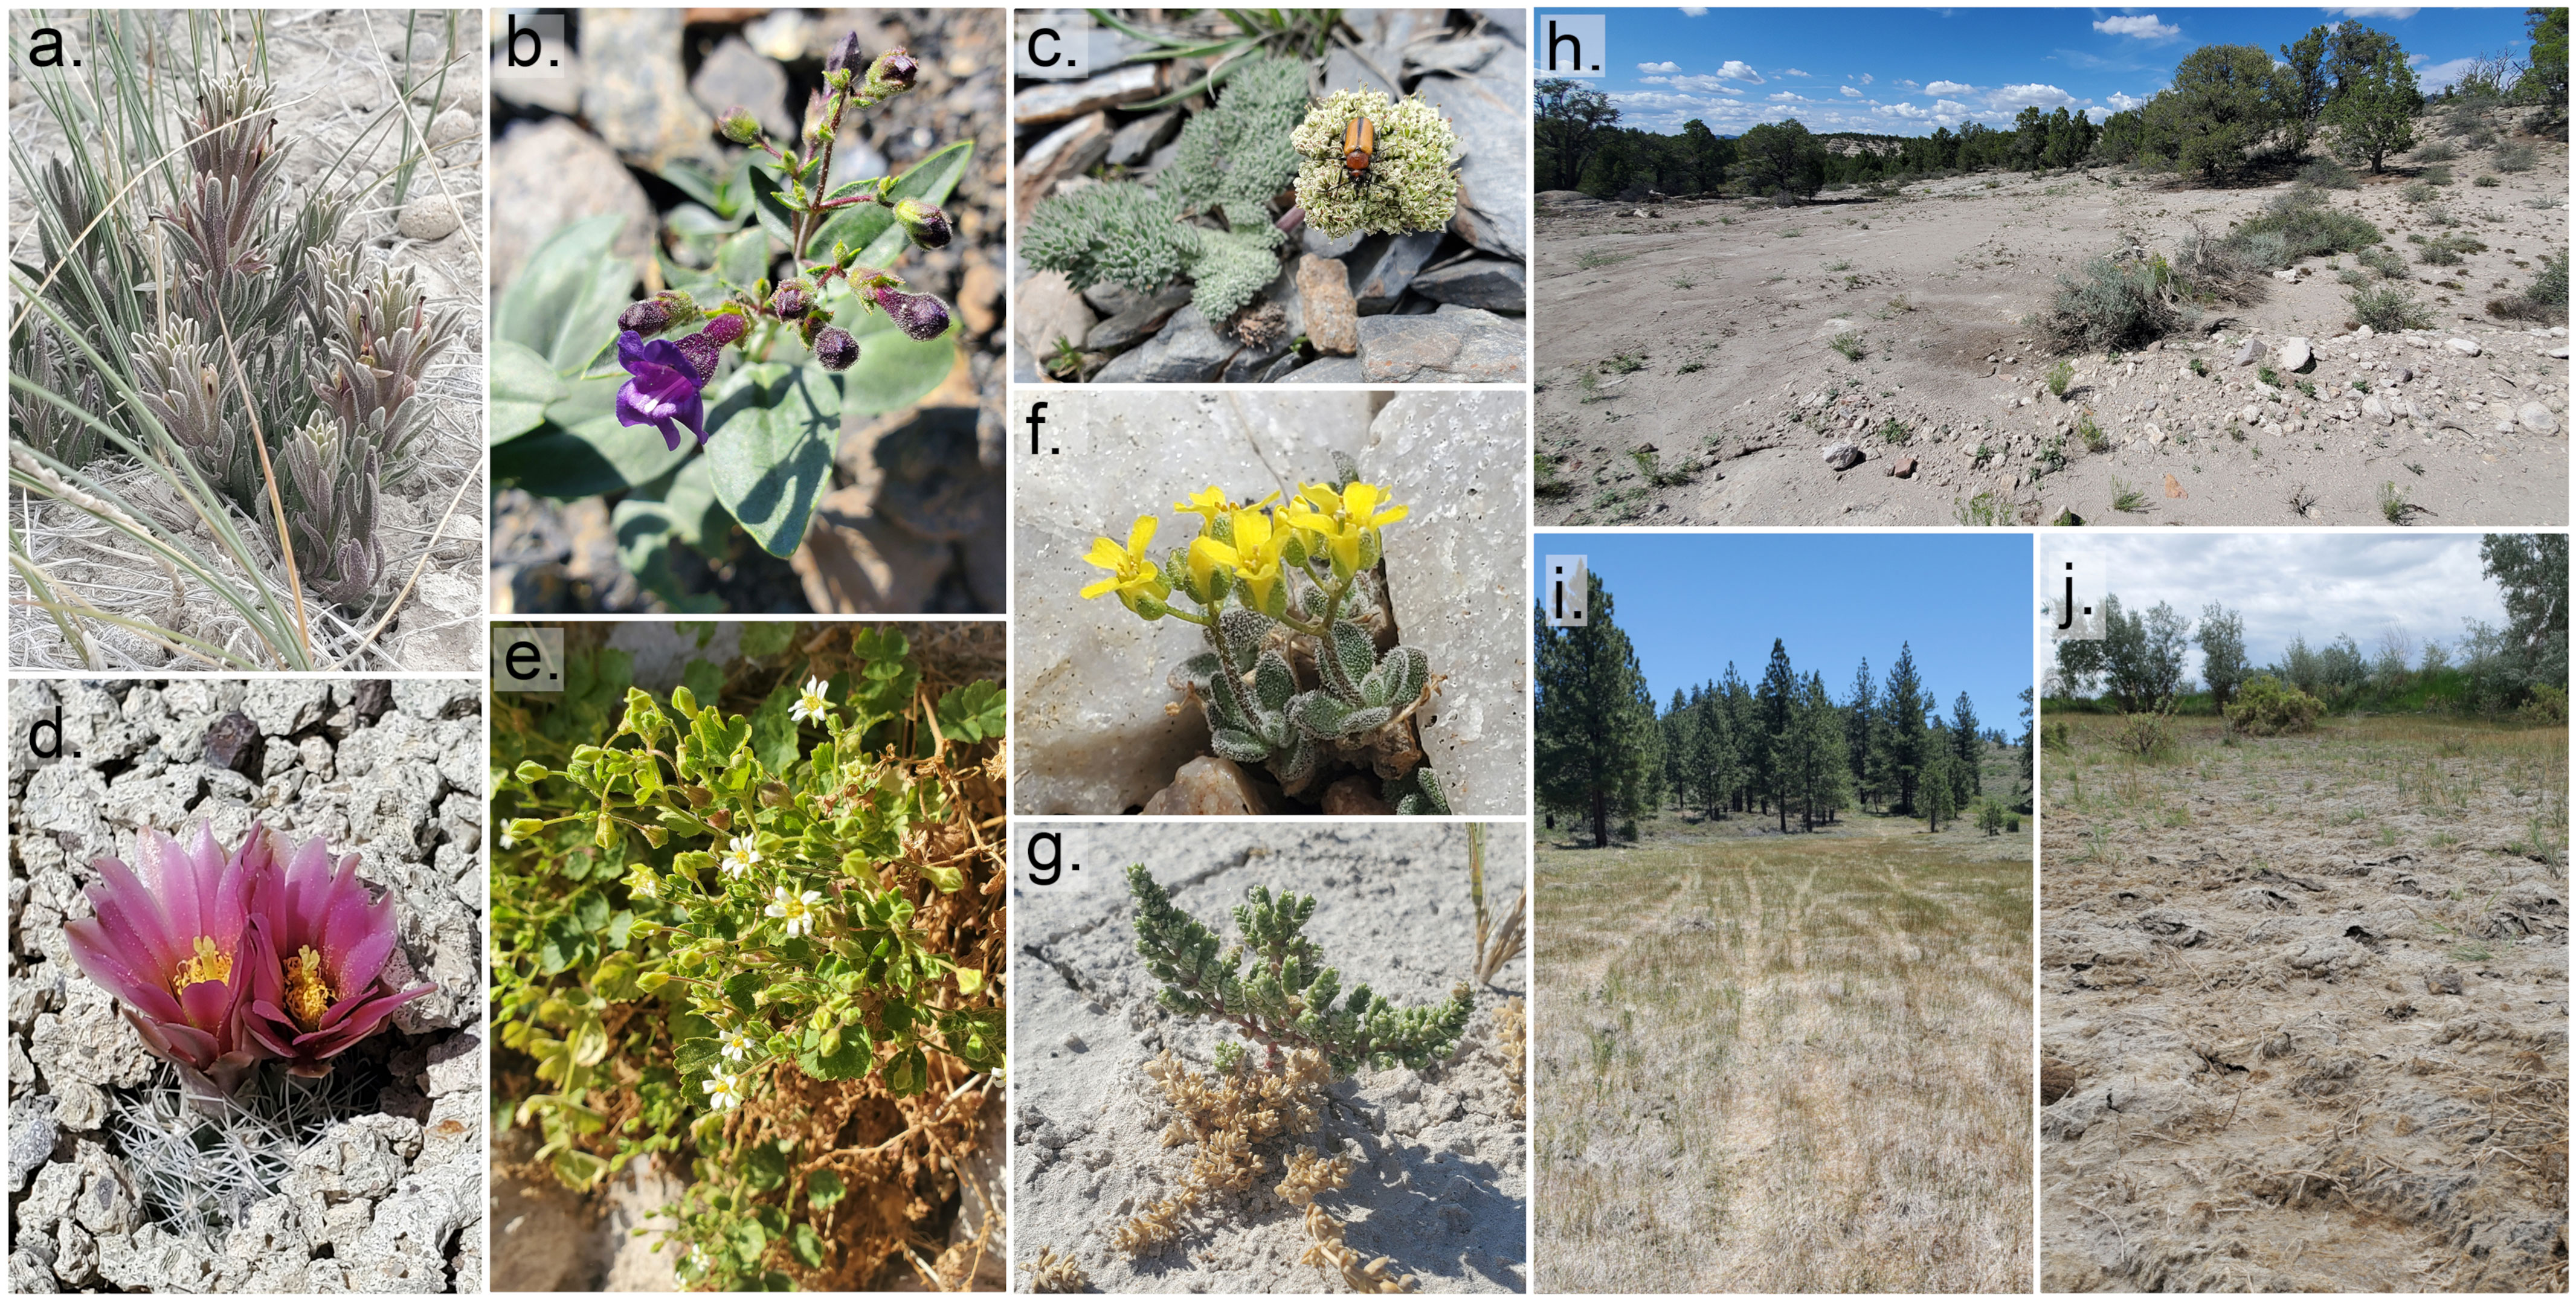
Figure 1 Examples of rare plants of Nevada (A-G) and observed threats (H-J) in rare plant habitat. (A) Castilleja salsuginosa (S1, critically imperiled) (B) Penstemon tiehmii (S1) (C) Cymopterus goodrichii (S2, imperiled) (D) Sclerocactus nyensis (S1) (E) Ivesia arizonica var. saxosa (S2) (F) Draba pedicellata var. wheelerensis (S1) (G) Nitrophila mohavensis (S1; ESA- Endangered) (H) Bulldozed clearing on hilltop in Eriogonum microthecum var. arceuthinum (SNR, state not-ranked) habitat (I) OHV tracks through meadow habitat of Ivesia aperta var. canina (S1) (J) Trampling in Astragalus lentiginosus var. sesquimetralis (S1) habitat (plants not found). Photos by Jamey McClinton.
Geospatial occurrence data (N = 5767) were obtained from multiple sources, including Consortium of Intermountain Herbaria georeferenced accessions (Herbaria, 2021), research-grade iNaturalist observations (Ueda, 2021), FWS critical habitat designations, and a geodatabase of occurrence polygons with varying degrees of geographic precision provided by the Nevada Division of Natural Heritage. For data in the form of polygon boundaries, which are commonly used to delineate a large patch of occupied habitat or to indicate general location of an observation if an exact point is not known, we selected up to 50 randomly located points with a 1km minimum separation distance within each polygon boundary to approximate a potential distribution of point occurrences within mapped areas. These randomly located points each share all attribute data of the original polygon aside from spatial coordinates (species, observation notes, etc.). For the purposes of this analysis, we define occurrences as individual points where a species has been observed, or that were randomly located within observation polygons as described above. Points may represent either spatially contiguous populations, or individual plants due to the variety of data sources and life histories of the species included. Therefore, most analyses are aggregated to the level of species (“threats by species” dataframe); however, for analyses where aggregation to the species level was not appropriate, such as the investigation of differences in threats among land management types, we used a “threats by occurrence” dataframe, as detailed below.
Q1: How are rare species in Nevada affected by observed threats?
Quantifying observed threats
Threat data associated with individual points were collected either during fieldwork in 2020 and 2021 [data from 41 sites and 23 species included out of a total 57 sites and 27 species searched (Appendix 1, Table S1)] or from observation notes in occurrence survey data provided by the Nevada Division of Natural Heritage (at least one threat was noted in at least one survey visit for 354 points and 36 species) and were incorporated into a “threats by occurrence” dataframe. The standards used to identify threats varied among observers, among species, and over time, and were subject to expert judgment; however, when specified, mechanisms included observed physical impacts to plants (e.g., plants trampled, grazed, or uprooted, pathogens observed on leaves, plants covered in dust, etc.), and expected or potential impacts (e.g., tire tracks through habitat that are likely to result in plant damage or lower recruitment if use continues), originally recorded so that impending threats might be prevented and/or monitored– for additional detail and examples, see Table 1. Species observed during 2020-2021 fieldwork were visited during their respective flowering periods, to the extent possible, to facilitate accurate identification and increase probability of detection (Table S1). One to three occurrences were visited per species during 2020-2021, separated by at least 1 km (NatureServe, 2020); accessing these locations can be challenging and it was impossible to visit every population of every species, or even every species; this challenge motivates our question 3 (do geospatial data predict observed threats). At each site visited, researchers traversed the site in a zig-zag meandering walk to observe plant and habitat conditions throughout the site and identify population boundaries. The spatial extent and severity of any visible threats were noted and photographically documented.
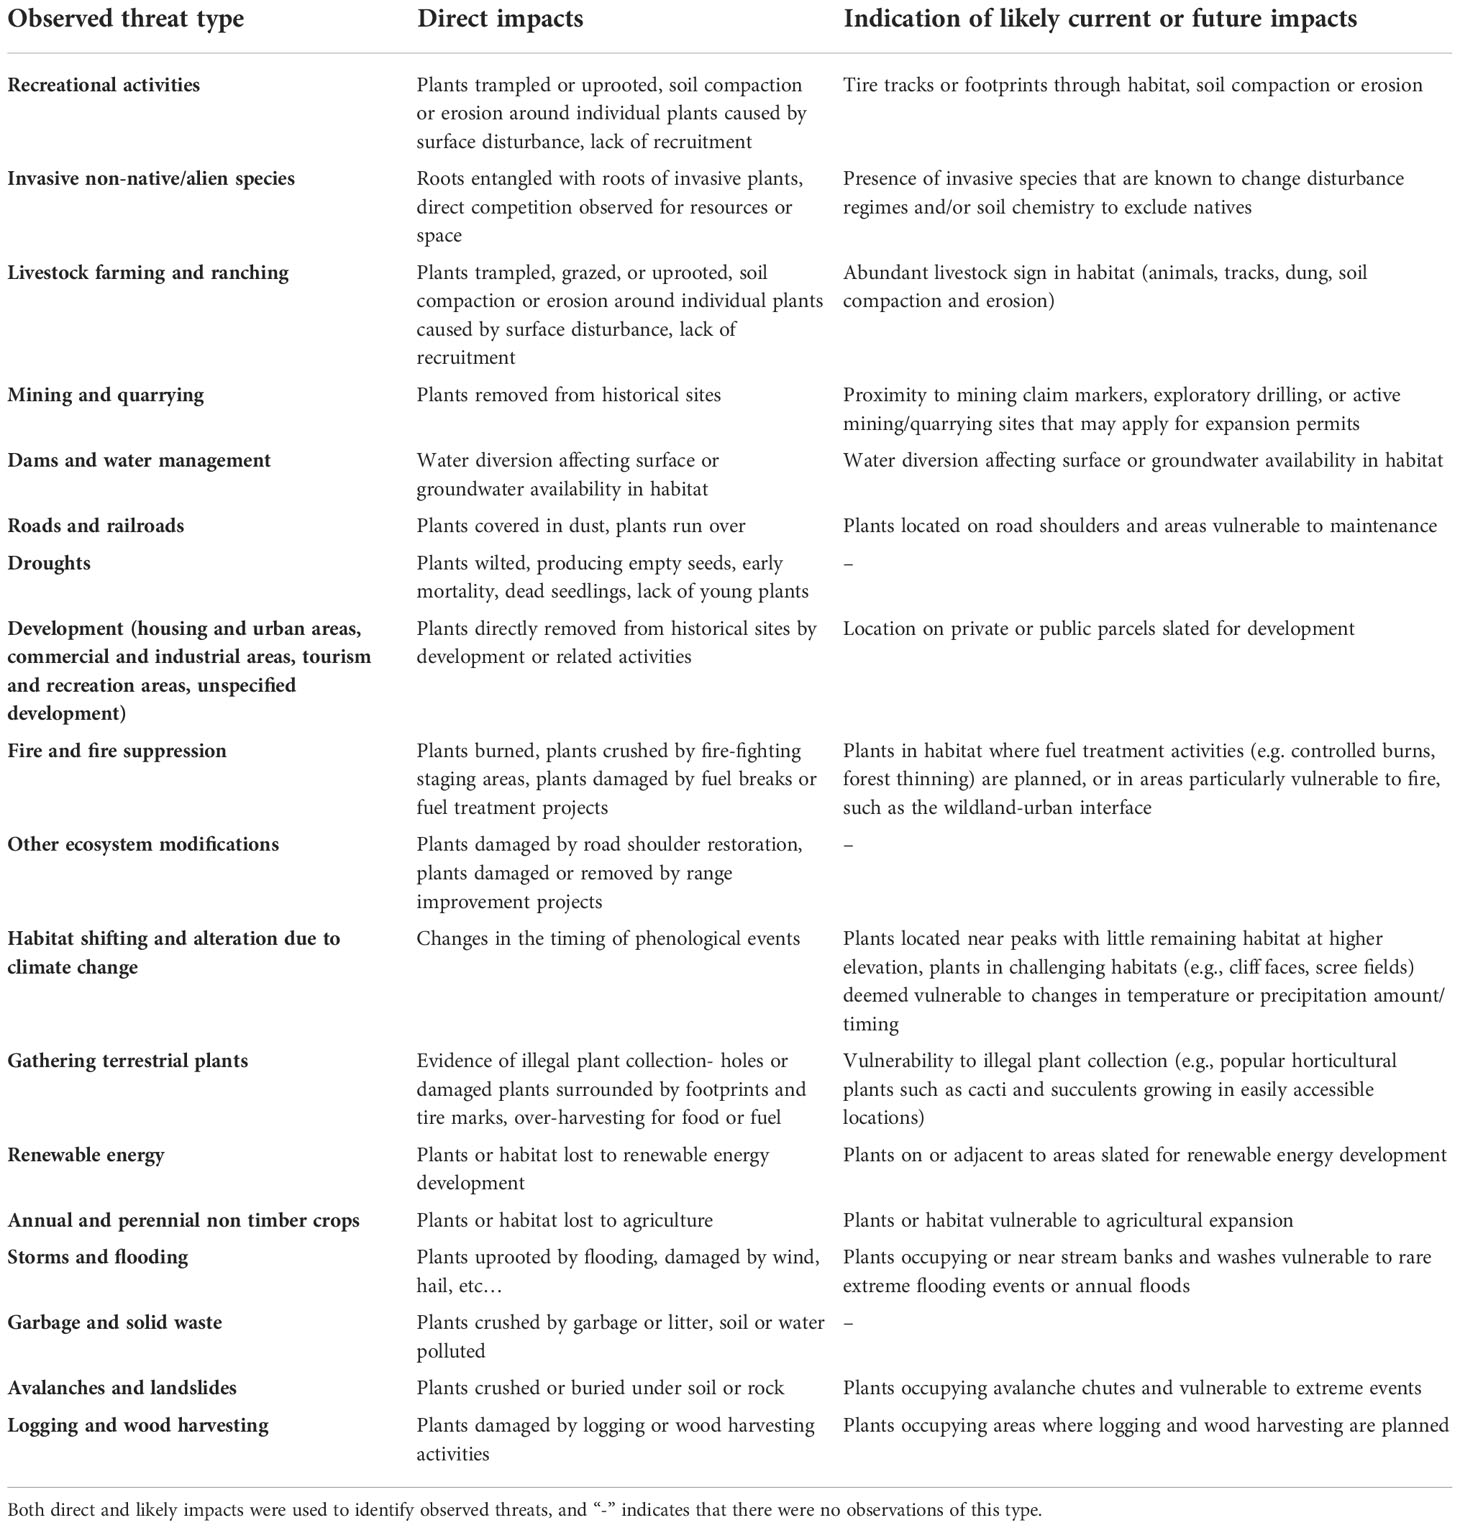
Table 1 Examples from 2020-2021 fieldwork and Nevada Division of Natural Heritage data of impacts that warranted notation as observed threats for each threat category.
Information on threats observed for species as a whole was gleaned from these surveys and additional sources including species status assessments, management reports, and descriptions of threats in NatureServe based on field observations and expert opinion (e.g., Mozingo, 1981; Murphy et al., 2000; NatureServe, 2021), then compiled into a single dataframe with species name, threat type, and threat presence/absence (to be referred to as our “threats by species” dataframe). Any observational threats derived from fieldwork, Natural Heritage data, or literature review will be referred to as “observed threats.” Considering the often-small number of populations and limited data on these plant species, we followed recent literature (McCune et al., 2013; Hernández-Yáñez et al., 2016), and determined threats to a species as present if observed for at least one record in the occurrence data, or noted as a threat to the species in an overall assessment found during literature review. Threats were classified using the IUCN-CMP Classification of Threats framework used by NatureServe (Salafsky et al., 2008), which is comprised of 11 broad threat categories (“level 1”; L1), each with 3-6 more specific sub-categories (“level 2”; L2) (Appendix 2). To improve specificity and relevance for management, we primarily use L2 threat categories. Threat data were summarized as present/absent for each species, then the percentages of species affected by each threat were tabulated. All analyses were carried out in R version 4.0.2 (R Core Team, 2020).
Q2: Do observed threats differ in prevalence among different elevations and/or different land management types?
Elevation
We assigned species in the “threats by species” dataframe to elevation groups based on the median elevation of species occurrences; we used median, rather than mean, elevation because some species had higher elevational amplitudes than others, and median values are less affected by outliers (Appendix 1). Low elevation (0-2,000m) species in Nevada generally occur below the lower tree line near valley bottoms; mid elevation (2,001-3,000m) species occur in montane environments among pinyon-juniper woodlands and shrublands or in sub-alpine communities; high elevation (>3,000m) species are found near or above treeline in alpine environments.
To ask how the likelihood of each threat varied among elevation groups, we constructed a generalized linear model with binomial regression and a logit link function, with presence/absence of each threat for each species as the response variable, and the interaction between threat category and elevation group as the predictive variables. We used the R package “emmeans’’ for multiple comparisons (Lenth, 2020).
Land management
We used the Bureau of Land Management (BLM) Surface Management Agency shapefile (BLM, 2020) to extract land management data for all point occurrences. We then calculated the proportions of rare species and individual occurrences that were present in areas managed by different entities.
To ask how the prevalence of different observed threats varies among land managers, we used point occurrences that had threats noted and could be individually assigned to different land managers (the “threats by occurrence” dataframe). We took this approach because species with multiple occurrences frequently crossed administrative boundaries, which have no biological relevance; therefore, assigning a single landowner to each species would be misleading. Thus, each species can occur more than one time in this analysis. Data noting observed threats for individual occurrences were available for 36 out of 128 species (Appendix 1). Due to the relatively high number of different land management types and the relatively low number of observations, we lacked statistical power needed to model differences in the prevalence of threats among landowners in the same manner as for elevation groups and have instead simply tabulated the number of species impacted by various threats in each land management type.
Q3: To what extent are the threats predicted by geospatial data observed on the ground?
Quantifying predicted threats
We collected publicly available geospatial data for Nevada from 24 different sources to quantify predicted threats, ranging from statewide datasets on active mining claims to feral horse grazing areas and wildfire perimeters (Appendix 2). We used spatial overlays to extract data for all rare plant point occurrences (N = 5767) from each potential threat data source. For threats such as wildfire perimeters that were delineated using polygons, data for rare plant occurrences were extracted if points fell within the boundaries of the polygon, while for line and point threat sources (such as roads and mining claims, respectively), data were extracted based on whether each point fell within buffered distances from those features, with distances determined based on a combination of field observations and literature reviews (Appendix 2). After data extraction, potential threat sources were assigned to broad categories in the IUCN-CMP Classification of Threats taxonomy (Salafsky et al., 2008) (Appendix 2), using a binary (1= threatens, 0 = does not threaten) coding method for whether each threat category was present for each point (incorporated into the “threats by occurrence” dataframe), and also aggregated to presence/absence for each species then incorporated into the “threats by species” dataframe in a manner similar to the methods used to quantify observed threats. Threats extracted from geospatial data will be referred to as “predicted threats.” Note that some threats were only present in the observed category, as we had no access to geospatial data to predict certain threats (e.g., illegal collection of terrestrial plants, presence of garbage/solid waste), so these threats were excluded from this analysis.
For predicted threats, we also considered climate change and drought exposure since 1960. Species were considered as potentially threatened by habitat shifting and alteration due to climate change or by drought if median observed values for occurrences of that species were at or above a cutoff value, described below. We used 4 km spatial resolution climate layers, sourced from TerraClimate, of mean annual precipitation, maximum and minimum temperatures to calculate climate change exposure, and Palmer drought severity index and climate water deficit to calculate drought exposure (Abatzoglou et al., 2018). We calculated climate change and drought exposure as the departures over the most recent three decades (1990-2020) from baseline conditions (1960-1989) across the state using the multivariate Mahalanobis distance (Farber and Kadmon, 2003; Abatzoglou et al., 2020). We again used spatial overlays to extract data for all rare plant point occurrences from these climate layers. Units are in standard deviations of mean Mahalanobis distance; for climate change, values >2 were regarded as non-analogous climate and values >4 were regarded as extreme differences (Fitzpatrick and Dunn, 2019). All sites had experienced notable climatic changes from the reference period (range 3.53 - 20.40 distance units); however, habitat shifting and alteration due to climate change was only noted as an observed threat for a small number of our focal species. To attempt to distinguish species that might be considered particularly threatened by habitat shifting and alteration due to climate change, we chose 17.9 (upper 15% of all values) as the climate change exposure cutoff value. The range of Mahalanobis distances measured for drought exposure were more moderate (1.19-3.27); therefore, we chose a cutoff of 2.5 distance units for drought departure (approx. upper 20% of all values) to designate species that might be most threatened by drought. These cutoff values are arbitrary in the absence of species-specific information on physiological tolerances and climate change vulnerability and attempt to focus limited management and research attention on the species that have already been most affected by these pressures.
Lastly, predictions of which species might be impacted by avalanches/landslides were generated using a combination of land cover, elevation, and slope data. We focused on predicting avalanche-prone areas because no species or occurrences were noted as being threatened by landslides in observed threat data. Avalanche activity is a natural process, and species growing in or near avalanche chutes are likely to be adapted to some avalanche activity. However, populations may be vulnerable to habitat destruction due to large avalanches, or to climate change- induced differences in avalanche size or frequency (Ballesteros-Cánovas et al., 2018; Peitzsch et al., 2021). No state-wide geospatial data depict avalanche threat for Nevada; however, research suggests that avalanches are most common in open areas at mid- to- high elevations and on moderate slopes (Perla, 1976; Schweizer et al., 2003; Guy and Birkeland, 2013). Therefore, occurrences were deemed potentially threatened if they fell on barren land or shrub/scrub (USGS National Land Cover Database categories 31 or 52), between 1100-2700 m elevation, and on slopes between 25-50%.
Geospatial data for all potential threats were tabulated and summarized by species, elevation group, and land management type. To ask how the likelihood of each predicted threat varied among elevation groups and land management types, we constructed generalized linear models with binomial regression and a logit link function, with presence/absence of each threat as the response variable, and the interaction between threat category and either elevation group or land management type as the predictive variables. We used the R package “emmeans” (Lenth, 2020) for multiple comparisons among elevation groups and land management types and performed Type II analysis of variance to ascertain overall significance of predictive variables. To ascertain which element of climatic change (minimum temperatures, maximum temperatures, or precipitation) contributed most strongly to climate change exposure, we calculated Spearman correlations between each univariate climate raster and our multivariate raster of climate change.
Correlations between predicted and observed threats
To test for correlations between threats predicted by geospatial data (“predicted threats”) and threats noted for a species or occurrence in on-the-ground surveys or from the literature (“observed threats”), we conducted a Spearman rank correlation test using the “threats by species” dataframe to ask how much, in general, predicted and observed threats were correlated. We then constructed generalized linear models with logistic regression to ask how predicted threats, species, and elevation groups were associated with observed threats, including modeling the influence of the interaction between threat category and threat presence/absence on the likelihood that threats would be observed.
To help direct attention to the species with the most threats, least recent surveys, and greatest discrepancies between observed and predicted threats, we estimated the relative threat levels experienced for each species. We added the median value of climate change exposure for each species to the total number of observed and predicted threats and the absolute value of the discrepancy (e.g., difference) between predicted and observed threats, and multiplied that sum by the log of the number of years since the species was last surveyed (replacing 0 values, indicating recent surveys, with 1 to ensure that species with many threats, even those with one recent survey, still ranked highly due to the possibility of un-surveyed populations in need of attention). We then broke these rank values into three categories using the Fisher algorithm (1958) (discussed in Slocum et al., 2008); this method attempts to maximize homogeneity of ranking metric values among groups to identify clusters of species in need of monitoring: “Most urgent,” “More urgent,” and “Urgent.” Note that this analysis tabulates the relative exposure to a variety of threats, but that these rankings do not necessarily equal the absolute degree of imperilment; not all populations of each species are necessarily impacted by every threat, and one threat of large effect could have a much larger impact than several smaller threats.
Q4: How do perceived historical and current threats compare?
For this analysis, we filtered our “threats by occurrence” dataframe to occurrences that had at least one threat noted in on-the-ground surveys for at least one visit (N = 354). This allowed us to track when different threats were first noted for each species. To ask whether the average number of threats an occurrence of each species experiences changed over time, we constructed a linear model with the average number of threats per occurrence per species in each decade as the response variable and decade as the predictor variable. While decades are coarse timeframes, the limited data from field surveys precluded continuous analyses, and this method allowed for reasonable sample sizes within each decade. Normality of residuals was ascertained by visual inspection of a normal Q-Q plot, and homoskedasticity was tested using the Breusch-Pagan test in the R package “lmtest” (Zeileis and Hothorn, 2002). To ask whether the proportion of monitored species experiencing various threats changed over time, we constructed a binomial generalized linear model with proportion of monitored species affected as the response variable, and the interaction between decade and threat category as the predictive variables.
Results
Q1: How are rare species in Nevada affected by observed threats?
The presence of 24 observed L2 threats was quantified at the species level for 128 rare plant taxa based on field observations and literature review. Many species in Nevada were impacted by multiple threats; the average number of observed threats per species was 2.57 ± 0.207 (mean ± SE), and the range was 0-11 threats (Figure 2). The most commonly observed threats were from recreational activities (50.8% of all species affected), invasive and non-native species (35.9%, including threats from both plants and animals), and livestock farming and ranching (25.8%) (Figure 3). For threats due to recreation, species were threatened by OHV use (25% of all species), hiking and related activities (16%), and other recreation (15%); for threats from invasive and non-native species, rare species were affected by invasive plants (29% of all species), feral horses (15%), and other invasive species (0.8%) (Appendix 3, Figure S1). The taxon with the highest number of different observed threats was Erythranthe carsonensis (11 threats), followed by Cirsium eatonii var. clokeyi, Eriogonum ovalifolium var. williamsiae, and Ivesia pityocharis (8 threats). Threats were unknown for 28 rare species (21.9%) (Appendix 3). Threats had been assessed and were deemed not present in Nevada for 3 species: Mentzelia inyoensis, Draba californica, and Cymopterus cinerarius.
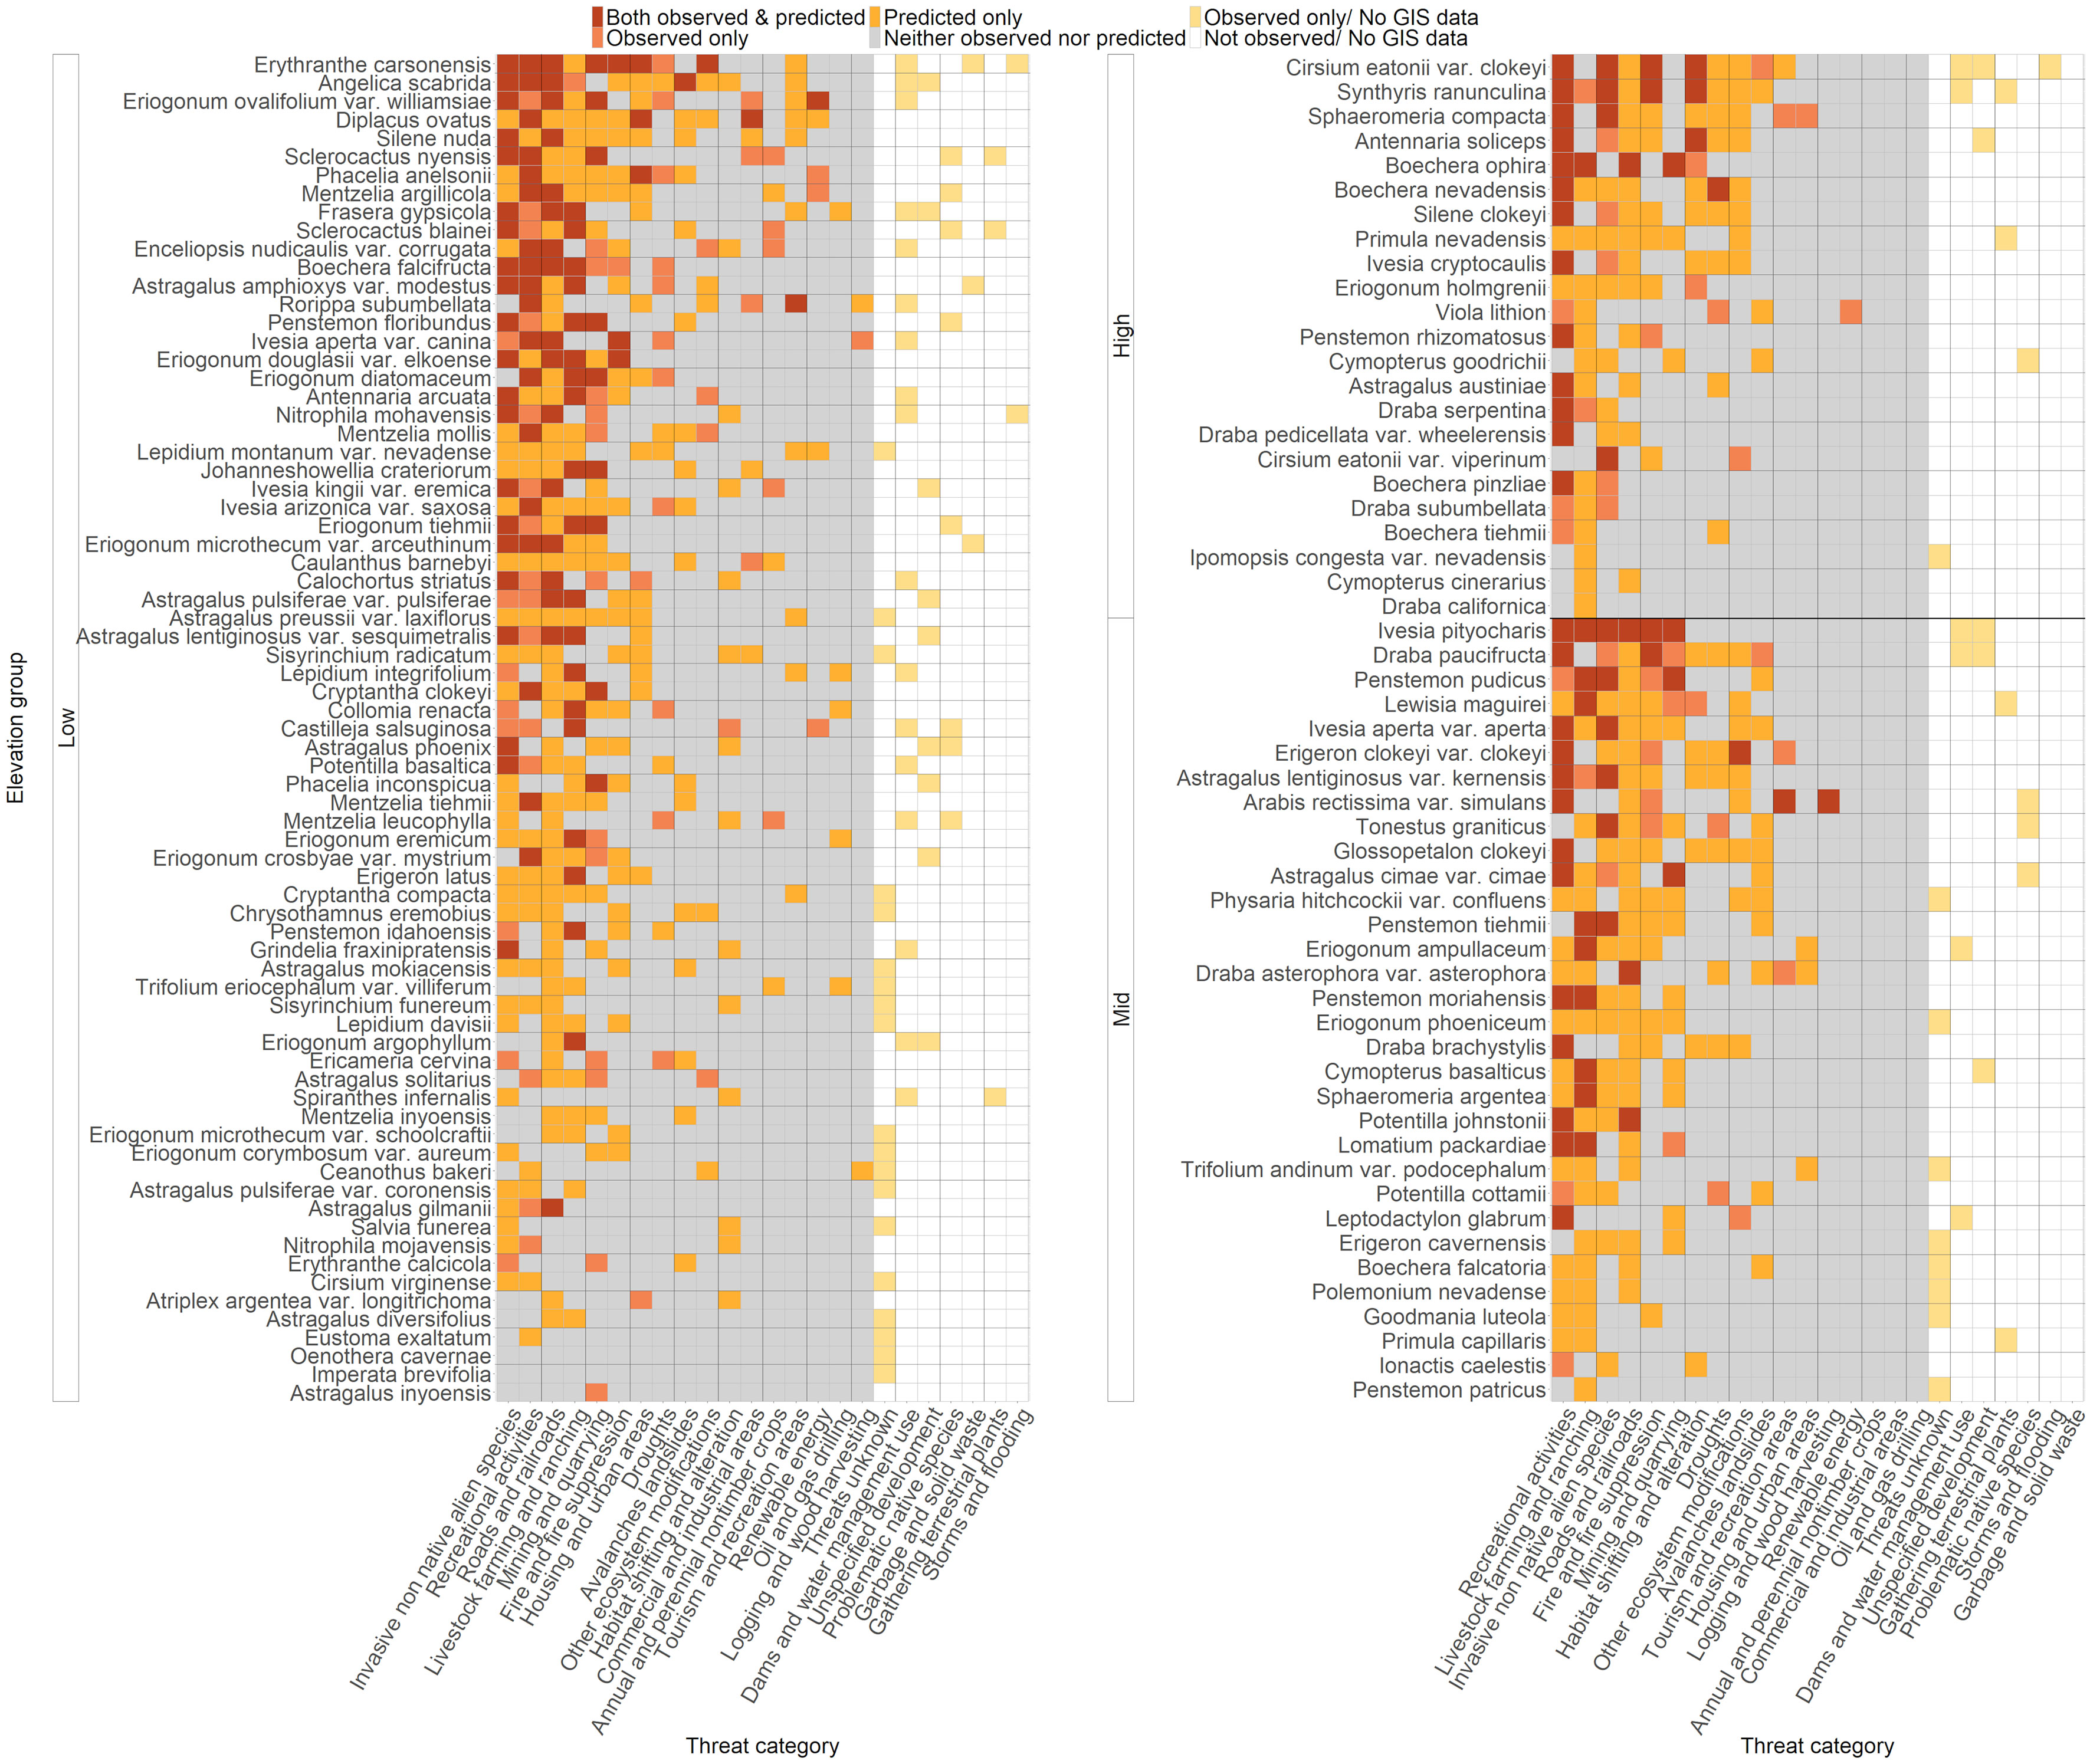
Figure 2 Status of each threat for each rare species included in our analyses. Threats were counted as affecting a species if at least one occurrence was predicted or observed to have that threat, or if the threat was noted to affect the species during literature review. Species are arranged on the Y axis by elevation group, and then arranged vertically by total threats. Light yellow cells indicate threats that were observed but had no geospatial data available for prediction. White cells indicate threats that were not observed and for which no geospatial data were available for prediction. Gray cells indicate threats that were neither predicted nor observed. Orange cells indicate threats that were predicted only but not observed. Pink cells indicate threats that were observed only but not predicted, and red cells indicate threats that were both predicted and observed. Threats were classified using the IUCN-CMP Classification of Threats framework used by NatureServe (Salafsky et al., 2008), which is comprised of 11 broad threat categories (“level 1”; L1), each with 3-6 more specific sub-categories (“level 2”; L2) (Appendix 2).
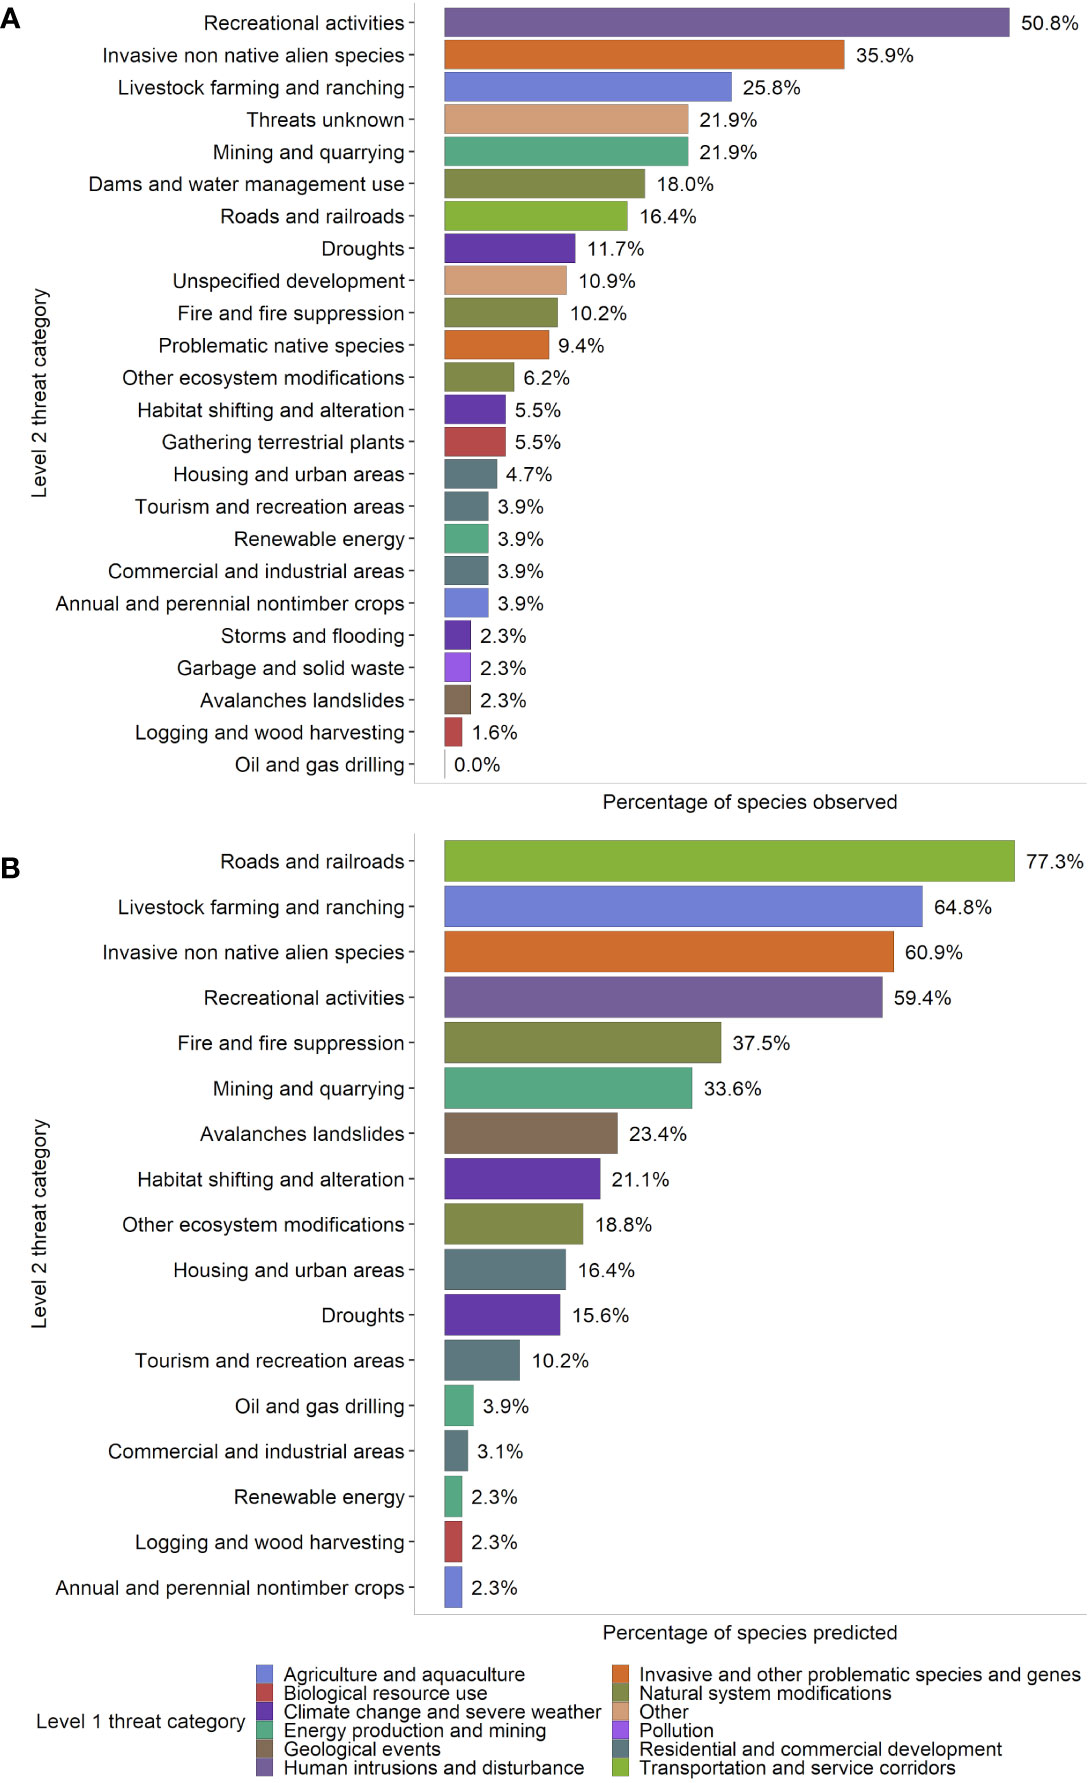
Figure 3 Percentage of 128 rare critically imperiled and imperiled (state conservation status rank S1 and S2) plant species found in Nevada that were either (A) observed or (B) predicted by geospatial data to be affected by various threats. This figure is presented in a similar format to Hernandez-Yanez 2016, a US-wide assessment, to allow for direct comparison. Data included our field observations, survey data from the Nevada Division of Natural Heritage, and literature review; threats were counted as “present” for a species if noted for at least one occurrence during surveys. Threats were classified using the IUCN-CMP Classification of Threats framework used by NatureServe (Salafsky et al., 2008), which is comprised of 11 broad threat categories (“level 1”; L1), each with 3-6 more specific sub-categories (“level 2”; L2) (Appendix 2). Notes: 1) The percentage of species threatened does not necessarily indicate the severity of the threat to the species affected by each stressor; e.g., less prevalent habitat-converting threats such as residential and commercial development and mining could result in more rapid population declines and/or local extirpation for species affected than more prevalent but potentially less severe habitat-degrading threats such as recreation, invasion, livestock, and roads. 2) See the Discussion for a more detailed analysis of discrepancies between observed and predicted threats in panels (A, B).
Q2: Do observed threats differ in prevalence among different elevations and/or different land management types?
Elevation
The majority (57%) of the rare Nevada plants we examined occur below 2,000m elevation; 25% occur at middle elevations between 2,000-3,000m, and 18% grow above 3,000m, based on the median elevation of occurrences of each species. By total number of species affected, the most common observed threats at low elevations were recreational activities (particularly disturbance due to OHV use, hiking/camping, and rock climbing), invasive non-native/alien species, and mining and quarrying (Appendix 3, Figure S2A). At middle elevations, the most common observed threats were recreation, livestock farming and ranching, threats unknown, and invasive non-native/alien species; at high elevations, the most common observed threats were recreation, invasive non-native/alien species, and habitat shifting and alteration due to climate change. There was greater variety in the types of threats in low elevation populations (23), relative to middle (17) or high (19) elevations.
We also found significant differences in the likelihood that threats would be observed among elevation groups (p < 0.05, RMcFadden2 = 0.21) (Table 2). For instance, species growing at high elevations were 300% more likely to be observed as threatened by habitat shifting and alteration due to climate change and recreational activities than species at low elevations. Species growing at low elevations were 218% more likely to have mining and quarrying noted as threats, or 205% more likely to have threats unknown than species at high elevations, and species growing at middle elevations were 138% more likely to have threats due to fire and fire suppression observed than species at low elevations.
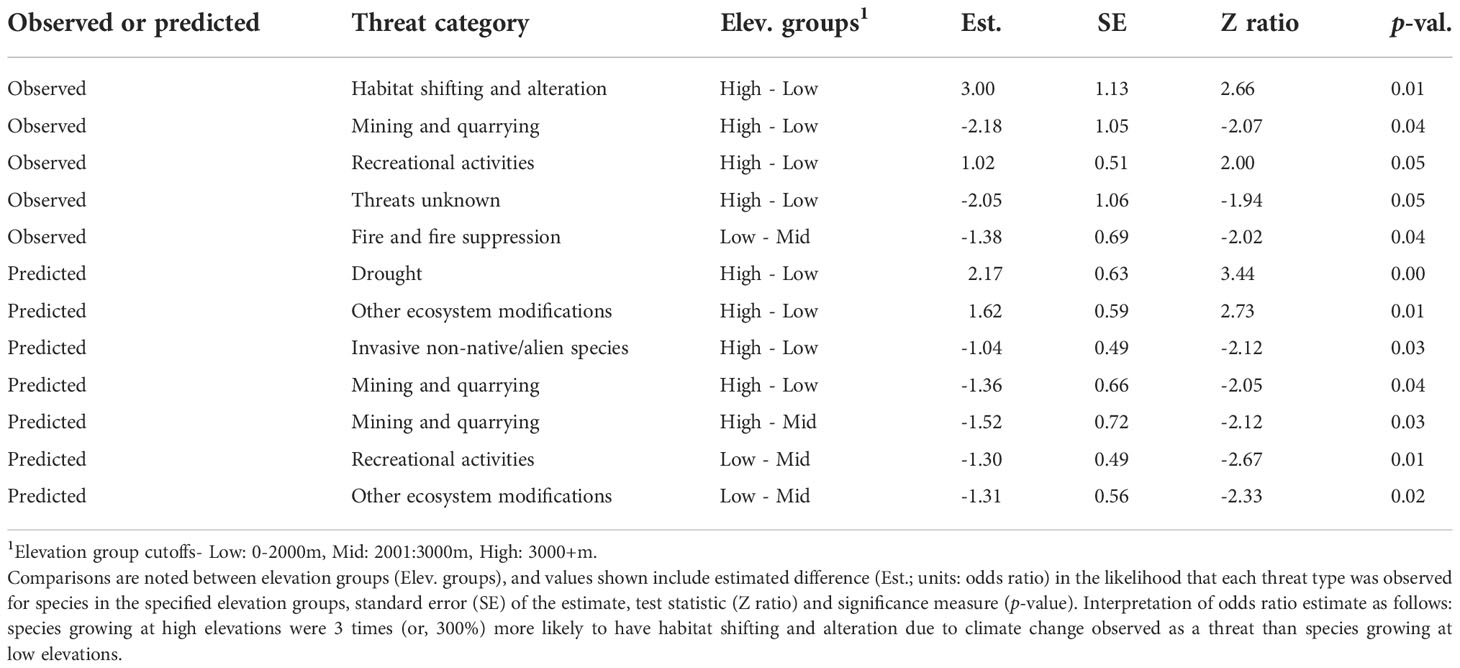
Table 2 Significant (p <0.05) differences in likelihood of observation or prediction for known threats among elevation groups.
Land management
Overall, a majority of Nevada’s rare species occurrences in this dataset were on BLM land, followed by land managed by the U.S. Forest Service, and then private ownership (Figure 4), which reflects proportions of land ownership in the state. However, we note that rare species presence on private land may be under-estimated due to challenges involved with surveys and collections on private land. Considering the subset of species for which observed threat data were available at the level of occurrences (Appendix 1), recreational activities, invasive non-native/alien species, and livestock farming and ranching were again the most frequent threats (Figure 4; Appendix 3, Figure S3). On BLM land, 72%, 78%, and 56% of rare species were impacted by these threats, respectively, followed by 28% threatened by mining and quarrying. The four most common threats varied slightly between land management types; for instance, the top four threats on U.S. Forest Service land (the next most speciose designation in this sub-analysis) were recreational activities, followed by a tie between invasive non-native/alien species and livestock farming and ranching, then roads and railroads, while the top four threats on private land were livestock farming and ranching, invasive non-native/alien species, recreational activities, and a tie between development of housing and urban areas and development of tourism and recreation areas (Figure 4; Appendix 3, Table S2).
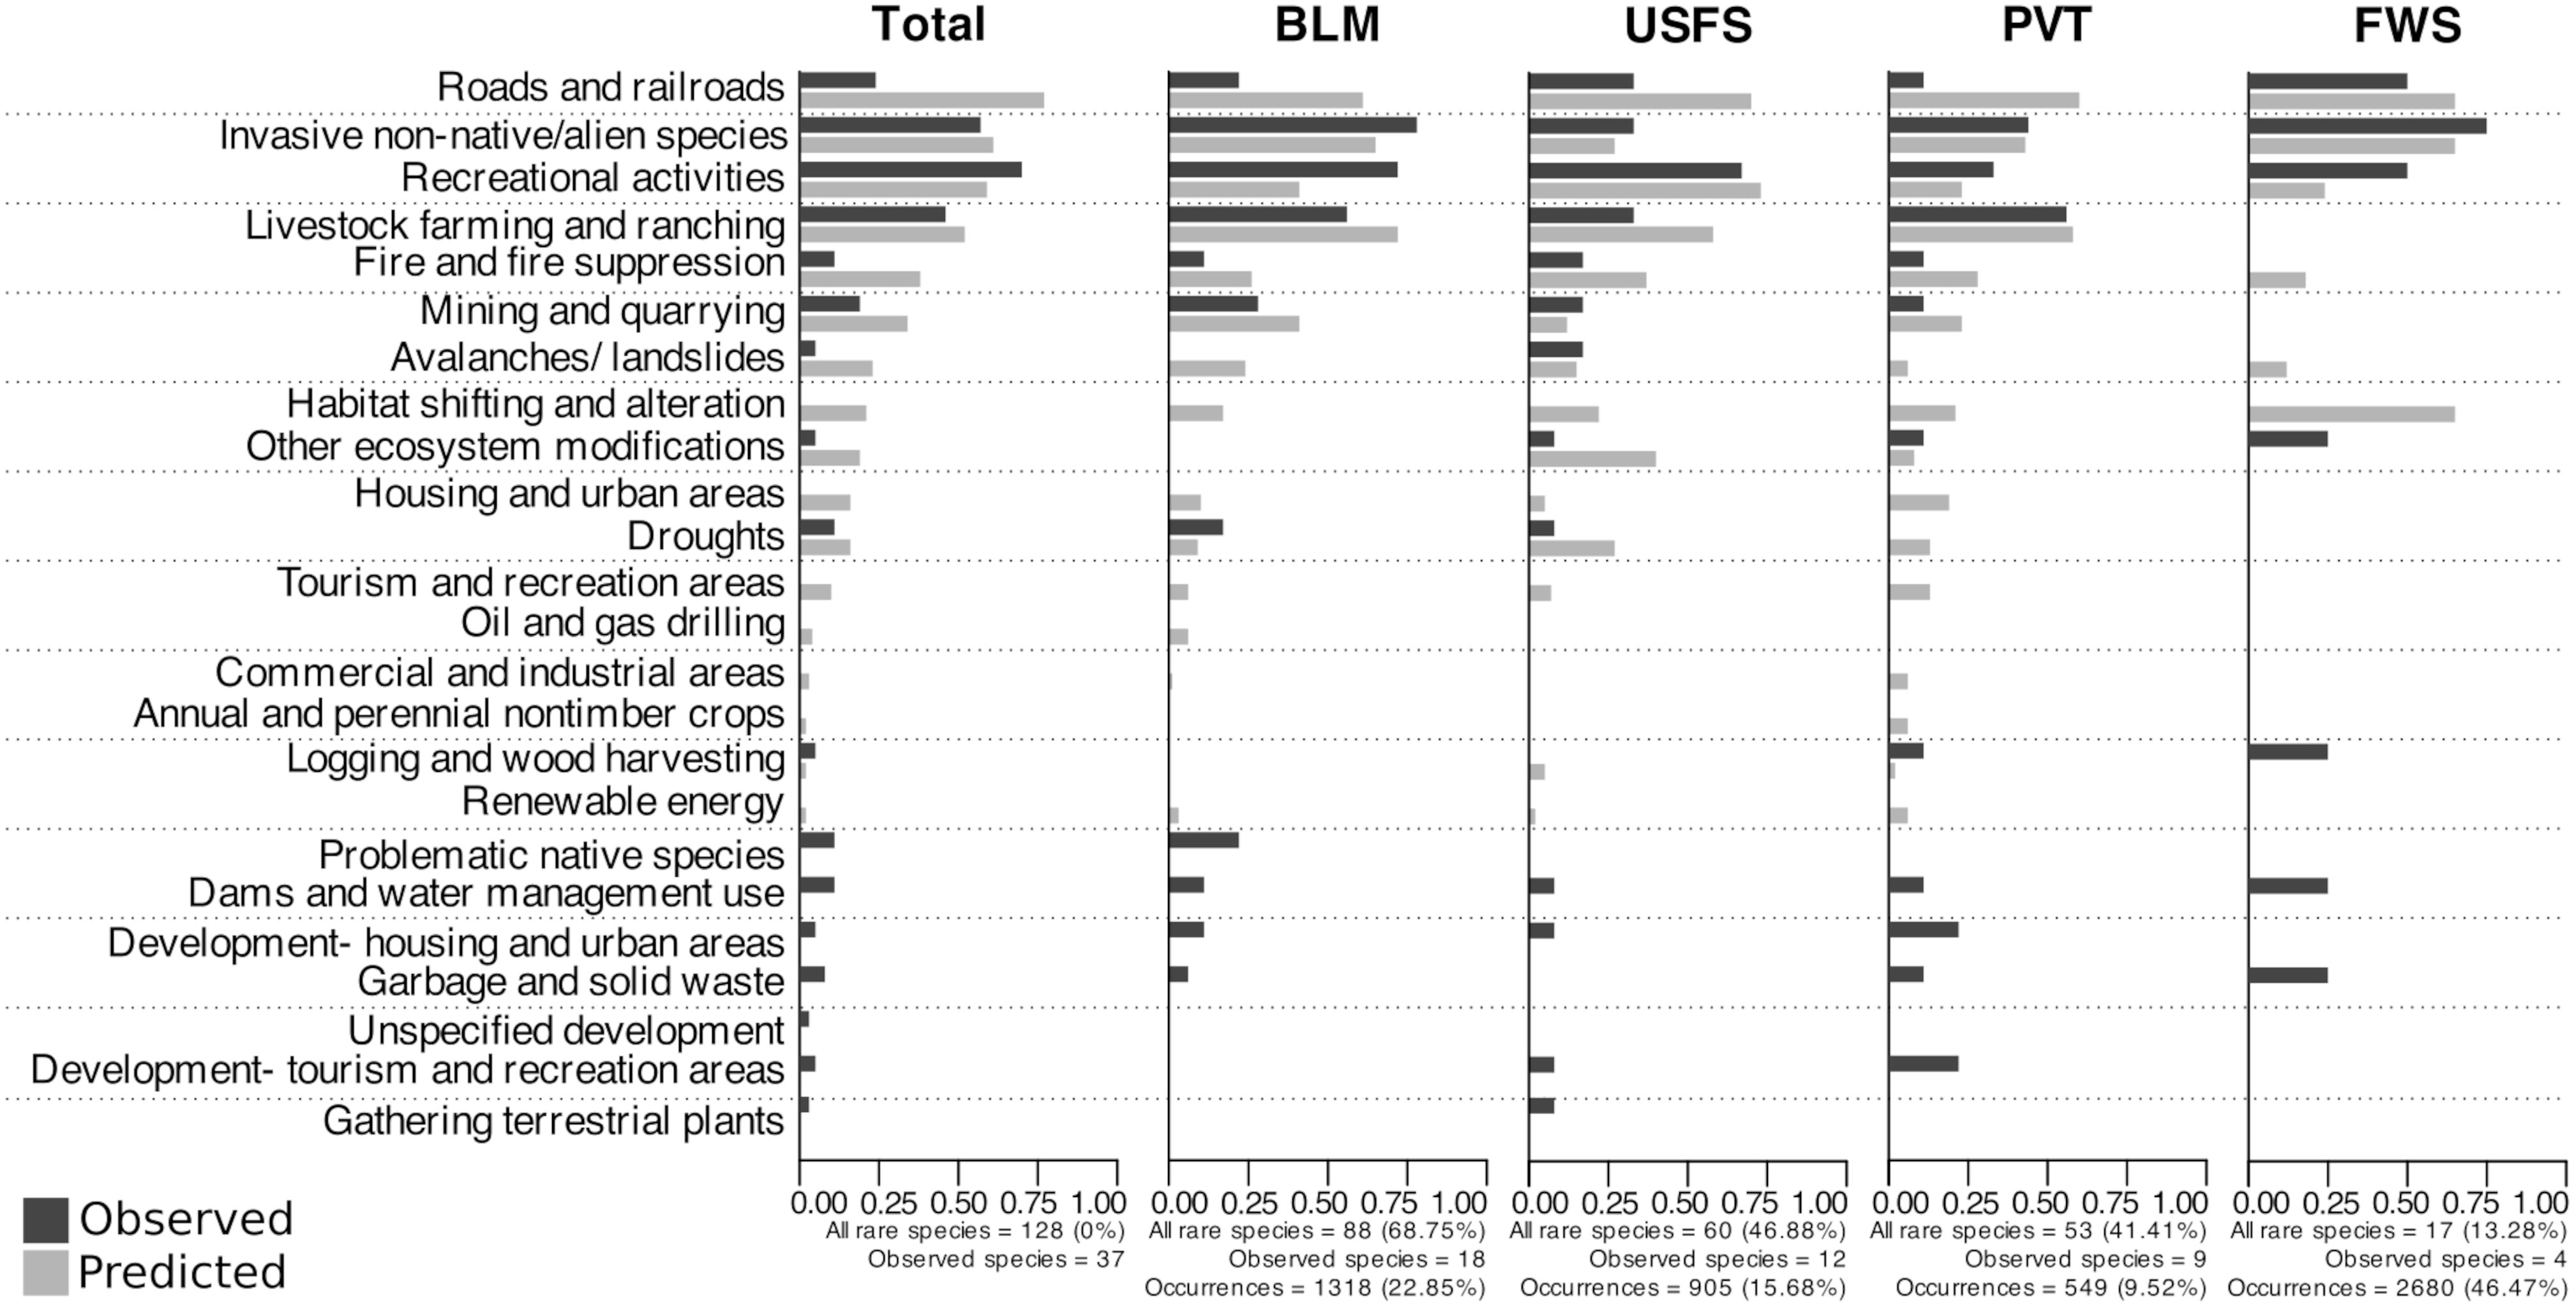
Figure 4 Percentage of Nevada rare plants in the four most speciose land management designations that have been observed as threatened during on-the-ground surveys (black bars) or that were predicted to be threatened by geospatial data (grey bars) for a variety of threats. Black bars show percentages of species threatened out of those with observational threat data (“Observed species”) associated with individual occurrences that could be assigned to a discrete land management type. Grey bars show percentages of species predicted to be threatened out of all species included in our study. Abbreviations are as follows: BLM- Bureau of Land Management; USFS- U.S. Forest Service; PVT- Private; FWS- Fish and Wildlife Service. Data for other land use types are in supplemental materials (Appendix 3, Figure S4).
Q3: To what extent are the threats predicted by geospatial data observed on the ground?
Overview and variation by elevation and land management
On average, each of the 128 rare species we examined was predicted to be affected by 4.5 ± 0.20 (mean ± SE) different threats. The most common potential threats identified by geospatial data in Nevada overall were proximity to roads and railroads (specifically, 77.3% of rare species had at least one occurrence within 100m of a road), livestock farming and ranching (64.8%), and invasive non-native/alien species (60.9%), followed closely by recreational activities (59.4%) (Figure 3). Diplacus ovatus had the greatest number of different predicted threats (12 threats), followed by Angelica scabrida and Silene nuda (10 threats), Erythranthe carsonensis (9 threats), and Astragalus preussii var. laxiflorus, Caulanthus barnebyi, Cirsium eatonii var. clokeyi, Glossopetalon clokeyi, Ivesia aperta var. aperta, Lepidium montanum var. nevadense, Mentzelia argillicola, Phacelia anelsonii, and Synthyris ranunculina (8 threats). Silene clokeyi had the highest average number of threats predicted per occurrence (5.33 threats), followed by Astragalus lentiginosus var. kernensis (5.00 threats), Ivesia cryptocaulis (4.77 threats), Draba brachystylis (4.75 threats), and Cirsium eatonii var. clokeyi (4.71).
By total number of species affected, the most common predicted threats at low elevations were roads and railroads, invasive non-native/alien species, and livestock farming and ranching. At middle elevations, the most common predicted threats were roads and railroads, recreation, and livestock farming and ranching. The most common predicted threats at high elevations were recreation, livestock farming and ranching/roads and railroads (even numbers of species affected by these threats), and invasive non-native/alien species (Appendix 3, Figure S2B).
Like observed threats, the likelihood that different threats would be predicted for a species varied among elevation groups (p < 0.05, RMcFadden2 = 0.30, Table 2). For instance, species growing at low elevations were more likely to have threats predicted from invasive non-native/alien species and mining and quarrying than species at high elevations, and mid-elevation species were more likely to have threats predicted from recreational activities than low elevation species.
The most common predicted threats also varied among land management types (DF = 11, R2McFadden = 0.62, p<0.05). The top three predicted threats (by percentage of all species affected) for BLM land (the most speciose designation; Figure 4; Appendix 3, Table S1) were livestock farming and ranching (72%), invasive non-native/alien species (65%), and roads and railroads (61%), while the most common predicted threats on USFS land were recreational activities (73%), roads and railroads (70%), and livestock farming and ranching (58%). On private land, the third most speciose designation, the most common threats were roads and railroads (60%), livestock farming and ranching (58%), and invasive species (43%) (Appendix 3, Table S3).
Climate change
All of Nevada’s rarest species experienced notable changes in mean climatic conditions during 1990-2020 compared to the reference period (1960-1989). Although only 21.1% of species had median values for climate change exposure greater than the cutoff chosen to indicate an especially high threat from habitat shifting and alteration due to climate change, all sites had climate change exposure values greater than 3.5 (and some were as high as 20.4) (Figure 5). Climatic changes were more dramatic in the southern parts of Nevada, especially in Clark, Nye, and Lincoln counties, and were driven mainly by changes in minimum temperature. The mean annual minimum temperature in Nevada increased from 2.6°C to 3.7°C between 1990-2020 (a 1.1°C change), and the correlation between the univariate Mahalanobis distances for changes in minimum temperature across Nevada and the multivariate distance for climate change exposure across the state was 92.8% (compared with 88.0% for maximum temperature, and 35.8% for precipitation). Changes in precipitation across the state were generally toward drought conditions, with the exception of minor increases (maximum trend 0.04 between 1958-2020) in some areas of central and eastern Nevada (Appendix 3, Figure S5).
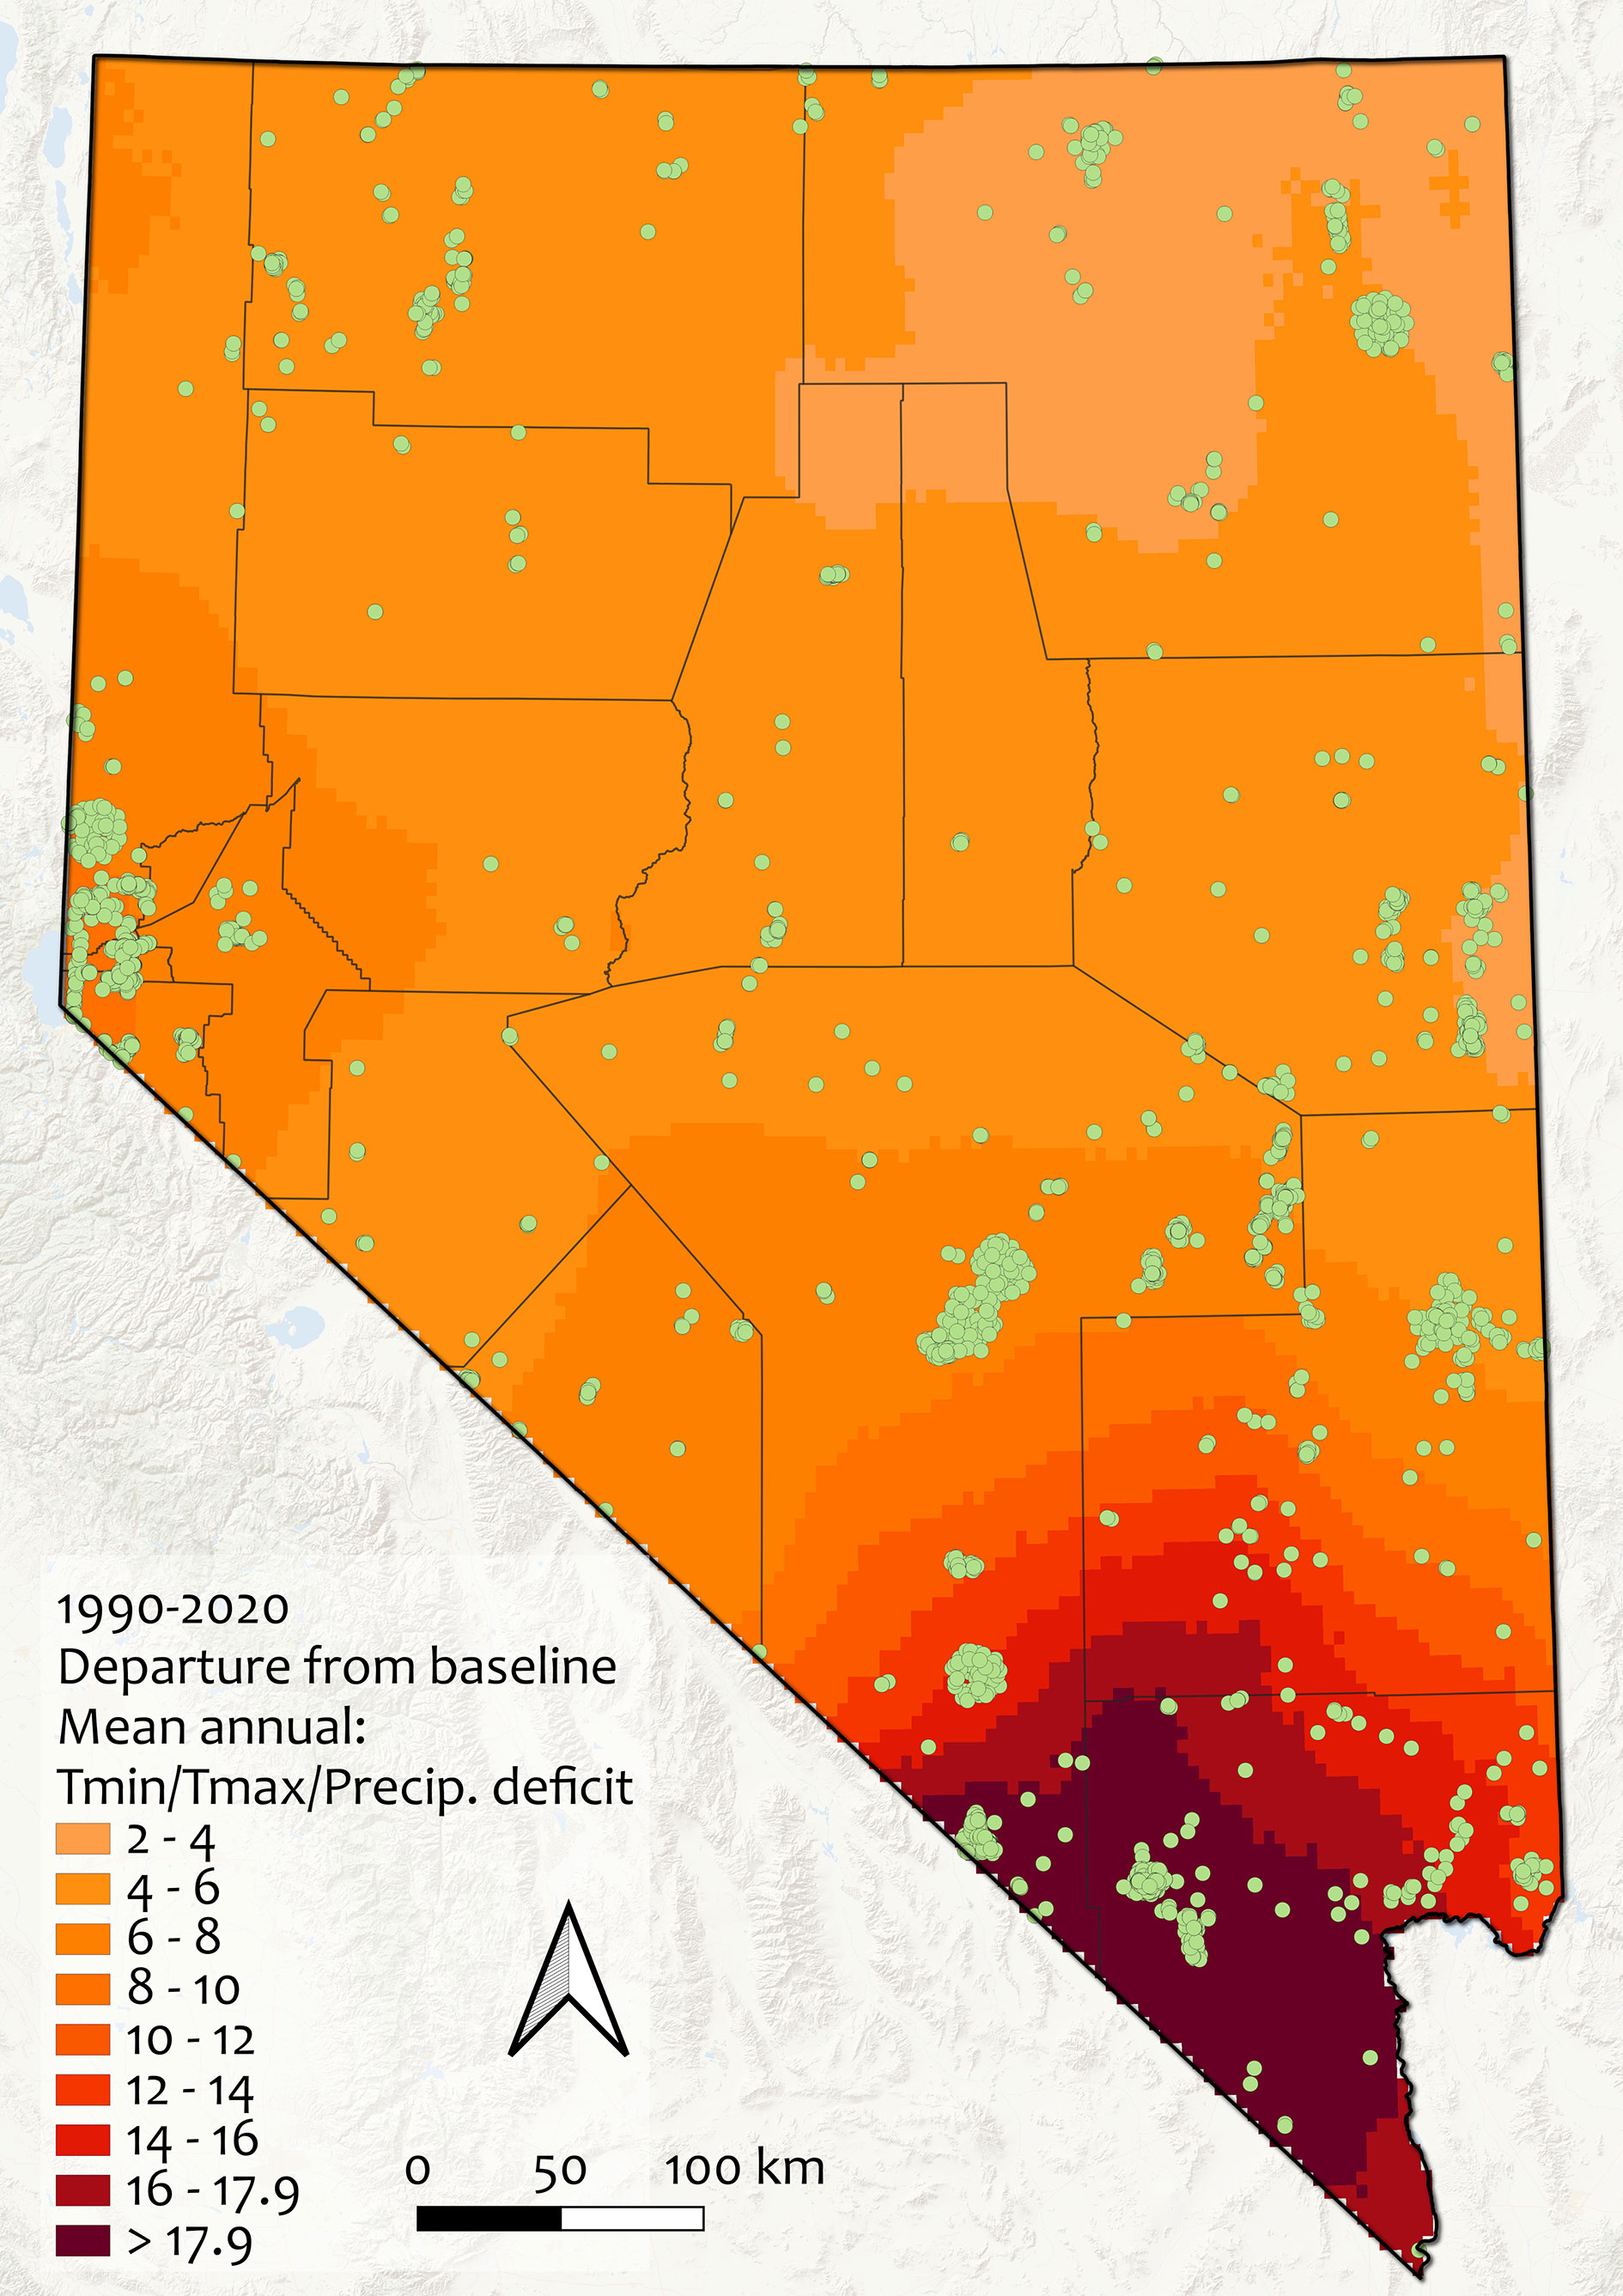
Figure 5 Climate change exposure across Nevada between 1990-2020, as departure from baseline (1960-1989). Units are in standard deviations of mean Mahalanobis distance, a multivariate metric calculated from mean annual minimum and maximum temperatures and precipitation. Values >2 are considered non-analogous climate and values >4 are extreme differences; note that no areas of the state have values less than 2 and that all rare plant occurrences experienced notable climatic changes (range: 3.53-20.40). Green points indicate rare plant occurrences, gray lines show county boundaries.
Correlations between predicted and observed threats
Overall, there was a 28.1% correlation between predicted threats and observed threats at the species level (p < 0.05). In generalized linear models, predicted and observed threats were positively correlated, with the overall odds of threats being observed increasing by a factor of 5.30 when threats were predicted (p < 0.05, R2McFadden = 0.09). This did not vary significantly among elevation groups, nor among species. However, there was variation among threat categories in the correlation between predicted and observed threats, and in the likelihood of threats being observed when they were not predicted (p < 0.05, R2McFadden = 0.23, Appendix 3, Table S4). For instance, the odds that a threat from invasive non-native/alien species would be observed when that threat was not predicted were 0.43 (p = 0.006), whereas the odds that a threat from fire/fire suppression would be observed when no threat was predicted was 0.08 (p < 0.001) (Table 6). The odds that a species would be observed as threatened by development of housing and urban areas were 5.78 times higher if that threat was predicted by geospatial data than if it was not (p = 0.04), whereas the odds that a species would be observed as threatened by renewable energy were 15.13 times higher if the threat was predicted than if it was not (p = 0.041) (Appendix 3, Table S4). We further illustrate the relationship between the probability that a threat would be observed when a threat is predicted in Figure 6. For instance, when a threat from livestock farming and ranching is not predicted, the probability that this threat would be observed is 9%, whereas if this is predicted, the probability that it will be observed increases to 35% (Figure 6).
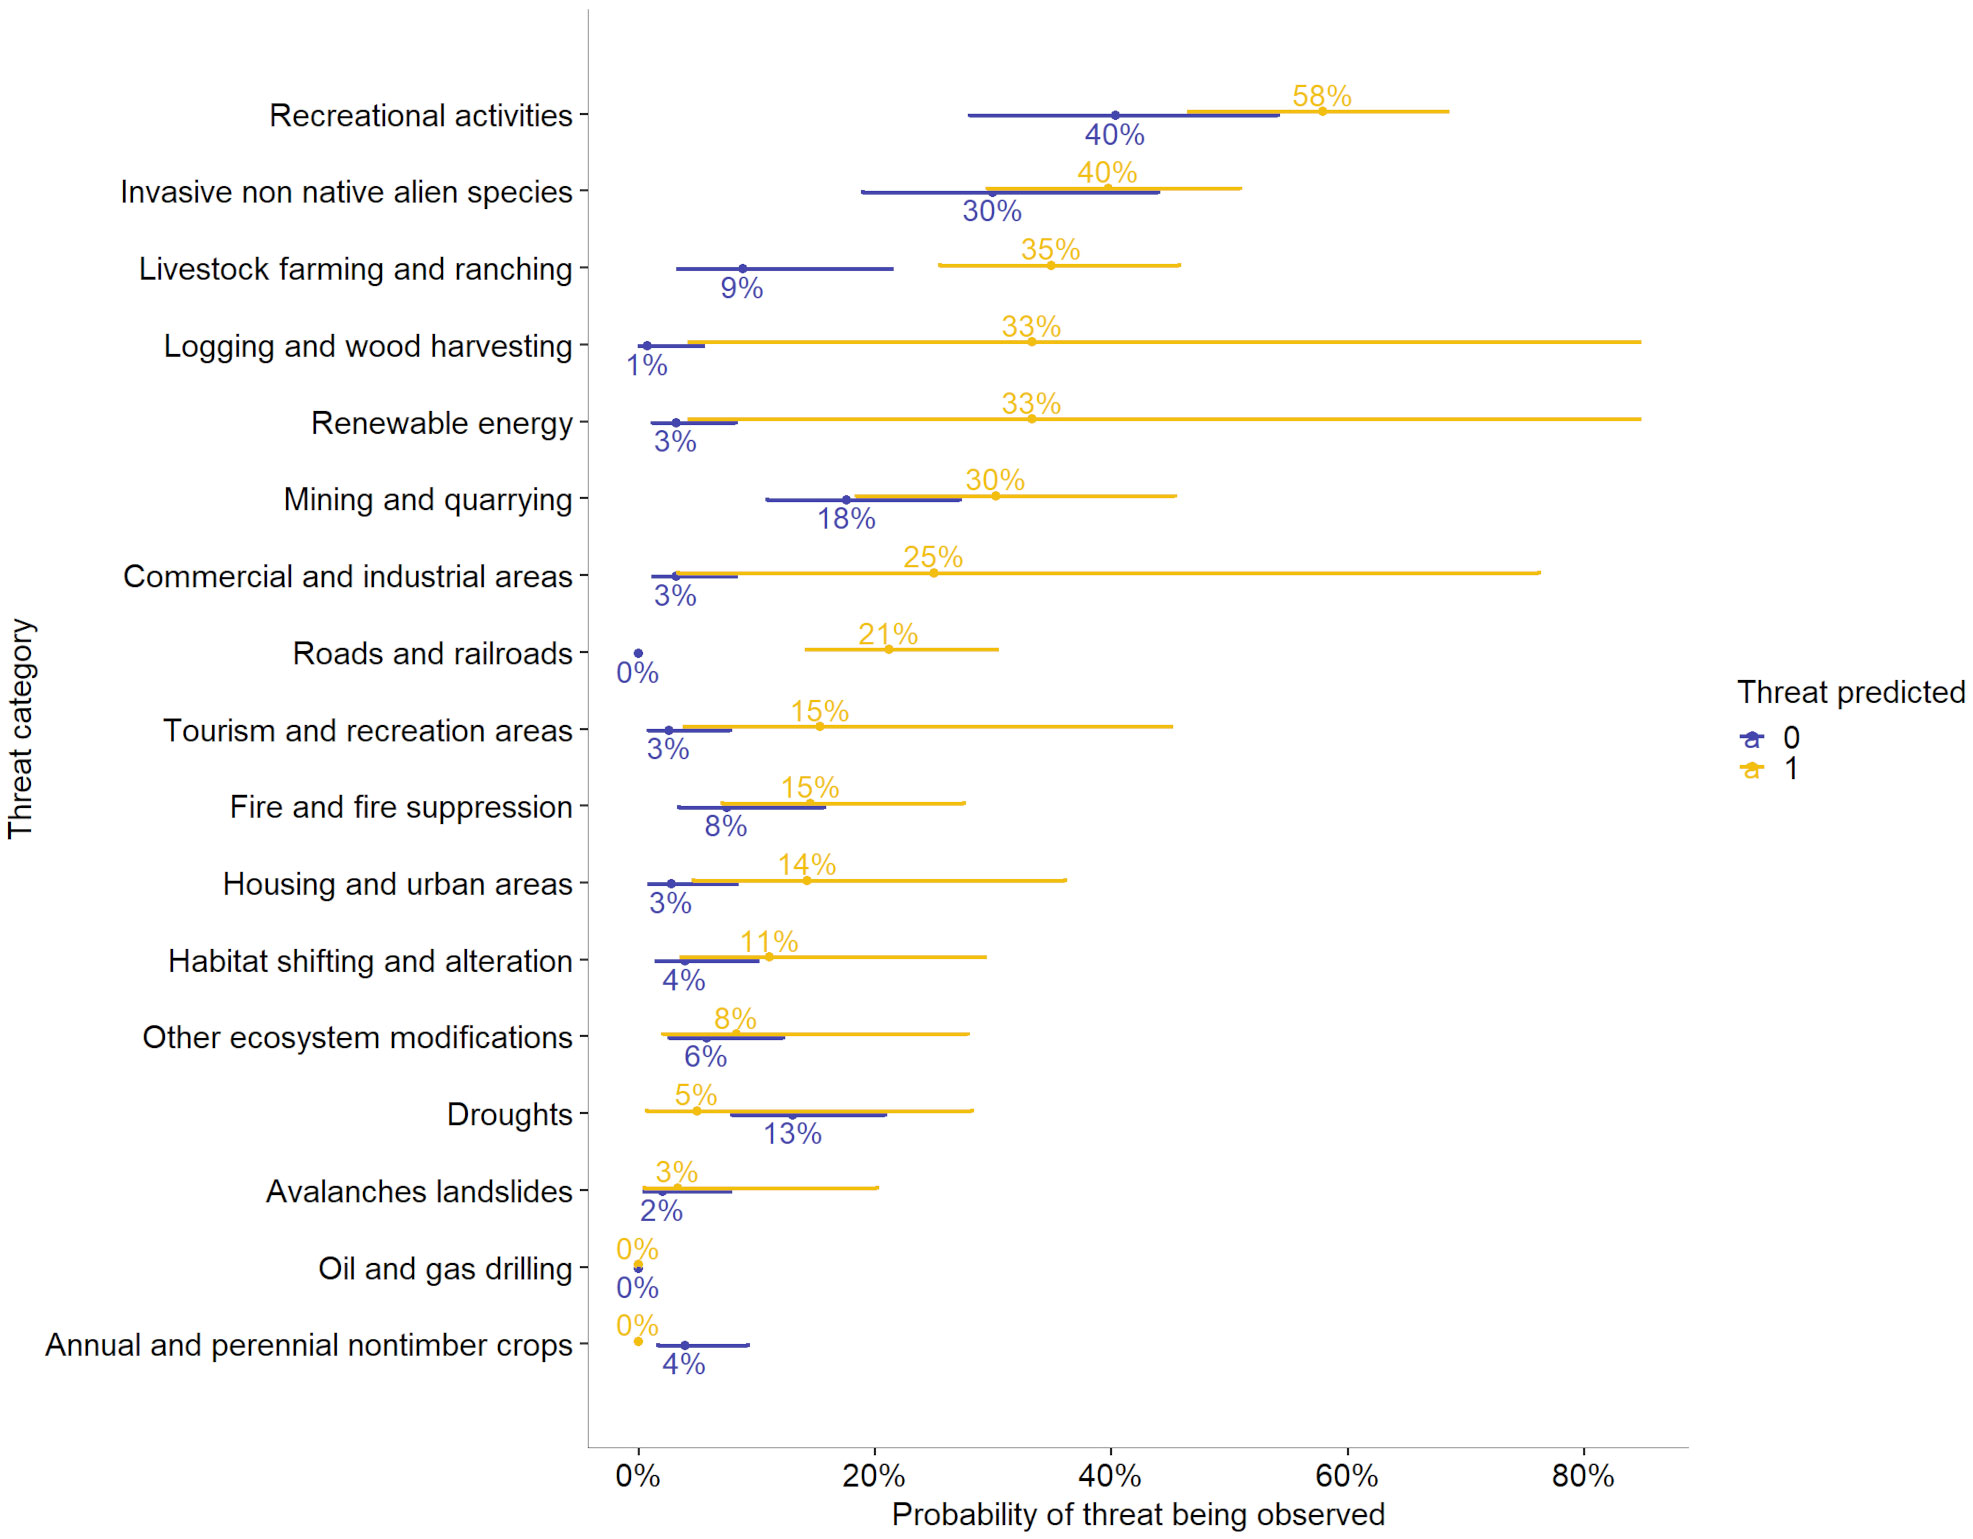
Figure 6 Probabilities that various threats will be observed for at least one occurrence per species when those threats are predicted by geospatial data versus when they are not. For instance, there is a 40% chance of a threat from recreation being observed when that threat is not predicted, but that chance increases to 58% when that threat is predicted. Error bars indicate the 95% confidence intervals of probability that a threat would be observed. Categories with only a single point at zero indicate cases with no observations in that category, e.g., there were no species observed as threatened by roads and railroads when that threat was not predicted.
Although the likelihood that a threat would be observed if it was predicted did not vary significantly among species, some species had a wider discrepancy than others in the total number of predicted and observed threats (Figure 2). The species with the widest discrepancies (for categories with both predicted and observed threat data present) were Diplacus ovatus (difference = 9), Astragalus preussii var. laxiflorus, Lepidium montanum var. nevadense, and Silene nuda (difference = 8) and Caulanthus barnebyi, Glossopetalon clokeyi, Physaria hitchcockii var. confluens, Primula nevadensis, and Sisyrinchium radicatum* (difference = 7). Most species (66.4%) had 3 or fewer discrepancies between the number of predicted and observed threats. On average, the absolute value of differences between observed and predicted threats was 2.76. All species with no threats noted/observed or threats unknown, except Imperata brevifolia, and Oenothera cavernae, had at least one predicted threat, and the mean number of predicted threats for this group was 3.58 (Figure 7). Total number of predicted and observed threats, the difference between them, the extent of climate change each species has experienced, and the age of the most recent surveys were combined to determine the level of monitoring priority for each species (Appendix 3, Table S5).
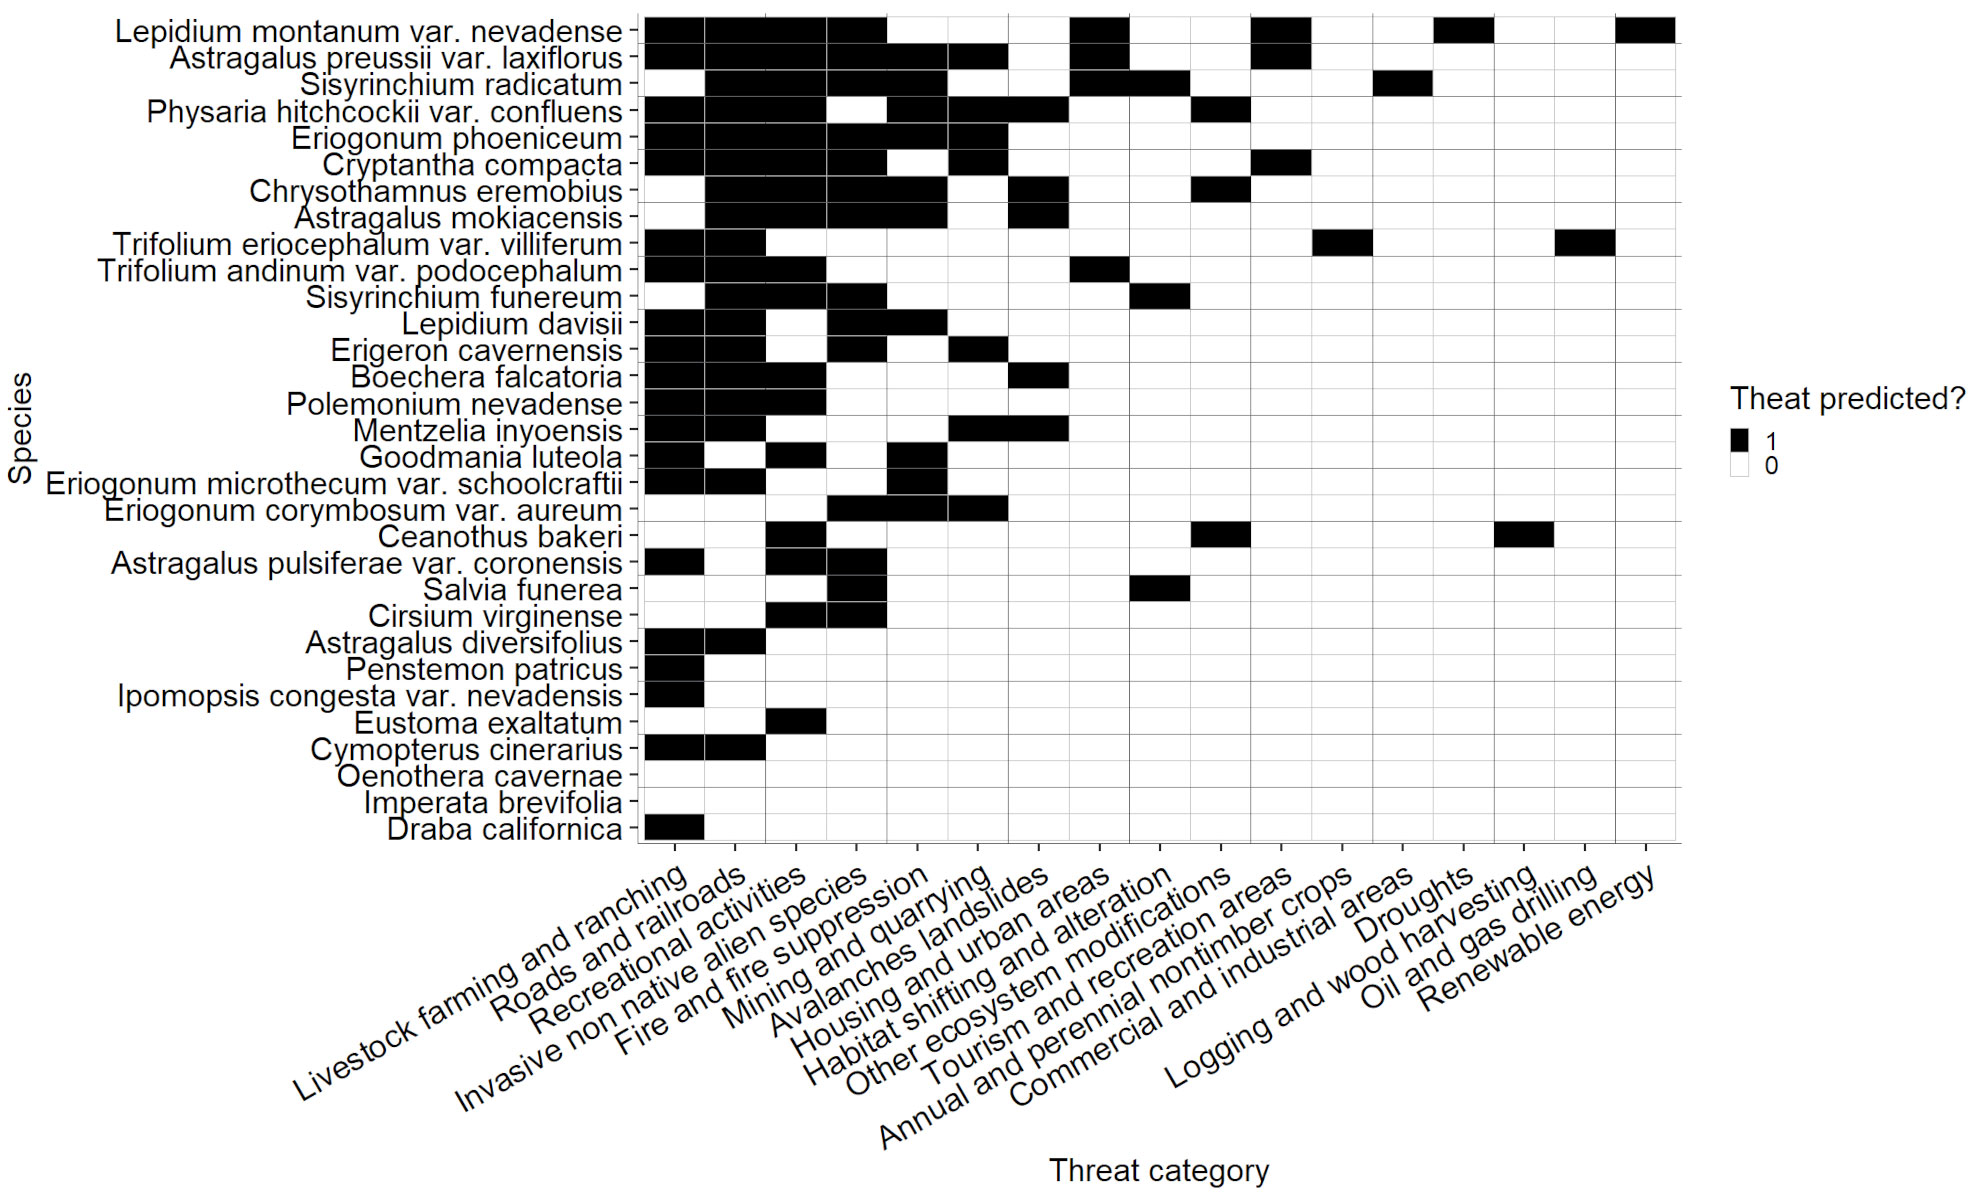
Figure 7 Threats predicted for rare species with threats unknown. Species are arranged in order of number of predicted threats along the Y axis. Black cells correspond to threats that are predicted, and white cells correspond to threats that are not predicted.
Q4: How do perceived historical and current threats compare?
Our full point occurrence dataset (N = 5767) includes observations made as early as 1898 (Mentzelia leucophylla). However, the earliest observations for which we have threat data recorded are from 1968, for Penstemon pudicus. We had data for 354 occurrences (6%) for which at least one threat had been noted in at least one survey. Many observations, such as those from the iNaturalist and herbarium data, only contained location, phenology, population size, visit date, and/or associated species data, with little or no information on threats. Of those occurrences with threat data, only 30 had threats recorded during more than one visit.
Overall, the average number of threats noted per occurrence of each species increased by 0.024 during every 10-year observation period (p < 0.05, R2adj. = 0.17, F (1, 53)). The proportion of species threatened by “Unspecified development” out of all species surveyed in each decade trended upward over time. However, this trend was not statistically significant, nor were changes in the proportions of monitored species that experienced other threats over time. This may be due to lack of power, with a relatively small sample size compared to a high number of threat categories.
Our data did not contain any dated surveys for two species, Draba subumbellata, and Grindelia fraxinipratensis; therefore, the total number of species with at least one dated survey was 126. Of those, the most recent survey date for half (63 species) fell within the last 10 years (between 2012-2022), while the other half had most recent surveys older than 10 years (Appendix 3, Figure S6, Table S6). Twenty-five of the 63 species with at least one occurrence surveyed within the last 10 years were species that we re-located during our fieldwork. The average survey year across all observations of all species was 1989, while the average year of the most recent survey for all species was 2007.
Discussion
While rare plant species are of great management and conservation interest, there are challenges to understanding threats. In Nevada, the remote nature of many populations hinders frequent monitoring, along with limited resources and expertise for field surveys. To inform future prioritization of effort, we systematically assessed observed and predicted threats to 128 of Nevada’s critically imperiled and imperiled rare plants. We examined the sources of those threats, their distribution across the state, and the number of threats affecting each species. We also asked how well observed threats correlated with threats predicted by geospatial data, for species and threats for which this question was possible. Our principal findings are several-fold. First, most of Nevada’s rare species are affected by multiple known threats— the most common of which, in descending order, are outdoor recreation, invasive non-native/alien species, livestock farming and ranching, mining and quarrying, and dams and water management/use. Threats were unknown for 21.9% of species (28/128); all but two of these species had threats predicted by geospatial data. The prevalence of different threats, both observed and predicted, varied among elevation groups and land management types. Geospatial data on climate change exposure indicate that all the critically imperiled rare species we examined are now (1990-2020) experiencing non-analogous to extremely different climatic conditions compared to the reference period (1960-1989). There was a moderate positive correlation between threats predicted by geospatial data and those observed during on-the-ground surveys (28.1%), and the likelihood that a threat would be observed for at least one occurrence of a species increased by a factor of 5.30 when that threat was predicted. There was variation among threat categories in the correlation between predicted and observed threats, suggesting that geospatial data may be more useful for predicting certain types of threats than others. It is also possible that there would be a greater correlation between observed and predicted threats if there was more recent survey data available for more species, highlighting the need for additional surveys. Even with these limitations, this effort has greater taxonomic coverage of critically imperiled rare plants in Nevada than any prior assessment (Hamilton et al., 2022); it will be of value to managers working to allocate monitoring and research efforts and to future research that aims to use geospatial data to predict threats to rare species.
How are rare species in Nevada affected by observed threats?
The threats that were most frequently observed to affect Nevada’s rare species are slightly different than those that are most prevalent in the rest of the continental United States. For instance, the proportion of species affected by recreation, the most prevalent threat in Nevada, is much higher (50.8%) than the national average (35%) (Hernández-Yáñez et al., 2016). This difference is likely driven by the high proportion of public land in Nevada (over 80% of Nevada’s land area) and active encouragement of outdoor recreation activities in much of that space by the State of Nevada and federal land managers (Cordell et al., 2013; Nevada SCORP Core Team, 2022). While outdoor recreation is important for physical and mental health and fosters support for conservation, it can result in rapid, direct damage to rare plants by trampling, dust deposition, and hydrologic alteration, and indirect damage by soil compaction, erosion, habitat fragmentation, and transport of invasive species, among other effects (Pickering et al., 2010; Newsome et al, 2012; Johnson, 2018). The true proportion of species currently threatened by recreation is likely to be even higher than our estimate. The average survey year for species that were noted to be threatened by outdoor recreation (including all observations for those species) was 1989, while the average most recent survey year for the same species was 2009. However, Nevada has experienced some of the most rapid population growth in the nation since 1990 (Pendleton et al., 2013; Hartley et al., 2021), and the already-increasing recreation impacts from this growth has intensified recently due to a COVID-19-related surge in outdoor activity participation (Nevada SCORP Core Team, 2022). Aggressive monitoring is needed to assess current recreation impacts on rare species statewide and to determine conservation actions needed for sustainable management.
The proportion of species affected by mining and quarrying (22% of species affected) is also higher in Nevada than in the rest of the continental U.S. (16.2%) (Hernández-Yáñez et al., 2016). The richly varied geology and concentration of valuable mineral resources in this state has led to a proliferation of mining claims and operations across Nevada, which frequently target unique substrates that support populations of rare edaphic specialist plant species (Nachlinger et al., 2001). Balancing mineral and energy extraction with rare species conservation requires careful assessment of all possible impacts and a long-term perspective (Sonter et al., 2018), and managing these threats for Nevada’s rare species will require consistent and proactive monitoring in areas known or predicted to be threatened by these processes as well as careful enforcement of laws and regulations that protect biodiversity against these pressures.
Correlations between predicted and observed threats
Our results regarding the correlation among predicted and observed threats provide insights into which types of threats are best predicted by geospatial data, and on the likelihood that those threats will be encountered on the landscape. For instance, while 25.8% of species overall were observed to be threatened by livestock, Nevada’s critically imperiled rare plants were 26% more likely to be impacted by livestock grazing if that threat was predicted than if it was not (e.g., plants were more likely to be impacted if they occurred within USFS and BLM grazing allotment or grazing pasture boundaries than if they occurred outside of mapped and designated grazing areas). Interestingly, we observed that there was a 9% chance that Nevada’s rarest plants would be impacted by livestock grazing (not feral horse grazing, which was noted separately) even when all occurrences were outside the boundaries of grazing allotments or grazing pastures. These relationships are different than those observed in other threat categories, such as development of housing and urban areas, where we saw an 11% increase in the probability of the threat being observed if it was predicted, with a 3% chance of observation in areas with no human impacts detected in the United States Geological Survey (USGS) National Land Cover Database. Future research may be able to further develop this concept to provide more precise estimations of predicted threats for use in modeling.
Discrepancies in the prevalence of predicted vs. observed threats likely result from a variety of factors, including spatial biases in sampling, site-level ecological variation, availability, age, and varied focus of survey data, and variation in the resolution and specificity of the geospatial threat datasets. For instance, the most common threat predicted by geospatial data was proximity to roads and railroads (the species we examined only occurred within close proximity to roads), while the most common observed threat was recreation. This may be related to a well-known spatial bias in botany where observations are skewed to be near roadways (Daru et al., 2018), which could have led to over-prediction of the proportion of species threatened by proximity to roads. Of course, not all plants that occur near roads are necessarily threatened by those roads, and for some occurrences, observed threats from proximity to roads may have been omitted by professional judgment or may have been recorded instead as threats due to recreation, such as from off-road driving. Many dirt roads in Nevada share dual purposes as OHV routes, and open habitat that is easily accessible from roadways is often impacted by illegal off-road driving (Ouren et al., 2007); 40.5% of species observed as threatened by recreation were affected by OHV use. Environmental heterogeneity may also result in broadly predicted threats that are not applicable in the precise locations or scale of occurrences; for instance, many rare species occupy soil or rock outcrops where rough terrain or poor soils reduces pressure from invasive non-native plants, grazing animals, and fire (Milchunas and Noy-Meir, 2002; Speziale and Ezcurra, 2015; Zefferman et al., 2015). There are also some cases where predicted threats may have only come to exist after the most recent survey. For example, several Angelica scabrida sites that had not been observed as threatened by fire when last visited in 1993 were within fire perimeters from incidents that occurred in 2010 and 2013. The moderate correlation between predicted and observed threats and varied sources of potential discrepancies can both help to inform efforts to allocate survey attention by identifying vulnerabilities and emphasize the importance of fieldwork by professional botanists to verify potential threats.
Climate change
The relationship between the predicted and observed threats due to climate change warrants special discussion. The threat from climate change to all of Nevada’s critically imperiled rare plant species is pervasive and concerning—all are currently experiencing non-analogous to extremely different climatic conditions compared to the late 1900s (Fitzpatrick and Dunn, 2019). However, the plants that experience the greatest magnitude of climatic changes are likely to be the most threatened (Chen et al., 2011), and we have identified which subset of Nevada’s critically imperiled rare plant species have been most strongly impacted and are therefore most in need of monitoring and research. Multivariate metrics, such as the one we used, show much faster rates of change in overall climatic conditions than univariate metrics such as temperature alone (Abatzoglou et al., 2020). This may partially explain the significant disjunction we observed between the perceived severity and location of species that have been observed by botanists to be threatened by climate change (likely based on knowledge of rising temperatures) and those that are predicted to be threatened. In our study, only 5.5% of rare plant species had been observed as threatened by habitat shifting and alteration due to climate change, primarily those occurring at high elevations; however, we found that 21% were predicted to be threatened, and that a greater total number of low-elevation species were predicted to be threatened than high elevation species.
While there is ample evidence that species growing at high elevations are threatened by climate change, as they are forced to ascend to track rising bioclimatic envelopes and thereby inherently experience reductions in available habitat area, research suggests that topographic variation may help to buffer these effects for montane species (Ackerly et al., 2010). Rare plant species growing at lower elevations are likely to be vulnerable to climate change because species growing on flat valley bottoms have less elevational amplitude in their ranges, are likely to be experiencing more rapid losses of existing climatic envelopes (Ackerly et al., 2010), and have fewer topographical refugia than high elevation species (Caicco et al., 2012). Additionally, while the xeromorphic adaptations of many low-elevation plant species may improve their tolerance to warmer temperatures (Harrison et al., 2009), some of these species may already be existing near the limits of their physiological tolerance, and changes in ecological interactions, disturbance and precipitation under climate change may further inhibit reproductive success (Damschen et al., 2012). Climate change may also exacerbate vulnerability to other threats such as recreation, livestock, development, invasive plant species, and feral horses, which may make mitigation of these threats more urgent than it would be in isolation (Parmesan et al., 2013; Parmesan and Hanley, 2015). There is a pressing need for research on the physiological tolerances, habitat requirements, and genetic diversity of Nevada’s rare plant species, as well as on how other threats might interact with climate change to better understand how these plants might be responding to climate change and to inform effective management.
Changes in threats over time
While the amount of climate change Nevada’s rare plants have been exposed to can be estimated with reasonable certainty, we found that time-series data on other threats to individual occurrences, and on changes in abundance and distribution, are missing for many species. There were many cases in our data where detailed visit notes on plant community composition, locality, and phenology had been recorded, but where threat information was not. It is therefore somewhat surprising that we were able to detect any significant variation in the average number of threats observed per occurrence over time; however, we suspect that our results underestimate the true change in number of threats that have accumulated for these species. Human population growth is known to result in the intensification of a multitude of threats, from recreation and groundwater depletion, to urban, rural, and agricultural development, pollution, resource extraction, over-exploitation, and spread of invasive species, among innumerable other impacts [Corlett, 2020; (Stévart et al., 2019; Nic Lughadha et al., 2020; Mendes et al., 2022)]. There is also evidence that these threats have grown in severity for several of Nevada’s rare species individually, including urban development for Erythranthe carsonensis (Johnson, 2018), recreation and feral horses for Castilleja salsuginosa (Johnson, 2021), and recreation and development of tourism and recreation areas for Rorippa subumbellata (Stanton, 2015). Based on these examples, and on trends in other areas (Hartley et al., 2021; Nevada SCORP Core Team, 2022), we expect human population growth to have had, and to continue to have, increasing impacts on most of the rare plants in Nevada. Repeated observations of threats, as well as of changes in abundance and distribution, should be prioritized during future monitoring so that threat severity and population status can be tracked over time.
Conclusion
We used field observations, literature review, and geospatial data to identify what threats are most prevalent in Nevada, which species are most heavily burdened by known threats, and which species are most vulnerable to a variety of predicted threats. We also examined the correlation between predicted threats and those observed on the ground to understand what threats geospatial data are most useful for predicting. Our work illustrates the importance of continuous monitoring by professional botanists to understand the status of rare species and suggests that there is a pressing need for monitoring and research efforts in Nevada to be expanded to match the increasing threats facing the rare species in this state. We recommend that efforts target species with the most known threats and the highest discrepancies between observed and predicted threats, as well as species that are likely to be most intensely impacted by climate change. A more complete and up-to-date understanding of the threat status of Nevada’s rare species will allow state and federal agencies and non-profit organizations to best prioritize placement of conservation areas and funding associated with current and future conservation initiatives such as America the Beautiful, the Recovering America’s Wildlife Act, and Conserve Nevada.
Data availability statement
The datasets presented in this article are publicly available or available to qualified researchers by request from the Nevada Division of Natural Heritage, to protect locality data of rare species. Requests to access the datasets should be directed to Jamey McClinton, am1jY2xpbnRvbkBoZXJpdGFnZS5udi5nb3Y=.
Author contributions
JM, EL, and SK conceived of the project and secured major funding. JM collected and analyzed threat data and led writing of the manuscript, with assistance from EL, EG, and SK. EG analyzed climate change data and contributed to figure preparation and editing. All authors contributed to the article and approved the submitted version.
Funding
We appreciate the generous grant support from the U.S. Fish and Wildlife Service under agreement #F20AC10813.
Acknowledgments
We would like to thank all of the people who have contributed their time, expertise, and support throughout this project, including Arnold (Jerry) Tiehm, the curator of the University of Nevada, Reno Herbarium, as well as Jim Morefield, Kristin Szabo, and Eric Miskow with the Nevada Division of Natural Heritage for data, advice on methods and project direction, and thoughtful comments on the manuscript, and Cathy Silliman, Maddy Lowe, Sophia Heston, Rosemary Frederick, Elouise Hamilton, Mandy Fuller, and Logan McClinton for their many days of field help. The findings and conclusions in this article are those of the authors and do not necessarily represent the views of the US Fish and Wildlife Service.
Conflict of interest
The authors declare that the research was conducted in the absence of any commercial or financial relationships that could be construed as a potential conflict of interest.
Publisher’s note
All claims expressed in this article are solely those of the authors and do not necessarily represent those of their affiliated organizations, or those of the publisher, the editors and the reviewers. Any product that may be evaluated in this article, or claim that may be made by its manufacturer, is not guaranteed or endorsed by the publisher.
Supplementary material
The Supplementary Material for this article can be found online at: https://www.frontiersin.org/articles/10.3389/fcosc.2022.1070490/full#supplementary-material
References
Abatzoglou J. T., Dobrowski S. Z., Parks S. A. (2020). Multivariate climate departures have outpaced univariate changes across global lands. Sci. Rep. 10 (1), 3891. doi: 10.1038/s41598-020-60270-5
Abatzoglou J. T., Dobrowski S. Z., Parks S. A., Hegewisch K. C. (2018). TerraClimate, a high-resolution global dataset of monthly climate and climatic water balance from 1958–2015. Sci. Data 5 (1), 170191. doi: 10.1038/sdata.2017.191
Ackerly D. D., Loarie S. R., Cornwell W. K., Weiss S. B., Hamilton H., Branciforte R., et al. (2010). The geography of climate change: implications for conservation biogeography. Diversity distributions 16, 476–487. doi: 10.1111/j.1472-4642.2010.00654.x
Akasaka M., Kadoya T., Ishihama F., Fujita T., Fuller R. A. (2017). Smart protected area placement decelerates biodiversity loss: A representation-extinction feedback leads rare species to extinction. Conserv. Lett. 10, 539–546. doi: 10.1111/conl.12302
Anacker B. L., Gogol-Prokurat+ M., Leidholm K., Schoenig S. (2013). Climate change vulnerability assessment of rare plants in California. Madroño 60, 193–210. doi: 10.3120/0024-9637-60.3.193
Balding M., Williams K. J. H. (2016). Plant blindness and the implications for plant conservation. Conserv. Biol. 30, 1192–1199. doi: 10.1111/cobi.12738
Ballesteros-Cánovas J. A., Trappmann D., Madrigal-González J., Eckert N., Stoffel M. (2018). Climate warming enhances snow avalanche risk in the Western Himalayas. Proc. Natl. Acad. Sci. 115 (13), 3410–3415. doi: 10.1073/pnas.1716913115
Bargelt L., Fortin M.-J., Murray D. L. (2020). Assessing connectivity and the contribution of private lands to protected area networks in the United States. PloS One 15, e0228946. doi: 10.1371/journal.pone.0228946
Baughman O. W., Agneray A. C., Forister M. L., Kilkenny F. F., Espeland E. K., Fiegener R. (2019). Strong patterns of intraspecific variation and local adaptation in great basin plants revealed through a review of 75 years of experiments. Ecol. Evol. 9, 6259–6275. doi: 10.1002/ece3.5200
Bureau of Land Management (BLM) (2020). BLM NV surface management agency (SMA) polygons. In: Bureau of Land Management, U.S. Department of Interior (Reno, Nevada) (Accessed 2/25/2021).
Butchart S. H. M., Scharlemann J. P. W., Evans M. I., Quader S., Aricò S., Arinaitwe J., et al. (2012). Protecting important sites for biodiversity contributes to meeting global conservation targets. PloS One 7, e32529. doi: 10.1371/journal.pone.0032529
Caicco S., Edwards F., Bair J. (2012). Assessing vulnerability of the rarest plants in the great basin of Nevada to climate change. Calocortiana 1, 91–105.
Cerrejón C., Valeria O., Marchand P., Caners R. T., Fenton N. J. (2021). No place to hide: rare plant detection through remote sensing. Diversity distributions 27, 948–961. doi: 10.1111/ddi.13244
Chen I.-C., Hill J. K., Ohlemüller R., Roy D. B., Thomas C. D. (2011). Rapid range shifts of species associated with high levels of climate warming. Science 333, 1024–1026. doi: 10.1126/science.1206432
Coates D. J., Mcarthur S. L., Byrne M. (2015). Significant genetic diversity loss following pathogen driven population extinction in the rare endemic banksia brownii (Proteaceae). Biol. Conserv. 192, 353–360. doi: 10.1016/j.biocon.2015.10.013
Cordell H. K., Betz C. J., Zarnoch S. J. (2013). Recreation and protected land resources in the United States: a technical document supporting the forest service 2010 RPA assessment (General Technical Report SRS-GTR-169- Asheville, NC: Southern Research Station, USDA Forest Service), x + 198 pp.
Corlett R. (2018). Biodiversity and ecosystem services: Towards ecological security in tropical and subtropical East Asia. Biodiversity Sci. 26, 766–774. doi: 10.17520/biods.2018020
Corlett R. T. (2020). Safeguarding our future by protecting biodiversity. Plant Diversity 42, 221–228. doi: 10.1016/j.pld.2020.04.002
Corlett R. T., Tomlinson K. W. (2020). Climate change and edaphic specialists: Irresistible force meets immovable object? Trends Ecol. Evol. 35, 367–376. doi: 10.1016/j.tree.2019.12.007
Cuena-Lombraña A., Fois M., Cogoni A., Bacchetta G. (2021). Where we come from and where to go: Six decades of botanical studies in the Mediterranean wetlands, with Sardinia (Italy) as a case study. Wetlands 41, 69. doi: 10.1007/s13157-021-01464-z
Damschen E. I., Harrison S., Ackerly D. D., Fernandez-Going B. M., Anacker B. L. (2012). Endemic plant communities on special soils: early victims or hardy survivors of climate change? J. Ecol. 100, 1122–1130. doi: 10.1111/j.1365-2745.2012.01986.x
Daru B. H., Park D. S., Primack R. B., Willis C. G., Barrington D. S., Whitfeld T. J. S., et al. (2018). Widespread sampling biases in herbaria revealed from large-scale digitization. New Phytol. 217, 939–955. doi: 10.1111/nph.14855
Dee L. E., Cowles J., Isbell F., Pau S., Gaines S. D., Reich P. B. (2019). When do ecosystem services depend on rare species? Trends Ecol. Evol. 34, 746–758. doi: 10.1016/j.tree.2019.03.010
Duraiappah A. K., Naeem S., Agardy T., Ash N. J., Cooper H. D., Diaz S., et al. (2005). Ecosystems and human well-being: biodiversity synthesis; a report of the millennium ecosystem assessment (World Resources Institute, Washington, DC).
Enquist B. J., Feng X., Boyle B., Maitner B., Newman E. A., Jørgensen P. M., et al. (2019). The commonness of rarity: Global and future distribution of rarity across land plants. Sci. Adv. 5, eaaz0414. doi: 10.1126/sciadv.aaz0414
Farber O., Kadmon R. (2003). Assessment of alternative approaches for bioclimatic modeling with special emphasis on the mahalanobis distance. Ecol. Model. 160, 115–130. doi: 10.1016/s0304-3800(02)00327-7
Fitzpatrick M. C., Dunn R. R. (2019). Contemporary climatic analogs for 540 north American urban areas in the late 21st century. Nat. Commun. 10, 614. doi: 10.1038/s41467-019-08540-3
Fois M., Cuena-Lombraña A., Fenu G., Cogoni D., Bacchetta G. (2018). Does a correlation exist between environmental suitability models and plant population parameters? an experimental approach to measure the influence of disturbances and environmental changes. Ecol. Indic. 86, 1–8. doi: 10.1016/j.ecolind.2017.12.009
Gogol-Prokurat M. (2011). Predicting habitat suitability for rare plants at local spatial scales using a species distribution model. Ecol. Appl. 21, 33–47. doi: 10.1890/09-1190.1
Gosper C. R., Kinloch J., Coates D. J., Byrne M., Pitt G., Yates C. J. (2021). Differential exposure and susceptibility to threats based on evolutionary history: how OCBIL theory informs flora conservation. Biol. J. Linn. Soc. 133, 373–393. doi: 10.1093/biolinnean/blaa170
Greenwald D. N., Bradley C. (2008). Assessing protection for imperiled species of Nevada, U.S.A.: are species slipping through the cracks of existing protections? Biodiversity Conserv. 17, 2951–2960. doi: 10.1007/s10531-008-9407-3
Guy Z. M., Birkeland K. W. (2013). Relating complex terrain to potential avalanche trigger locations. Cold Regions Sci. Technol. 86, 1–13. doi: 10.1016/j.coldregions.2012.10.008
Hamilton H., Smyth R. L., Young B. E., Howard T. G., Tracey C., Breyer S., et al. (2022). Increasing taxonomic diversity and spatial resolution clarifies opportunities for protecting US imperiled species. Ecol. Appl. 32 (3): e2534. doi: 10.1002/eap.2534
Harrison S. (2015). Plant ecology and evolution in harsh environments. Madroño 62 (2), 136. doi: 10.3120/0024-9637-62.2.136
Harrison S., Damschen E., Going B. M. (2009). Climate gradients, climate change, and special edaphic floras. Northeastern Nat. 16, 121–130. Available at: http://www.jstor.org/stable/41495810.
Hartley C., Perry M., Rogers L. (2021). A preliminary analysis of U.S. and state-level results from the 2020 census (United States Census Bureau). Available at: https://census.gov.
Havens K., Kramer A. T., Guerrant E. O. (2014). Getting plant conservation right (or not): The case of the United States. Int. J. Plant Sci. 175, 3–10. doi: 10.1086/674103
Herbaria, Consortium of Intermountain (2021) Collections search. Available at: https://intermountainbiota.org/ (Accessed 10/11/2021).
Hernández-Yáñez H., Kos J. T., Bast M. D., Griggs J. L., Hage P. A., Killian A., et al. (2016). A systematic assessment of threats affecting the rare plants of the United States. Biol. Conserv. 203, 260–267. doi: 10.1016/j.biocon.2016.10.009
Humphreys A. M., Govaerts R., Ficinski S. Z., Nic Lughadha E., Vorontsova M. S. (2019). Global dataset shows geography and life form predict modern plant extinction and rediscovery. Nat. Ecol. Evol. 3, 1043–1047. doi: 10.1038/s41559-019-0906-2
Jenkins C. N., Van Houtan Kyle S., Pimm Stuart L., Sexton Joseph O. (2015). US Protected lands mismatch biodiversity priorities. Proc. Natl. Acad. Sci. 112, 5081–5086. doi: 10.1073/pnas.1418034112
Johnson J. (2018). “Current knowledge and conservation status of erythranthe carsonensis fraga (Phrymaceae), the Carson valley monkeyflower,” in Department of conservation and natural resources(Carson City, Nevada: Nevada Natural Heritage Program).
Johnson J. (2021). Hot spring hill- June 2021 site visit report Vol. 1 (Carson City, Nevada: Nevada Division of Natural Heritage), 11.
Jones K. R., Venter O., Fuller Richard A., Allan James R., Maxwell Sean L., Negret Pablo J., et al. (2018). One-third of global protected land is under intense human pressure. Science 360, 788–791. doi: 10.1126/science.aap9565
Kier G., Mutke J., Dinerstein E., Ricketts T. H., Küper W., Kreft H., et al. (2005). Global patterns of plant diversity and floristic knowledge. J. Biogeography 32, 1107–1116. doi: 10.1111/j.1365-2699.2005.01272.x
Kramer A. T., Havens K. (2015). Report in brief: Assessing botanical capacity to address grand challenges in the United States. Natural Areas J. 35, 83–89. doi: 10.3375/043.035.0112
Leitão R. P., Zuanon J., Villéger S., Williams S. E., Baraloto C., Fortunel C., et al. (2016). Rare species contribute disproportionately to the functional structure of species assemblages. Proc. R. Soc. B: Biol. Sci. 283, 20160084. doi: 10.1098/rspb.2016.0084
Lenth R. (2020). R package “emmeans”: Estimated marginal means, aka least-squares means. Available from: https://CRAN.R-project.org/package=emmeans.
Lesica P., Yurkewycz R., Crone E. E. (2006). Rare plants are common where you find them. Am. J. Bot. 93, 454–459. doi: 10.3732/ajb.93.3.454
McCune J. L., Harrower W. L., Avery-Gomm S., Brogan J. M., Csergő A.-M., Davidson L. N. K., et al. (2013). Threats to Canadian species at risk: An analysis of finalized recovery strategies. Biol. Conserv. 166, 254–265. doi: 10.1016/j.biocon.2013.07.006
Mendes S. B., Timóteo S., Loureiro J., Castro S. (2022). The impact of habitat loss on pollination services for a threatened dune endemic plant. Oecologia 198, 279–293. doi: 10.1007/s00442-021-05070-y
Milchunas D. G., Noy-Meir I. (2002). Grazing refuges, external avoidance of herbivory and plant diversity. Oikos 99, 113–130. doi: 10.1034/j.1600-0706.2002.990112.x
Millennium Ecosystem Assessment (2005). Ecosystems and human well-being: Synthesis (Washington, DC: Island Press).
Mouillot D., Bellwood D. R., Baraloto C., Chave J., Galzin R., Harmelin-Vivien M., et al. (2013). Rare species support vulnerable functions in high-diversity ecosystems. PloS Biol. 11(5), e1001569. doi: 10.1371/journal.pbio.1001569
Mozingo H. N., Williams M. J. (1981). Threatened and endangered plants of Nevada: an illustrated manual. Submitted to U.S.Fish and Wildlife Service and the U.S. Bureau of Land Management, Nevada State Office, Reno, NV.
Murphy D. D., Knopp C. M., Pacific Southwest Research Station (2000). Lake Tahoe Watershed Assessment: Appendixes. Pacific Southwest Research Station, USDA Forest Service, Davis, CA.
Nachlinger J., Sochi K., Comer P., Kittel G., Dorfman D. (2001). Great Basin: An ecoregion-based conservation blueprint. The Nature Conservancy, Reno, NV, USA.
NatureServe (2020). Habitat-based plant element occurrence delimitation guidance (Arlington, Virginia: NatureServe).
NDNH (2022). Nevada Division of natural heritage frequently asked questions (Carson City, Nevada: Department of Conservation and Natural Resources). Available at: https://heritage.nv.gov/about/frequently-asked-questions (Accessed 9/21/2022).
Negrón-Ortiz V. (2014). Pattern of expenditures for plant conservation under the endangered species act. Biol. Conserv. 171, 36–43. doi: 10.1016/j.biocon.2014.01.018
Nevada SCORP Core Team (2022). Nevada Statewide comprehensive outdoor recreation plan. Nevada Division of Conservation and Natural Resources, Nevada Division of Outdoor Recreation, Carson City, Nevada.
Newsome D., Dowling R. K., Moore S. A. (2012). Natural area tourism: Ecology, impacts and management (United Kingdom: Channel View Publications).
Nic Lughadha E., Bachman S. P., Leão T. C. C., Forest F., Halley J. M., Moat J., et al. (2020). Extinction risk and threats to plants and fungi. Plants People Planet 2, 389–408. doi: 10.1002/ppp3.10146
NRS (2012). “CHAPTER 527,” in Protection and preservation of timbered lands, trees, and flora. Nevada State Legislature, Carson City, NV
Omernik J. M., Griffith G. E. (2014). Ecoregions of the conterminous United States: Evolution of a hierarchical spatial framework. Environ. Manage. 54, 1249–1266. doi: 10.1007/s00267-014-0364-1
Ouren D. S., Haas C., Melcher C. P., Stewart S. C., Ponds P. D., Sexton N. R., et al. (2007). “Environmental effects of off-highway vehicles on bureau of land management lands,” in A literature synthesis, annotated bibliographies, extensive bibliographies, and internet resources report 2007-1353(Reston, VA). doi: 10.3133/ofr20071353
Parmesan C., Burrows M. T., Duarte C. M., Poloczanska E. S., Richardson A. J., Schoeman D. S., et al. (2013). Beyond climate change attribution in conservation and ecological research. Ecol. Lett. 16, 58–71. doi: 10.1111/ele.12098
Parmesan C., Hanley M. E. (2015). Plants and climate change: complexities and surprises. Ann. Bot. 116, 849–864. doi: 10.1093/aob/mcv169
Peitzsch E. H., Pederson G. T., Birkeland K. W., Hendrikx J., Fagre D. B. (2021). Climate drivers of large magnitude snow avalanche years in the U.S. northern rocky mountains. Sci. Rep. 11 (1), 10032. doi: 10.1038/s41598-021-89547-z
Pendleton B. K., Chambers J. C., Brooks M. L., Ostoja S. M. (2013). Ecosystem stressors in southern Nevada. U.S. Forest Service Rocky Mountain Research Station Gen. Tech. Rep. RMRS-GTR 304, 9–13.
Perla R. I. (1976). Avalanche handbook. 238 p, ill., charts, maps; 226 cm. U.S. Dept. of Agriculture, Forest Service. Accessible at: https://handle.nal.usda.gov/10113/CAT10309487.
Pickering C. M., Hill W., Newsome D., Leung Y.-F. (2010). Comparing hiking, mountain biking and horse riding impacts on vegetation and soils in Australia and the United States of America. J. Environ. Manage. 91, 551–562. doi: 10.1016/j.jenvman.2009.09.025
Pimm S. L., Jenkins C. N., Abell R., Brooks T. M., Gittleman J. L., Joppa L. N., et al. (2014). The biodiversity of species and their rates of extinction, distribution, and protection. Science 344, 1246752. doi: 10.1126/science.1246752
R Core Team. (2020). R: A language and environment for statistical computing (Vienna, Austria: R Foundation for Statistical Computing).
Salafsky N., Salzer D., Stattersfield A. J., Hilton-Taylor C., Neugarten R., Butchart S. H. M., et al. (2008). A standard lexicon for biodiversity conservation: Unified classifications of threats and actions. Conserv. Biol. 22, 897–911. doi: 10.1111/j.1523-1739.2008.00937.x
Schulze K., Knights K., Coad L., Geldmann J., Leverington F., Eassom A., et al. (2018). An assessment of threats to terrestrial protected areas. Conserv. Lett. 11, e12435. doi: 10.1111/conl.12435
Schweizer J., Bruce Jamieson J., Schneebeli M. (2003). Snow avalanche formation. Rev. Geophysics 41, 1016. doi: 10.1029/2002rg000123
Slocum T. A., McMaster R. M., Kessler F. C., Howard H. H., Mc Master R. B. (2008). Thematic cartography and geographic visualization. (3rd ed.) Prentice Hall.
Sonter L. J., Ali S. H., Watson J. E. M. (2018). Mining and biodiversity: Key issues and research needs in conservation science. Proceedings of the Royal Society B 25: 20181926. doi: 10.1098/rspb.2018.1926
Speziale K. L., Ezcurra C. (2015). Rock outcrops as potential biodiversity refugia under climate change in north Patagonia. Plant Ecol. Diversity 8, 353–361. doi: 10.1080/17550874.2014.983200
Stanton A. (2015). Conservation strategy for Tahoe yellow cress (Rorippa subumbellata) (Albany, CA: USDA Forest Service Pacific Southwest Research Station).
Staude I. R., Navarro L. M., Pereira H. M. (2020). Range size predicts the risk of local extinction from habitat loss. Global Ecol. Biogeography 29, 16–25. doi: 10.1111/geb.13003
Stein B. A., Kutner L. S., Adams J. S. (2000). Precious heritage: the status of biodiversity in the United States (Oxford: Oxford University Press).
Stévart T., Dauby G., Lowry P. P., Blach-Overgaard A., Droissart V., Harris D. J., et al. (2019). A third of the tropical African flora is potentially threatened with extinction. Sci. Adv. 5, eaax9444. doi: 10.1126/sciadv.aax9444
Ueda K. (2021). iNaturalist research-grade observations. Available at: https://inaturalist.org. Occurrence dataset doi: 10.15468/ab3s5x accessed via GBIF.org on 2021-10-04.
U.S. Geological Survey (USGS) Gap Analysis Project (GAP) (2022). Protected Areas Database of the United States (PAD-US) 3.0: U.S. Geological Survey data release. doi: 10.5066/P9Q9LQ4B
U.S. Forest Service (USFS) (2005). Forest Service Manual 2600. In: U.S. Department of Agriculture, Forest Service.
Wells P. V. (1983). Paleobiogeography of montane islands in the great basin since the last glaciopluvial. Ecol. Monogr. 53, 341–382. doi: 10.2307/1942644
Zeileis A., Hothorn T. (2002). Diagnostic checking in regression relationships (R News), 7–10. Available at: https://CRAN.R-project.org/doc/Rnews/
Keywords: GIS, native plants, natural heritage, western United States, plant conservation section, threat prediction
Citation: McClinton JD, Kulpa SM, Grames EM and Leger EA (2022) Field observations and remote assessment identify climate change, recreation, invasive species, and livestock as top threats to critically imperiled rare plants in Nevada. Front. Conserv. Sci. 3:1070490. doi: 10.3389/fcosc.2022.1070490
Received: 14 October 2022; Accepted: 07 November 2022;
Published: 02 December 2022.
Edited by:
Richard T. Corlett, Xishuangbanna Tropical Botanical Garden (CAS), ChinaReviewed by:
Jennifer Lesley Silcock, The University of Queensland, AustraliaMauro Fois, University of Cagliari, Italy
Copyright © 2022 McClinton, Kulpa, Grames and Leger. This is an open-access article distributed under the terms of the Creative Commons Attribution License (CC BY). The use, distribution or reproduction in other forums is permitted, provided the original author(s) and the copyright owner(s) are credited and that the original publication in this journal is cited, in accordance with accepted academic practice. No use, distribution or reproduction is permitted which does not comply with these terms.
*Correspondence: Jamey D. McClinton, am1jY2xpbnRvbkBoZXJpdGFnZS5udi5nb3Y=