 Shweta Shivakumar1,2*
 David Carricondo-Sánchez3
 Vidya Athreya4Morten Odden3Sat Pal Dhiman5Srinivas Vaidyanathan6
 Krithi K. Karanth1,7
- 1Centre for Wildlife Studies, Bengaluru, India
- 2Manipal Academy of Higher Education, Centre for Doctoral Studies, Manipal, India
- 3Department of Forestry and Wildlife Management, Faculty of Applied Ecology, Agricultural Sciences and Biotechnology, Inland Norway University of Applied Sciences, Elverum, Norway
- 4Wildlife Conservation Society- India, Bengaluru, India
- 5Himachal Pradesh Council for Science, Technology and Environment, Shimla, India
- 6Foundation for Ecological Research, Advocacy and Learning (FERAL), Bengaluru, India
- 7Nicholas School of the Environment, Duke University, Durham, NC, United States
Shared spaces in Africa and Asia accommodate both humans and big cats. This engenders rare but distinctive cases of human fatalities by lions, tigers, and leopards. Among big cats, leopards have the widest range and occur even among high densities of humans. This increased potential for encounters with humans results in attacks, exemplified most by India where 50% of the states report human injuries and deaths due to leopards. Himachal Pradesh (HP) state reported 30 lethal and 287 non-lethal leopard attacks on humans per year between 2004 – 2015 (N=317). Identifying patterns in big cat attacks on people facilitates targeted interventions for decreasing such fatalities. This study aims to detect if leopards are cluster-causing agents of human injuries and deaths. We identify the patterns of leopard attacks on humans in Himachal Pradesh by examining the following questions: (a) do leopard-attributed attacks on humans cluster in space and time? and among the leopard-attributed attacks (b) do unprovoked attacks on humans cluster spatio-temporally? and (c) what environmental factors are associated with the clustered leopard attacks on humans? We employed a space-time permutation scan statistic commonly used in epidemiology to test for spatio-temporal clustering of leopard attacks. Attacks were spread across 75% (~42,000 km sq.) of HP in 11 out of 12 districts. We found that 23% of attacks clustered into 12 significant spatio-temporal clusters. Nearly 14% of the leopard-attributed attacks (N=317) were unprovoked and attacks displaying “predatory” signs did not form significant clusters. Binomial regression models were run to test association of eight environmental factors with clustered attacks. We found that leopard-attributed attacks farther away from the protected area boundary and closer to the district boundary had higher probability of clustering. The framework developed in this study to identify the outbreak of unprovoked leopard attacks confirms the absence of dedicated “man-eaters” in the study region. This approach can be applied to adaptively manage human-wildlife conflict and it also demonstrates the utility of scan statistic in ecological research.
1 Introduction
Human deaths due to big cats such as tigers, leopards and lions are rare but distinctive as compared to other causes of human fatalities. The leading cause of human deaths globally is ischemic heart diseases with ~9 million human deaths per year (World Health Organization, 2020). Contrarily, Asian, and African countries such as Tanzania, Kenya, Bangladesh, India, and Nepal report up to 50 attacks due to big cats per year per study region (Jalais, 2008; Kushnir et al., 2010; Dickman et al., 2013; Kushnir et al., 2014; Govindrajan, 2015; Dhungana et al., 2018). Although the media report these stories in a sensational manner, the level of attacks is indisputable (Crown and Doubleday, 2017; Hathaway et al., 2017). A recent global review on human-felid conflict in 30 countries identified that 27% of the scientific publications were leopard-related (N=192), and 21% of the publications were from India (N=186) (Holland et al., 2018). Between 2012- 2013 alone, 78,656 ex-gratia applicants registered across 18 Indian state Forest Departments for damages attributed to wild animals. Almost 25% of the damages were due to leopards and tigers predating on livestock, and causing human injuries and deaths (Karanth et al., 2018). Leopard attacks are reported frequently in Indian states of West Bengal, Gujarat, Uttarakhand, and Maharashtra (Athreya et al., 2013; Bhattacharjee and Parthasarathy, 2013; Sondhi et al., 2016; Kshettry et al., 2017). Due to these interactions, continued persecution is a major threat to survival of leopard populations, in addition to habitat fragmentation and prey depletion (Stein et al., 2017). Since the leopards’ geographic range overlap with human-dominated areas, the potential to encounter humans increases, often leading to human fatalities and injuries (Jacobson et al., 2016). In the early 1900’s, the fatalities were majorly attributed to “man-eating” or problematic leopards (Nyhus and Tilson, 2010). More recently, human behavior, unsuccessful leopard management regimes and accidental encounters with leopards were determined as the causes of human fatalities due to leopards (Athreya et al., 2011; Kshettry et al., 2017).
The most common pattern of big cat attacks on humans is clustering, where events concentrate over space and time. Spatial clustering could occur due to human behavior patterns overlapping with leopard space use, increasing the interface between them. Studies have shown that the spatial nature of human activities such as bush-pruning in the tea estates of North East-India, non-timber forest produce collection in the buffer regions of a protected area in Western India, and livestock grazing within protected areas in Nepal leads to clustering of leopard-caused attacks (Gurung et al., 2008; Kshettry et al., 2017; Abade et al., 2018). Attack clusters also exhibit seasonal/time-associated patterns seen as increased frequency of attacks on humans by big cats. Additionally, seasonal changes in leopard attack frequency on humans has been attributed to changes in habitat structure, associated human activity and, prey depletions in the wild (Athreya et al., 2011; Shehzad et al., 2015; Acharya et al., 2016).
Detection of such spatial clusters of leopard attacks involves identifying groups of events that are unlikely to have been bounded geographically purely by chance (Aldstadt, 2010). Cluster-causing agents such as crime gangs, disease vectors, or poaching gangs are used to detect crime centers, ivory trade hotspots, COVID outbreaks, and wildlife disease outbreaks (Minamisava et al., 2009; Rashidi et al., 2015; Carricondo-Sanchez et al., 2017; Qi et al., 2020). Commonly, unsupervised learning methods such as Getis-Ord Gi*, or Ripley’s K-function are used for scanning a defined area for presence of clusters (Fischer and Getis, 2010). These methods use a fixed distance for scanning an area to detect significant clusters and assume that the observed number of cases are uniformly distributed. In a more variable system such as disease surveillance and human-wildlife conflict detection, the population at risk is geographically heterogeneous and we do not know the dimensions of the cluster a-priory. Scan statistic, a recent advancement in cluster detection, uses a varying window of space-time combination to identify significant clusters (Kulldorff, 2021). However, to maintain relevance, the parameters used to define the bounds of the spatio-temporal window must be chosen based on the cluster-causing agent and its ecosystem.
The spatio-temporal window dimensions of clusters of attacks on humans are affected by many factors. Spatially, the home range size, social organization and presence of disease or injury among big cats affect the area of influence big cats have on humans. Pride-living lions have a greater area of influence on humans than a solitary leopard, due to larger space-use and resource requirements (Packer et al., 2019). Even within leopard populations, characteristics of the habitat determines the home range, or the potential area of influence on humans. Leopard home range varies from 887 km2 in Namibia to 14.5 km2 in India, which is driven by human density and prey availability of that site (Snider et al., 2021). On the other hand, temporal variability of clusters depends majorly on time taken to remove a problematic individual.
In the mid 1900’s, access to hunters who could eliminate “problem animals” was limited. Records of 1000’s of humans affected by one single animal have been popularized where animals were shot dead only after many human deaths had occurred (Patterson, 1907; Corbett, 1944). In contemporary times, credible research conducted on human-killing tigers around Chitwan, Nepal suggests that 56% of the tigers which attacked humans had physical deformities which were seen as “problem animals” and immediately removed from the system (Gurung et al., 2008). No reasons were attributed the rest of the tiger, but they were still removed from the wild. In contemporary times, section 11 of the Wildlife Protection Act in India, accords power to the Chief Wildlife Warden of the state to order removal of a wild animal if it has become dangerous to human life. Such laws exist in other countries, and this ensures, in effect, a shorter temporal influence of the “problem animal” on the surrounding human population. Problem animals are most often display unprovoked attacks on humans characterized by the predatory behavior of stalking, pursuing, and charging. They are the gravest but also the rarest type of big-cat attributed attack on people (Khramtsov, 1995). In India, there are even accounts of leopards entering houses to attack humans in their sleep (Shivakumar, 2003; Thirgood, et al., 2005). It is highly probable that such unprovoked attacks display spatio-temporal patterns detectable through rigorous space-time analysis.
Himachal Pradesh (HP) and Uttarakhand, the north-western mountainous states of India, are recognized for the presence of “man-eating” leopards since the early 1900’s. A total of 121 leopards were declared as “problem animals” in Pauri Garhwal (Uttarakhand) between 1990 - 2005 (Naha et al., 2018). In Mandi district (HP) between 2001-13, almost 50% (N=123) of the dead leopards were killed by unknown persons and 8% (N=123) were declared as “problem animals” (Athreya et al., 2015). HP forest department records showed 356 cases of leopard-attributed human injuries and deaths between 2004 – 2015, with an average of 3 human deaths/year. Leopard-human conflict mitigation in these areas is state-managed with the predominant response being leopard lethal control, ex-gratia payments made to victims, and translocations of leopards sighted within villages (Pers. Observation SS, Karanth et al., 2018). The aim of this study is to detect if leopards are cluster-causing agents of human injuries and deaths. We identify the patterns of leopard attacks on humans in Himachal Pradesh by examining the following questions: (a) do leopard-attributed attacks on humans cluster spatio-temporally? and among the leopard-attributed attacks (b) do unprovoked attacks on humans cluster spatio-temporally? and (c) what environmental factors are associated with clustered leopard-attributed attacks on humans?
2 Methods
2.1 Study area
This study was conducted in the state of Himachal Pradesh (HP), India between latitude 30°30’ and 33°15’ N to 75°30’ and 79°0’ E. Himachal Pradesh is part of the Western Himalayas sharing a border with Uttarakhand, Punjab, Haryana, Jammu & Kashmir States of India, and international borders with the Tibet autonomous region. The elevation of HP varies from 450 – 7,085 m above sea level, with temperatures ranging from -4°C to 42°C across the seasons of monsoon, summer, and winter. An average of 123.3 humans/km2 reside in the 12 districts, with almost 90% of the population living in rural areas (Jreat, 2006; Government of India, 2011). HP ranks 22nd on the state economy list with 45% of its net state domestic produce due to agriculture, and 7% of the GDP due to the tourism industry (India Brand Equity Foundation, 2021).
With a total area of 55,673 km2 HP has 27% of its area under tree cover, which is higher than most Indian states (Forest Survey of India, 2019).
Almost 15% of the forests are protected under five national parks, 26 wildlife sanctuaries and three conservation reserves (Forest Department Himachal Pradesh, 2021). The flora and faunal diversity of HP is attributed to the steeply varying altitude and climatic conditions. Housing almost 7% of the country’s diversity of flora, there are nine forest types in HP ranging from dry alpine forests to tropical thorny forests (Jreat, 2006). HP has the iconic snow leopard (Panthera uncia) and a range of other carnivores such as Himalayan black bear (Ursus thibetanus laniger), Tibetan fox (Vulpes ferrilata), red fox (Vulpes vulpes) and leopards (Panthera pardus fusca). Herbivores such as Himalayan ibex (Capra sibirica), bharal (Pseudois nayaur), gorals (Nemorhaedus goral), musk deer (Moschus leucogaster) and Himalayan thar (Hemitragus jemlahicus) are present. The survey was carried out in the 11 districts out of 12 where leopard presence was reported (Figure 1). Leopards are the most widespread carnivore of the state and unlike the neighboring Indian state of Uttarakhand, the co-predator tiger is absent in the landscape.
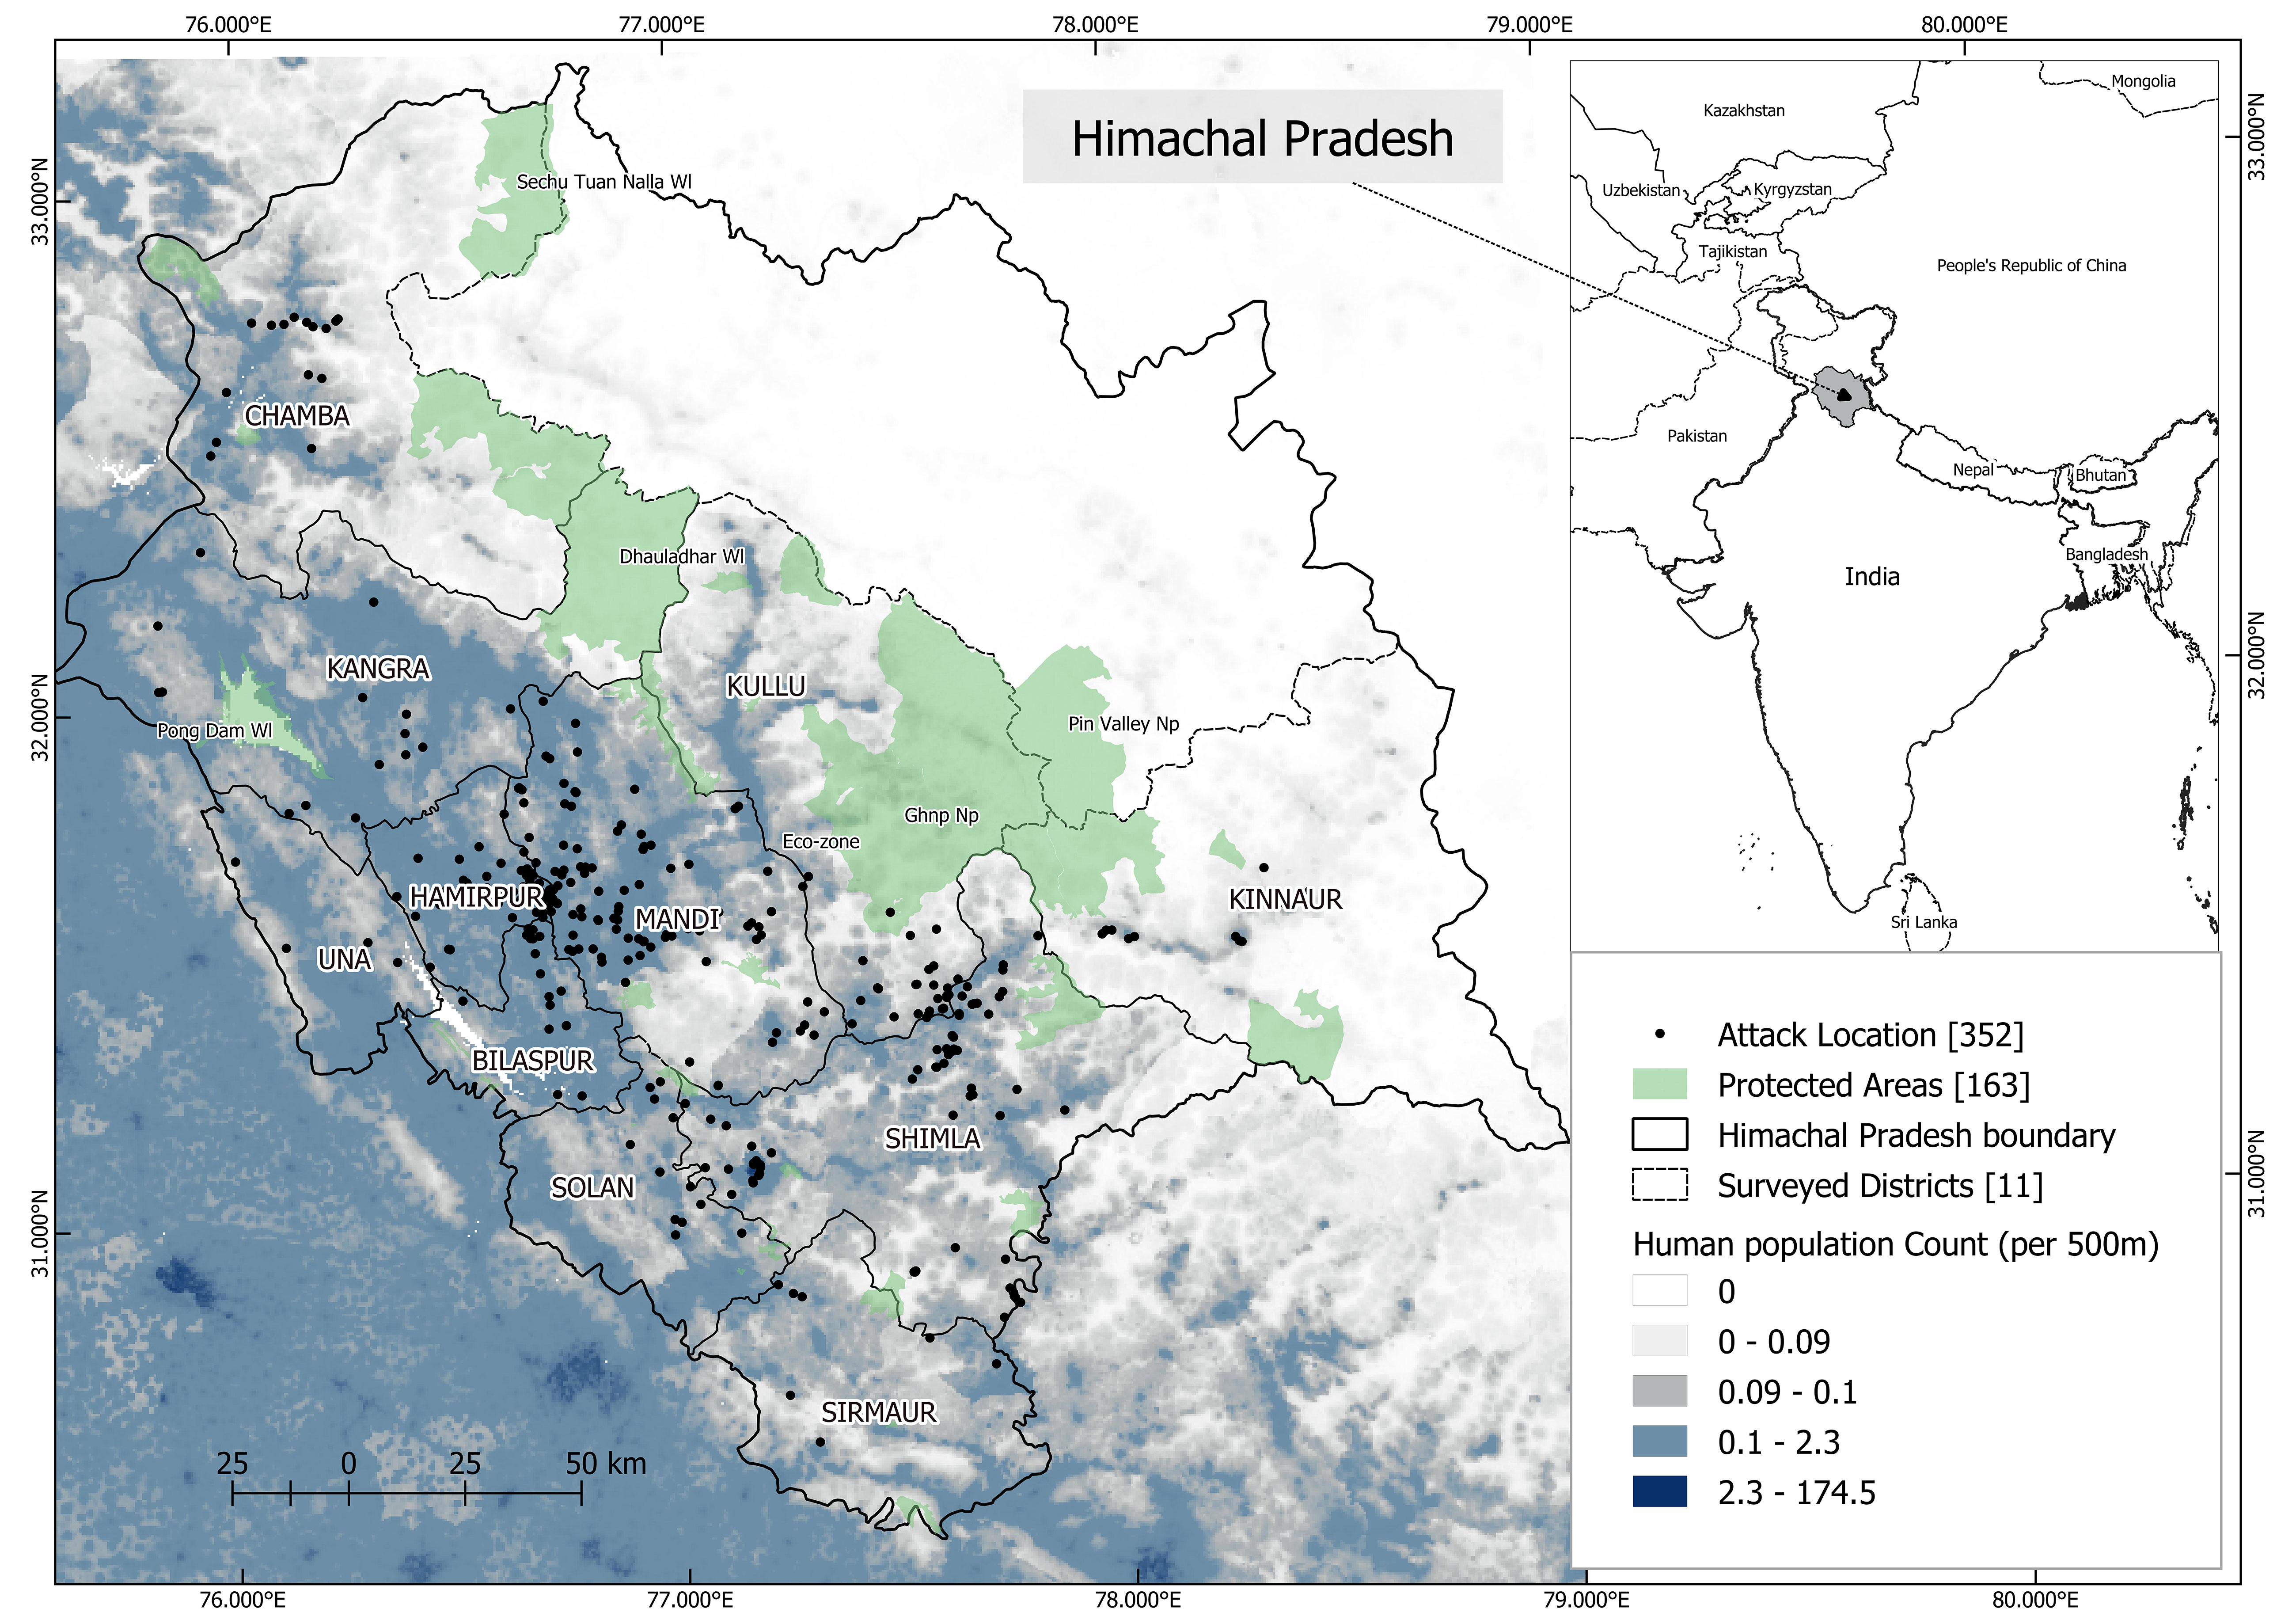
Figure 1 The study area map shows human population count (per 500 m) gradient across the 12 districts of Himachal Pradesh, India. The named 11 districts represent surveyed area for mapping attacks on humans by leopards between 2004 - 2015. Protected areas are shown in green. Black dots show the location of attack on people by leopards.
2.2 Data collection and processing
This collaborative study with the Himachal Pradesh Forest Department commenced by obtaining records of ex-gratia payments made to humans attacked by leopards between 2004 to 2015. Each ex-gratia applicant was visited to (a) validate the site of attack and confirm the species that was involved (b) to record the exact location of leopard attack (c) conduct interviews of humans who were directly involved in the incident. Questionnaire surveys were conducted between November 2014 and July 2015 through a total survey effort of approximately 13,437 kms in Himachal Pradesh. “Attacks” were defined as human injuries or deaths that were attributed to leopards. Attacks were defined as “unprovoked” when the leopard was described to exhibit one or more stages of a non-human prey hunt: (1) a bite on the neck/nape (2) dragging of the body away from the attack site, and (3) ultimately feeding on the body in a secure place. Attacks that were not displaying these characteristics were termed “other” attacks. The resulting database of discrete count data spanning a 11-year duration (2004 Jan - 2015 Jan) was used for cluster analysis. Since most people were unable to recall the exact date of attack, we only recorded the month and year of attack. The research protocols were approved by the Institute Ethics Committee (Human Studies) of Wildlife Conservation Society-India (No. IEC. 2019/5).
2.3 Detection of leopard-attributed cluster of attacks on humans
We used SaTScan, QGIS and R software to conduct cluster analysis (QGIS Development Team, 2020; R Core Team, 2020; Kulldorff and Information Management Services, 2021). The scan statistic method was developed primarily to conduct disease surveillance studies (Kulldorff and Nagarwalla, 1995). We applied scan statistic into the human-wildlife conflict system to detect clusters of leopard attacks on humans, using the software SaTScan (Kulldorff et al., 2005). Apart from one other study comparing species-specific spatio-temporal patterns of attacks on humans, previous applications of the scan statistic in wildlife conservation have been limited to wildlife disease detection, habitat/kill site selection and wildlife crime (Webb et al., 2008; McPhee et al., 2012; Rashidi et al., 2015; Carricondo-Sanchez et al., 2017; Packer et al., 2019). We drew parallels of disease systems to the human-leopard conflict system in this analysis. We defined “clusters” as areas with sustained leopard-attributed human injuries/deaths (henceforth attacks). Each attack is a “case”, the exact GPS location of attack is where the “disease contracting” occurred and, the human population at the year of attack is the “population-at-risk”. The leopard was seen as a “disease-causing agent”. To conduct cluster analysis, we used a space-time scan statistic model within SaTScan which can be visualized as a cylindrical window with a circular base of space (R) and height of time (T) (Kulldorff et al., 2005). This cylindrical window then moves to “scan”, using all possible combinations of space and time, to create overlapping cylinders within the study region and study duration. We defined the bounds of Tmax to Tmin (maximum and minimum time duration of the clusters) and Rmax (maximum radius of the cylinder base) in the analysis. Scan statistic is ideal for retrospective analysis where the scanning is repeated every month for every space combination (Kulldorff et al., 1998). Monte-Carlo simulations were used to detect windows with significantly (α = 0.05) higher attacks than the background, thus identifying clusters.
To determine whether leopard attacks on humans clustered, we used two types of models that represented the distribution probability of attacks in the study (a) All-attacks model: null hypothesis was that attacks are Poisson-distributed with constant spatio-temporal risk within and outside a cluster. The human population represented the control population-at-risk (b) Unprovoked-attack model: the null hypothesis was that unprovoked attacks (those that displayed predatory signs towards a human) are Bernoulli-distributed with probability of being attacked unprovoked within a cluster = probability of being attacked unprovoked outside the cluster. Total attacks (unprovoked + other) were used as the control population-at-risk (Kulldorff and Nagarwalla, 1995; Kulldorff et al., 1998). We used the same run parameters for both models, to ensure consistency (Supplementary Table 1). We established the bounds of this scan-statistic model based on leopard ecological parameters appropriate to the region (Supplementary Table 1). We used the largest home range of a leopard close to the study site, a male leopard in Nepal (64 km2), and set Rmax to 5.34 km (Odden and Wegge, 2005). We added 38% of the area to the Rmax estimate to include the possibility that the planimetric methods underestimate mountainous leopard home ranges (Farhadinia et al., 2020). The time bounds were set based on the generation length of a leopard which was 7.42 years (Stein et al., 2017). Monte-Carlo likelihood-based estimations were determined over 999 iterations. Scanning windows with P-value < 0.05 were considered significant.
2.4 Identifying environmental factors affecting clustered leopard-attributed attacks
Using the identified significant clusters, we fit a model to study factors potentially associated with clustered attacks on humans. For that, we used the glm () function with a binomial family and a logit link in R. The binomial response variable was whether the attack location belonged to a significant cluster (1) or was isolated (0). The predictor variables, or covariates, were chosen based on studies documenting environmental factors associated with big cat-attributed attacks on humans (Table 1). The underlying assumption of the analysis was that attack clusters occur when covariates influence the probability of encounter between a human and a leopard.
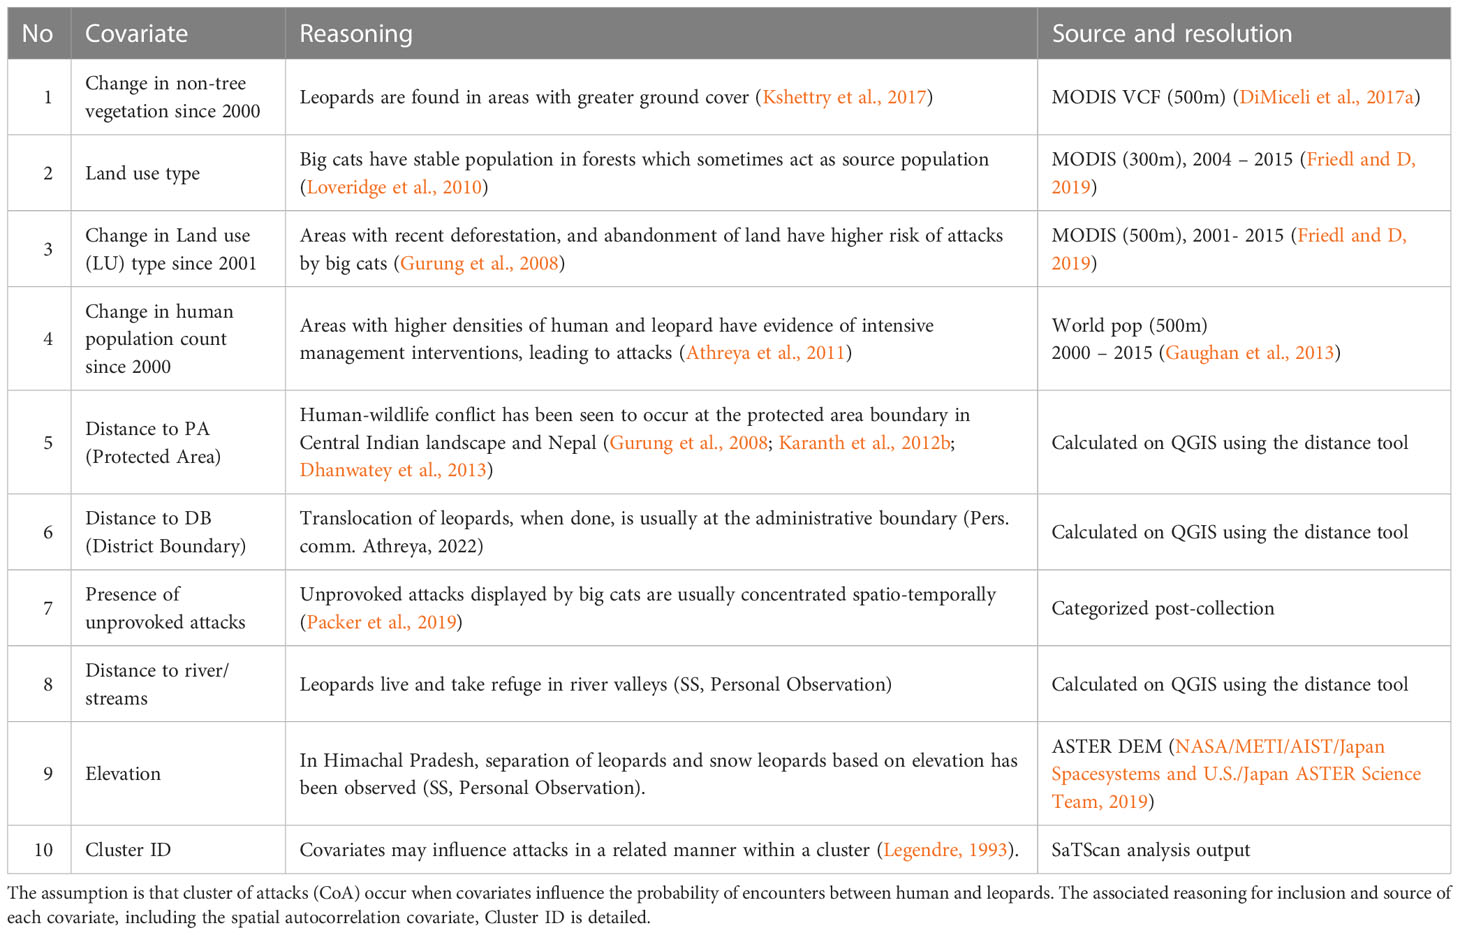
Table 1 The nine covariates used in the binomial regression model to determine environmental factors that affect clustered attacks by leopard on people.
The six numerical covariates (1) change in human population count, (2) elevation, (3) distance to protected area (PA), (4) distance to district boundary (DB), (5) distance to river, and (6) change in non-tree vegetation, were scaled using z-score. All nine covariates were checked for correlation using Spearman’s method in R. The remote-sensed covariates (1) non-tree vegetation land use (MODIS VCF), (2) human population count (Worldpop), and (3) elevation (ASTER) were extracted using Google Earth Engine for each year (2004 - 2015) and rescaled to 500m (DiMiceli et al., 2017b; Gorelick et al., 2017). Distance from PA was calculated using the NNJoin tool in QGIS (QGIS Development Team, 2020). The point sampling tool in QGIS was used to sample covariate values at each location of leopard-attributed attacks.
We incorporated the temporal aspect by calculating the trend in the relevant covariates from the year 2000 to the year of attack. Trends in human population counts, non-tree vegetation and land cover were incorporated in the analysis. The other five covariates (elevation, unprovoked/other, distance to protected area, distance to district boundary, distance to river) did not vary temporally and remained fixed in the analysis. Multiple models were fitted using the step () function in R. This function chooses a model based on AIC values in a stepwise algorithm. A global model with all covariates is used at the start and at each step it drops one covariate which decreases the AIC when removed from the model. The entire process repeats until it becomes that no single variable can be dropped (Table 2). Further, to account for any spatial autocorrelation, we used the cluster ID (ranging from 1 to 12) as a random effect variable in a mixed effect model with a fixed intercept, using the buildmer package in R.
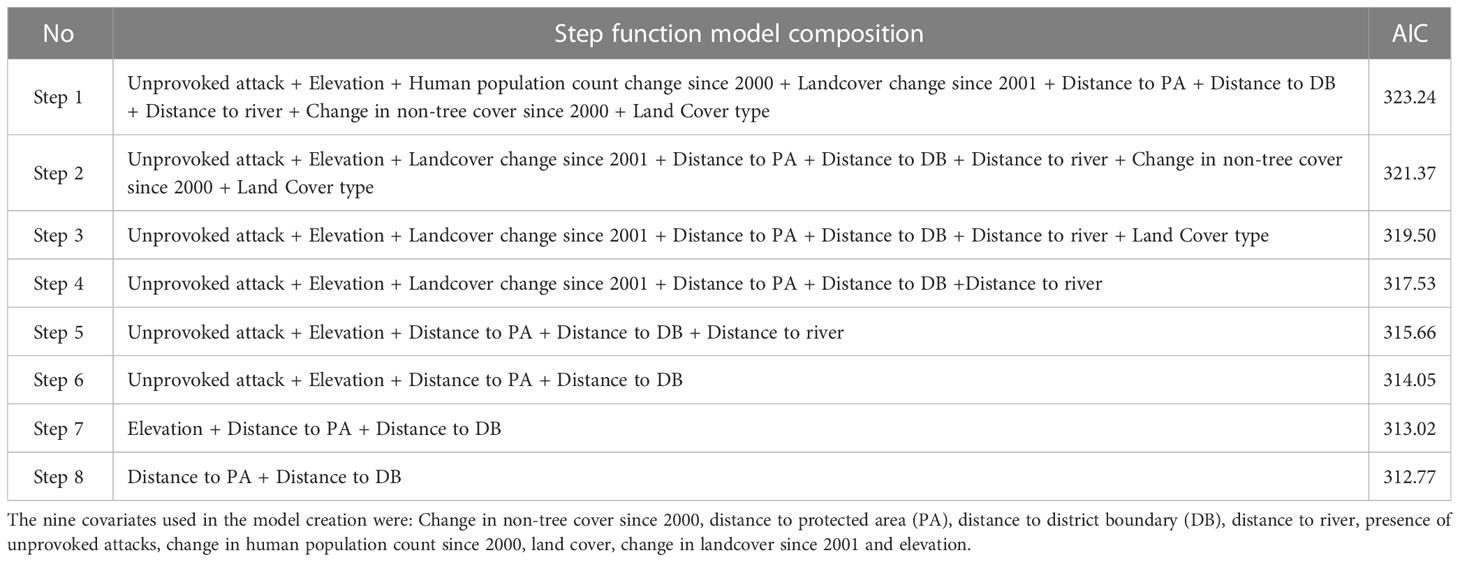
Table 2 Candidate models developed during the step-function binomial regression analysis to estimate factors affecting clustered attacks by leopards on humans in Himachal Pradesh between 2004 - 2015.
3 Results
This study was conducted to detect spatio-temporal clusters of attacks (CoA) that occurred on humans due to leopards in Himachal Pradesh (HP), India and to investigate potential environmental factors influencing the formation of these clusters. From a total of 416 cases of human injury/death due to leopards collated from the Forest Department records, we ground-validated 356 attacks between January 2004 – January 2015. Cases without date, location, and those outside the span of 2004 – 2015 were excluded in the analysis. Finally, we had a pool of 317 complete cases which constituted 30 lethal and 287 non-lethal injuries sustained by humans due to leopard attacks. Multiple humans attacked in one incident were considered as a single case. The areas with leopard attacks on humans had on average 4.19 humans/300 m2. There were 47 unprovoked attacks (N= 317) between 2004 - 2015. Attacks were found to affect 57% of HP state (Total state area = 55,673 km2) spread over 11 out of 12 districts. The attacks were not evenly distributed across the twelve years with maximum attacks, almost 20%, occurring in 2012 (X2 = 115.32, df = 11, p < 2.2 e-16) (Figure 2). Thus, the attacks on humans by leopards were not evenly spread over space and time in Himachal Pradesh.
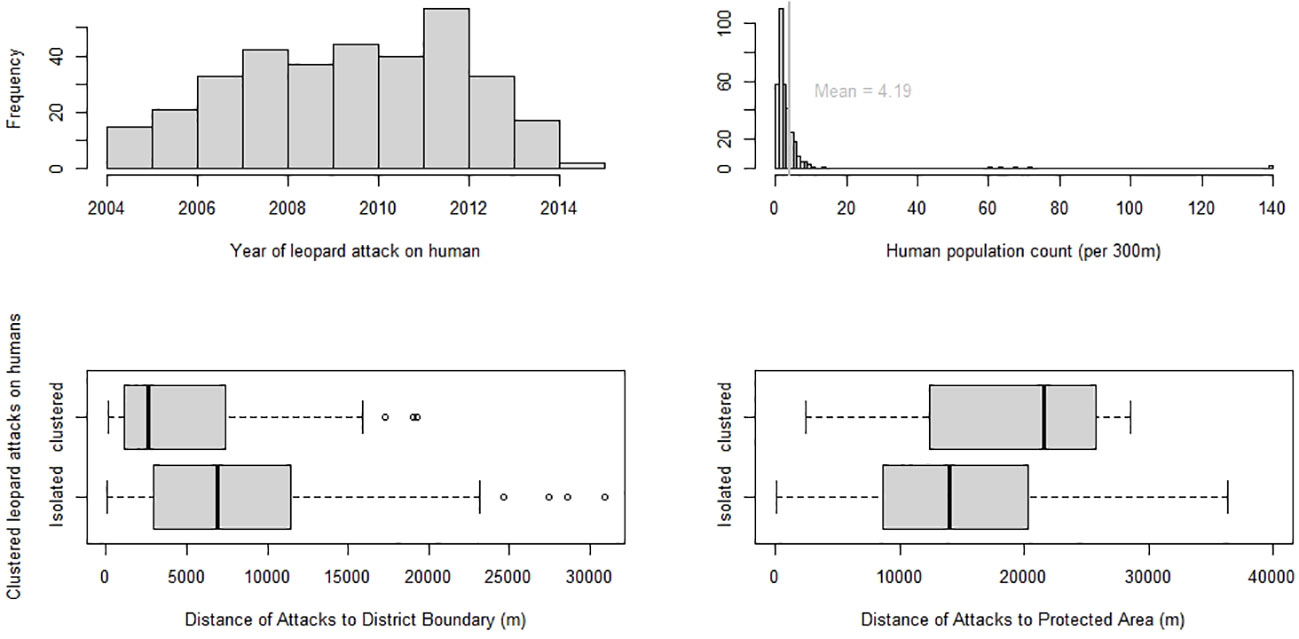
Figure 2 A plot of characteristics of cluster of attacks (CoA) on humans due to leopards with histograms on (i) year-wise spread of attacks from Jan 2004 - Jan 2015 (ii) human population count at location of attack at the year of attack (per 500 m) and box plots of clustered attacks by leopards on humans vs (iii) distance of attack to district boundary (iv) distance of attacks to protected area boundary.
3.1 Detection of leopard-attributed cluster of attacks on humans
Using the space-time scan statistic, we identified significant spatio-temporal clusters of leopard-attributed attacks on humans in Himachal Pradesh. In the analysis, CoA (cluster of attacks) were allowed to range from 0.1 to 5.4 km radius and 1- 50 months in duration (Figure 3). The Poisson model, detecting if all attacks clustered, (N=325), identified 12 significant clusters out of 21 total (Figure 4). The 12 significant CoAs ranged from 0.4 km to 5.24 km in radius, and 1- 20 months in duration (Figure 3). The Bernoulli model, examining if unprovoked attacks clustered (Unprovoked attacks=47), identified five CoA with none of them significant (Figure 4). These unprovoked attack clusters ranged in radius from 1.38 km to 4.61 km, and in duration from 7 - 44 months. A plot of radius of cluster of attack vs the duration showed that 66% of the significant clusters (N=12) were of a duration < 5 months (Figure 3).
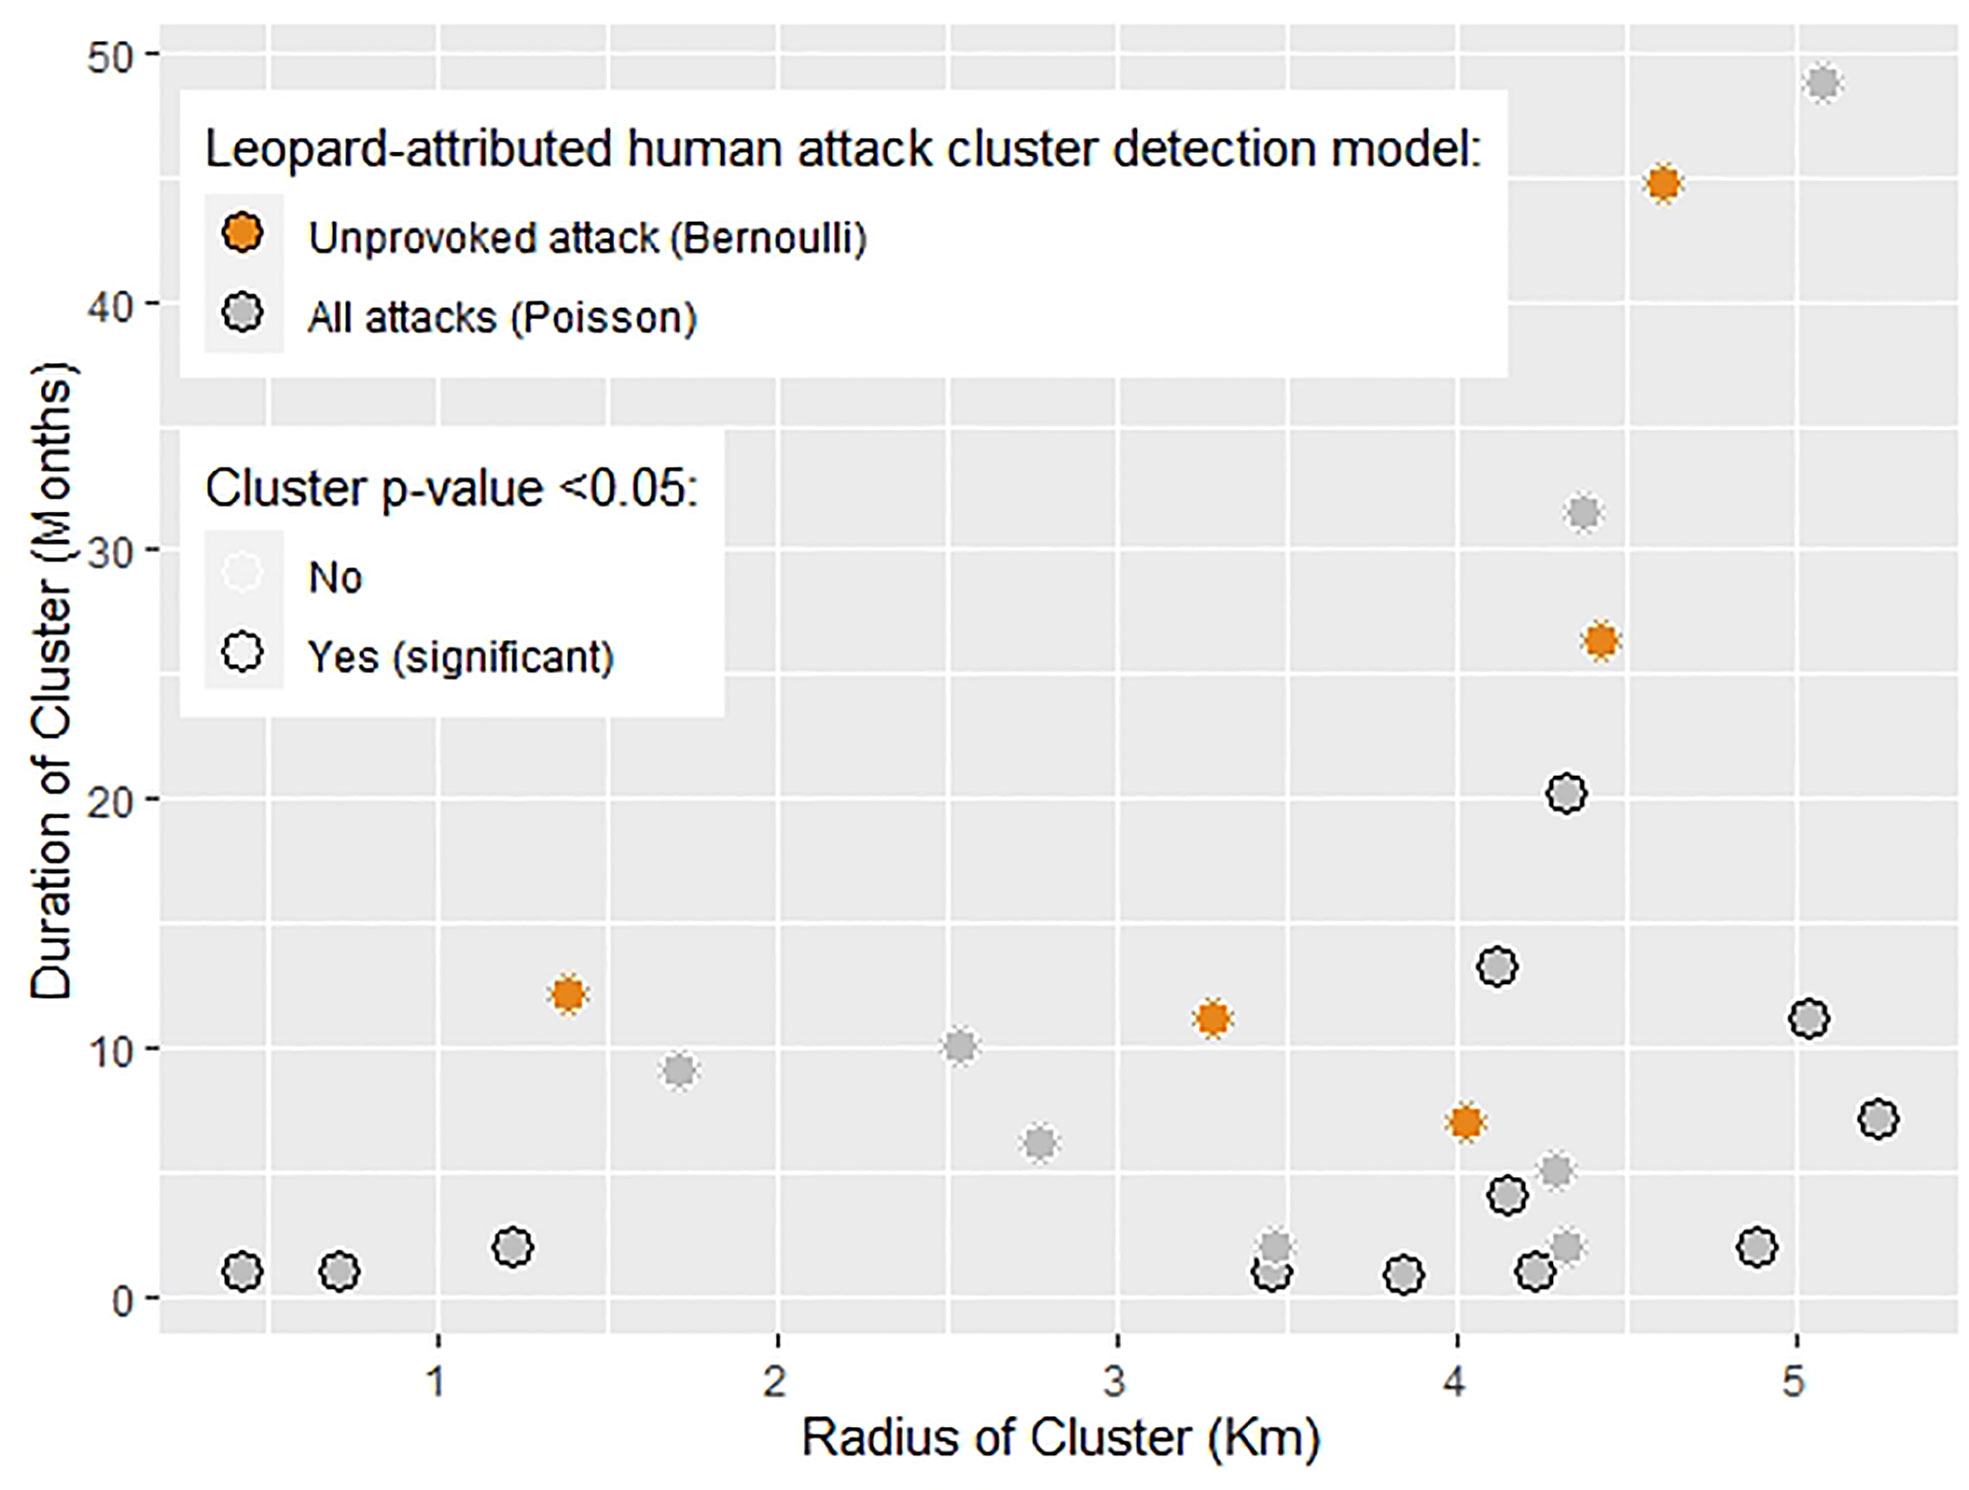
Figure 3 Leopard-attributed human injuries and deaths tested for clustering using the spatial scan statistic yielded clusters of attacks (CoA). This graph indicates the relationship between radius and duration of these CoA which were allowed to vary from 0.1 - 5.4 km and 1 - 50 months respectively. Clusters were significant if they had a p-value < 0.05 using the Monte-Carlo likelihood-based simulation. There were 12 significant (black outlined dots) and 13 non-significant clusters (white outlined dots) in total. The two types of models detecting these clusters were (a) Bernoulli model (orange dots) with case= unprovoked attacks and control = all attacks, and (b) Poisson model (grey dots) with case= all attacks and control = human population count. This graph indicates that 9 out of 12 significant clusters had a duration of less than 10 months, but widely varying radius.
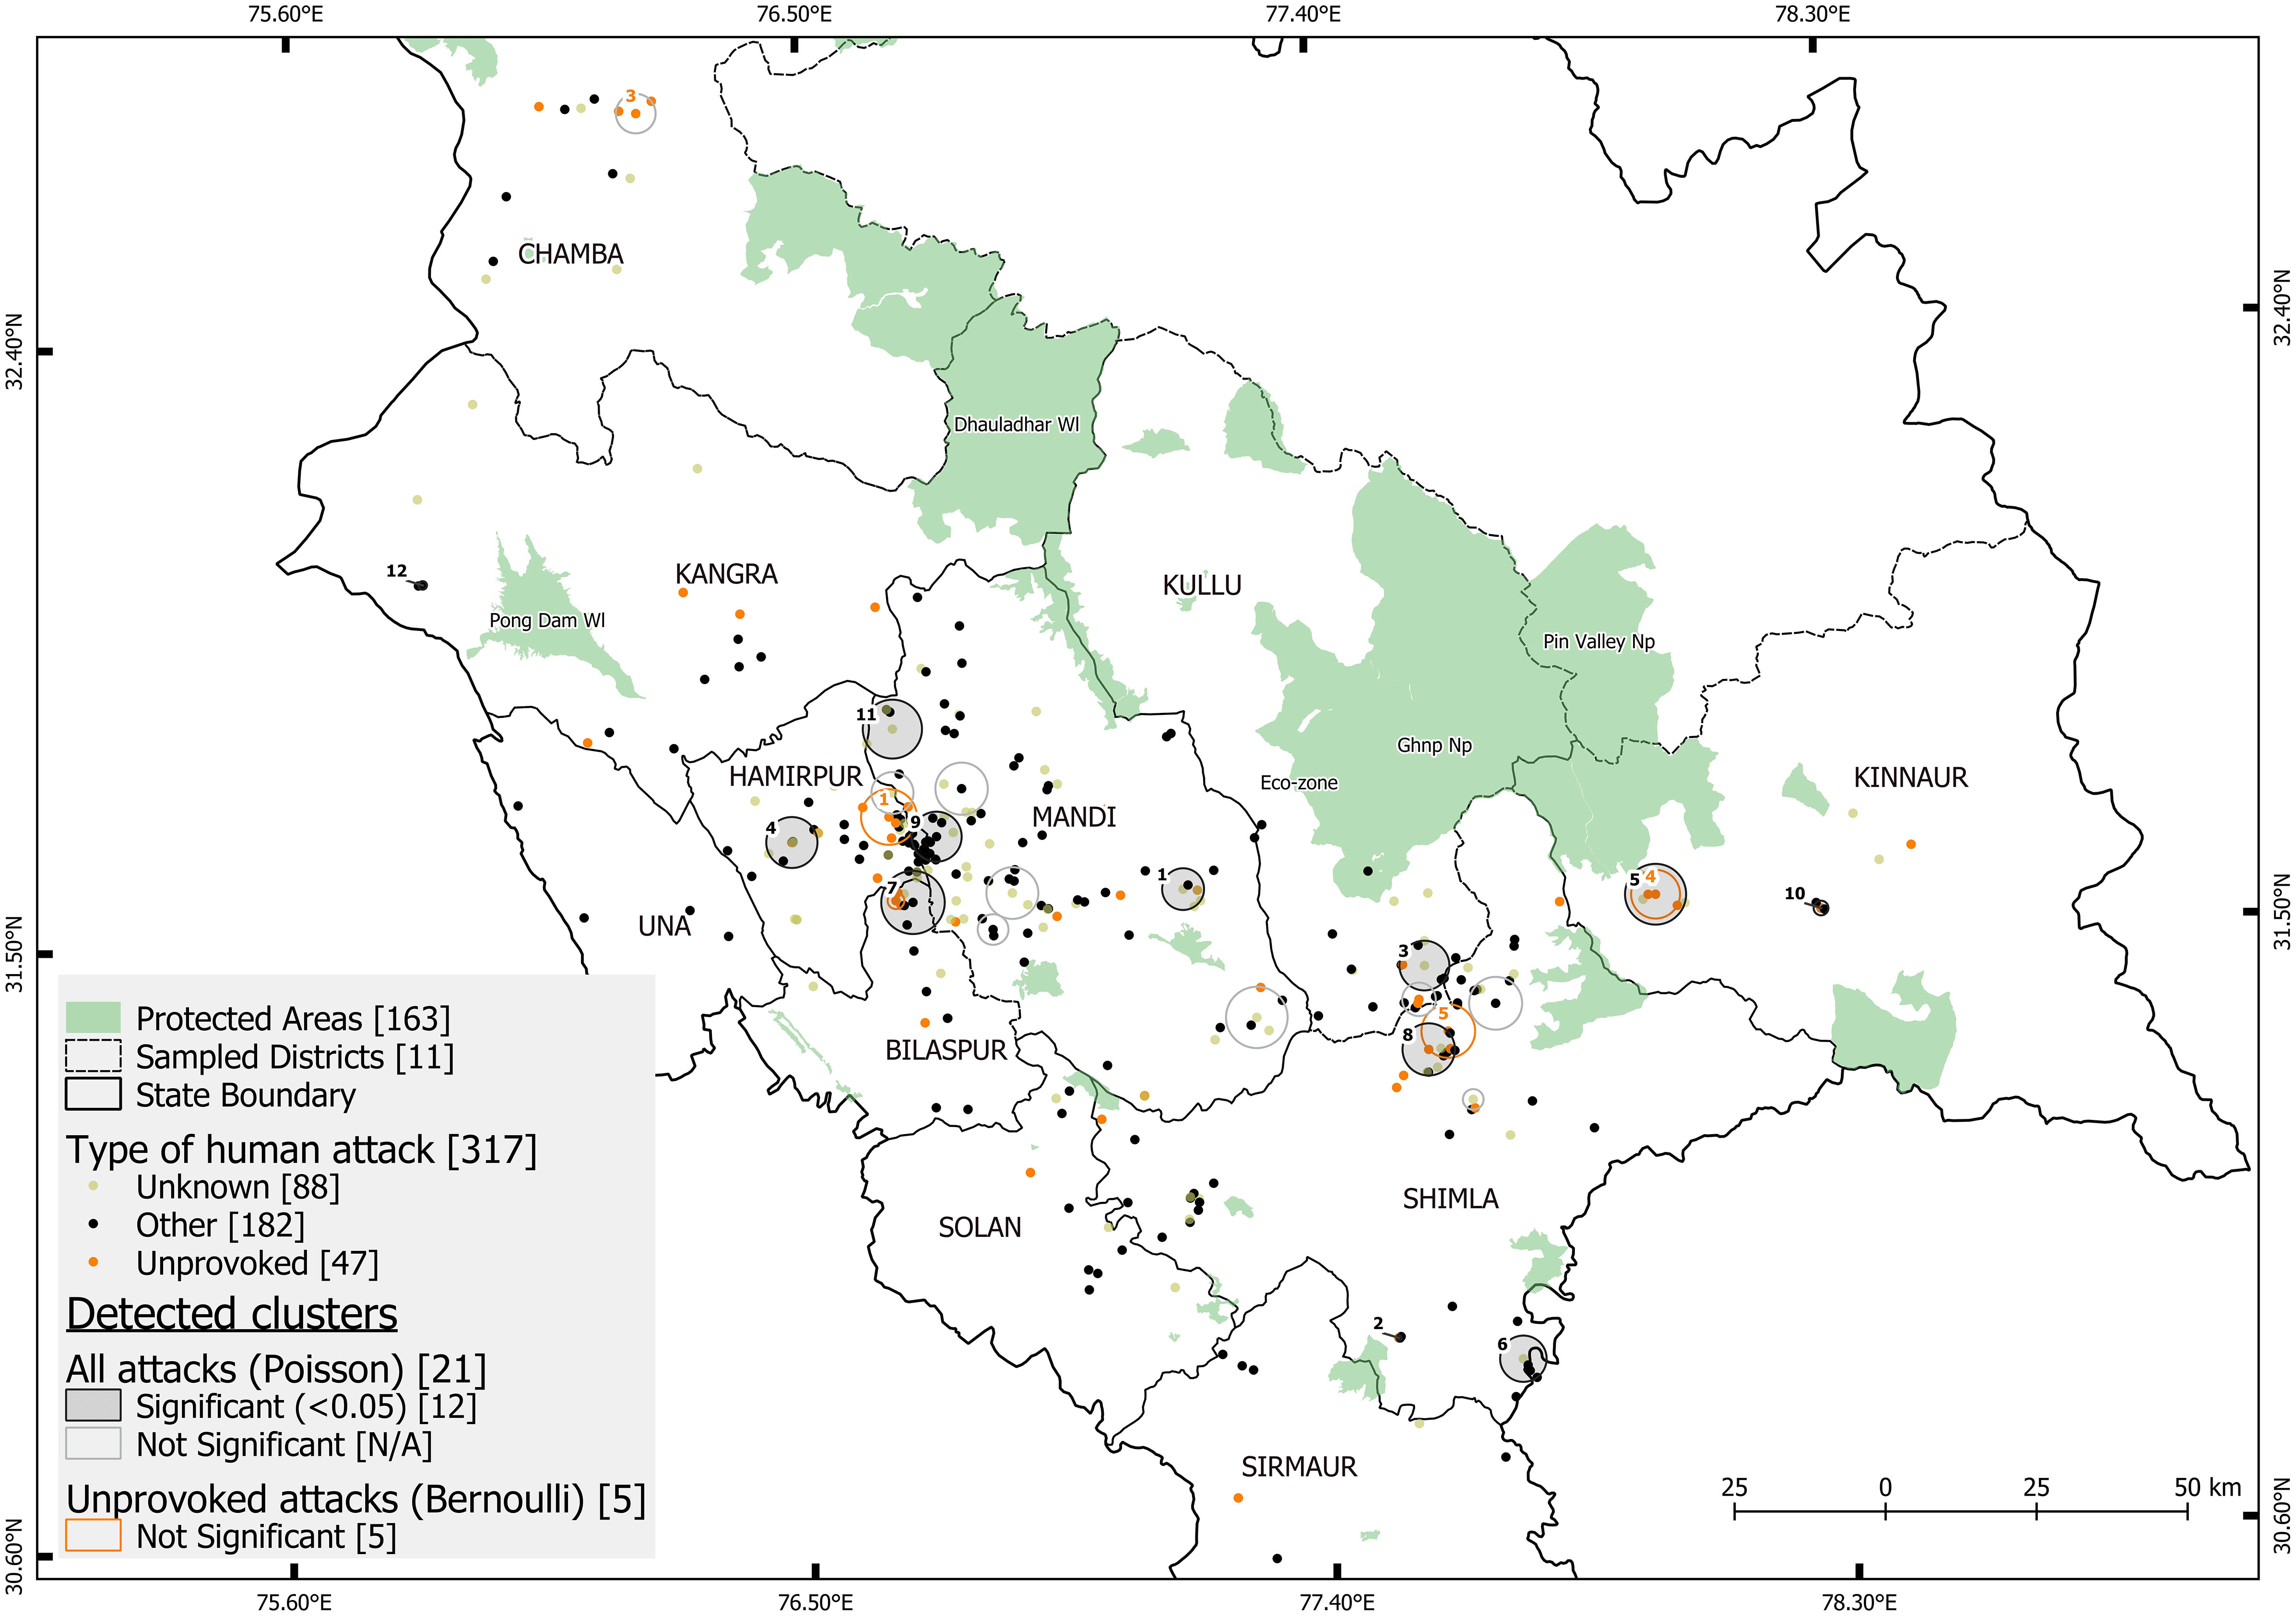
Figure 4 Map showing the cluster of attacks (CoA) detected using space-time scan statistic and GPS location of leopard-attributed attack on humans (N=317). Attacks were categorized as “Unprovoked” (orange dots), “other attacks” (black dots) and “Unknown” (buff dots) for those that could not be categorized. SaTScan cluster-detection software was applied using two models: (a) Poisson probability model (all attacks) detected 12 significant clusters (grey filled circles) and 9 non-significant clusters (grey outline circles) (b) Bernoulli probability model (Unprovoked attacks) detected five non-significant clusters (orange outline cluster). The cluster numbers of CoA are shown in black and orange.
3.2 Identifying environmental factors affecting clustered leopard-attributed attacks
The 12 significant clusters (p-value <0.05) from the Poisson model, analyzing if all types of attacks clustered, were used for further analysis. Almost 23% of the attack locations were found within 12 significant clusters (N=317). The covariates were mildly correlated using the Spearman’s test of pairwise correlation with values ranging between -0.4 to 0.2 (Supplementary Figure 1). The binomial regression model with response variable as attacks belonging to a significant cluster of attack (CoA) (1= attacks in clusters, 0= isolated attacks), was run for eight models (Table 2). Cluster ID, the random effect used to test for spatial autocorrelation among the covariates, was used in a mixed effect model and the model did not converge. Further, the number of points within each cluster were too small (median number of attacks within a cluster = 5). Hence, a random effect was not considered for drawing inferences in this study. We used GLM binomial regression for the modelling process. The largest significant effect was of the distance to district boundary covariate which measured the distance of the attack location to the closest district boundary. This was a negative association, where an attack closer to the district boundary was 0.6 times more likely to belong to a CoA (cluster of attack) (Table 3). Clustered attacks were closer to the district boundary (median = 2.6 km) than the isolated attacks (median = 6.8 km) (Figure 2). Distance to protected area (PA) was the other significant covariate which measured the distance between the attack location and the closest PA boundary. It was a positive association, i.e., attacks that were farther away from the PA were 1.4 times more likely to belong to a CoA (Table 3). Isolated attacks were closer to the protected area boundary (median = 13.8 km) versus the clustered ones (median = 22.7 km) (Figure 2).
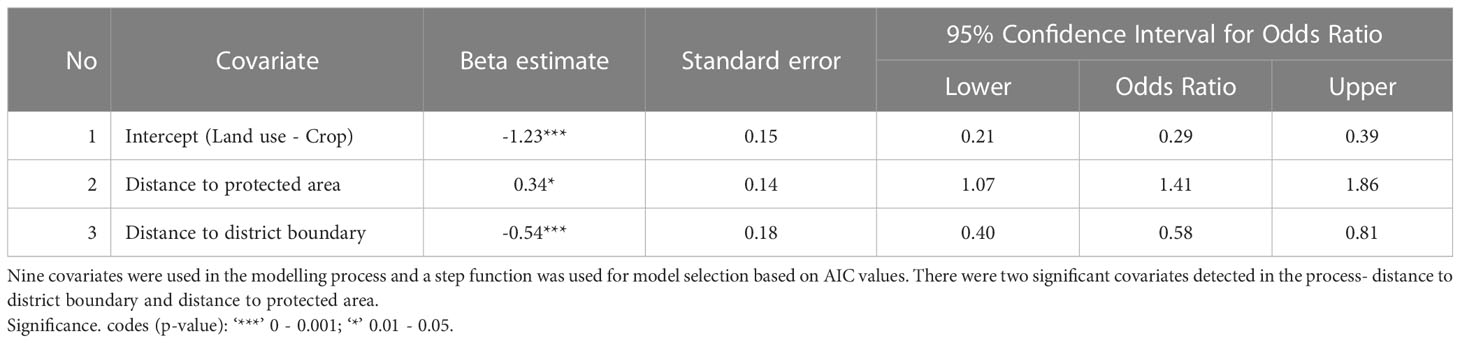
Table 3 Binomial regression models were run with the response variable as leopard attacks on humans belonging to cluster of attacks (clustered attacks= 1, isolated attacks= 0).
4 Discussion
In this study we show that leopard attacks on humans are spatio-temporally clustered in Himachal Pradesh. We found 317 confirmed cases of attacks on people by leopards which contained 30 deaths and 287 injuries between 2004 - 2015. These attacks were spread across 75% (~42,000 km2) of Himachal Pradesh, India, in 11 out of 12 districts. However, a focused area of 31,605 km2 was intensely affected by these attacks, constituting 57% of the state. Over the 11 years, attacks were found to be unevenly distributed, with 2012 being the maximum attack year (5 fatalities, 52 injuries). Our analysis identified 12 significant clusters over a total area of 41.6 km2 and a total duration of 5.4 years.
Our input for the cluster detection analysis was set to define an “outbreak” of leopard attacks as if it were caused by one animal. We hypothesized that attacks cluster spatio-temporally, while considering the human population distribution. We detected the presence of 12 significant clusters of attacks (CoA). The subsequent hypothesis was that unprovoked attacks (leopard attacks that displayed predatory signs and occurred without any provocation from the person) clustered spatio-temporally. We did this considering the total number of attacks that occurred during the study as the control. We found no significant unprovoked clusters. Although 14% of the leopard-attributed attacks (N=317) were unprovoked in nature, attacks displaying “predatory” signs did not form significant clusters of attack (CoA). This shows that the prevalence of unprovoked attacks by leopards on humans was consistent spatio-temporally through the study at a rate of 3 attacks per year. Additionally, non-predatory attack signatures displayed by a "problem animal" became part of the control in the unprovoked attack model.
In India, with the support of the Wildlife Protection Act’s “declaration of an animal as dangerous to human life” clause, and a proactive community, removal of a problem animal is expedited almost immediately following a human death (Pers. comm, Sat Pal Dhiman, 2019). Additionally, leopard deaths due to human-related causes are high in the region with almost half of the leopard deaths attributed to unnatural causes (Kumar et al., 2017). Thus, we suspect that it is improbable that clusters spanning greater than a few months in contemporary times could be attributable to a single leopard, whether unprovoked or otherwise. Our study found that approx. 70% of the significant clusters were < 5 months in duration, with mixed attack types. Rather than one dedicated leopard causing human attacks, it is more likely that leopards in human-dominated landscapes encounter people often, leading to short seasonal clusters. This is indicated by a spike in attacks during the months November – February, but not a significantly higher rise. Clusters were higher in the December month of several years. This study contributes to disproving the existence of sustained dedicated “man-eater” individuals which operate in clustered space and time.
To determine if all attacks were equally influenced by environmental factors, we compared attacks within clusters (clustered) to attacks outside clusters (isolated). We chose nine environmental factors based on research literature that identified drivers of leopard attacks on people. The factors were elevation, change in non-tree cover, land cover type, change in land cover, distance to river, distance to district boundary, distance to protected area (PA) boundary, human population, and whether the attack was unprovoked or not. Among the tested ones, distance to PA was an important factor with attacks farther away from a PA predisposed to being clustered.
Most of the clustered attacks were 22 km away from the closest protected area boundary, whereas isolated attacks were as close as 0.5 km. This contrasts with other studies which found greater attacks on humans by tigers and lions occurring closer to a PA (Gurung et al., 2008; Karanth et al., 2012a; Banerjee et al., 2013; Dhanwatey et al., 2013). This exemplifies that attacks can only occur in areas of overlapping big cats site-use with people’s site-use. Studies mostly document lesser site-use by big cats in human-use areas. For instance, in Tanzania, leopard site-use decreased with decrease in protection status of that land, with villages having the least site-use (Abade et al., 2018). However, in the mountainous terrain of Himachal Pradesh, leopard site-use is higher in river valleys, agricultural fields, and foddergrass lands (Shivakumar. S, personal observation). It is plausible that human-leopard encounters are inevitable in such areas of high non-tree cover and medium human activity, regardless of the protection status of that land. In fact, in West Bengal, India, spatial clustering of attacks on humans in a mosaic landscape (forests, tea plantations, agricultural fields, and human settlements) was influenced by ground cover and not the level of site-use of leopards (Kshettry et al., 2017). More such studies in shared landscapes are needed to support the active presence of big cats away from protected areas.
On the other hand, the covariate ‘distance to district boundary’ had the opposite effect on clustered attacks in this study. Attacks closer to the district boundary were more likely to belong to a cluster. Clustered attacks were as close as 0.93 km (median distance = 26 km) to the district boundary and isolated attacks were ~ 69 km away from the boundary. Often, leopards are captured due to public pressure and released near district borders (Personal communication, Vidya Athreya, 2022). A study on translocation of leopards in the south-western Indian state of Maharashtra found that attacks near the leopard release sites showed a 325% spike in the frequency of attacks on humans (Athreya et al., 2011). In Himachal Pradesh, translocations used to occur in the past. It is plausible that clustering of attacks over a short duration of time and at district boundaries could potentially be due to translocations in the region between 2008 – 2012. But this is an educated guess since no records exist. This argument can be further strengthened by evaluating the effects of leopard removal on attacks in the region.
Over time, the attacks peaked in 2008-2012 and declined subsequently (Figure 2). Attacks have further decreased from 2015 - 2018 with only five leopard-attributed injuries reported in 2018 through the state of Himachal Pradesh (Pers. comm, Sat Pal Dhiman, 2022). This decrease in attacks by leopards, is counter-intuitive to the general perception propagated by the media, but quite common in India (Bhatia et al., 2013). In the neighboring state of Uttarakhand, leopard-attributed deaths reduced to 154 (2006-2016) from 556 (1998-2005) (Naha et al., 2018). The causes of this decline speculated by the authors were large-scale killing of female leopards and, rural-urban migration. In a human modified landscape of Western Maharashtra, 10 potentially dangerous large carnivores reside per 100 km2. Negligible attacks on humans by these leopards and hyenas occurred from 2006 – 2009, with a momentary spike in attacks during the leopard translocation period (Athreya et al., 2011, 2013). In Mumbai city, a minimum of 20,000 humans per km2 stay adjacent to a national park, where attacks on humans by leopards decreased from 2001 - 2011, despite high densities of leopards (Bhatia et al., 2013; Surve et al., 2022). Unlike the general perception of increase in attacks on people due to leopards in India, this study adds evidence to the decreasing trend of leopard attacks.
This framework of identifying leopard attack outbreaks of unprovoked nature proposed in this study aided in disproving the sustained presence of dedicated “man-eaters” in the study region. Most significant spatio-temporal clusters were caused over short periods consisting of mixed attack types. This indicates the presence of seasonal attacks rather than leopard individual-driven attacks. Further study into the seasonal human behaviors of the landscape can aid in identifying the drivers of seasonal patterns of attacks.
The findings of this study can contribute to the leopard management policy of Himachal Pradesh, particularly in spatial prioritization of leopard-attributed human attack mitigation. Approximately 325 Forest Administrative units called Beats constituting the border regions of Hamirpur, Bilaspur, Mandi, Shimla and Kullu have been identified as a hotspot for spatio-temporal clusters of leopard attacks on humans. These areas can be prioritized for conflict mitigation approaches and awareness building campaigns. Further investigation in these regions could also reveal the non-environmental determinants of human attacks by leopards such as leopard translocations, retaliatory killing of leopards and even leopard abundance fluctuations that could lead to attacks. This study’s framework has wide application in human-wildlife conflict mapping of large mammals globally. Location of human-wildlife interaction, date/time of interaction and the appropriate parameter settings are the only required inputs to replicate this analysis. The results can generate interesting insights providing vital management inputs to reduce human-wildlife conflict.
Data availability statement
The raw data supporting the conclusions of this article will be made available by the authors, without undue reservation.
Ethics statement
The studies involving human participants were reviewed and approved by Institute Ethics Committee (Human Studies) of Wildlife Conservation Society-India (No. IEC. 2019/5). Written informed consent for participation was not required for this study in accordance with the national legislation and the institutional requirements.
Author contributions
SS: formal analysis, writing-original draft, data curation, conceptualization. VA: conceptualization, project administration, funding acquisition, writing-review, and editing. KK: writing – review, funding acquisition, supervision, resources. MO: conceptualization, methodology, writing – review and editing. DC-S: methodology, writing – review and editing. SV: validation, writing – review and editing. SD: resources and validation. All authors contributed to the article and approved the submitted version.
Funding
The field work for this study was funded by the Himachal Pradesh Forest Department’s Wildlife Wing. Institutional support and Doctoral fellowship for the author was provided by Centre for Wildlife Studies. This study was further supported by the University of British Columbia grant to KK.
Acknowledgments
Deepest gratitude to the Forest Guards and watchers of Himachal Pradesh who accompanied me on all the surveys and the DFOs’ who facilitated this process. Volunteers Jairoop Riar and Persis Farooqi were pivotal to the completion of the interview surveys. Volunteers Shubham Gupta and Nitya Satheesh for helping me with data entry. Special thanks to Santosh Ji, Bhaskar Bhai and Shiv Ji for driving me around Himachal looking for people who have been attacked by leopards. Lastly, and most importantly, to the respondents who agreed to participate in this survey that brought back difficult memories, I am forever indebted to you. Not to forget my family who were always part of my data management and motivation team.
Conflict of interest
The authors declare that the research was conducted in the absence of any commercial or financial relationships that could be construed as a potential conflict of interest.
Publisher’s note
All claims expressed in this article are solely those of the authors and do not necessarily represent those of their affiliated organizations, or those of the publisher, the editors and the reviewers. Any product that may be evaluated in this article, or claim that may be made by its manufacturer, is not guaranteed or endorsed by the publisher.
Supplementary material
The Supplementary Material for this article can be found online at: https://www.frontiersin.org/articles/10.3389/fcosc.2023.1157067/full#supplementary-material
References
Abade L., Cusack J., Moll R. J., Strampelli P., Dickman A. J., Macdonald D. W., et al. (2018). Spatial variation in leopard (Panthera pardus) site use across a gradient of anthropogenic pressure in tanzania’s ruaha landscape. PloS One 13 (10), e0204370. doi: 10.1371/journal.pone.0204370
Acharya K. P., Paudel P. K., Neupane P. R., Köhl M. (2016). Human-wildlife conflicts in Nepal: patterns of human fatalities and injuries caused by Large mammals. PloS One 11 (9), e0161717. doi: 10.1371/journal.pone.0161717
Aldstadt J. (2010). “Spatial clustering,” in Handbook of applied spatial analysis (Berlin, Heidelberg: Springer), 279–300. doi: 10.1007/978-3-642-03647-7_15
Athreya V., Odden M, Linnell JDC, Krishnaswamy J, Karanth U. (2011). Translocation as a tool for mitigating conflict with leopards in human-dominated landscapes of India. Conserv. Biol. 8 (3), 133–141. doi: 10.1111/j.1523-1739.2010.01599.x
Athreya V., et al. (2013). Big cats in our backyards: persistence of large carnivores in a human dominated landscape in India. PloS One 8 (3), e57872. doi: 10.1371/journal.pone.0057872
Athreya V., Srivathsa A., Puri M., Karanth K. U. K., Kumar N. S., Karanth K. U. K. (2015). Spotted in the news: using media reports to examine leopard distribution, depredation, and management practices outside protected areas in southern India. PloS One 10 (11), e0142647. doi: 10.1371/journal.pone.0142647
Banerjee K., Jhala Y. V., Chauhan K. S., Dave C. V. (2013). Living with lions: the economics of coexistence in the gir forests, India. PloS One 8 (1), e49457. doi: 10.1371/journal.pone.0049457
Bhatia S., Athreya V., Grenyer R., Macdonald D. W. (2013). Understanding the role of representations of human–leopard conflict in Mumbai through media-content analysis. Conserv. Biol. 27 (3), 588–594. doi: 10.1111/cobi.12037
Bhattacharjee A., Parthasarathy N. (2013). Coexisting with large carnivores: a case study from Western duars, India. Hum. Dimensions Wildlife 18 (1), 20–31. doi: 10.1080/10871209.2012.698403
Carricondo-Sanchez D., Odden M., Linnell J. D. C., Odden J. (2017). The range of the mange: spatiotemporal patterns of sarcoptic mange in red foxes (Vulpes vulpes) as revealed by camera trapping. PloS One 12 (4), e0176200. doi: 10.1371/journal.pone.0176200
Crown C., Doubleday K. (2017). ‘Man-eaters’ in the media: representation of human-leopard interactions in India across local, national, and international media. Conserv. Soc. 15 (3), 304–312. doi: 10.4103/cs.cs_15_92
Dhanwatey H. S., Crawford J. C., Abade L. A. S., Dhanwatey P. H., Nielsen C. K., Sillero-Zubiri C. (2013). Large Carnivore attacks on humans in central India: a case study from the tadoba-andhari tiger reserve. Oryx 47 (02), 221–227.
Dhungana R., Savini T., Karki J. B., Dhakal M., Lamichhane B. R., Bumrungsri S. (2018). Living with tigers panthera tigris: patterns, correlates, and contexts of human-tiger conflict in chitwan national park, Nepal. ORYX 52 (1), 55–65. doi: 10.1017/S0030605316001587
Dickman A., Marchini S., Manfredo M. (2013). The human dimension in addressing conflict with large carnivores. Key Topics Conserv. Biol. 2, 110–126. doi: 10.1002/9781118520178.ch7
DiMiceli C. M., Carroll M. L., Sohlberg R. A., Huang C., et al. (2017). ‘Annual global automated MODIS vegetation continuous fields (MOD44B) at 250m spatial resolution for data years beginning 65, 2000 - 2014’, collection 5 percent tree cover. version 6 (College Park, Maryland: University of Maryland). Available at: http://glcf.umd.edu/data/vcf/.
Farhadinia M. S., Heit D. R., Montgomery R. A., Johnson P. J., Hobeali K., Hunter L. T. B., et al. (2020). Vertical relief facilitates spatial segregation of a high density large carnivore population. Oikos 129 (3), 346–355. doi: 10.1111/oik.06724
Fischer M. M., Getis A. (2010). Handbook of applied spatial analysis: software tools, methods and applications 1st ed. (Springer-Verlag Berlin Heidelberg:Springer).
Forest Department Himachal Pradesh (2021). Himachal forest statistics (Shimla). Available at: http://hpforest.gov.in/public/frontend/pdf/HPForestStatistics2013.pdf.
Forest Survey of India (2019). India State of the forest report. Dehradun. Available at: https://fsi.nic.in/isfr19/vol2/isfr-2019-vol-ii-himachal-pradesh.pdf.
Friedl M., Sulla-Menashe D. (2019). “MCD12Q1 MODIS/Terra+Aqua land cover type yearly L3 global 500m SIN grid V006.” NASA EOSDIS Land Processes DAAC. doi: 10.5067/MODIS/MCD12Q1.006
Gaughan A. E., Stevens F. R, Linard C., Jia P., Tatem A. J. (2013). High resolution population distribution maps for southeast Asia in 2010 and 2015. PloS One 8 (2), e55882. doi: 10.1371/journal.pone.0055882
Gorelick N., Hancher M., Dixon M., Ilyushchenko S., Thau D., Moore R., et al. (2017). Google Earth engine: planetary-scale geospatial analysis for everyone. Remote Sens Environ 202, 18–27.
Government of India (1972). “Census of India.” Provisional Population Totals: Himachal Pradesh. 2011. Available at: http://censusindia.gov.in/2011-prov-results/prov_data_products_himachal.html.
Government of India (2011). Census of India, provisional population totals: himachal pradesh. Available at: http://censusindia.gov.in/2011-prov-results/prov_data_products_himachal.html (Accessed 24 February 2015).
Govindrajan R. (2015). The man-eater sent by God: unruly interspecies intimacies in india’s central Himalayas. RCC Perspect. 3, 33–38. Available at: https://doi.org/https://www.jstor.org/stable/26241329.
Gurung B., Smith J. L. D., McDougal C., Karki J. B., Barlow A. (2008). Factors associated with human-killing tigers in chitwan national park, Nepal. Conserv Biol, vol. 141 (12), 3069–3078.
Hathaway R. S., Bryant A-E. M., Draheim M. M., Vinod P., Limaye S., Athreya V. (2017). From fear to understanding: changes in media representations of leopard incidences after media awareness workshops in Mumbai, India. J. Urban Ecol. 3 (1), jux009. doi: 10.1093/jue/jux009
Holland K. K., Larson L. R., Powell R. B. (2018). Characterizing conflict between humans and big cats panthera spp: a systematic review of research trends and management opportunities. PloS One 13 (9), e0203877. doi: 10.1371/journal.pone.0203877
India Brand Equity Foundation (2021). About Himachal Pradesh: information on tourism, industries, geography, ministry of commerce & industry, government of India. Available at: https://www.ibef.org/states/himachal-pradesh.aspx.
Jacobson A. P., Gerngross P., Lemeris J. R. Jr, Schoonover R. F., Anco C., Breitenmoser-Wursten C. (2016). Leopard (Panthera pardus) status, distribution, and the research efforts across its range. PEERJ 4, e1974. doi: 10.7717/peerj.1974
Jalais A. (2008). Unmasking the cosmopolitan tiger. Nat. Culture 3 (1), 25–40. doi: 10.3167/nc.2008.030103
Karanth K. K., Gopalaswamy A. M., DeFries R., Ballal N. (2012a). Assessing patterns of human-wildlife conflicts and compensation around a central Indian protected area. PloS One 7 (12), e50433. doi: 10.1371/journal.pone.0050433
Karanth K. K., Defries R., Srivathsa A., Sankaraman V. (2012b). Wildlife tourists in india’s emerging economy: potential for a conservation constituency? ORYX 46, 382–390. doi: 10.1017/S003060531100086X
Karanth K. K., Gupta S., Vanamamalai A. (2018). Compensation Payments, Procedures and Policies towards Human-Wildlife Conflict Management: Insights from India. Biol. Conserv. 227, 383–389. doi: 10.1016/j.biocon.2018.07.006
Kshettry A., Vaidyanathan S., Athreya V. (2017). Leopard in a tea-cup: a study of leopard habitat-use and human-leopard interactions in north-eastern India. PloS One 12 (5), e0177013. doi: 10.1371/journal.pone.0177013
Kulldorff M. (2021). SaTScan USer Guide for Version 10.0. Available at: http://www.satscan.org/.
Kulldorff M., Athas W. F., Feurer E. J., Miller B. A., Key CR. (1998). Evaluating cluster alarms: a space-time scan statistic and brain cancer in Los alamos, new Mexico. Am. J. Public Health 88 (9), 1377–1380. doi: 10.2105/AJPH.88.9.1377
Kulldorff M., Heffernan R., Hartman J., Assunçao R., Mostashari F. (2005). A space–time permutation scan statistic for disease outbreak detection. PloS Med. 2 (3), e59. doi: 10.1371/journal.pmed.0020059
Kulldorff M., Information Management Services. (2021). SaTScan(TM) v10.0: software for the spatial and space-time scan statistics. Available at: http://www.satscan.org/.
Kulldorff M., Nagarwalla N. (1995). Spatial disease clusters: detection and inference. Stat Med. 14 (8), 799–810. doi: 10.1002/sim.4780140809
Kumar P., Chandel S, Kumar V, Sankhyan V. (2017). “Leopard–human conflict led casualties and conservation awareness campaign in shivalik hills of northern India,” in Proceedings of the national academy of sciences, India section b: biological sciences. (Springer) 87 (3), 893–898.
Kushnir H., Leitner H., Ikanda D., Packer C. (2010). Human and ecological risk factors for unprovoked lion attacks on humans in southeastern Tanzania. Hum. Dimensions Wildlife 15 (5), 315–331. doi: 10.1080/10871200903510999
Kushnir H., Weisberg S., Olson E., Juntunen T., Ikanda D., Packer C. (2014). Using landscape characteristics to predict risk of lion attacks on humans in south-eastern T anzania. Afr. J. Ecol. 52 (4), 524–532. doi: 10.1111/aje.12157
Legendre P. (1993). Spatial autocorrelation: trouble or new paradigm? Ecology 74 (6), 1659–1673. doi: 10.2307/1939924
Loveridge A. J., Hemson G., Davidson Z., Macdonald D. W. (2010). “African Lions on the edge: reserve boundaries as “attractive sinks”’,” in Biology and conservation of wild felids (Oxford: Oxford University Press) 283, 283–304.
McPhee H. M., Webb N. F., Merrill E. H. (2012). Hierarchical predation: wolf (Canis lupus) selection along hunt paths and at kill sites. Can. J. Zool 90, 555–563. doi: 10.1139/z2012-021
Minamisava R., Nouer S. S., Neto Morais O. L., Melo L. K., Andrade A. L. S. S. (2009). Spatial clusters of violent deaths in a newly urbanized region of Brazil: highlighting the social disparities. Int. J. Health Geogr. 8 (1), 1–10. doi: 10.1186/1476-072X-8-66
Naha D., Sathyakumar S., Rawat G. S. (2018). Understanding drivers of human-leopard conflicts in the Indian Himalayan region: spatio-temporal patterns of conflicts and perception of local communities towards conserving large carnivores. PloS One 13 (10), e0204528. doi: 10.1371/journal.pone.0204528
NASA/METI/AIST/Japan Spacesystems and U.S./Japan ASTER Science Team (2019). ASTER global digital elevation model V003 (NASA EOSDIS Land Processes DAAC).
Nyhus P. J., Tilson R. (2010). “Panthera tigris vs homo sapiens: conflict, coexistence, or extinction,” in Tigers of the world (Elsevier), 125–141.
Odden M., Wegge P. (2005). Spacing and activity patterns of leopards panthera pardus in the royal bardia national park, Nepal. Wildlife Biol. 11 (2), 145–152. doi: 10.2981/0909-6396(2005)11[145:SAAPOL]2.0.CO;2
Packer C., Shivakumar S., Athreya V, Craft MEME, Dhanwatey H., Dhanwatey P., et al. (2019). Species-specific spatiotemporal patterns of leopard, lion and tiger attacks on humans. J. Appl. Ecol. 56 (3), 585–593. doi: 10.1111/1365-2664.13311
QGIS Development Team (2020). QGIS geographic information system (Coruna: Open source Geospatial Foundation). Available at: http://qgis.osgeo.org.
Qi C., Zhu Y. C., Li C. Y., Hu Y. C., Liu L. L., Zhang D. D., et al. (2020). Epidemiological characteristics and spatial– temporal analysis of COVID-19 in Shandong province, China. Epidemiology & infection 148.
Rashidi P., Wang T., Skidmore A., Vrieling A., Darvishzadeh R., Toxopeus B., et al. (2015). Spatial and spatiotemporal clustering methods for detecting elephant poaching hotspots. Ecological modelling 297, 180–186.
R Core Team (2020). R: a language and environment for statistical computing (Vienna, Austria: R Foundation for Statistical Computing). Available at: https://www.r-project.org/.
Shehzad W., Nawaz M. A., Pompanon F., Coissac E., Riaz T., Shah S. A., et al. (2015). Forest without prey: livestock sustain a leopard panthera pardus population in Pakistan. Oryx 49 (02), 248–253. doi: 10.1017/S0030605313001026
Shivakumar S. (2023). Understanding the circumstances surround leopard attacks on people in Himachal Pradesh India [Manuscript in preparation].
Snider M. H., Athreya V. R., Balme G. A., Bidner L. R., Farhadinia M. S., Fattebert J., et al. (2021). Home range variation in leopards living across the human density gradient. J. Mammal 102 (4), 1138–1148. doi: 10.1093/jmammal/gyab068
Sondhi S., Athreya V., Sondhi A., Prasad A., Verma A., Verma N. (2016). Human attacks by leopards in uttarakhand, India: an assessment based on perceptions of affected people and stakeholders (Uttarakhand). Available at: https://drive.google.com/file/d/0B20Gf9ku9XLdYnczRFJDcGJFOTg/.
Stein A. B., Athreya V., Gerngross P., Balme G., Henschel P., Karanth U., et al. (2017). Panthera pardus (Amended version of 2019 assessment).
Surve N. S., Sathyakumar S., Sankar K., Jathanna D., Gupta V., Athreya V., et al. (2022). Leopards in the city: the tale of sanjay Gandhi national park and tungareshwar wildlife sanctuary, two protected areas in and adjacent to Mumbai, India. Front. Conserv. Sci., 15. doi: 10.3389/fcosc.2022.787031
Thirgood S., Woodroffe R., Rabinowitz A. (2005). The Impact of Human-Wildlife Conflict on Human Lives and Livelihoods. In People and Wildlife: Conflict or Coexistence? ed. Thirgood S., Woodroffe R., Rabinowitz A. New York: Cambrisge university press 9, 13–26.
Tilson R. (2010). Panthera Tigris vs Homo Sapiens: Conflict, Coexistence, or Extinction. In Tigers of the World ed. Nyhus P. J., Tilson R. Boston: Elsevier, 125–41.
Webb N. F., Hebblewhite M., Merrill E. H. (2008). Statistical methods for identifying wolf kill sites using global positioning system locations. J. Wildlife Manage. 72 (3), 798–807. doi: 10.2193/2006-566
World Health Organization (2020) Top 10 causes of deaths, leading causes of death and disability 2000-2019. Available at: https://www.who.int/news-room/fact-sheets/detail/the-top-10-causes-of-death (Accessed 15 December 2022).
Keywords: leopard, human-wildlife interaction, spatiotemporal, conflict, clusters, attacks, human-wildlife conflict
Citation: Shivakumar S, Carricondo-Sánchez D, Athreya V, Odden M, Dhiman SP, Vaidyanathan S and Karanth KK (2023) Examining leopard attacks: spatio-temporal clustering of human injuries and deaths in Western Himalayas, India. Front. Conserv. Sci. 4:1157067. doi: 10.3389/fcosc.2023.1157067
Received: 02 February 2023; Accepted: 02 May 2023;
Published: 30 May 2023.
Edited by:
Silvio Marchini, University of São Paulo, BrazilReviewed by:
Francesco Maria Angelici, National Center for Wildlife, Saudi ArabiaMuhammad Ali Nawaz, Qatar University, Qatar
Copyright © 2023 Shivakumar, Carricondo-Sánchez, Athreya, Odden, Dhiman, Vaidyanathan and Karanth. This is an open-access article distributed under the terms of the Creative Commons Attribution License (CC BY). The use, distribution or reproduction in other forums is permitted, provided the original author(s) and the copyright owner(s) are credited and that the original publication in this journal is cited, in accordance with accepted academic practice. No use, distribution or reproduction is permitted which does not comply with these terms.
*Correspondence: Shweta Shivakumar, ZW52aXNod2V0YUBnbWFpbC5jb20=