 D. Vongraven
 S. C. Amstrup3
 T. L. McDonald
 J. Mitchell
 N. G. Yoccoz
- 1Department of Arctic and Marine Biology, UiT Arctic University of Norway, Tromsø, Norway
- 2Norwegian Polar Institute, Fram Center, Tromsø, Norway
- 3Polar Bears International, Bozeman, MT, United States
- 4McDonald Data Sciences, Laramie, WY, United States
- 5Western Ecosystems Technology, Inc., Cheyenne, WY, United States
Conflicts between humans and polar bears have been predicted to increase as polar bear prime habitat, sea ice, is decreasing. In Svalbard, a strict protection and control schemes have secured near complete records of bears killed and found dead since 1987. We analyzed the trend in the number of kills and related this to human visitation to the archipelago. We found a slight decrease in the number of kills in the period 1987-2019, and a decrease in per capita number of kills when monthly kills were compared to the monthly number of visitors disembarking in the main settlement. We then used a discrete choice resource selection model to assess whether polar bear kill events are related to attributes of the kill sites and environmental conditions at the time. We divided Svalbard in four sectors, North, East, South, and West, and monthly average ice cover was calculated in 25-km rings around Svalbard, rings that were further delineated by the four sectors. We found that the odds of a kill was greater along the shoreline, and that the odds would be reduced by 50% when moving only 900 m from the shoreline when all sectors were included. Distance from other covariates like settlements, trapper’s cabins, and landing sites for tourists did for the most part not have a significant impact on the odds of a kill. Sectorwise, ice cover had no significant impact on the odds for a kill. The decreasing trend in kills of polar bears might partly be explained by the success of strict protection and management regimes of Svalbard wilderness.
Introduction
On a global scale, habitat loss is one of the most critical threats to persistence of mammal populations (Schipper et al., 2008). This is especially apparent for species dependent on Arctic sea ice habitat which has shown significant spatial and temporal declines with global climate warming (Stroeve et al., 2014; Laidre et al., 2015; Stern and Laidre, 2016; National Snow and Ice Data Center, 2019). In the case of polar bears (Ursus maritimus), large ice dependent predators, sea ice decline will have a direct effect on the extent and characteristics of preferred habitat (Durner et al., 2009; Laidre et al., 2018; Lone et al., 2018), the availability of preferred prey (Pagano et al., 2018), and the amount of time they are able to stay on sea ice to find prey (Atwood et al., 2016), all which could lead to increased contact with humans and thus increased number of conflicts with humans (Stirling and Derocher, 2012; Atwood and Wilder, 2021; Rode et al., 2022; Abrahms et al., 2023).
Polar bears depend on sea ice for fundamental aspects of their life history, breeding, accessing preferred denning areas, and most importantly foraging (Stirling, 1974; Amstrup et al., 2008; Derocher et al., 2011). Arctic Ocean September sea ice extent has declined by 81,200 km2/year since 1979, i.e. a 12.7% (+/- 2.0%) decline per decade (Meier and Stroeve, 2022). In the Barents Sea, located off the coasts of Norway and Russia, the ice-free period between spring melt and fall freeze-up, has increased 34 days per decade since 1979 (Stern and Laidre, 2016). Historically, sea ice advanced from the northeast in November and engulfed the Svalbard Archipelago through August (Divine and Dick, 2006). However, in the period 1979- 2022 there was an observed negative trend of 10.1% per decade in March sea ice extent, and a 19.7% per decade reduction in September sea ice extent (https://cryo.met.no/en/sea-ice-index-bar), leading to little or no sea ice surrounding Svalbard for most of the year. Also, most of 29 fjord regions in Svalbard show decadal decrease of ice cover in winter months of 10-40% in the two decades prior to 2016, whilst most showed decadal slight increase in ice cover in the two decades prior to 1998 (Dahlke et al., 2020).
Similar patterns have been documented in other Arctic areas. In Alaska, for example, sea ice retreat forced bears to swim long distances between shore and sea ice in summer, in some instances with fatal consequences (Monnett and Gleason, 2006; Durner et al., 2011; Pagano et al., 2012), and spend more time on land in fall (Rode et al., 2015b). In Hudson Bay, a longer ice-free period has led to decline in body condition for adult males and females in both the Western and Southern Hudson Bay subpopulations (Stirling et al., 1999; Obbard et al., 2018), while cub survival and population size in Western Hudson Bay have declined (Regehr et al., 2007; Lunn et al., 2016). Energy budget modeling demonstrates limits to how long polar bears can be food deprived before survival is affected, ranging from 117 days in females with cubs till 255 days in solitary females that start fasting in average body condition (Molnár et al., 2020). Severe global declines in polar bear numbers are projected if global warming induced sea ice loss continues (Amstrup et al., 2010; Regehr et al., 2016; Molnár et al., 2020).
Growing human populations, industrial activity, and tourism across the polar bear’s range exacerbate potential for conflict (Polar Bear Range States, 2009; Larsen and Fondahl, 2015; Atwood et al., 2017). The number of people arriving in Svalbard to visit the Norwegian Arctic has been growing for decades; visitation to Svalbard has increased nearly 8-fold since the 1990s (Bystrowska, 2019; Norwegian Polar Institute, 2022). More people visiting bear habitat coupled with more bears on land due to decreasing sea ice cover raise the potential for both an increase in human-bear conflict locally, e.g. Western Hudson Bay (Towns, 2006; Towns et al., 2009), and for the severity of such conflicts globally (Can et al., 2014).
Here, we examine kills of problem bears in Svalbard to determine whether ongoing environmental changes, including the sea ice concentration at the time of the kill, may have influenced their frequency or distribution. We used a discrete choice resource selection model (Cooper and Millspaugh, 1999; Manly et al., 2002; McDonald et al., 2006) to assess how polar bear kill events are related to attributes of the kill sites and environmental conditions at the time.
Materials and methods
Data on killed bears
Strict protection and control schemes assure records were kept for all killed or found dead polar bears. We initially obtained records of polar bears killed or found dead from the Governor of Svalbard for the period August 1987 to August 2016. We later obtained one more record of killed bear in July 2018, and there were no killed or dead bears on record for 2019. Data always included date and location. In most cases, records also contained sex and age of the bear, whether it was previously tagged for scientific purposes, a narrative giving details about the incident, and the people involved. In most cases prior to 2005 the given coordinates did not have GPS accuracy. In all cases the narratives were checked in order to set the coordinates for the recorded incident as accurate as possible.
We based our analysis on the initial set of records covering August 1987 to August 2016 that contained 113 bear deaths. We removed 18 records from this data set. We discarded nine records that did not have adequate information or for which we suspected data entry errors. One record was duplicated, the only record where a data entry error was clearly detectable. One bear with satellite collar that was found dead and cause of death could not be determined. We removed records of two bears that were euthanized due to severe injuries. We removed one record of a dead cub from a killed mother-cub pair. We removed four euthanized cubs whose mothers were killed as defense of life and property (DLP), but we retained the mother’s DLP records. These initial exclusions left 95 bears in the statistical analysis of kill locations (Figure 1).
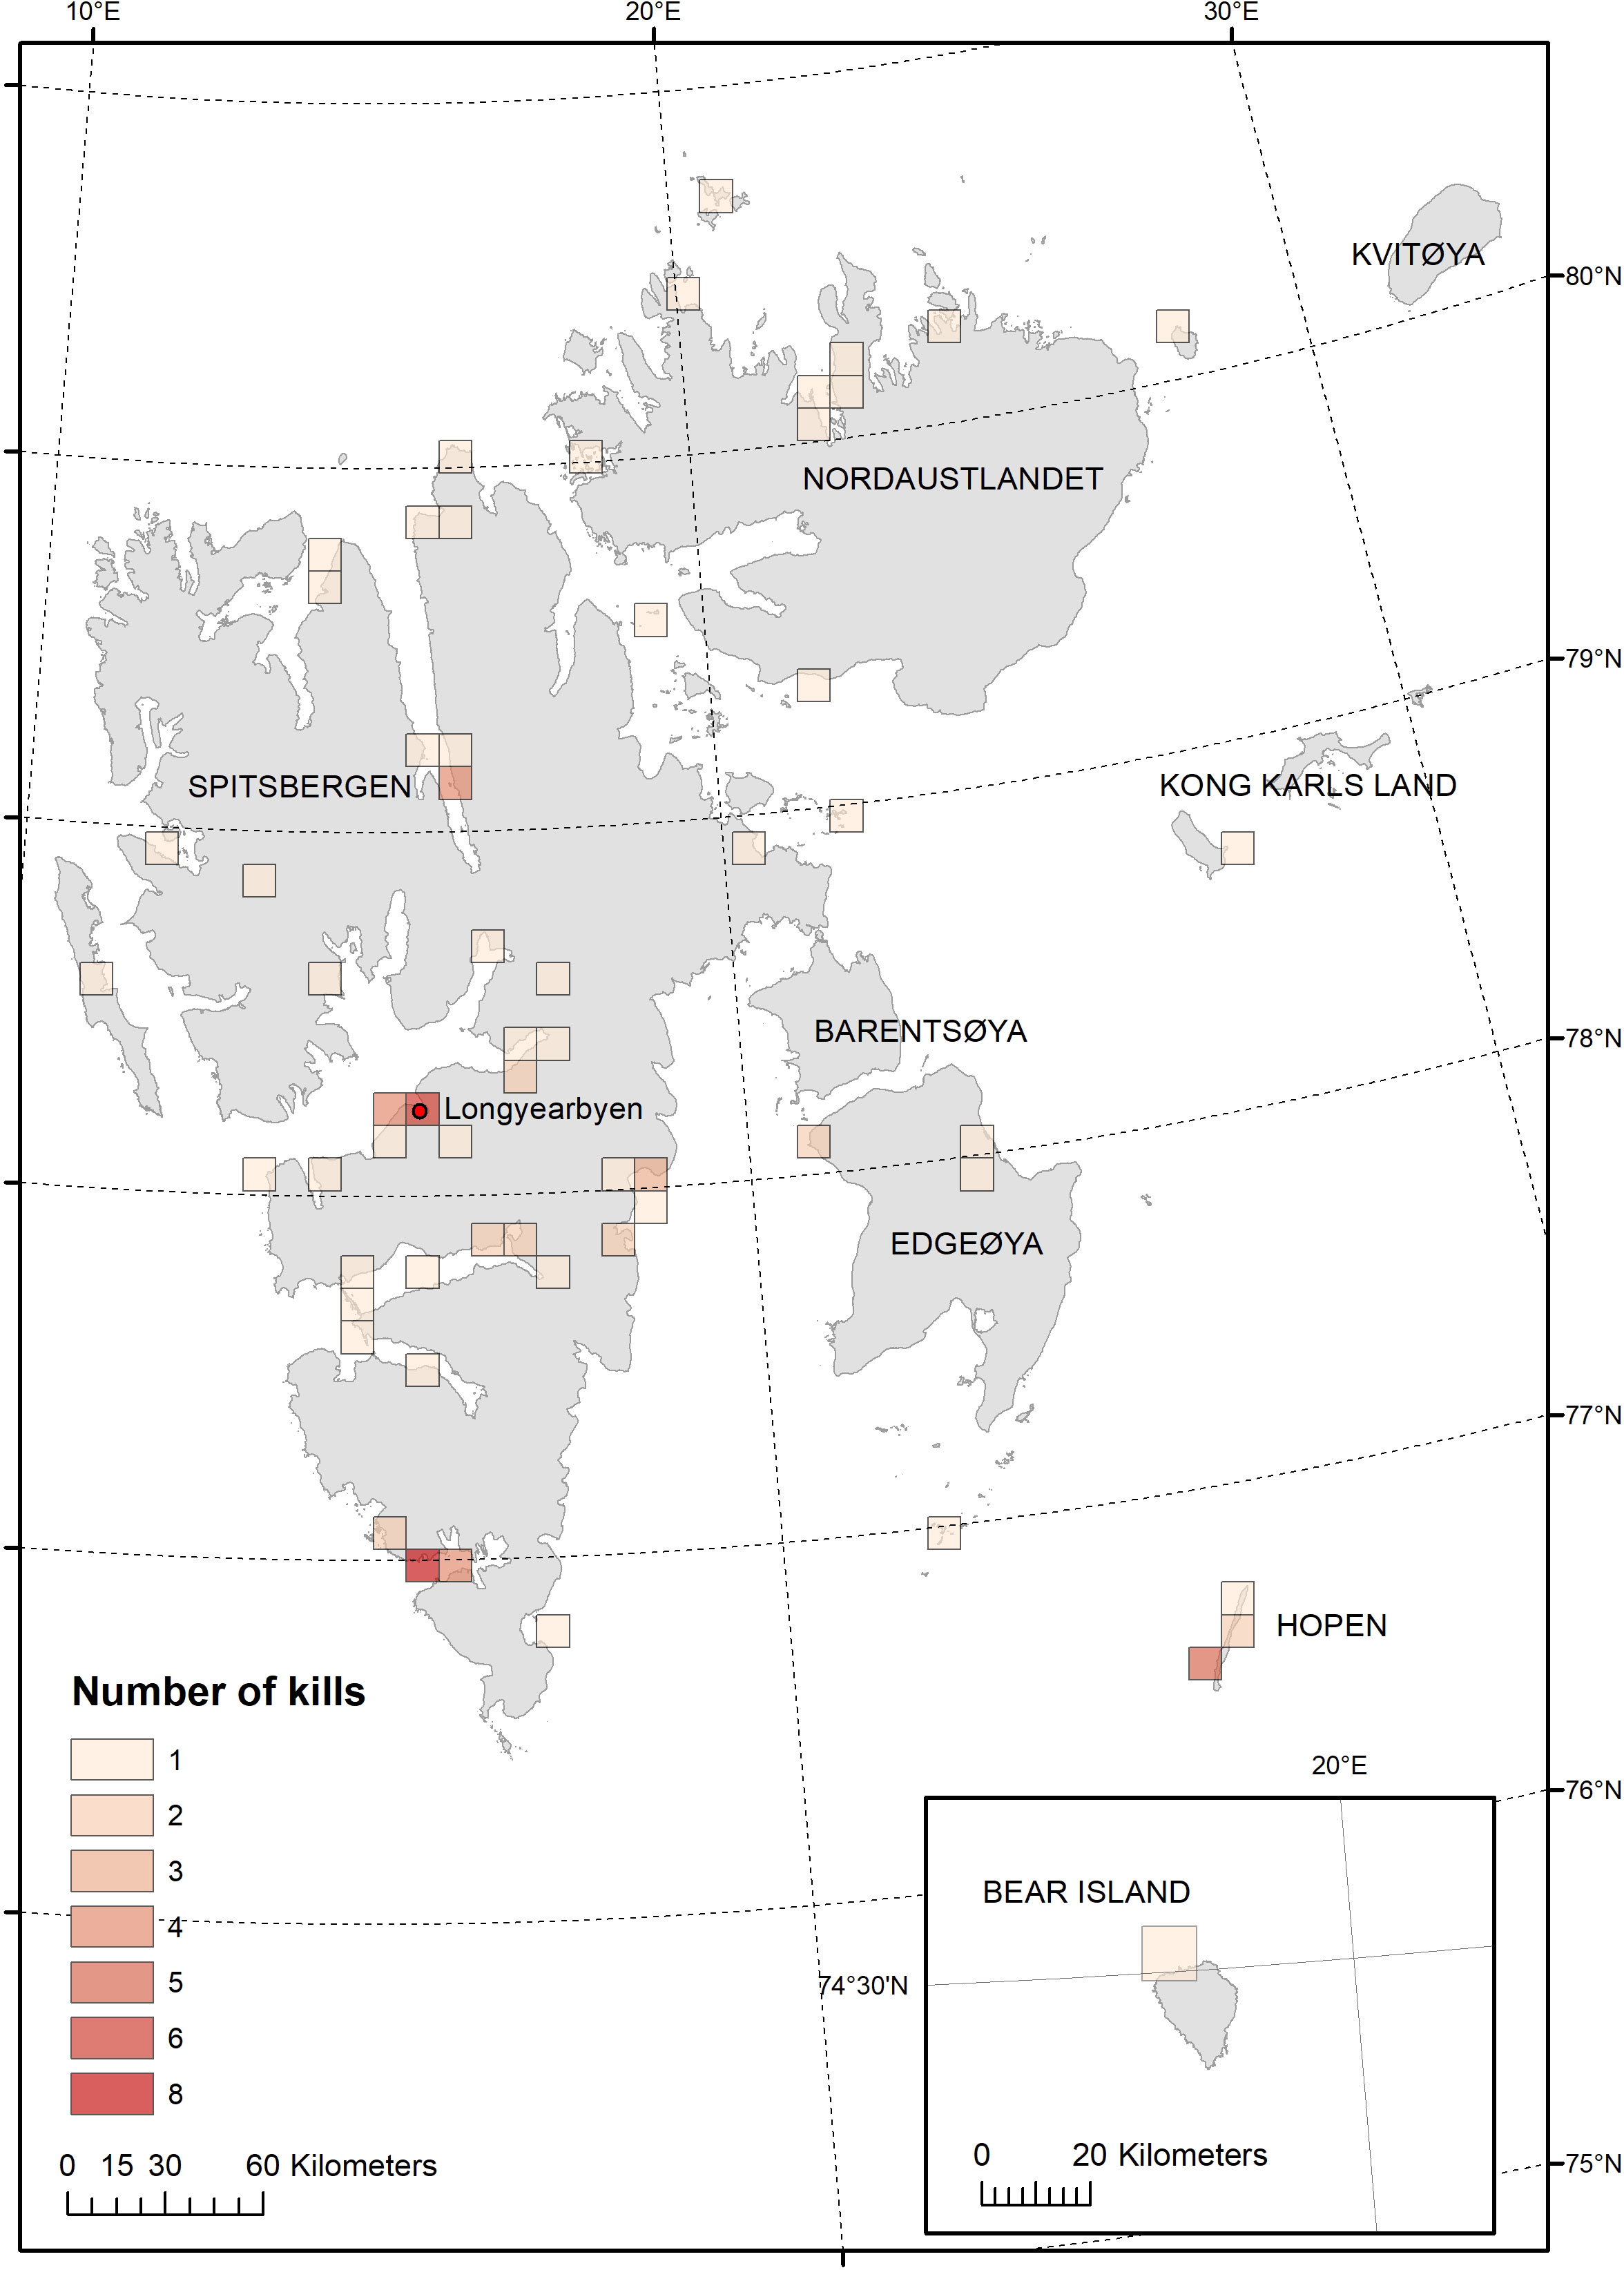
Figure 1 Killed polar bears and polar bears found dead in Svalbard 1987-2016, map showing 95 locations aggregated over at 10 km grid.
Eighty-one of the 95 records, covering the period August 1987 – August 2016 were classified as problem bears, or bears legally killed in defence of life and property (also called DLP-bears, Figure S1). A problem bear is a bear that obtained anthropogenic food, damaged property, acted aggressively towards humans, or was judged to be negatively affected by human activities (Hopkins et al., 2010; Wilder et al., 2017). Of the 14 bears classified as “non-DLP”, six were natural mortalities and eight were sick or injured bears killed by the government for ethical reasons (Figure S1). The two euthanized bears removed from the original 113 bear dataset should have been included in the “non-DLP” data, however, when this error was discovered analyses were already finalized, and we concluded that these records would have negligible influence on the results.
Analyses was first done separately for dataset “DLP” (81 records) and dataset “ALL” (95 records), but since the results were similar we only describe results from the data set “ALL”.
In late 2021, we obtained data for 2017-2019, and there was one more record of a kill that occurred in 2018, none in 2017 or 2019. We did not include this kill in our statistical modelling of kill location, but we did include it in other analyses and tallies of the number of kills. Hence, the dataset used to report total number of kills consisted of 96 bears, covering the period August 1987 and through 2019.
Of the six data sets on tourism in Svalbard found available (Table S2), we utilized the data set showing monthly totals of the number of people arriving in Longyearbyen from 1995 to present (Figure S3). These data were compared to the monthly numbers of kills for all sectors combined.
Analyses of the numbers of killed bears
With changing dates in sea ice melt and formation as well as seasonal patterns of tourism (e.g. snowmobiles in winter, cruise ships in summer), we investigated changes in distributions of kills both within and across years. To examine for trends in annual counts of killed bears we analysed the yearly counts using a generalized linear model (GLM) with a Poisson distribution and a log link. We used quasi-likelihood methods to account for overdispersion in the data [assessed using the residual deviance; McCullagh and Nelder (1989)], and checked if residuals of the models were autocorrelated using the acf() function in R. To examine changes among single months and whether there were changes in single months over years we used a GLM on the month by year counts and the aggregated monthly counts.
We assessed relationships between number of bears killed and number of tourists, with a log-linear model, assuming a Poisson distribution for the response and a log link. We split 1995-2019 in three equal length periods (1995-2002, 2003-10, and 2011-2019) to assess temporal changes in the relationship between numbers of killed bears and numbers of tourists. We tested for an interaction between period and number of tourists, and then for the additive effect of period and number of tourists (each effect fitted last). Overdispersion of the most complex model (with the interaction period*number of tourists) was assessed using the residual deviance (McCullagh and Nelder, 1989). Standardized residuals were checked for trends and constant variance. These analyses were done in R (R Core Team, 2022).
Analyses of kill locations and covariates
We applied discrete-choice analysis to examine variables hypothesized to influence the odds of a kill event in a specific location (Cooper and Millspaugh, 1999). Discrete-choice models compare characteristics of kill locations to characteristics of random locations and are a variant of conditional logit models (Allison, 1999). Our discrete choice model related the odds of a kill (odds = probability of kill divided by probability of no kill) to changes in the explanatory variables. In particular, we were interested in whether changes in offshore ice concentrations were correlated with odds of a kill after controlling for other sources of variation such as distance to shore and settlements.
The underlying statistical likelihood of our discrete choice model is the same as that utilized in stratified Cox proportional hazards modelling of continuous-time survival rates, where stratum are composed of one case (here, kill) and several controls (here, random location) (Therneau and Grambsch, 2000). Thus, we used statistical software procedures capable of estimating stratified Cox proportional-hazards models to estimate our discrete-choice models (McDonald et al., 2006; Therneau, 2017).
For the discrete choice analyses, we required random locations to compare against every kill location. We generated 50 unique random locations for each kill event on the landmass of Svalbard (Norwegian Polar Institute, 2014) Random points were chosen using ArcMap software, with random points generated from a uniform distribution over triangles that partitioned area polygons (ESRI, ArcMap 10.3). All random points were on land even though 11 of the 95 kills were slightly (<600 m) offshore and three were farther (1304, 2868 and 5559 m offshore). All 14 offshore kill sites were within narrow fjords of the Svalbard archipelago. In total, the DLP dataset used for modelling contained (50 random + 1 kill) x (81 sites) = 4,131 points, while the ALL dataset contained (50 random + 1 kill) x (95 sites) = 4,845 points. All random points had the same time stamp as their assigned so that temporal characteristics (e.g., tourist landings) could be correctly assigned.
We derived five distance metrics from the locations of random points and kills. For each of the random and kill-site points we measured the shortest straight-line distance to sea (SEA), distance to the nearest tourist landing location in use during 1996-2016 (LAND124; Figure 2A), distance to the nearest of the 21 large landing sites that welcomed >10,000 tourists during the same period (LAND21; Figure 2A), distance to the nearest of seven permanent settlements (SET; Figure 2B), and the distance to the nearest of five trapper’s cabins that were active during the period (TRAP; Figure 2B). We treated all 124 landing sites as active during the period 1987-2016 even though the data on landings were available only after 1995 and some were intermittently inactive thereafter. When inactive, zero landings were recorded at landing sites. Similarly, we assumed all settlements were equivalent even though few people resided in some settlements while Longyearbyen, the largest settlement, had more than 2,100 residents annually.
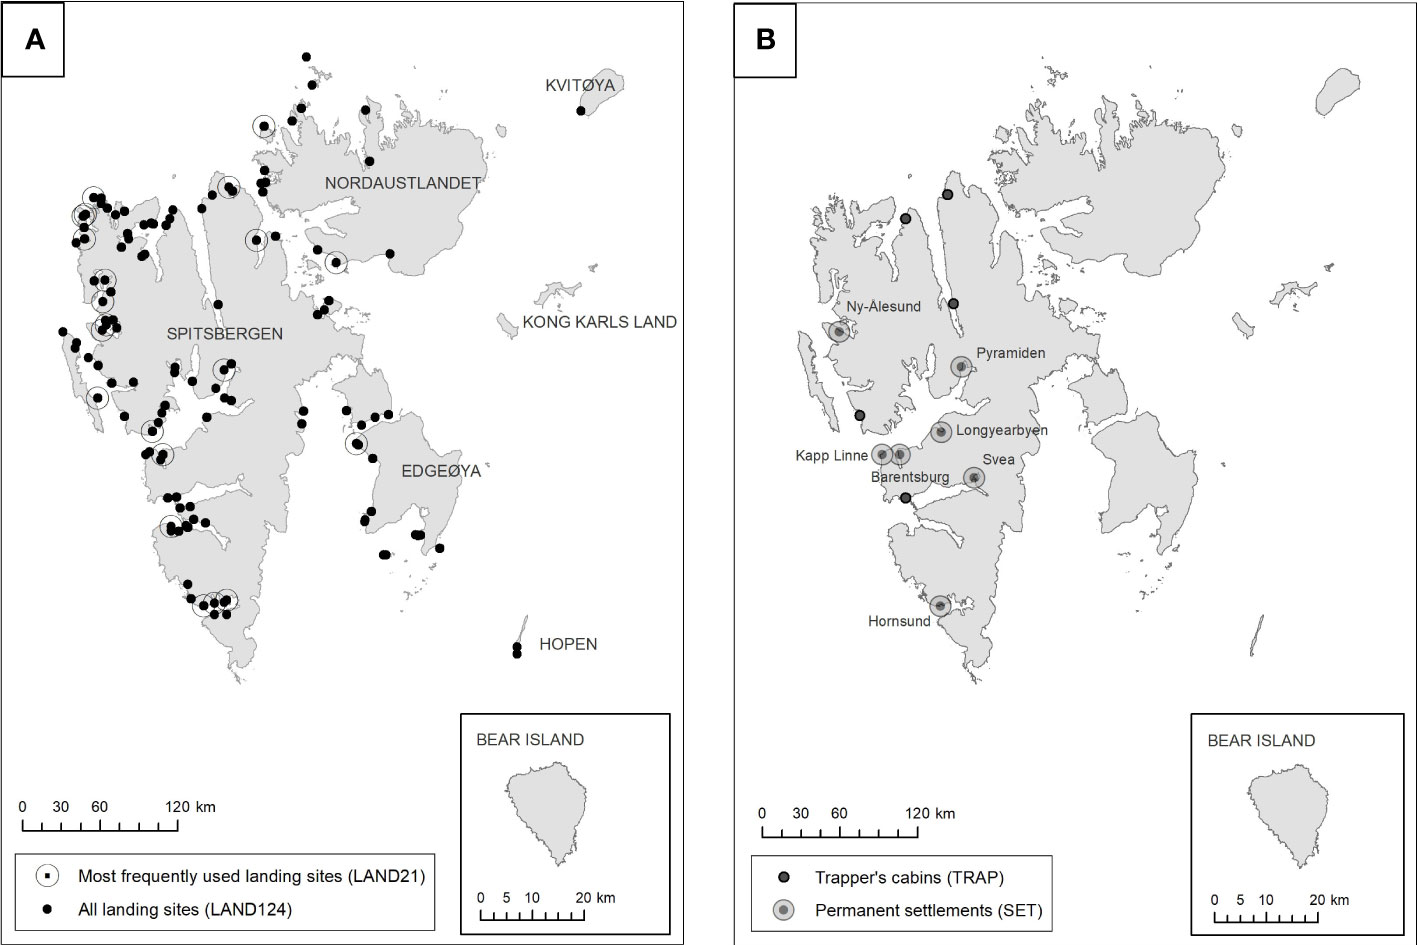
Figure 2 Locations of human activity used to calculate distance covariates. (A) shows landing sites for tourists, and (B) shows permanent settlements and trapper’s cabins. Large caps annotates land masses/islands, small caps annotates settlements.
Pearson correlations amongst the set of all kill and random sites demonstrated that LAND124, LAND21, SET, and TRAP were moderately inter-correlated (0.41 ≤ r ≤ 0.76). To prevent multicollinearity and model parameter instability of discrete-choice models, we included up to two distance metrics, including only one from the set of four correlated distance metrics, and potentially the uncorrelated distance to sea metric (SEA).
To investigate regional differences, we assigned every kill and random point to one of four geographic sectors covering Svalbard and the surrounding sea. We aligned our sectors with the cardinal directions west (W), south (S), east (E), and north (N) because ice flow and coverage were generally similar within and dissimilar among sectors (Figure 3A). Sectors varied in size and the W sector encompassed the main settlement Longyearbyen.
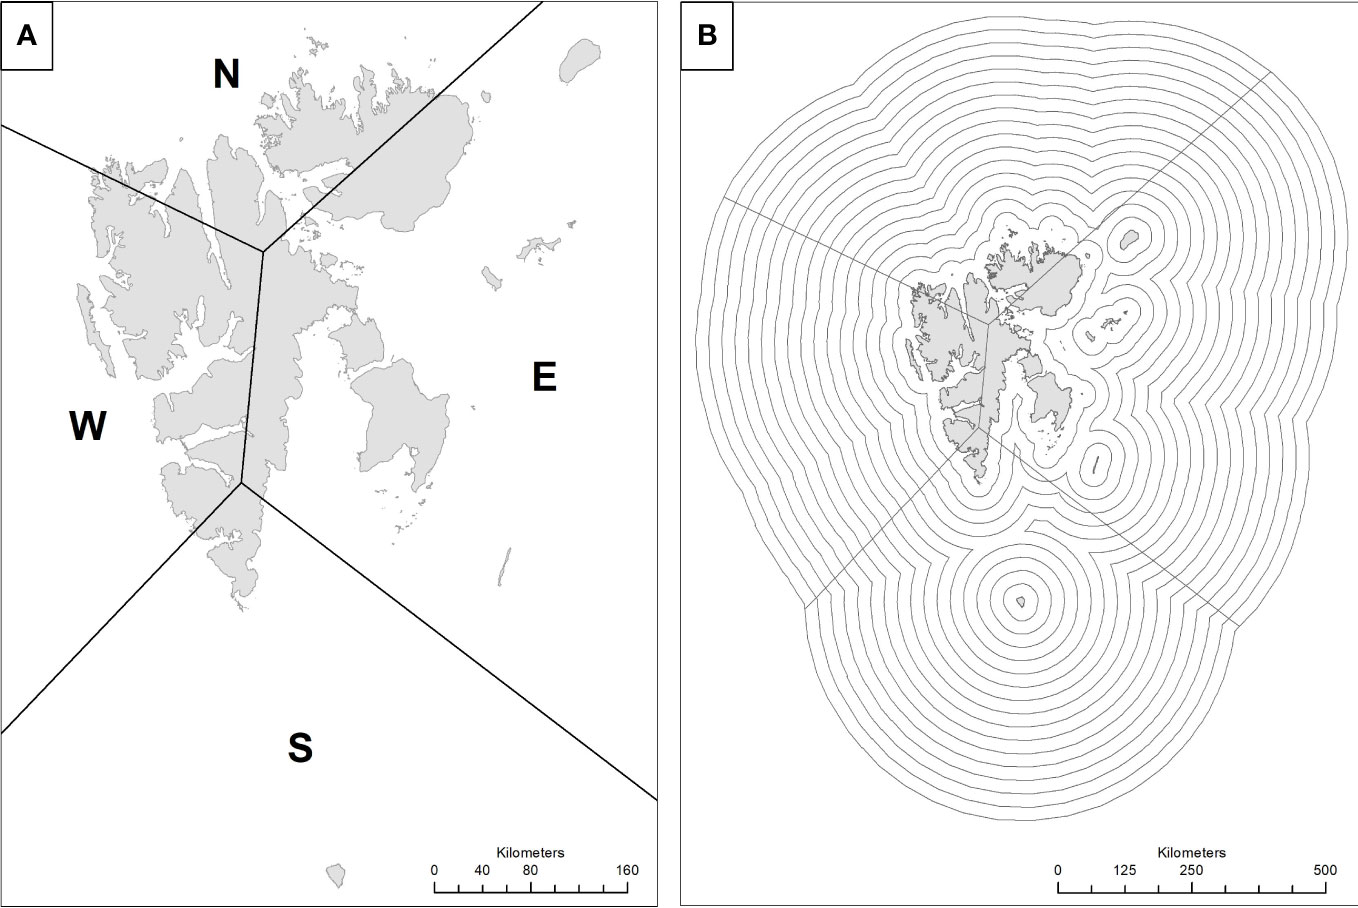
Figure 3 Panel (A) shows the arbitrarily chosen sectors and panel (B) the 25-km wide bands used for aggregation of monthly sea ice concentration 1987-2016.
To determine whether offshore sea ice concentration influenced probability of a bear kill, we measured ice concentration in 25-km wide radial bands surrounding the Svalbard shoreline out to a distance of 400 km (Figure 3B). We obtained daily measurements of sea ice concentration out to 400 km from the National Snow and Ice Data Center (NSIDC, Boulder, Colorado, USA). We calculated monthly average sea ice concentration separately for each 25-km band in each sector using data from November 1978 through December 2016, thus ending up with 16 ice cover covariates for each data set, whether being for each separate sector or for all sectors combined.
To investigate whether the odds of any particular kill depended on ice cover in months prior to the kill (ice lag), we introduced lagged months of ice cover as a covariate. Monthly lag periods ranged from zero to nine months. A lag of zero months means ice coverage data from the month in which the bear was killed was used as predictor, while a lag of nine months means the ice-coverage data used was from nine months prior to the bear-kill date. Note that nine months safely encompasses any one year’s maximum fall freeze-up and spring melt. We considered all 10 monthly lagged models, from the zero-month lag model to the 9-month lag model.
Evaluation of at most one of the 16 different ice-cover covariates; either zero, one, or two distance metrics, induced a total number of up to 169 possible models (Supplement S4), although sparse data occasionally prevented the evaluation of some of these possibilities. Assuming convergence, we used Akaike’s Information Criteria (AIC) to determine which models were better predictive models than others (Anderson and Burnham, 2011).
Five different data subsets were considered for model evaluation. We fitted one model to a dataset containing records from all sectors. We fitted separate models to data from each sector to allow sector-specific covariates to manifest when appropriate. Sector-specific models were subsetted to only include a kill originating in the sector of interest. Once identified, the 50 replicates tied to those sector-specific bears were also included. In this way, the four separate sector-specific models partitioned the available data. We then fitted one model to data from all sectors combined. AIC identified best models on each of the five different datasets independently.
We obtained odds ratios by exponentiating estimated model coefficients. Odds ratios measured the direction and magnitude of changes in the probability of a kill occurring in a pixel when the value of a covariate changes by one unit (we used the original scale for all covariates). For example, an odds ratio of 0.5 for distance from sea (covariate SEA) meant that the odds (probability of a kill divided by probability of no kill) decreased by half for each one kilometer increase in distance to the sea. Conversely, the odds ratio’s reciprocal, 1/0.5 = 2, implies that a pixel three kilometer from the sea will have twice the odds of containing a kill location as a pixel two kilometer from the sea (assuming all else is the same) because these two locations are one kilometer apart. We considered odds ratios statistically significant if their 95% confidence interval did not include 1. For reporting, we calculated the theoretical distance a bear would be required to move away from three types of locations (shoreline, landing site, and settlement) to reduce or augment their odds for being killed by 50%. We also calculated the change in ice cover in a given ring for a given lag that would change the odds for a kill by 50%.
Results
Number of killed bears
Annual polar bear kills during the period 1987-2019 ranged from 0-10 (mean=2.9, SD=2.7). Evidence for an apparently declining trend in annual kills was relatively strong after accounting for overdispersion (byear=-0.045 [95% CI: -0.081; -0.011]; F1,31 = 6.88, P= 0.013, Figure 4A). Variation among months was significant (ΔDeviance=61.13, df=11, P<0.001) with peaks in bear kills in April, July and August, and low numbers in October and November (Figure 4B). Kills in individual months showed no strong evidence for long-term trend, except in August (all P>0.04). August, the month with most kills, reflected the same negative trend as yearly data (byear=-0.077 [95% CI: -0.130; -0.029]). February, the next month with some evidence for a negative trend (P=0.04), had a similar negative trend too (byear=-0.093 [-0.21; -0.0004].
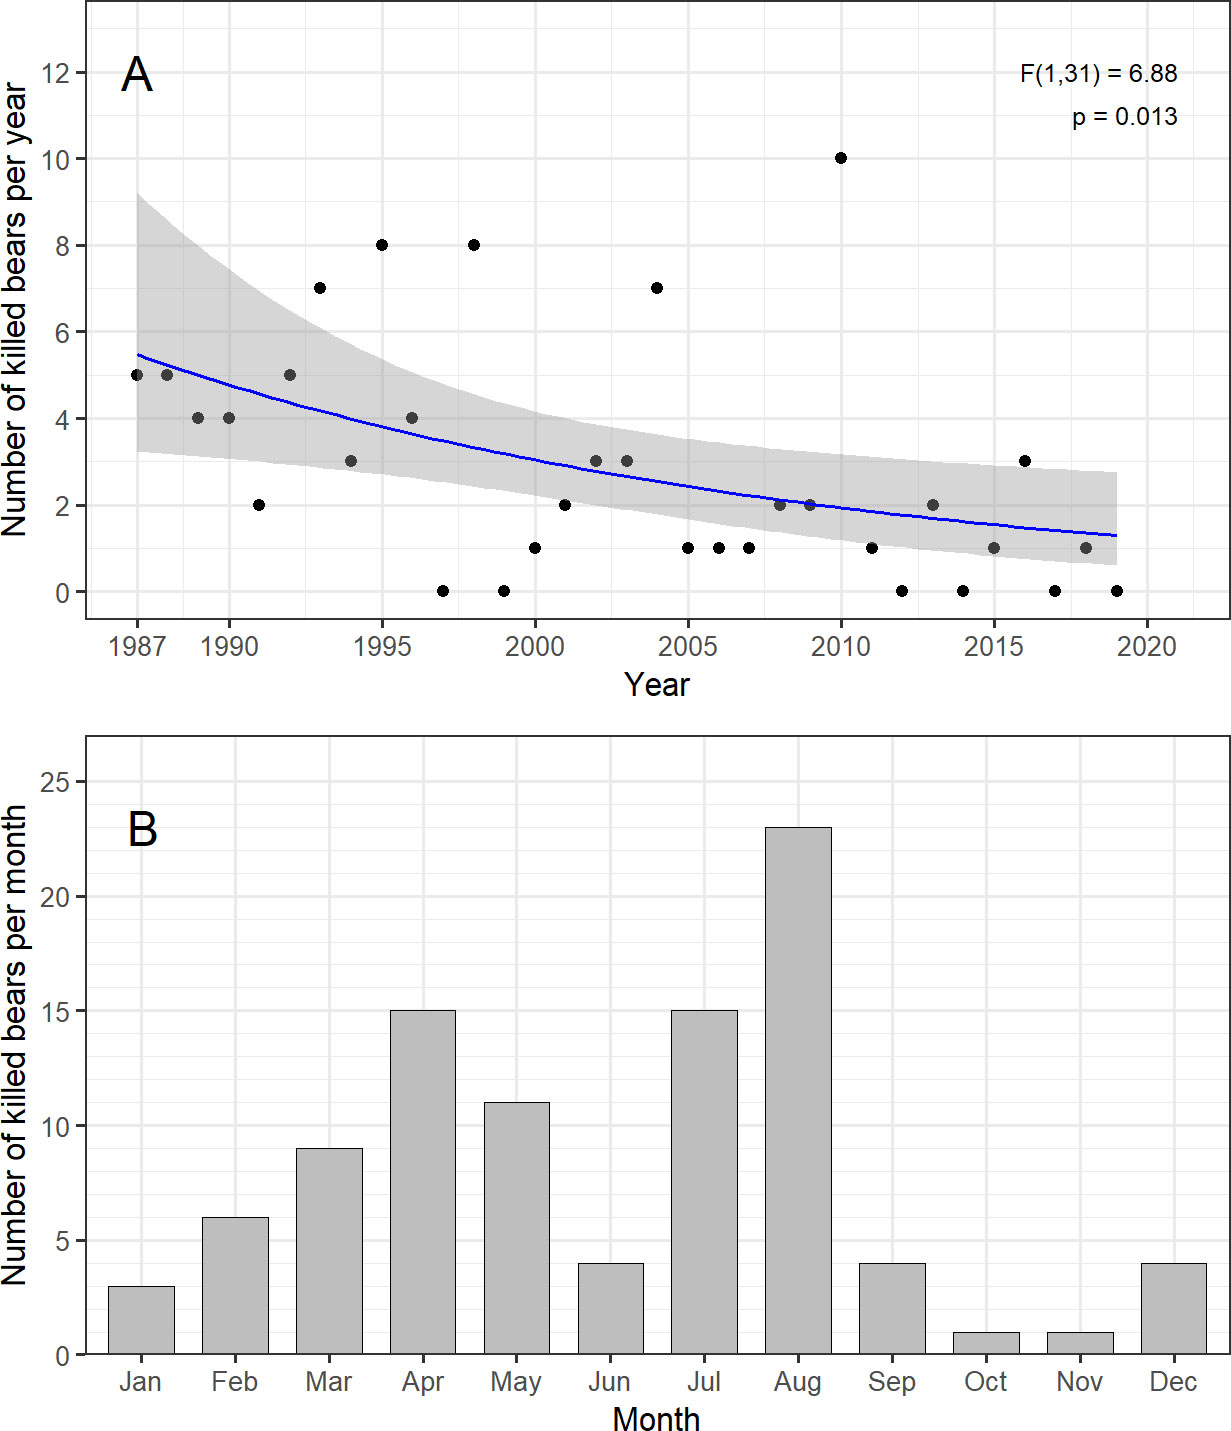
Figure 4 Polar bear kills in Svalbard 1986-2019 aggregated on a yearly (A) and monthly (B) scale. Annual best-fit trend line in upper panel, with 95% CI (gray area), obtained via a Poisson Generalized Linear Model with a quasilikelihood variance adjustment.
There was a positive relationship between the number of bears killed and the number of people arriving in Longyearbyen (Figure 5). The model with the interaction Tourists*Period fitted the data (residual deviance = 26.2, df = 30, p=0.66). There was no evidence for an interaction Tourists*Period (Δdeviance=1.03, df=2, p=0.59), meaning that the slope of the relationship log(mean number of bears killed) – number of tourists could be assumed to have been the same among periods. There was strong evidence when fitting the effect last for an additive effect of Period (Δdeviance=40.0, df=2, p<0.001) and Number of Tourists (Δdeviance=32.7, df=1, p<0.001). The period effect showed a strong decrease (ΔPeriod2-Period1)=-0.81, SE=0.35, Δ(Period3-Period1)=-3.05, SE=0.59, i.e. number of bears killed in period 2 was a bit more than halved compared to period 1 for the same number of tourists, and 21 times less in period 3 compared to period 1). Therefore, the overall increase in the number of people coming to Svalbard was compensated by a decreasing number of bears killed for a given number of people, leading to no systematic increase in the total number of bears killed over time.
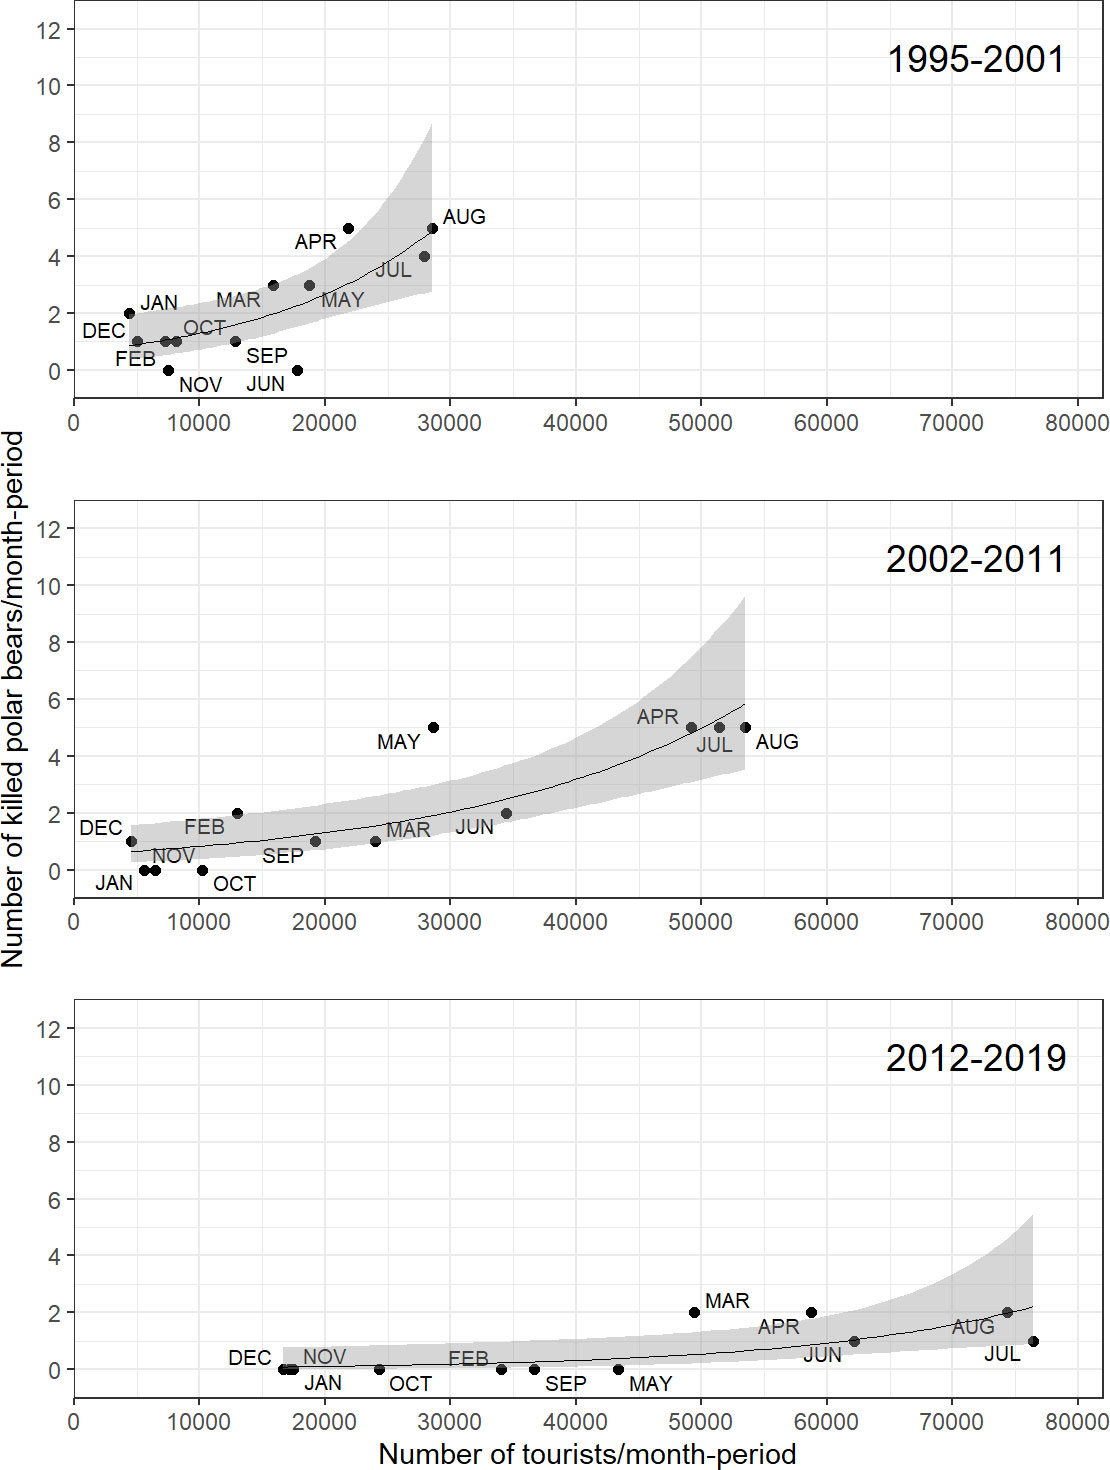
Figure 5 The relation between the number of tourists arriving in Longyearbyen and the number of bears killed in Svalbard, in three periods in the period 1987-2019. Annual best-fit trend lines, with 95% CI (grey area), obtained via a Poisson Generalized Linear Model with a quasilikelihood variance adjustment.
Locations of killed bears
Figure 6 shows the spatial and temporal distributions of kills (number of kills between sectors is provided in Table S5). There were consistently more kills in August in all sectors, and there was a small peak centered on April when all sectors were combined. There were similar temporal patterns in all sectors, with a slight exception for the West-sector, where there was a higher number of kills than in the other sectors, and where the temporal distribution of kills was more uniform across months.
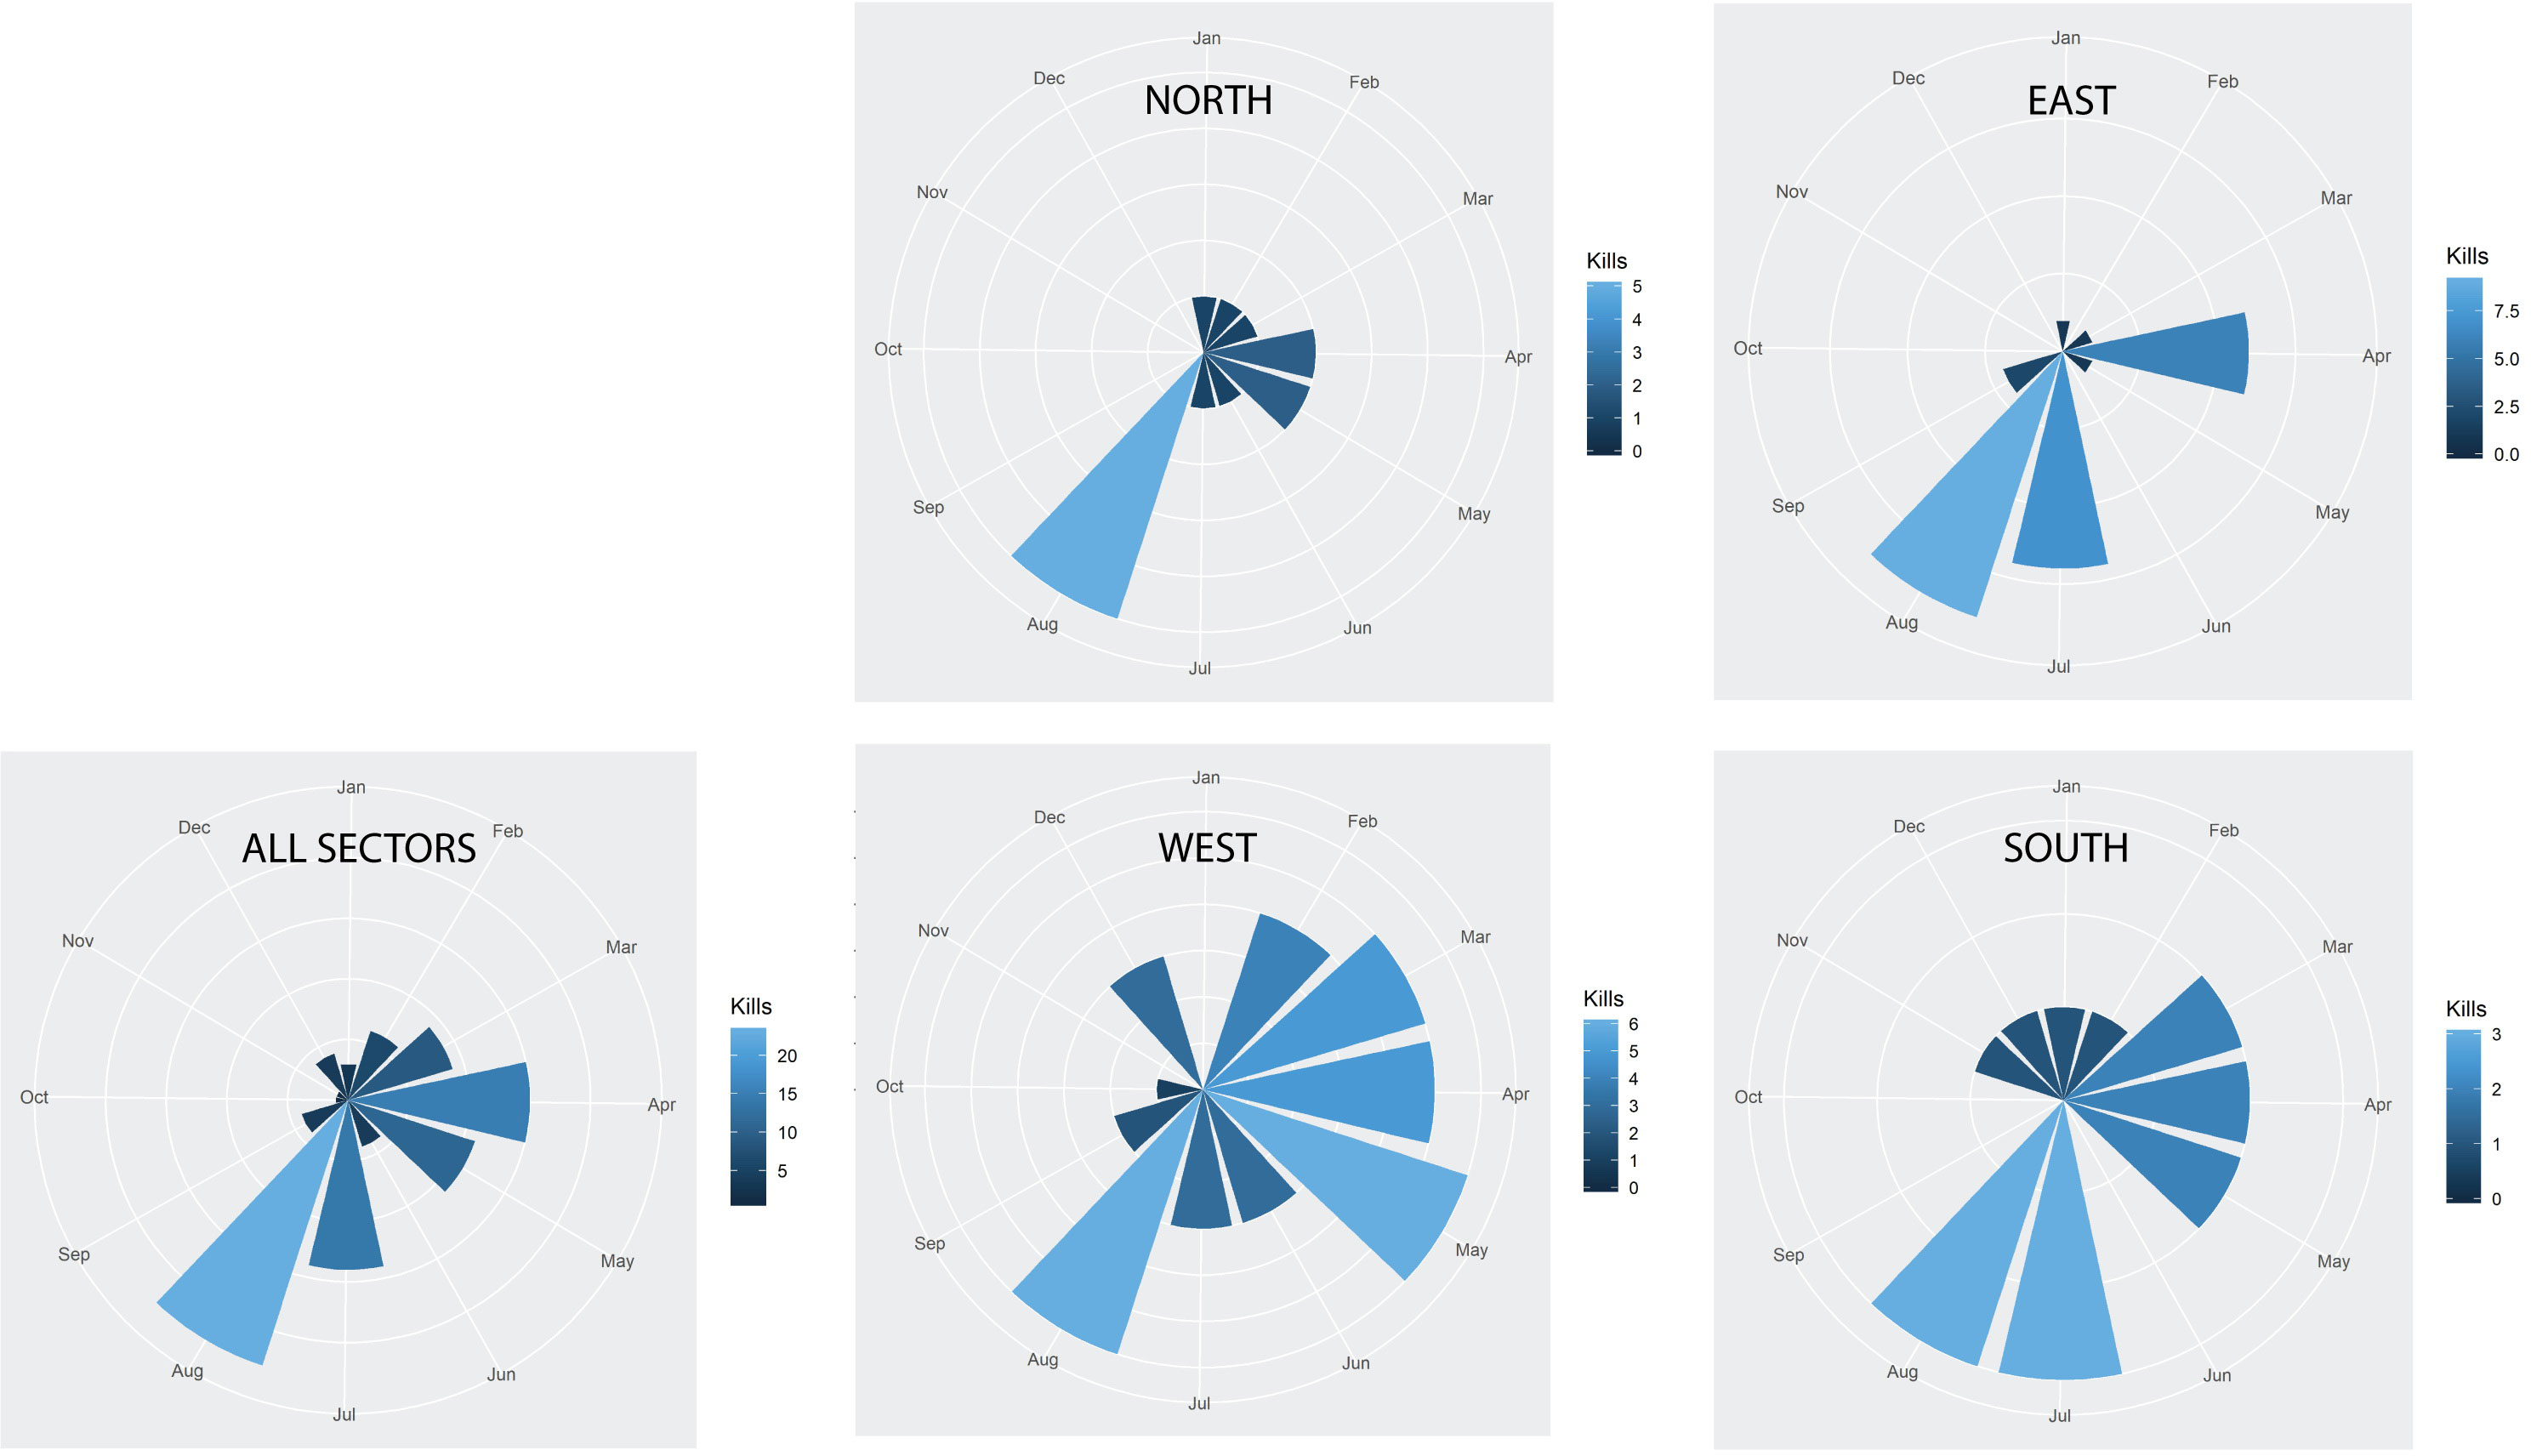
Figure 6 The timing of polar bear kills over All Sectors combined and per sector.
Tables 1A, B present the calculated additional average distance a theoretical bear would be required to move away from the shore line, a landing site, or a settlement in order to reduce their odds of being killed by 50% (Table S6 displays the corresponding odds ratios and confidence intervals from all the top model runs for all sectors and all the sectors combined, i.e. Sector All). Table 1C presents the same for change in ice cover resulting in a 50% reduction in odds of a kill.
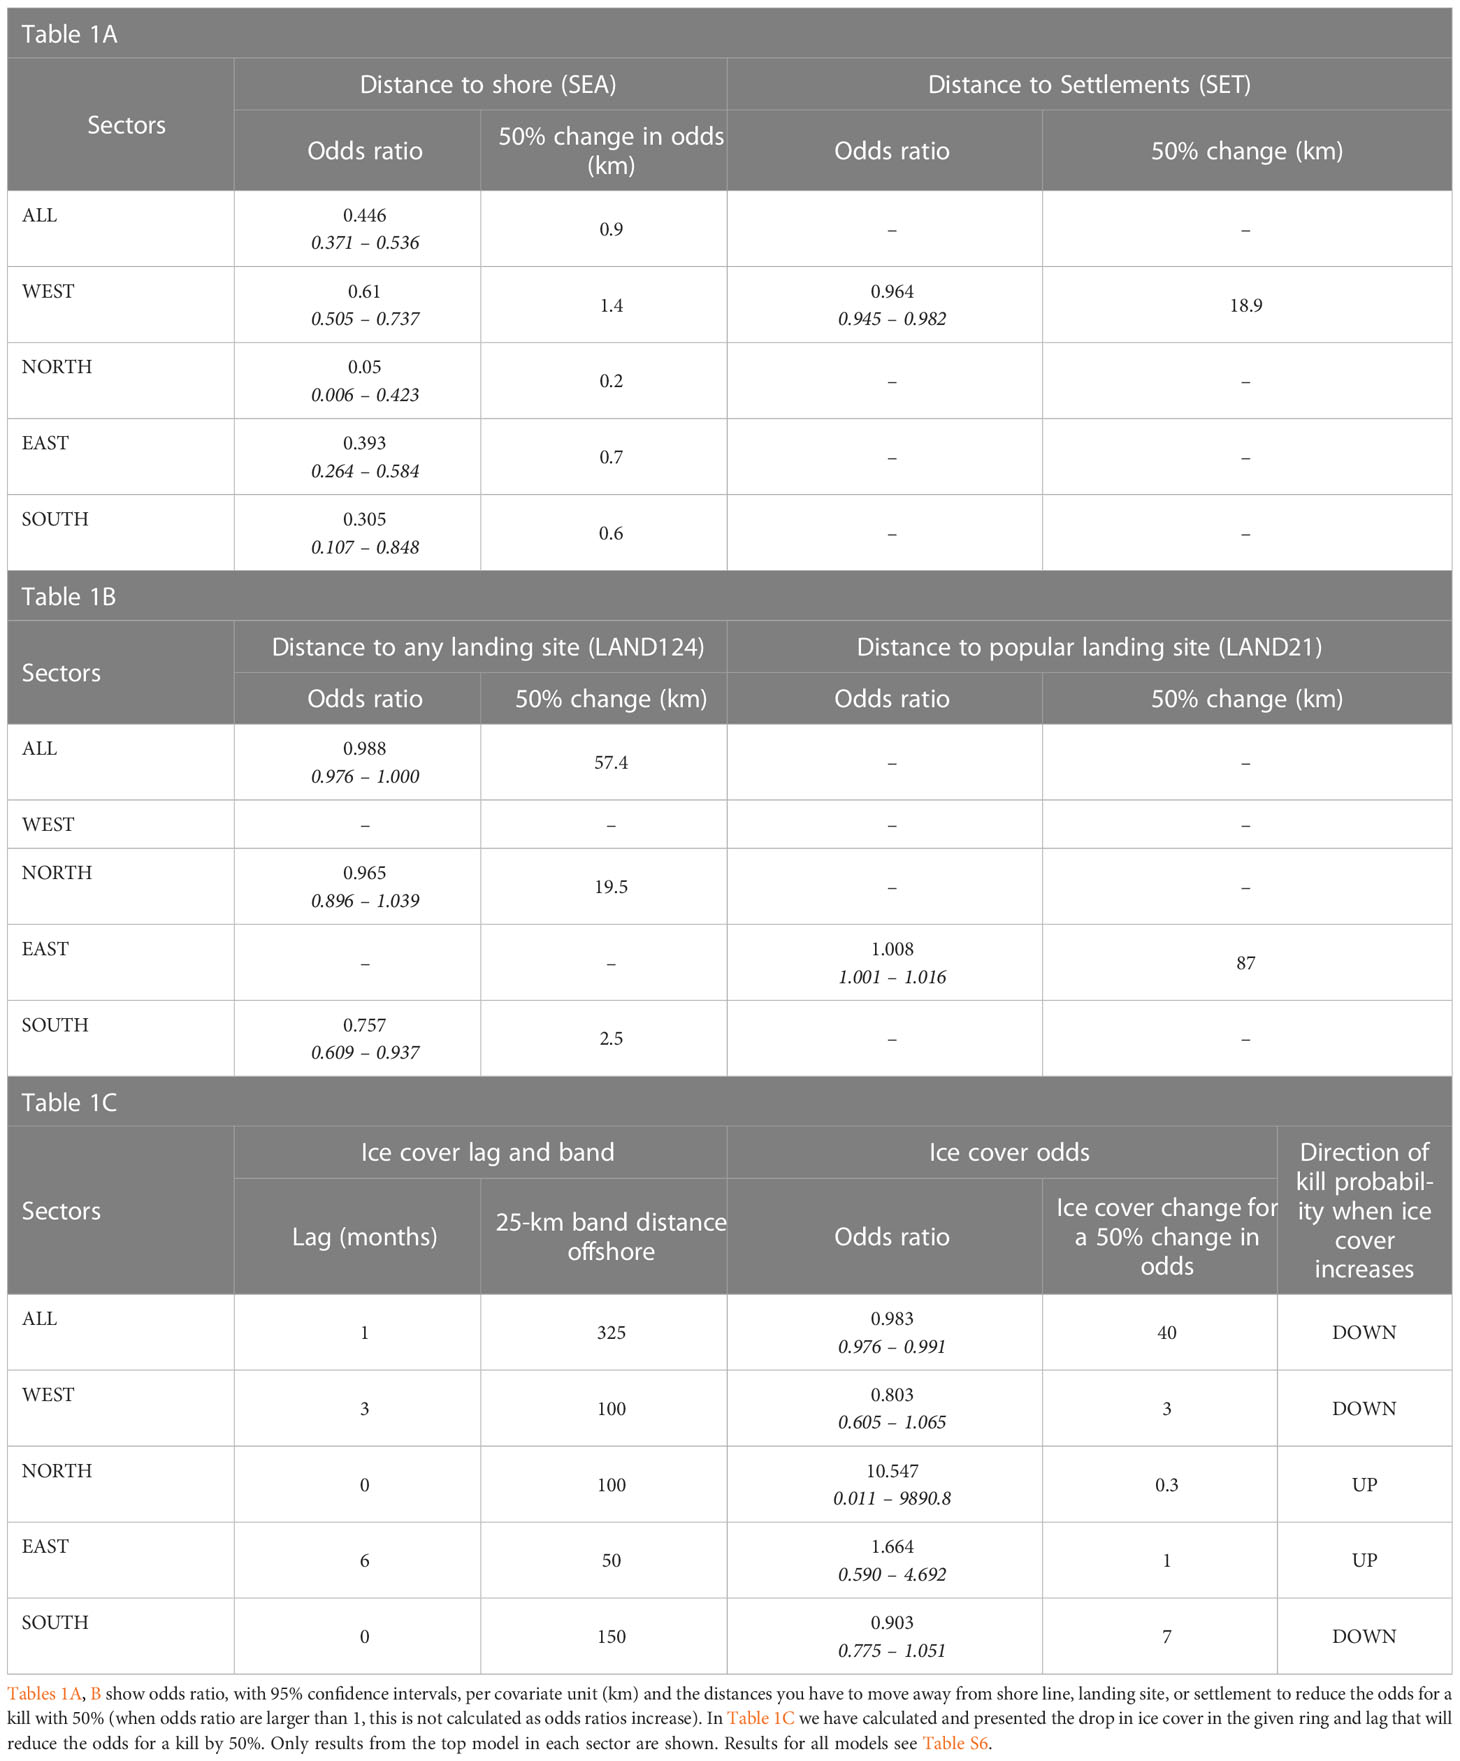
Table 1 Relationships between distance covariates and ice cover with the odds ratios of a polar bear kill from the period 1987-2016.
All four selected sector models, including the model for the pooled data set Sector All, identify distance to shore as an important predictor, i.e. odds ratio < 1 and confidence intervals for the variable SEA excluded the value 1. Odds dropped by 50% in the North sector when a theoretical bear moved only 200 m from the shoreline, 600 m in the South sector, 700 m in the East sector, 1.4 km in the West sector, and 900 m when all sectors were combined. These 50% reduction distances indicate that most kills occurred near shore and that proximity to shore was relatively hazardous to bears.
In the West sector the human-distance covariate SET, distance to human settlements, have odds ratio less than one, with a corresponding 95% confidence interval excluding one. The selected West model with its odds ratio of 0.964 [95% CI: (0.945, 0.982)], means that the odds of a bear kill decrease by 50% when the theoretical bear moved 18.9 km away from a settlement.
The other distance covariates lacked significant influence on the odds of a kill, except for distance from landing sites in the South sector, where an increase in distance of 2.5 km from any landing site (LAND124) resulted in a 50% drop in odds of a kill. For all sectors combined the required distance removed from a landing site for a 50% drop in odds ratio was 57.4 km.
For the four sectors separately, we found that odds of bear kills were influenced by ice cover in bands close to the shore. Namely, the best fitting discrete choice model contained the 100 km band in the West and North sectors, the 50 km band in the East sector, and the 150 km band in the South sector. In the West and the South an increase in ice cover of three and seven percent, respectively, in these bands resulted in a 50% decrease in the probability of a kill.
When considering ice time-lags, intended to evaluate the significance of prior ice concentrations on prediction of kills, increased ice cover three months prior to the kill reduced the probability of a kill in the West sector by approximately 20%. In the South sector, increased current ice cover (lag 0) reduced odds of a kill by approximately 10%.
In contrast, for the North and East sectors, the odds of a kill increased when ice cover increased 6 months and 0 months, respectively, prior to the kill. However, confidence intervals for these odds ratios are wide for some sectors, emphasizing the lack of reliable evidence across sectors (Table S6). When sectors are combined, a 40% increase in ice cover in the 25-km bands off the coast in the same month or one month prior to a kill resulted in a 50% drop in odds of a kill.
There were no significant effects of distance from trappers’ cabins on the odds ratio for a kill in any sector, or for all sectors combined.
Discussion
Availability of sea ice habitat around Svalbard declined greatly through the years represented in our study, however, data on polar bear movement is not entirely conclusive when it comes to whether polar bears are spending more or less time on land as a result (Hamilton et al., 2017; Stempniewicz et al., 2021). In the Beaufort Sea in Alaska (Atwood et al., 2016), and in the Western Hudson Bay (Stirling et al., 1999; Towns et al., 2009), it has been shown that polar bears in these areas spend more time on land. While on land, bears in some areas have been shown to experience nutritional stress, either from having to find and rely on alternative food sources, or simply because there are no adequate food available for polar bears on land (Rode et al., 2015a), which again would support the expectation that the number of interactions and conflicts between humans and polar bears could increase.
Simultaneously, numbers of visitors to Svalbard increased dramatically (Norwegian Polar Institute, 2022). More bears on land for longer periods during which more people were accessing the same habitats could have been expected to increase the number of bear-human interactions, and the number of bears killed in defense of life and property. Despite a positive relationship between number of tourists and number of kills at a given time, the total numbers of bears killed did not increase over the years of the study and per-capita kills strongly declined. Whether by serendipity or because of conscious actions on the parts of managers and visitors, the temporal trend in kills is a surprising and hopeful outcome of this work.
This overall reduction in kills may reflect success of the Svalbard Environmental Act of 2001. This act prohibits people from “luring, pursuing or otherwise seeking out polar bears in such a way as to disturb them or expose either bears or humans to danger” (Norwegian Ministry of Climate and Environment, 2001). These requirements may make visitors more cautious and result in human behaviors that make lethal conflicts between humans and bears less likely. Also, in Svalbard, we have no data on whether the bears on land actually are nutritionally stressed.
There have been no studies focusing on human-bear interactions in Svalbard since 1993 (Gjertz et al., 1993), however, evidence suggests records of killed bears are comprehensive. Information about non-lethal interactions between polar bears and humans, however, is lacking. Incident data in Svalbard have prior to recent years only been collected when bears have been killed due to self-defense or loss of human life. Hence, we are unable to evaluate trends in total numbers (combined lethal and non-lethal) of incidents. The absence of such information is clearly a shortcoming that limits the understanding of the variety of bear/human interactions. Increased international collaboration stemming from the development of a coordinated circumpolar action plan to conserve polar bears have increased focus on the necessity to collect information on all kinds of incidents, including non-lethal ones (Polar Bear Range States, 2015).
The number of people visiting Svalbard has increased dramatically, especially after 2011 (Norwegian Polar Institute, 2022). The positive relationship between people arriving in Longyearbyen, the main settlement and the location of the airport, and fatal conflicts anywhere on Svalbard, indicates that the number of people arriving in Longyearbyen is a valid proxy for the number of people travelling in the wild, and thereby exposing themselves for potential interactions with polar bears. Although the vast majority of visitors to Svalbard stay in Longyearbyen, or go cruising on a variety of vessels, many depart from Longyearbyen to go trekking and camping in more remote areas where bears can be encountered. Data are lacking, however, to identify trends in the number of people travelling in the wild.
All sectors show a maximum of fatal conflicts in summer (July and August). In addition, there are lesser peaks in spring in the West and South sectors, and in April also in the East sector. These spring peaks coincide with the period when light returns and when snowmobile tourism peaks, and popular snowmobile trips runs from the main settlement Longyearbyen in the West to East sector areas of Agardh and Storfjorden, where polar bear females hunt with their COYs (cubs of the year) after den emergence in early April.
Although our records include 81 kills of problem bears, Wilder et al. (2017) found only 10 incidents where polar bears actually attacked people. Attacks were defined as “intentional contact by a bear resulting in human injury”. This means that the rest of the fatal incidents in our data set resulted from contacts with bears that were perceived as dangerous to humans, but where there were no actual attacks. Meetings between bears and humans can be placed on a continuum from a fatal conflict where bears and/or human lives are lost, to observations of bears made from a distance, not perceived as dangerous by the humans observing the bears. Consistent data on non-lethal encounters between people and polar bears would be important to collect for future management of polar bears in areas where people move around. The real nature of a meeting with bears can be hard to assess for anyone. Whether a situation is a real conflict incident and thus problematic, or an incident with no conflict, can be very hard to judge, and outcomes of interactions will always be partly dependent on the level of knowledge and experience of the humans involved. It is therefore vital that people moving around in bear country are trained in how to perceive the difference, how to accurately classify encounters as an observation, an interaction or a conflict; and how to respond appropriately (Hopkins et al., 2010; Wilder et al., 2017). This requires recording all encounters to enumerate, classify, and understand them, and to learn how to avoid having them escalate to the fatal stage.
The consistent finding that the odds for a problem bear kill is by far greater along the shoreline in all sectors was expected. The large majority of people that travel in the Svalbard wilderness never travel far from shore, and the West sector is the most populated and most trafficked part of Svalbard. Tourist peak seasons are April, which is peak snow mobile season, and summer months July and August. All sectors show peaks in these two periods of the year, while the time and place for kills shows a bit more variability in the West and South sector. Much of this variability can be explained by the annual pattern of sea ice cover around Svalbard. The western side of Spitsbergen is the most accessible part of Svalbard due to Atlantic water masses leaving the western part ice free most of the year, thus spreading tourist traffic more evenly across seasons than is the case in the north and the east.
Landing sites for tourists only affected the odds of fatal polar bear encounters in the South sector, where the odds of a fatality increase when approaching landing sites. The landing sites in the South sector are all within the Hornsund fjord, an area where historically there have been numerous observations of bears and bear tracks. Regular and frequent polar bear observations have been recorded at a permanent Polish research station in Hornsund established in 1957. This may be explained by the fact that the drift ice originating from the Barents Sea in the east, which historically has surrounded the southern tip of Svalbard on an annual basis, most often did not move further north than Hornsund (Larsen, 1986). And, although polar bears are regularly observed all along the western coast, where there are many tourist landing sites, Hornsund is only a few kilometer from Hambergbukta and the eastern fjord of Storfjorden by land, an area close to core denning areas and an area where many of the so-called “near-shore” bears spend large parts of their lives (Mauritzen et al., 2002).
It seems fair to conclude that increasing distances (i.e., distance covariates) predict better outcomes for bears, demonstrating a relationship between human and bears – namely, that DLPs are more common in areas more frequently attended by people. At the same time it is relevant that we might lack data on encounters in areas of low human visitation density, but where bears were not killed.
The decreased odds of a kill following an increase in ice cover in the sea ice bands 100-125 km offshore in the prior 4-6 months in the West sector could be explained by fewer bears being forced to stay ashore during winter in the west, and consequently also in peak tourist seasons in spring and summer. However, in contrast to the West and South sectors, where odds ratios are <1 with increasing ice cover, odds ratios are >1 in the North and East sectors as ice cover increases. This is hard to explain, as is what seems to be an effect on odds of a kill of sea ice cover in the outermost sea ice bands, 300-400 km offshore, in the same or the one month prior to a kill, when looking at all sectors combined. It could well be an artefact of our small sample size and the idiosyncrasy of ice covariates values and kill locations. However, there seems to be different ecological strategies among bears in and around Svalbard, with a local ecotype and a pelagic ecotype (Mauritzen et al., 2001; Aars et al., 2017), differences that possibly could be expressed in the form of different migrational patterns as a response to variations in ice cover.
Conclusion
Contrary to our expectations we did not observe an increasing number of polar bears killed as numbers of visitors to Svalbard increased. We hypothesize this may be the effect of the Svalbard Environmental Act. The absence of data on non-fatal interactions between humans and polar bears, however, limits our understanding of the observed trend. The spatial and temporal distribution of kills made logical sense. Kills were more common near shore, for example, and in areas documented to historically have high bear use, and in areas most frequented by people.
To assure the declining trend in DLP kills continues, consistent monitoring of seasonal bear distributions, changing sea ice conditions, and human visitations must continue. The most important future action is systematic collection of data on all bear-human interactions— non-fatal interactions included. The where and when, and circumstances including sea ice conditions, surrounding all polar bear human interactions must be recorded if we are to understand the relationship between human presence and polar bear DLP deaths. There is quite likely many unknown variables that could have influenced encounters and kills than the ones we have described in this study, however, sorting out these would require systematic collection of substantially more information related to each event.
Special efforts to protect bears in areas where our study showed DLP kills have been most frequent should be considered.
There is undoubtedly a link between the patterns of sea ice decline from areas near Svalbard and the numbers of bears people are likely to see on land (Hamilton et al., 2017; Stempniewicz et al., 2021). But, quantifiable links between ice decline and polar bear demographics have remained elusive (Regehr et al., 2010; Bromaghin et al., 2015; Regehr et al., 2016). Our study makes it clear that such links between encounters and sea ice changes will not be discovered by kill data alone. To give us a more complete understanding of the influence of sea ice changes as well as distribution of bears and humans, systematic data collection of all bear human interactions are recommended.
Data availability statement
Publicly available datasets were analyzed in this study. This data can be found here: 1. Killed bears: Governor of Svalbard, 9170 Longyearbyen, Norway 2. Sea ice: National Snow and Ice Data Center, University of Colorado, Boulder, CO 80309-0449 USA (nsidc.org) 3. Visitors to Svalbard: Visit Svalbard statistics (https://en.visitsvalbard.com/visitor-information/Visit-Svalbard-Insights/svalbard-statistics).
Author contributions
DV conceived the original idea of the study, collected the data, and wrote the first draft. DV, SA and TM developed the design of the study. All authors contributed to statistical analyses, manuscript revision, read, and approved the submitted version.
Funding
The Norwegian Polar Institute and the Svalbard Environmental Fund funded salaries, office expenses, travel and housing expenses for international travel. Polar Bears International, World Wildlife Fund, and San Diego Zoo funded statistical analyses.
Acknowledgments
Thanks to James Wilder and Margrete Keyser for their help in validating records of problem bears, and to Harvey Goodwin and Max König at the Norwegian Polar Institute for producing shapefiles for ice rings and sectors, and for calculating monthly averages of sea ice concentrations.
Conflict of interest
Author TM was employed by the company McDonald Data Sciences and author JM by the company Western Ecosystems Technology, Inc.
The remaining authors declare that the research was conducted in the absence of any commercial or financial relationships that could be construed as a potential conflict of interest.
The authors declare that this study received funding from Polar Bears International, World Wildlife Fund and San Diego Zoo. These funders were not involved in the study design, collection, analysis, interpretation of data, the writing of this article or the decision to submit it for publication.
Publisher’s note
All claims expressed in this article are solely those of the authors and do not necessarily represent those of their affiliated organizations, or those of the publisher, the editors and the reviewers. Any product that may be evaluated in this article, or claim that may be made by its manufacturer, is not guaranteed or endorsed by the publisher.
Supplementary material
The Supplementary Material for this article can be found online at: https://www.frontiersin.org/articles/10.3389/fcosc.2023.1187527/full#supplementary-material
References
Aars J., Marques T., Lone K., Andersen M., Wiig Ø., Fløystad I. M. B., et al. (2017). The number and distribution of polar bears in the western Barents Sea. Polar Res. 36, 1374125. doi: 10.1080/17518369.2017.1374125
Abrahms B., Carter N. H., Clark-Wolf T. J., Gaynor K. M., Johansson E., McInturff A., et al. (2023). Climate change as a global amplifier of human–wildlife conflict. Nat. Climate Change. 13, 224–234. doi: 10.1038/s41558-023-01608-5
Allison P. D. (1999). Logistic Regression Using SAS: Theory and Application (Cary, North Carolina, USA: SAS Institute & Wiley).
Amstrup S. C., DeWeaver E. T., Douglas D. C., Marcot B. G., Durner G. M., Bitz C. M., et al. (2010). Greenhouse gas mitigation can reduce sea-ice loss and increase polar bear persistence. Nature 468 (7326), 955–958. doi: 10.1038/nature09653
Amstrup S. C., Marcot B. G., Douglas D. C. (2008). “"A Bayesian network modeling approach to forecasting the 21st century worldwide status of polar bears,",” in Arctic Sea Ice Decline: Observations, Projections, Mechanisms, and Implications. Eds. DeWeaver E. T. B., Bitz C. M., Tremblay ,. L.-B. (Washington DC: American Geophysical Union), 213–268.
Anderson D. R., Burnham K. P. (2011). Model Selection and Multi-Model Inference: A Practical Information - Theoretic Approach (New York: Springer Verlag).
Atwood T. C., Peacock E., McKinney M. A., Lillie K., Wilson R., Douglas D. C., et al. (2016). Rapid environmental change drives increased land use by an arctic marine predator. PloS One 11 (6), 1–18. doi: 10.1371/journal.pone.0155932
Atwood T. C., Simac K., Breck S. W., York G., Wilder J. (2017). “Human-polar bear interactions in a changing Arctic: existing and emerging concerns,” in Marine mammal welfare: Human induced change in the marine environment and its impacts on marine mammal welfare, ed. Butterworth A.. Springer International Publishing, pp. 397–418.
Atwood T. C., Wilder J. M. (2021). “Human-polar bear interactions,” in Ethology and Behavioral Ecology of Sea Otters and Polar Bears. Eds. Davis R. W., Pagano A. M. (Cham: Springer International Publishing), 325–353.
Bromaghin J. F., McDonald T. L., Stirling I., Derocher A. E., Richardson E. S., Regehr E. V., et al. (2015). Polar bear population dynamics in the southern Beaufort Sea during a period of sea ice decline. Ecol. Appl. 25 (3), 634–651. doi: 10.1890/14-1129.1
Bystrowska M. (2019). The impact of sea ice on cruise tourism on Svalbard. Arctic 72 (2), 151–165. doi: 10.14430/arctic68320
Can O. E., D'Cruze N., Garshelis D. L., Beecham J., Macdonald D. W. (2014). Resolving human-bear conflict: a global survey of countries, experts and key factors. Conserv. Lett. 7 (6), 501–513. doi: 10.1111/conl.12117
Cooper A. B., Millspaugh J. J. (1999). The application of discrete choice models to wildlife resource selection studies. Ecology 80 (2), 566–575. doi: 10.1890/0012-9658(1999)080[0566:Taodcm]2.0.Co;2
Dahlke S., Hughes N. E., Wagner P. M., Gerland S., Wawrzyniak T., Ivanov B., et al. (2020). The observed recent surface air temperature development across Svalbard and concurring footprints in local sea ice cover. Int. J. Climatol. 40 (12), 5246–5265. doi: 10.1002/joc.6517
Derocher A. E., Andersen M., Wiig Ø., Aars J., Hansen E., Biuw M. (2011). Sea ice and polar bear den ecology at hopen island, Svalbard. Mar. Ecol. Prog. Ser. 441, 273–297. doi: 10.3354/meps09406
Divine D. V., Dick C. (2006). Historical variability of sea ice edge position in the Nordic Seas. J. Geophysical Res.: Oceans 111 (C1), 1–14. doi: 10.1029/2004JC002851
Durner G. M., Douglas D. C., Nielson R. M., Amstrup S. C., McDonald T. L., Stirling I., et al. (2009). Predicting 21st century polar bear habitat distribution from global circulation models. Ecol. Monogr. 79, 25–58. doi: 10.1890/07-2089.1
Durner G. M., Whiteman J. P., Harlow H. J., Amstrup S. C., Regehr E. V., Ben-David M. (2011). Consequences of long-distance swimming and travel over deep-water pack ice for a Female Polar Bear during a year of extreme sea ice retreat. Polar Biol. 34 (7), 975–984. doi: 10.1007/s00300-010-0953-2
Gjertz I., Aarvik S., Hindrum R. (1993). Polar bears killed in Svalbard 1987-1992. Polar Res. 12 (2), 107–109. doi: 10.1111/j.1751-8369.1993.tb00425.x
Hamilton C. D., Kovacs K. M., Ims R. A., Aars J., Strøm H., Lydersen C. (2017). Spatial overlap among an arctic predator, prey and scavenger in the marginal ice zone. Mar. Ecol. Prog. Ser. 573, 45–59. doi: 10.3354/meps12184
Hopkins J. B., Herrero S., Shideler R. T., Gunther K. A., Schwartz C. C., Kalinowski S. T. (2010). A proposed lexicon of terms and concepts for human-bear management in North America. Ursus 21 (2), 154–168. doi: 10.2192/URSUS-D-10-00005.1
Laidre K. L., Stern H., Born E. W., Heagerty P., Atkinson S., Wiig Ø., et al. (2018). Changes in winter and spring resource selection by polar bears Ursus maritimus in Baffin Bay over two decades of sea-ice loss. Endangered Species Res. 36, 1–14. doi: 10.3354/esr00886
Laidre K. L., Stern H., Kovacs K. M., Lowry L., Moore S. E., Regehr E. V., et al. (2015). Arctic marine mammal population status, sea ice habitat loss, and conservation recommendations for the 21st century. Conserv. Biol. 29 (3), 724–737. doi: 10.1111/cobi.12474
Larsen T. (1986). Population biology of the polar bear (Ursus maritimus) in the Svalbard area (Norway). Norsk Polarinstitutt. Skrifter 184), 1–55.
Larsen J. N., Fondahl G. (2015). Arctic Human Development Report : Regional Processes and Global Linkages (Copenhagen: Nordisk Ministerråd).
Lone K., Merkel B., Lydersen C., Kovacs K. M., Aars J. (2018). Sea ice resource selection models for polar bears in the Barents Sea subpopulation. Ecography 41 (4), 567–578. doi: 10.1111/ecog.03020
Lunn N. J., Servanty S., Regehr E. V., Converse S. J., Richardson E., Stirling I. (2016). Demography of an apex predator at the edge of its range: impacts of changing sea ice on polar bears in Hudson Bay. Ecol. Appl. 26 (5), 1302–1320. doi: 10.1890/15-1256
Manly B. F. J., McDonald L. L., Thomas D. L., McDonald T. L., Erickson W. P. (2002). Resource selection by animals: statistical design and analysis for field studies (Kluwer Academic Publishers).
Mauritzen M., Derocher A. E., Wiig O. (2001). Space-use strategies of female polar bears in a dynamic sea ice habitat. Can. J. Zool. 79 (9), 1704–1713. doi: 10.1139/z01-126
Mauritzen M., Derocher A. E., Wiig O., Belikov S. E., Boltunov A. N., Hansen E., et al. (2002). Using satellite telemetry to define spatial population structure in polar bears in the Norwegian and western Russian Arctic. J. Appl. Ecol. 39 (1), 79–90. doi: 10.1046/j.1365-2664.2002.00690.x
McCullagh P., Nelder J. A. (1989). Generalized Linear Models. 2nd edition (Location London & New York: Chapman & Hall).
McDonald T. L., Manly B. F. J., Nielson R. M., Diller L. V. (2006). Discrete-choice modeling in wildlife studies exemplified by northern spotted owl nighttime habitat selection. J. Wildlife Manage. 70 (2), 375–383. doi: 10.2193/0022-541X(2006)70[375:DMIWSE]2.0.CO;2
Meier W. N., Stroeve J. (2022). An updated assessment of the changing Arctic Sea ice cover. Oceanography 35 (3-4), 10–19. doi: 10.5670/oceanog.2022.114
Molnár P. K., Bitz C. M., Holland M. M., Kay J. E., Penk S. R., Amstrup S. C. (2020). Fasting season length sets temporal limits for global polar bear persistence. Nat. Climate Change 10, 732–738. doi: 10.1038/s41558-020-0818-9
Monnett C., Gleason J. S. (2006). Observations of mortality associated with extended open-water swimming by polar bears in the Alaskan Beaufort Sea. Polar Biol. 29, 681–687. doi: 10.1007/s00300-005-0105-2
National Snow and Ice Data Center (2019). Data on average monthly Arctic sea ice extent, February 1979-2019. Available at: https://nsidc.org.
Norwegian Ministry of Climate and Environment (2001). Svalbard Environmental Protection Act. Available at: https://lovdata.no (in Norwegian).
Norwegian Polar Institute (2014). Topographic map data, map scale 1:100,000 (S100). doi: 10.21334/npolar.2014.645336c7
Norwegian Polar Institute (2022) Monitoring system for Svalbard and Jan Mayen. Available at: https://www.mosj.no/en/ (Accessed April 25 2022).
Obbard M. E., Stapleton S., Szor G., Middel K. R., Jutras C., Dyck M. (2018). Re-assessing abundance of Southern Hudson Bay polar bears by aerial survey: effects of climate change at the southern edge of the range. Arctic Sci. 4 (4), 634–655. doi: 10.1139/as-2018-0004
Pagano A. M., Durner G. M., Amstrup S. C., Simac K. S., York G. S. (2012). Long-distance swimming by polar bears (Ursus maritimus) of the southern beaufort sea during years of extensive open water. Can. J. Zool. 90, 663–676. doi: 10.1139/z2012-033
Pagano A. M., Durner G. M., Rode K. D., Atwood T. C., Atkinson S. N., Peacock E., et al. (2018). High-energy, high-fat lifestyle challenges an Arctic apex predator, the polar bear. Science 359 (6375), 568–56+. doi: 10.1126/science.aan8677
Polar Bear Range States (2009) Meeting of the parties to the 1973 Agreement on the conservation of polar bears, Tromsø, Norway, 17-19 Marc. Available at: https://polarbearagreement.org/resources/meeting-documents/meeting-of-the-parties-to-the-1973-agreement-on-the-conservation-of-polar-bears.
Polar Bear Range States (2015). “Circumpolar action plan: conservation strategy for the polar bear”. Available at: https://polarbearagreement.org/resources/circumpolar-action-plan.
R Core Team (2022). R: A Language and Environment for Statistical Computing (Vienna, Austria: R Foundation for Statistical Computing). Available at: http://www.R-Project.Org.
Regehr E. V., Hunter C. M., Caswell H., Amstrup S. C., Stirling I. (2010). Survival and breeding of polar bears in the southern Beaufort Sea in relation to sea ice. J. Anim. Ecol. 79 (1), 117–127. doi: 10.1111/j.1365-2656.2009.01603.x
Regehr E. V., Laidre K. L., Akçakaya H. R., Amstrup S. C., Atwood T. C., Lunn N. J., et al. (2016). Conservation status of polar bears (Ursus maritimus) in relation to projected sea-ice declines. Biol. Lett. 12 (12), 1–5. doi: 10.1098/rsbl.2016.0556
Regehr E. V., Lunn N. J., Amstrup S. C., Stirling L. (2007). Effects of earlier sea ice breakup on survival and population size of polar bears in western Hudson bay. J. Wildlife Manage. 71 (8), 2673–2683. doi: 10.2193/2006-180
Rode K. D., Douglas D. C., Atwood T. C., Durner G. M., Wilson R. R., Pagano A. M. (2022). Observed and forecasted changes in land use by polar bears in the Beaufort and Chukchi Seas 1985–2040. Global Ecol. Conserv. 40, e02319. doi: 10.1016/j.gecco.2022.e02319
Rode K. D., Robbins C. T., Nelson L., Amstrup S. C. (2015a). Can polar bears use terrestrial foods to offset lost ice-based hunting opportunities? Front. Ecol. Environ. 13 (3), 138–145. doi: 10.1890/140202
Rode K. D., Wilson R. R., Regehr E. V., St. Martin M., Douglas D. C., Olson J. (2015b). Increased land use by chukchi sea polar bears in relation to changing sea ice conditions. PloS One 10 (11), e0142213. doi: 10.1371/journal.pone.0142213
Schipper J., Chanson J. S., Chiozza F., Cox N. A., Hoffmann M., Katariya V., et al. (2008). The status of the world's land and marine mammals: diversity, threat, and knowledge. Science 322 (5899), 225–230. doi: 10.1126/science.1165115
Stempniewicz L., Kulaszewicz I., Aars J. (2021). Yes, they can: polar bears Ursus maritimus successfully hunt Svalbard reindeer Rangifer tarandus platyrhynchus. Polar Biol. 44, 2199–2206. doi: 10.1007/s00300-021-02954-w
Stern H. L., Laidre K. L. (2016). Sea-ice indicators of polar bear habitat. Cryosphere 10 (5), 2027–2041. doi: 10.5194/tc-10-2027-2016
Stirling I. (1974). Midsummer observations on the behavior of wild polar bears (Ursus maritimus). Can. J. Zool. 52 (9), 1191–1198. doi: 10.1139/z74-157
Stirling I., Derocher A. E. (2012). Effects of climate warming on polar bears: a review of the evidence. Global Change Biol. 18 (9), 2694–2706. doi: 10.1111/j.1365-2486.2012.02753.x
Stirling I., Lunn N. J., Iacozza J. (1999). Long-term trends in the population ecology of polar bears in Western Hudson Bay in relation to climate change. Arctic 52 (3), 294–306.
Stroeve J., Markus T., Boisvert L., Miller J., Barrett A. (2014). Changes in arctic melt season and implications for sea ice loss. Geophysical Res. Lett. 41 (4), 1216–1225. doi: 10.1002/2013GL058951
Therneau T. M. (2017) "A package for survival analysis in S, version 2.40. Available at: https://CRAN.R-project.org/package=survival.
Therneau T. M., Grambsch P. M. (2000). Modeling survival data: extending the Cox model (New York: Springer).
Towns L. (2006). Spatial and Temporal Patterns of Polar Bear (Ursus maritimus) Distribution in Western Hudson Bay During the Ice-Free Period (Edmonton, Canada: M.Sc.;M.Sc., University of Alberta).
Towns L., Derocher A. E., Stirling I., Lunn N. J., Hedman D. (2009). Spatial and temporal patterns of problem polar bears in churchill, manitoba. Polar Biol. 32, 1529–1537. doi: 10.1007/s00300-009-0653-y
Keywords: human-wildlife conflict, polar bear, Svalbard (Arctic), sea ice, wildlife management, Arctic tourism
Citation: Vongraven D, Amstrup SC, McDonald TL, Mitchell J and Yoccoz NG (2023) Relating polar bears killed, human presence, and ice conditions in Svalbard 1987–2019. Front. Conserv. Sci. 4:1187527. doi: 10.3389/fcosc.2023.1187527
Received: 16 March 2023; Accepted: 03 July 2023;
Published: 28 July 2023.
Edited by:
Hiroshi Tsunoda, Center for Environmental Science, JapanReviewed by:
Todd Atwood, U.S. Geological Survey, United StatesEvan Richardson, Wildlife Research and Landscape Science, Environment and Climate Change Canada (ECCC), Canada
Copyright © 2023 Vongraven, Amstrup, McDonald, Mitchell and Yoccoz. This is an open-access article distributed under the terms of the Creative Commons Attribution License (CC BY). The use, distribution or reproduction in other forums is permitted, provided the original author(s) and the copyright owner(s) are credited and that the original publication in this journal is cited, in accordance with accepted academic practice. No use, distribution or reproduction is permitted which does not comply with these terms.
*Correspondence: D. Vongraven, dm9uZ3JhdmVuQG5wb2xhci5ubw==