 Johanna Staerk1,2,3,4*
 Fernando Colchero1,2,4,5Melissa A. Kenney6Kerrie A. Wilson7Wendy B. Foden8Jamie A. Carr8,9Zjef Pereboom10,11Lucie Bland2,12Nate Flesness2Tara Martin13
 Luigi Maiorano14
 Julia E. Fa15Hugh P. Possingham16Dalia A. Conde2,3,4*
- 1Department of Primate Behavior and Evolution, Max Planck Institute for Evolutionary Anthropology, Leipzig, Germany
- 2Species360 Conservation Science Alliance, Bloomington, MN, United States
- 3Department of Biology, University of Southern Denmark, Odense, Denmark
- 4Interdisciplinary Centre on Population Dynamics, University of Southern Denmark, Odense, Denmark
- 5Department of Mathematics and Computer Science, University of Southern Denmark, Odense, Denmark
- 6Institute on the Environment, University of Minnesota, St. Paul, MN, United States
- 7Institute for Future Environments, Queensland University of Technology, Brisbane, QLD, Australia
- 8Leverhulme Centre for Anthropocene Biodiversity, University of York, York, United Kingdom
- 9Department of Environment and Geography, University of York, York, United Kingdom
- 10Centre for Research and Conservation, Royal Zoological Society of Antwerp, Antwerp, Belgium
- 11Evolutionary Ecology Group, Antwerp University, Antwerp, Belgium
- 12Eureka Publishing, Thornbury, VIC, Australia
- 13Department of Forest & Conservation Sciences, University of British Columbia, Vancouver, BC, Canada
- 14Department of Biology and Biotechnologies “Charles Darwin”, University of Rome “La Sapienza”, Rome, Italy
- 15Division of Biology and Conservation Ecology, School of Science and the Environment, Manchester Metropolitan University, Manchester, United Kingdom
- 16Australian Research Council Centre of Excellence for Environmental Decisions, The University of Queensland, Brisbane, QLD, Australia
Zoos and aquaria in the European Union (EU) can play a crucial role in the conservation of EU species, as they currently hold nearly half (49%) of EU terrestrial vertebrates. In this study, we analyzed the species composition and population sizes of EU zoos and developed a framework to prioritize recommendations for additional ex-situ and in-situ interventions for 277 at-risk EU species. Our results showed that EU zoos currently hold 39% of threatened EU species, 27% of EU endemic species, 62% of EU species vulnerable to climate change, 20% of EU species listed by the Alliance for Zero Extinction (AZE), 25% of Evolutionary Distinct and Globally Endangered (EDGE) EU species, while only 5% are subject to ex-situ conservation. Using our framework, we found that additional captive breeding was recommended for 60-61%% of species while expanding protected areas was recommended for only 2–22%, as 217 out of 277 species already met habitat protection targets. Both interventions were recommended for up to 20% of species, while the remaining 18% required no interventions because captive populations and habitat protection fully met targets. Our flexible framework can support more effective integrated conservation planning decisions for EU species and help identify target species for further in-depth assessment by the IUCN Ex-situ guidelines.
1 Introduction
Despite concerted efforts to conserve biodiversity, 14% of mammals, 18% of birds, 21% of reptiles, and 22% of amphibians in the European Union (EU) are at risk of extinction (Temple and Terry, 2007; Cox and Temple, 2009; Temple and Cox, 2009; BirdLife International, 2021) due to habitat loss and fragmentation, pollution, over-exploitation, invasive species, and climate change (European Commission, 2020). Although initiatives like the EU Biodiversity Strategy 2030 (European Commission, 2020) aim to halt habitat loss and species decline by expanding and restoring the EU network of protected areas through Natura 2000 sites (Council Directive 92/43/EEC, 1992; Directive 2009/147/EC, 2009), it is apparent that much work remains to be done. While the legal protection of habitats has shown promise in increasing population trends for some bird and mammal species (Littlewood et al., 2020; Williams et al., 2020), many habitats are still insufficiently protected (Maiorano et al., 2015), and some are continuing to deteriorate (European Commission, 2015).
To ensure the long-term survival of terrestrial vertebrates in the EU (EU species, hereafter), habitat protection alone may not be sufficient for some species. An integrated conservation approach that includes ex-situ programs is required to supplement habitat protection efforts. Ex-situ conservation measures can be crucial for ensuring species survival until threats are mitigated in the wild (IUCN/SSC, 2014). According to Bolam et al. (2021) ex-situ conservation has contributed to preventing the extinction of at least 20 out of 32 bird species and 9 out of 16 mammal species that might otherwise have faced extinction between 1993-2020. Therefore, it is essential to prioritize species that require ex-situ conservation and assess the potential role of zoos and aquariums in supporting these programs. Conservation organizations, such as the International Union for Conservation of Nature (IUCN), include ex-situ action recommendations in their assessments for the Red List of Threatened Species. The IUCN Conservation Planning Specialist Group proposes the integration of all populations of a species, including ex-situ animals, into a single management plan, as outlined in their One Plan Approach (Byers et al., 2013). This approach involves protecting populations in natural habitats and implementing ex-situ measures such as captive breeding, assisted colonization, and genetic rescue programs.
European zoos and aquariums are invaluable resources in the field of conservation, providing a wealth of expertise in captive breeding, animal husbandry, veterinary care, and reintroduction programs. The EU Zoos Directive recognizes the critical role that these institutions play in conservation efforts and encourages alignment with existing policies, such as the EU Birds and Habitats Directives (Sikkema et al., 2015). The European Association of Zoos and Aquaria (EAZA) supports the integration of multiple directives to promote conservation efforts (EAZA, 2017). To support the strategic assessment of species in need of ex-situ conservation, the IUCN Species Survival Commission developed Guidelines on the Use of Ex situ Management for Species Conservation (IUCN Ex-situ guidelines, hereafter; IUCN/SSC, 2014). These guidelines provide a framework for informed decision-making for ex-situ management based on five key steps: 1) review of species status and threats, 2) evaluation of the role of ex-situ interventions for species conservation, 3) assessment of biological factors and practical considerations, 4) appraisal of feasibility, risks and resources, and 5) transparent decision-making. Although the Ex-situ guidelines are applied to regional or global collection planning in CPSG’s Integrated Collection Assessment and Planning (ICAP) workshops, assessing all 847 terrestrial vertebrates in the EU would require significant resources. Therefore, the development of quantitative tools to assist conservation planners in moving more efficiently from assessment to planning would greatly benefit ex-situ conservation efforts. Efficient conservation planning relies on prioritization approaches that explicitly consider probabilities of success, risks, and costs involved. Numerous studies have demonstrated the effectiveness of these approaches, for example, in the context of conserving Australian biodiversity (Evans et al., 2015) and managing threatened species in New Zealand (Joseph et al., 2009). In addition, such approaches offer a valuable mathematical framework that could support experts in prioritizing species for the assessment against the IUCN Ex-situ guidelines.
This study has two primary objectives. Firstly, it aims to provide a baseline assessment of the current and potential contribution of EU zoos toward ex-situ management and species conservation at large. Secondly, it aims to develop a comprehensive framework to prioritize EU threatened species for the in-depth implementation of IUCN Ex-situ guidelines. To achieve this, we propose a robust multiple objective prioritization framework that incorporates various factors into a decision tree. These include the species’ extinction risk probabilities in-situ and ex-situ, evolutionary distinctiveness, and estimated costs of captive management and habitat protection. This framework allows deriving decisions with and without budget constraints, incorporating estimated costs. We conducted extensive sensitivity analyses to evaluate the impacts of model assumptions and decision-makers’ value judgments on the prioritization outcomes.
By adopting this proposed framework, our study aims to identify species for in-depth assessment that warrant further evaluation in accordance with the IUCN ex-situ guidelines. This framework will provide valuable support to EAZA Taxon Advisory Groups, Regional Collection Planners, EU policymakers, and conservation practitioners, facilitating the rigorous application of prioritization strategies for species conservation management.
2 Materials and methods
2.1 Datasets
To underpin our analyses, we collated several datasets related to EU species conservation both within zoos (ex-situ) and in the wild (in-situ). We initially considered 847 EU terrestrial vertebrates (i.e., mammals, birds, reptiles, and amphibians), defined as species regionally assessed within the EU based on the European IUCN Red List of Threatened Species, excluding those categorized as ‘Not Evaluated’, ‘Extinct’ or ‘Possibly Extict’ (Temple and Terry, 2007; Cox and Temple, 2009; Temple and Cox, 2009; BirdLife International, 2021). We limited our analysis to terrestrial vertebrates due to the lack of data on habitat protection, vulnerability to climate change, and evolutionary distinctiveness for aquatic, invertebrate, and plant taxa.
To assess the contribution of zoos to EU species conservation, we quantified the population sizes of the 847 EU species housed in zoos and aquariums in the European Union using the Species360 Zoological Information Management System (ZIMS; Species360, 2021). ZIMS is the most comprehensive animal care real-time database in which >1,200 aquariums and zoos share standardized data on 22,000 species across 96 countries. Our analysis focused on data from 481 Species360 member institutions located within EU countries (EU zoos hereafter). These institutions, including all zoos and aquariums accredited by the EAZA, use ZIMS for their record-keeping purposes.
To compare population sizes between threatened and non-threatened species in EU zoos, we used a quasi-Poisson regression model that accounts for overdispersion, with log-link (Equation 1):
where for all I = 1, 2,…, n, where n is the total number of species. Here Ni represents the population size, calculated as the sum of all individuals across EU zoos, and Hi corresponds to the taxonomic class (i.e., mammals, birds, reptiles, or amphibians) of each species i. Ti serves as an indicator denoting whether species i is categorized as threatened according to the EU Red List, i.e. listed as Vulnerable (VU), Endangered (EN) or Critically Endangered (CR), or as non-threatened.
To determine the representation of EU species in ex-situ management programs we established the following criteria: i) inclusion in an EAZA Ex-situ Programme (EEP) or a European Studbooks (ESB) program; ii) presence in the amphibian ex-situ monitoring from the Amphibian Ark (Amphibian Ark, 2019); or iii) inclusion in other ex-situ programs documented on the IUCN Red List. Note that EEPs are the most intensively managed breeding programs, and ESBs are typically for species of lower conservation priority (EAZA, 2019).
We cross-referenced our list of EU species held in zoos with different prioritization assessments: i) the Alliance for Zero Extinction database, which identifies species listed as CR or EN and confined to a single remaining site (Alliance for Zero Extinction (AZE), 2010); ii) the Evolutionary Distinct and Globally Endangered list, which identifies species that are both phylogenetically unique and globally endangered based on the IUCN Red List (EDGE, Gumbs et al., 2018); iii) species endemism within Europe and the EU (Temple and Terry, 2007; Cox and Temple, 2009; Temple and Cox, 2009; IUCN, 2019; BirdLife International, 2021), and iv) species categorized as vulnerable under the IUCN Climate Change Vulnerability Assessment (Carr, 2011; Foden et al., 2013). The latter assessment utilizes trait-based analysis, considering species’ exposure, sensitivity, and adaptability to climatic changes. It is available for all classes except mammals, and species are categorized with either ‘High’ or ‘Low’ vulnerability. For few species with missing data on evolutionary distinctiveness or climate change vulnerability, we used data of closely related species.
Next, we applied our prioritization framework (see section 2.2.) to a subset of 277 at-risk species out of the initial 847 EU species. We defined at-risk species as those considered threatened by the EU Red List (CR, EN, or VU) or identified as highly vulnerable to climate change, even if listed as Least Concern (LC) or Near Threatened (NT). We included climate change vulnerable species because the IUCN Red List criteria may not fully capture all future risks associated with climate change (Akçakaya et al., 2006 but see Keith et al., 2014). Moreover, ex-situ conservation interventions may be particularly valuable for species threatened by climate change (Shoo et al., 2013). Given the critical role of endemic species in conservation efforts, we further expanded our scope to include Near Threatened species endemic to Europe, provided that the species geographic range was at least partially within the EU. Our analyses were limited to species with available estimates of habitat availability and coverage by protected areas (Maiorano et al., 2015), which led to the exclusion of 33 species (excluded species are indicated in the Supplemental Material).
To integrate the datasets, we standardized species nomenclature according to the Global Biodiversity Information Facility (GBIF Secretariat, 2019) using the taxize package in R (Chamberlain and Szöcs, 2013). In a few cases where names could not be found (e.g., because species were only recently described), we used the Red List taxonomy. All calculations and analyses for this study were performed in R version 3.6.1 (R Core Team, 2017). The combined and standardized dataset is available in the Supplemental Material.
2.2 Prioritization framework
We developed a project prioritization framework based on Joseph et al. (2009) with multiple objectives: minimizing extinction risk, maximizing contributions to evolutionary diversity, and minimizing conservation management costs for the largest possible number of EU threatened species over a 100-year timeframe. First, we constructed a decision tree to determine, whether each species i should undergo conservation intervention j based on the net expected benefit (Bij)associated with that intervention. We then calculated the cost-effectiveness of each intervention by calculating the ratio of potential benefits to costs (Cij). To evaluate the relative importance of species conservation projects we incorporated benefits, costs, and species contributions to evolutionary distinctiveness into a ranking criterion (Ri) for each species. This ranking criterion is based on the Noah’s Ark framework (Metrick and Weitzman, 1998) and given by the equation:
where, for each species i, the maximum cost-effectiveness between the different management interventions j was weighted by the species evolutionary distinctiveness, Di, obtained from Gumbs et al. (2018). To ensure comparability, we ranked each taxonomic class separately because not all data used to calculate Ri were available for each class. We further scaled the range of Di to match that of the benefits (0–1) by dividing Di values by the maximum Di within each taxonomic class. For two species with missing evolutionary distinctiveness data, we assigned the average Di score of their respective genera.
Given potential variability in decision-makers’ values, we explored four variations of the ranking criterion: (i) based on benefits only (Ri1), (ii) benefits weighted by evolutionary distinctiveness (Ri2), (iii) cost-effectiveness (Ri3), and (iv) weighted cost-effectiveness (Ri4, Equation 2). By including these options, we aimed to capture different perspectives and preferences in the decision-making process.
2.3 Benefits of conservation interventions
For each species, we considered two conservation interventions: invest in habitat protection (W = 1) or no investment (W = 0) and invest in captive breeding (Z = 1) or no investment (Z = 0). These interventions were considered as additional actions assuming that current levels of protection and zoo populations are maintained. Thus, the decision tree (Figure 1) presented four options represented by branches diverging from decision nodes (squares): (i) invest in habitat protection and captive breeding (W = 1, Z = 1), (ii) invest in habitat protection only (W = 1, Z = 0), (iii) invest in captive breeding only (W = 0, Z = 1) or (iv) do nothing (W = 0, Z = 0).
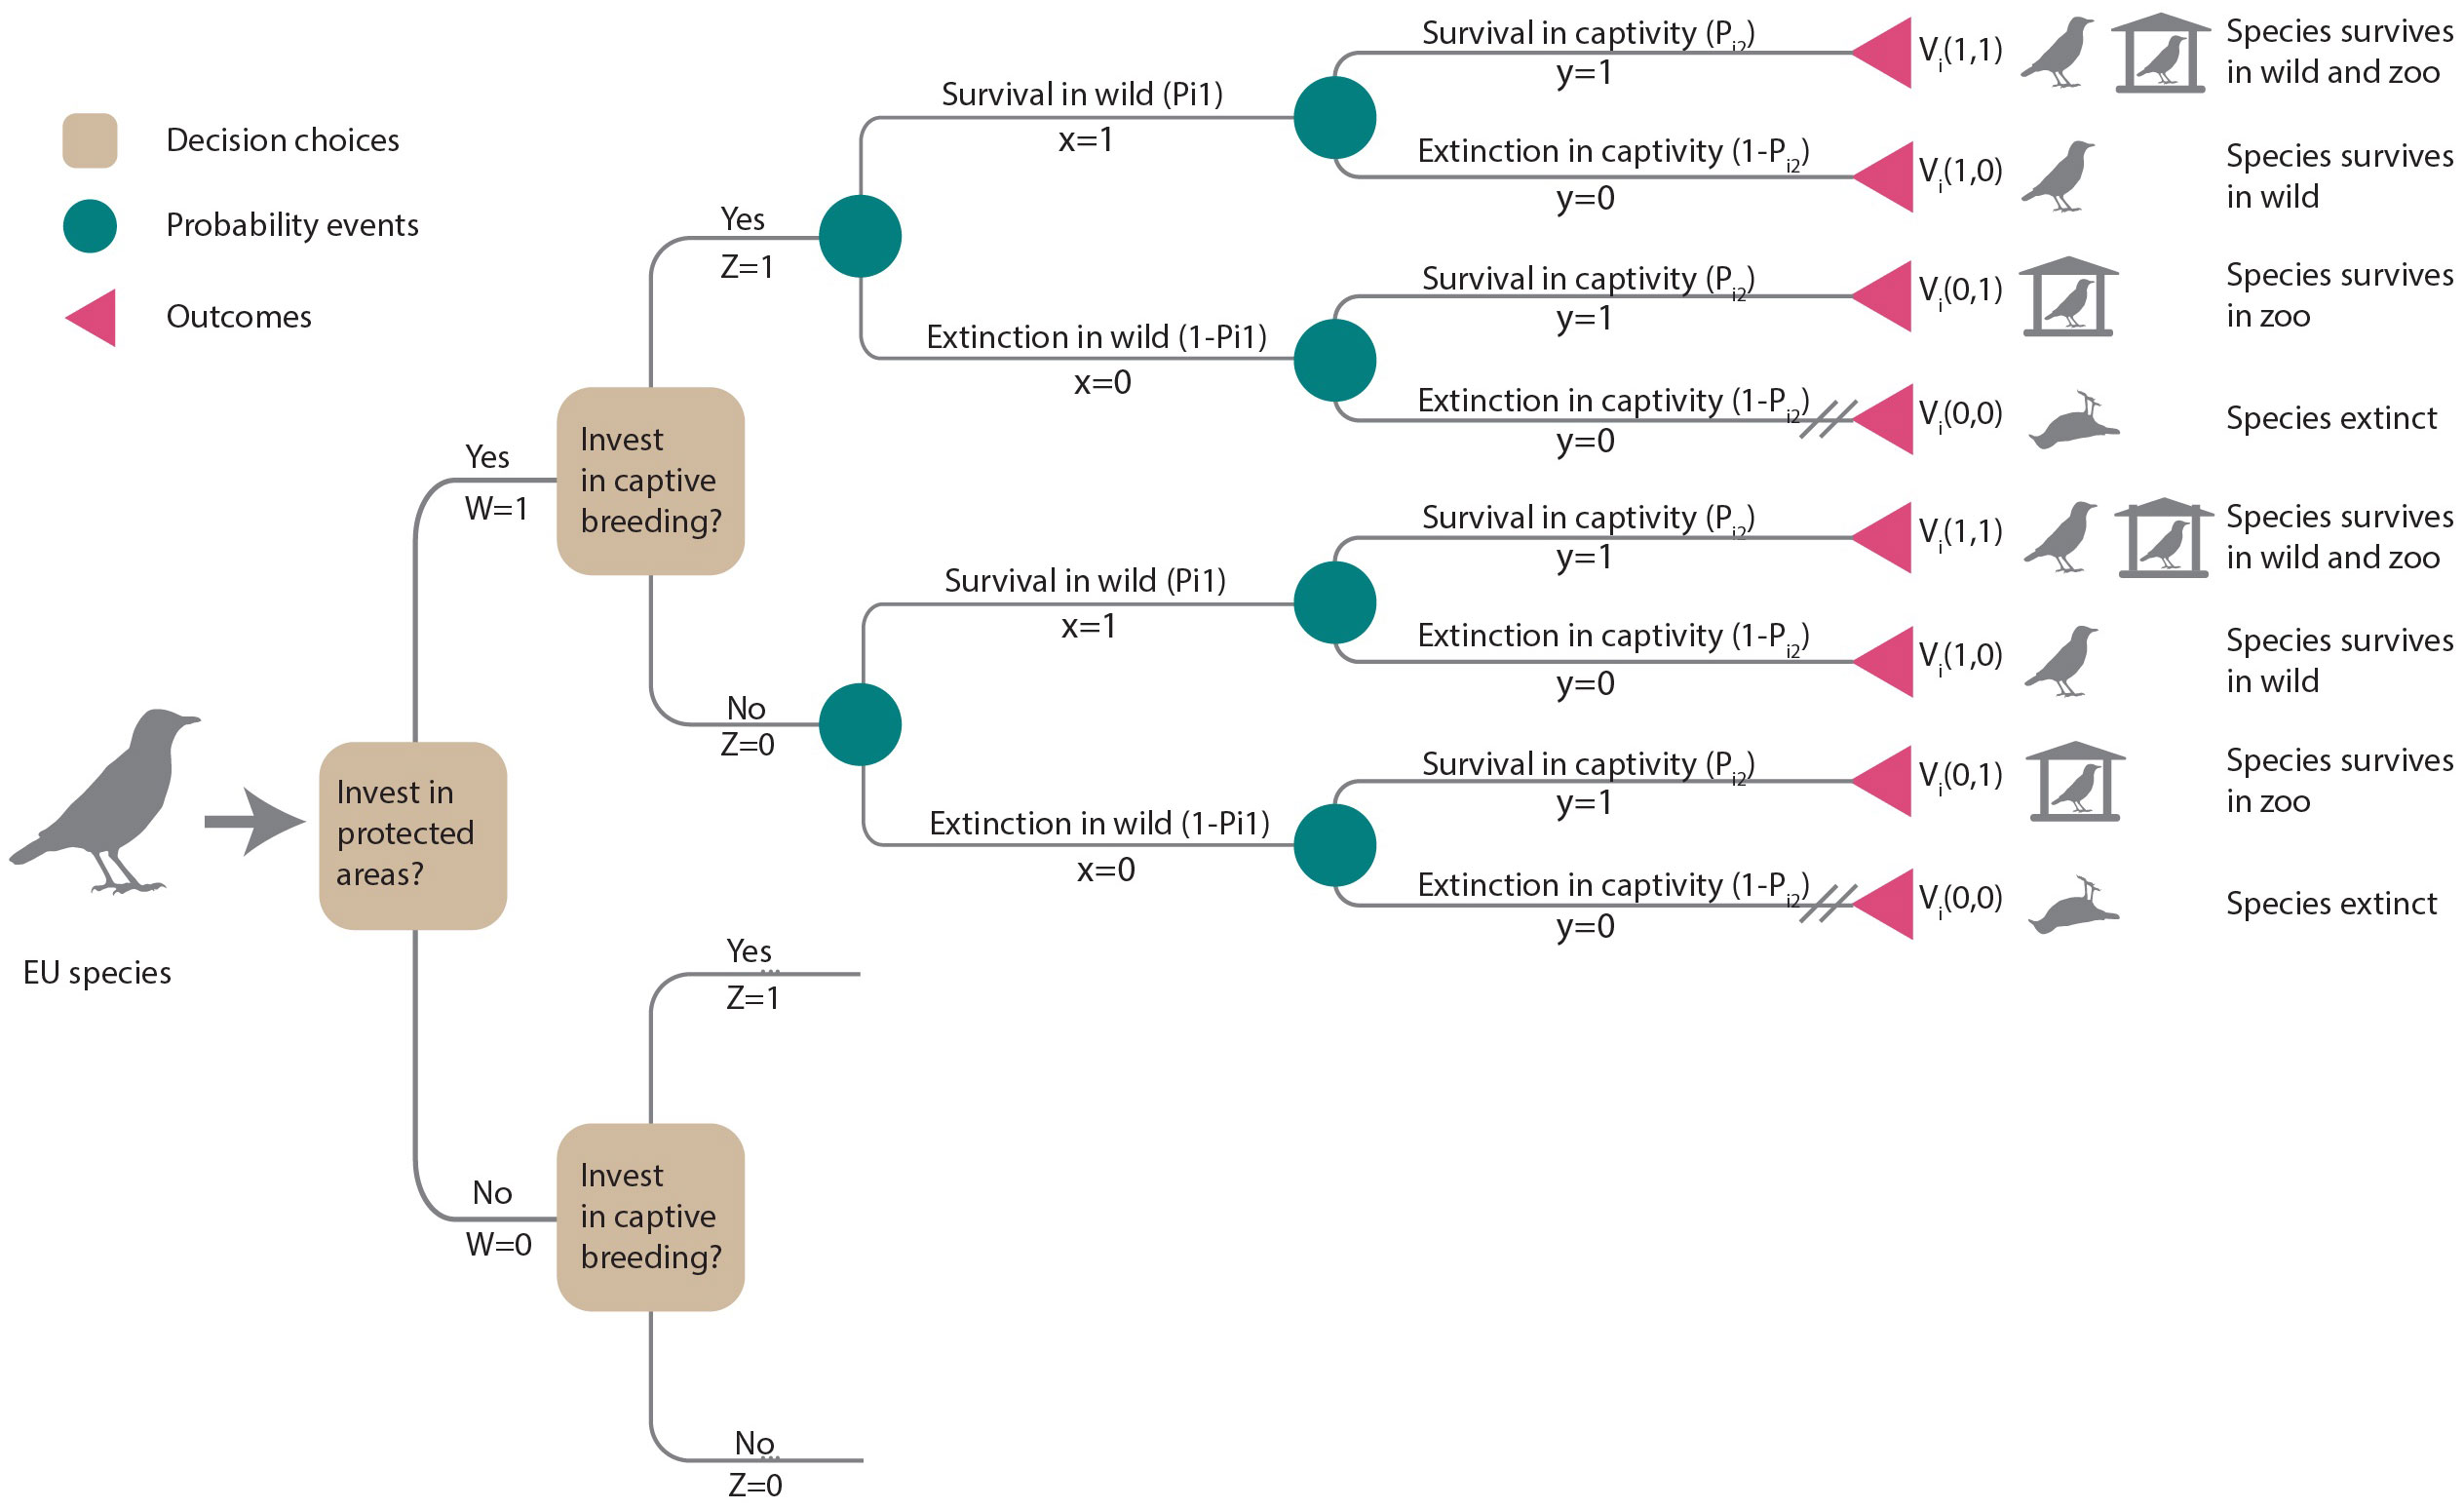
Figure 1 Decision tree illustrating the choices of additional investments in habitat protection (W = 1) or not (W = 0) and captive breeding (Z = 1) or not (Z = 0). Each decision choice (squares) leads to consecutive chance nodes (circles) describing uncertain events that may result in species persistence or extinction in the wild or in captivity, respectively. Outcomes (triangles) terminate each path. Cross-hatching (//) indicates the least preferred outcome (i.e., extinction). Outcomes are weighted by decision-makers’ preferences for that outcome, Vi(x,y). The expected value for each of the four options is the sum of its probabilities weighted by Vi(x,y). Lower branches are the same as upper branches and were not illustrated.
We defined habitat protection as protecting species habitat through the establishment of protected areas (IUCN categories I–VI) or Natura 2000 sites, according to the representation target set by Maiorano et al. (2015) for each species in the EU. These targets were based on a proportion of the species’ range, considering whether the species had a narrow or wide distribution. We defined captive breeding as maintaining a captive insurance population of at least 100 individuals across EU zoos in ZIMS, assumed to sustain 90% of a population’s genetic diversity for 100 years (Soulé et al., 1986; Lees and Wilcken, 2009).
The benefit (Bij) of a conservation intervention is the difference in species’ persistence probability with and without the intervention. To calculate the persistence probability under each intervention scenario, we developed probability models of species persistence and extinction in the wild or in captivity, depicted by the chance nodes (circles) in Figure 1. The species’ persistence probability was determined by the function Pik(.), where index k = 1,2 referred to species persistence in the wild (k = 1) or in captivity (k = 2).
In the wild, we assumed that a species’ persistence probability would vary with its IUCN Red List status and vulnerability to climate change. To calculate this, we transformed these originally categorical variables into probabilities. For the IUCN Red List categories, we adopted probability values based on the IUCN criterion E formulations with projected extinction probabilities to 100 years (LC = 0.0001, NT = 0.01, VU = 0.1, EN = 0.667 and CR = 0.999; Mooers et al., 2008). For species with high vulnerability to climate change, we assigned a fixed extinction probability of 0.3, except for mammals, where these data were unavailable. To explore how climate change-related extinction probabilities influenced our results, we conducted a sensitivity analysis varying the range of values from 0 to 0.5.
In scenarios where no additional investments were made in habitat protection (W = 0), we calculated persistence probability in the wild for species i as in Equation 3:
where Ii represents the extinction probability based on EU Red List categories and Ki represents the extinction probability based on climate change vulnerability, assuming these probabilities were independent.
On the other hand, if additional investments were made in habitat protection (W = 1), persistence probability was calculated as in Equation 4:
where Ai is the proportion of a species’ target area currently under protection (Maiorano et al., 2015). We assumed that the current persistence probability of the species would scale linearly with the proportion of the remaining unprotected target area that we choose to invest in and protect. The smaller the proportion of the target area already protected, the greater the potential increase in persistence probability when investing in habitat, assuming that habitat that is already protected will stay safeguarded over the next 100 years. If this proportion is 1 (i.e., the target is fully met), then the overall persistence probability is the same as if we decide to do nothing Under human care, we assumed that species persistence probability would be influenced by its breeding success (Gil), where index l = 1,2,3,4 refers to captive breeding expertise. Based on Conde et al. (2015), we assumed that if a species or congeneric species is present within zoos, management expertise would be available for that species. We categorized levels of management expertise as follows: Gi1: No expertise exists and neither species i nor a congeneric species are kept in a zoo, Gi2: transferrable expertise exists, a congeneric species is kept in a zoo, implying some level of knowledge transfer and shared management practices, Gi3: expertise exists but may be difficult to access because the species is kept in a zoo outside the EU, and Gi4: the species is kept in EU zoos, implying that management expertise is available.
Based on the level of management expertise, we calculated persistence probability in captivity for species i and management expertise level l as in Equation 5:
For case Gi4 (expertise within EU zoos), we assumed that persistence probability should increase as a function of the ratio Qi (i.e., the proportion of individuals available with respect to viable population size), given by Equation 6:
where N0i is the number of individuals in EU zoos and Nvi is the number of individuals to ensure a viable population for each species i. The last option, Z = 0, refers to not investing in captive breeding. Here, we assumed that the persistence probability only depended on Qi. We conducted a sensitivity analysis for the chosen values of (see section 2.5). Species extinction probability was given as .
Each management option considered had the potential to lead to four possible outcomes for a species: persistence in the wild and in captivity, persistence only in the wild, persistence only in captivity, or extinction within the EU (see outcomes in Figure 1). Decision-makers can assign weights to reflect the desirability or value of each outcome. We let x be the outcome of the species in the wild, where x = 1 if the species is extant and x = 0 if extinct, and y be the outcome of the species in captivity, where y = 1 if extant and y = 0 otherwise. Vi(x,y) is the value of each possible outcome for species i (Figure 1). Our decision-making framework prioritized species persistence in the wild as the highest priority, followed by maintaining ex-situ insurance populations. On a scale ranging from 0 to 1, we assigned a value of 0 to the outcome of species extinction (Vi and the highest value was given to a species persisting in the wild or persisting both in the wild and ex-situ (. We assumed the decision-maker would place a higher value on species persisting ex-situ compared to a species becoming extinct (). To assess the impact of value judgments (Vi) on prioritization, we conducted a sensitivity analysis (see section 2.5).
We calculated the expected value Eij of each conservation intervention j as the sum of probabilities weighted by the corresponding value judgments Vi. For example, the expected value of securing a species in the wild and in captivity (W = 1, Z = 1) can be derived from the decision tree (Figure 1) and is estimated as in Equation 7:
Finally, the benefit of a conservation intervention is the difference between the expected value of the intervention and the expected value of no intervention (Bij = Eij – Ei0).
2.4 Costs of conservation interventions
We estimated the cost of conserving species i under interventions W and Z as Ci(W,Z). We obtained the species gap area (i.e., the area of a species’ range currently not under protection) based on a representation target for each species (Maiorano et al., 2015). The cost estimation included both one-off land purchase costs and average annual recurrent costs of nature management per km2 across 28 EU countries, based on Verburg et al. (2017). Land purchasing costs for species gap areas included the cost of converting agricultural land to natural vegetation, using average cost of agricultural land prices across 28 EU countries (see Table 3.8 in Verburg et al., 2017). These were one-off costs at the start of the 100-year planning period. Recurrent management costs included nitrogen and conservation management costs (i.e., conservation of specific vegetation) as an average of 58.56 €/ha/year (Verburg et al., 2017, p. 52) for all land uses adjusted to the 100-year period by multiplying with 100. To obtain costs of protecting each species gap area, we multiplied the species gap areas with one-off and recurring costs per km2. Gap areas can overlap between species, so protecting one species’ habitat can benefit and reduce costs for others. Therefore, we calculated the proportion of overlap of gap areas among all species within each taxonomic class (i.e., because our prioritization framework ranks among species within each class). We divided the total cost per species by the sum of the overlap proportions with other species sharing the same gap area. For example, if a species shared 50% of its gap area with one other species and 25% with another, we divided the costs by 1.75.
We estimated the cost of captive breeding for each species, considering a population size of 100 individuals, following Conde et al. (2015). For mammals and birds, we estimated costs from a regression analysis of body mass (Balmford et al., 1996) with data from Pacifici et al. (2013) for mammals and Dunning (2007) for birds. For reptiles and amphibians, we estimated costs based on the Amphibian Ark Amphibian Conservation Action Plan (Gascon et al., 2007; see also Supplementary Table 1). The costs associated with both interventions (habitat protection and captive breeding) were calculated separately and then summed, assuming independence between the two.
2.5 Sensitivity analyses
To evaluate robustness of the overall conservation recommendations, we assessed the sensitivity of our model to three factors: value judgments, Vi(x,y), extinction probabilities for climate-vulnerable species (Ki), and persistence probabilities based on management expertise, Pi2(Z=1,Gik). We calculated expected values Eij(W,Z) for each species and then determined the average expected value across all species. Next, we evaluated the model’s sensitivity to each variable by determining the proportional change in the average expected value for a unit change in the corresponding variable. We further tested how changes in the variable affected the recommended conservation strategy by varying the values and comparing the number of species for which the conservation strategy would change compared to the original values.
3 Results
3.1 Species representation in EU zoos
In our study, we found that out of the 847 species assessed, EU zoos collectively, held 417 species, representing 49% of all EU species (Species360 Zoological Information Management System (ZIMS), 2021). This corresponds to 53% of birds (253 of 473 spp.), 42% of mammals (70 of 168 spp.), 44% of amphibians (35 of 79 spp.) and 46% of reptiles (59 of 127 spp.). Additionally, EU zoos hosted 39% of all EU threatened or regionally extinct species (60 of 153 spp.), although this proportion varied among taxonomic groups (Figure 2A). Furthermore, they held 27% of species endemic to the EU (47 out of 173 spp.) and 32% of species endemic to Europe (89 out of 279 sp. whose geographic range at least partially included the EU). Analyzing population sizes within EU zoos, we found that mammals had, on average, the largest populations, followed by amphibians, birds, and reptiles. Among threatened species, population sizes ranged from 1 to 1564 individuals (mean = 162, median = 85), with the largest population referring to the European Pond Turtle (Emys orbicularis; VU in EU-27). Notably, there were no significant differences in population sizes between threatened and non-threatened species for all four taxonomic groups (Figure 2B, coefficients see Supplementary Table 2).
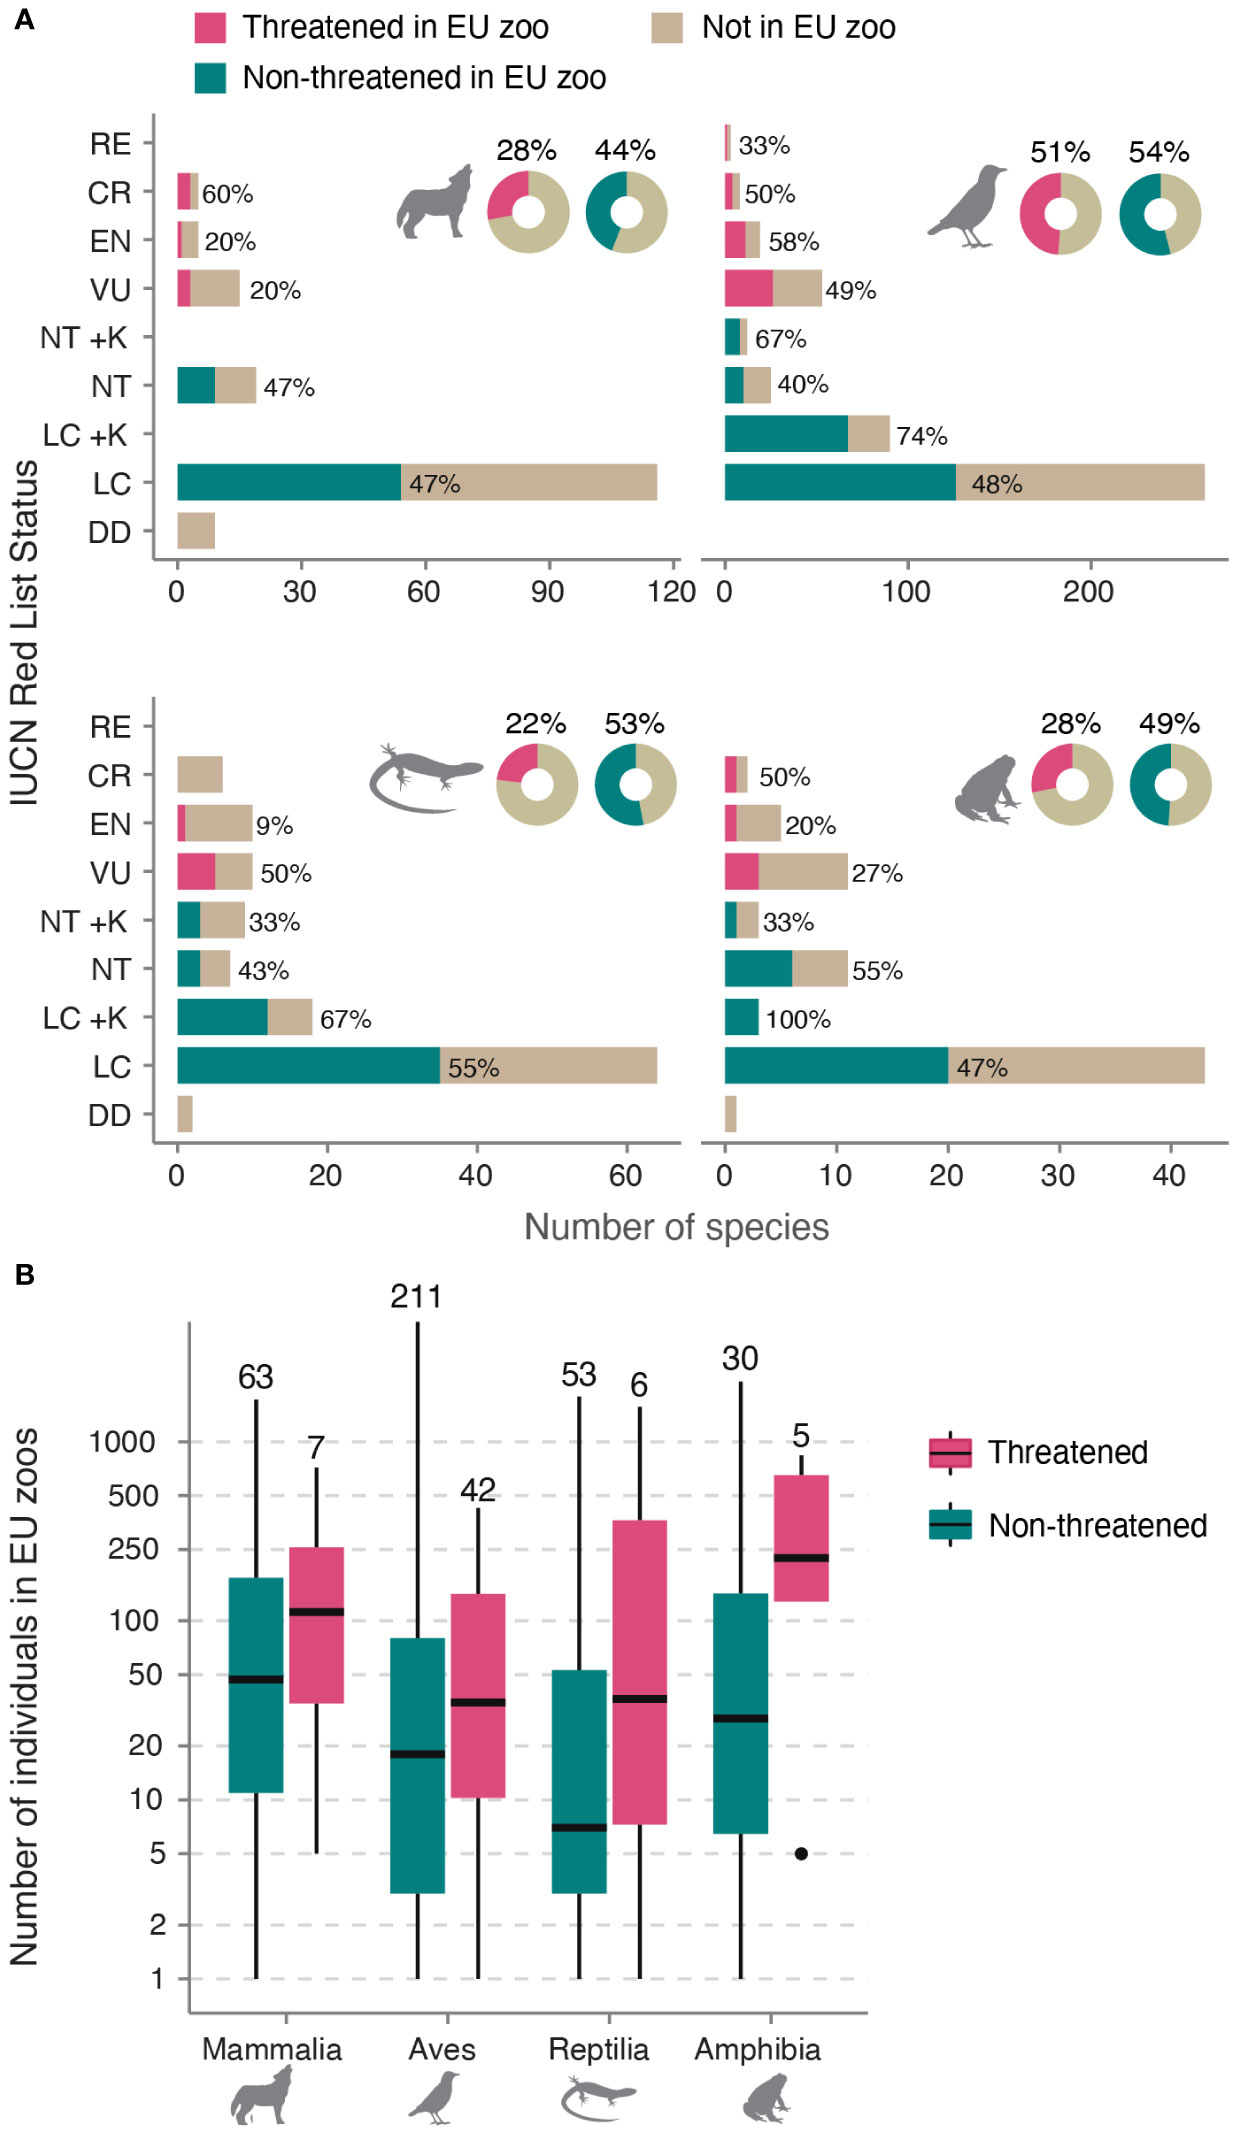
Figure 2 Representation of EU species in EU zoos. (A) Number of EU species in EU zoos by IUCN status. Near Threatened (NT) and Least Concern (LC) are split into species with high (+K) or low (–K) vulnerability to climate change for birds, reptiles, and amphibians (data not available for mammals). Numbers next to bars indicate the percentage of species per category in EU zoos. Doughnut charts show total percentages. Silhouettes were obtained from www.phylopic.org. (B) Boxplots showing the distribution of ex-situ holding sizes of threatened vs non-threatened species in EU zoos (on log scale). Values above boxplots show the total sample size in number of species, for example there are 63 non-threatened mammals kept in EU zoos, with a median population size of 49. RE, Regionally Extinct; CR, Critically Endangered; EN, Endangered; VU, Vulnerable; DD, Data Deficient.
Regarding vulnerability to climate change, we found that 62% of species considered vulnerable were represented in EU zoos, accounting for 123 out of 197 species (excluding mammals). Specifically, EU zoos hosted 71% of climate-vulnerable birds (101 out of 143 spp.), 42% of reptiles (16 of 38 spp.) and 38% of amphibians (6 of 16 spp.). Additionally, among the five EU species listed by the Alliance for Zero Extinction, EU zoos housed the Montseny brook newt (Calotriton arnoldi). Moreover, out of the 49 EU species listed on EDGE, EU zoos kept 12 species (25%).
With respect to ex-situ management, a total of 44 EU species (5%) were subject to such conservation efforts, including 19 threatened species. Among these, 21 species (2%) were managed through an EAZA Ex-situ Programme, with 12 species managed intensively and nine managed in a European Studbook. Moreover, ex-situ conservation efforts were mentioned on the IUCN RL or the Amphibian Ark website for 23 additional species or subspecies (Amphibian Ark, 2019; IUCN, 2019). Notably, while our analysis focuses on species taxa, conservation breeding programs extend to subspecies management, including EAZA’s program for the Finnish forest reindeer (Rangifer tarandus fennicus) and the Iberian wolf (Canis lupus signatus), which is distinct from the separate program for the Grey wolf (Canis lupus).
3.2 Prioritization
Recommendations of conservation interventions for the 277 EU species depended on the inclusion of costs in the model. When excluding costs to better capture the effects of benefits and values in the ranking, captive breeding was recommended for 168 (61%) species, habitat protection was recommended for 5 (2%), both interventions for 55 (20%) and no intervention for 49 (18%). When including costs, captive breeding and no action was the preferred intervention for 167 and 50 species, respectively. Habitat protection was recommended for 60 species (22%), and the combined use of both interventions was not recommended (Table 1). To illustrate our findings, we present four examples representing each strategy and taxonomic group (Table 2).

Table 1 Number of EU threatened species for which each conservation intervention is recommended.
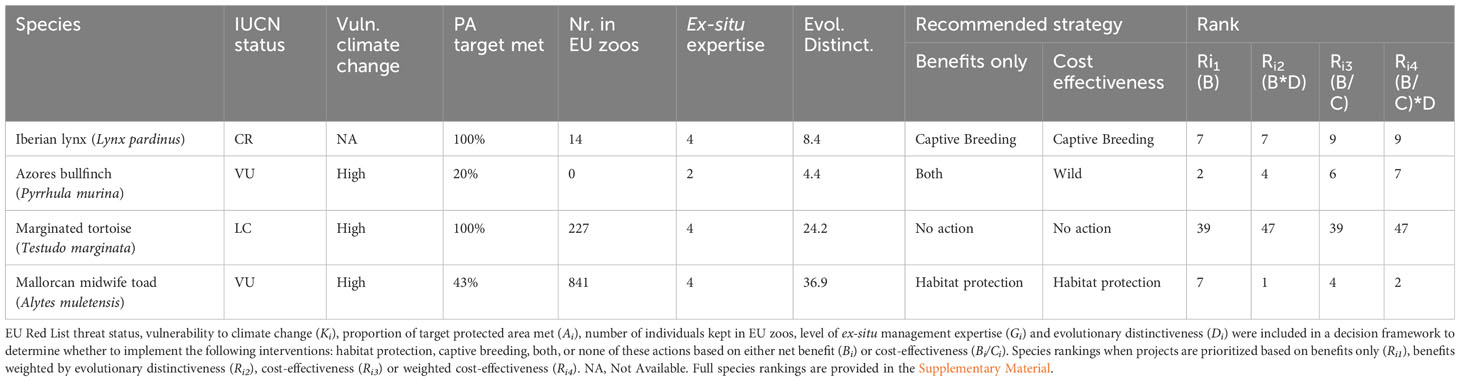
Table 2 Prioritization of conservation interventions for four case study species.
The ranking of species interventions varied depending on the criterion used, such as the inclusion of evolutionary distinctiveness and costs (Table 2). For example, in the case of amphibians, the Karpathos frog (Pelophylax cerigensis) ranked highest when considering benefits alone, whereas the Mallorcan midwife toad (Alytes muletensis) ranked highest when benefits were weighted by evolutionary distinctiveness. When including costs, the Sette Fratelli cave salamander (Speleomantes sarrabusensis) was prioritized. Complete data on recommended strategies and species rankings under each strategy can be found in the Supplementary Material.
Comparing our results to the conservation recommendations of the Red List, our model suggests captive breeding as the recommended strategy for 167-168 species, compared to only 11 species on the Red List. Among those 11 species, our model suggested no intervention for 4 species that already have large numbers of individuals in zoos (117–555 individuals). However, these species may nevertheless benefit from coordinated breeding programs.
3.3 Sensitivity analyses
The sensitivity analyses conducted on our model, showed that the most influential factor affecting outcomes is the decision-makers value judgement V(x,y). Particularly important, was the decision-makers valuation of the species persistence in both the wild and captivity (V(1,1)) in comparison to persistence in the wild only (Figure 3). Varying this value within a range from its maximum at 1 to 75% of its original value resulted in changes in recommended interventions for up to 73% of species (Supplementary Figure 3). Conversely, we found limited sensitivity to the level of breeding expertise (Pi2(Z, Gik)) and the extinction probabilities related to climate change (Ki). Different values of breeding expertise and extinction probabilities pertaining to climate change did not lead to changes in the recommended strategy (Supplementary Figures 1, 2).
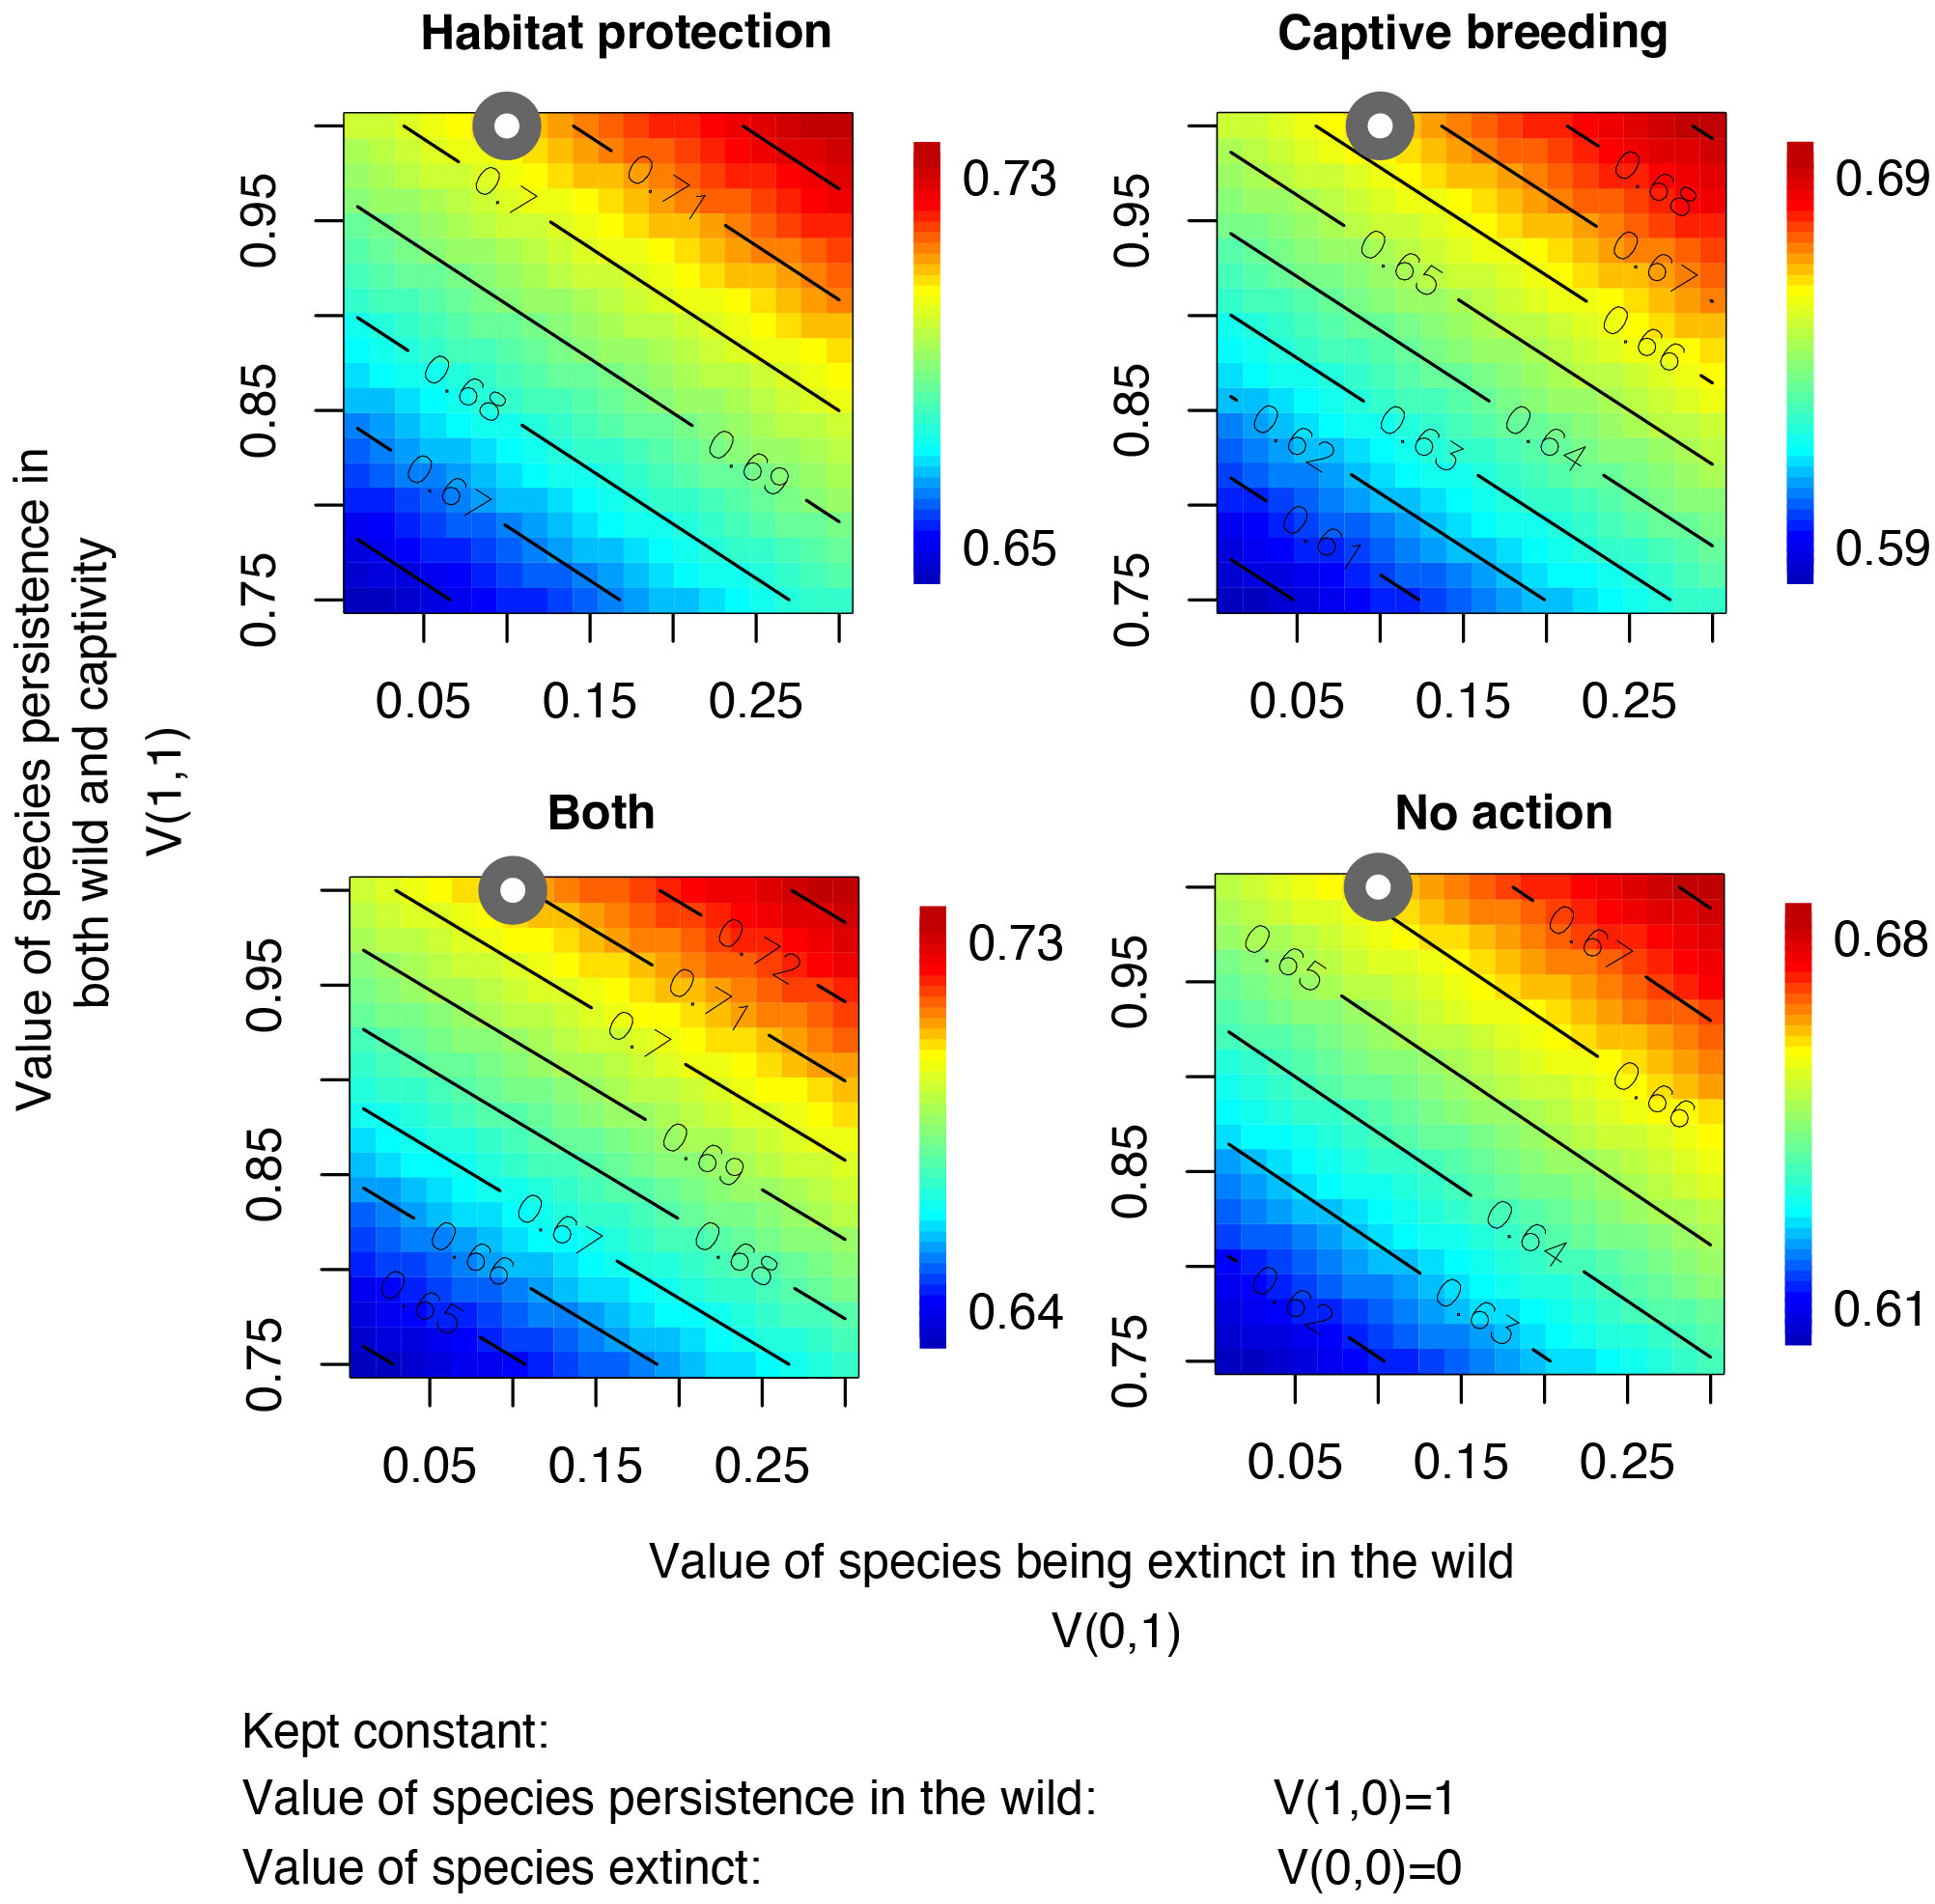
Figure 3 Sensitivity analysis of the effects of value judgments on expected values of the four conservation interventions. The x-axes show variations in the judgment value V(0,1) (i.e., the value of a species being extinct in the wild ranging from 0 to 0.3) and the y-axes show variations in the judgment value V(1,1) (i.e., value of species persistence in both the wild and captivity, ranging from 0.8 to 1). The values of a species persisting in the wild (V(1,0) = 1) and becoming extinct (V(0,0) = 0) were kept fixed. Color scales show mean expected values. Grey points indicate the values selected in the analysis.
4 Discussion
Our findings highlight the considerable potential of EU zoos that share their data in ZIMS for biodiversity conservation within the EU. Currently these zoos house over half (53%) of the 290 EU species that are either threatened or vulnerable to climate change. Yet only ~5% of EU species are currently managed in coordinated Ex-situ programs by the EAZA, and population sizes of threatened species were relatively small (median = 85), although not significantly different from those of non-threatened species. In contrast to the current management practices, our model recommended additional investments in ex-situ populations for up to 61% of the 277 at-risk species analyzed in the decision analysis. Conversely, expanding habitat protection was recommended for a smaller proportion of species (ranging from 2 to 22% for habitat protection alone, and 20% for both interventions). These results suggest that zoos could significantly enhance their conservation impact by establishing more coordinated breeding efforts for highly prioritized EU species, particularly those already present in EU zoos but facing threats despite adequate habitat protection in the wild. Our framework represents an important first step in supporting zoos and other conservation organizations, whether working individually or collectively, in identifying potential conservation strategies and making informed decisions for captive breeding. By combining extinction risks, values, and costs into a unified metric, our approach can be applied flexibly to a wide range of species, including those with limited available information.
Although our model suggests prioritizing additional investments in captive breeding over habitat protection for many species, it is important to emphasize that preserving a species in its natural habitat remains the primary goal of species conservation. Establishing captive breeding programs for all 167-168 recommended species may not be feasible due to various challenges, such as low breeding success resulting from complex diets (e.g., in bats and seabirds; Conde et al., 2013), limited availability of suitable founding individuals, or limited reintroduction possibilities in the wild. Conservation management strategies must be tailored to each species, considering both captive breeding and habitat protection as parts of an integrated conservation strategy. The ranking of species allows for a targeted focus of highly ranked species first, rather than necessitating the simultaneous prioritization of all species at once.
Long-term captive breeding ultimately leads to loss of fitness of a species due to inbreeding, adaptation to the captive environment, and the loss of species-typical behaviors. However, by managing zoo populations as part of a meta-population with a regular exchange of breeding stock between in-situ and ex-situ populations, the negative impacts can be minimized, and the effective population size can be increased (Lacy, 2013). Given data constraints, our determination of the minimal viable population size relied on total population counts rather than effective population size and did not consider the population’s genetic diversity. Notably, our current model needs further refinement to incorporate more nuanced demographic and genetic models that account for these additional factors. Moreover, the threshold of 100 individuals as a viable population size has been widely debated, with suggested numbers varying between 50 and 5000 individuals (Lacy, 2013). The specific number will vary depending on species-specific traits, such as generation time, reproductive strategy, and species management. Large population sizes may not always be necessary. Notably, some species have demonstrated the ability to recover from extremely low population sizes, while others may have naturally existed with low genetic diversity for millennia (e.g., on islands) (Wiedenfeld et al., 2021).
In terms of habitat protection, we adopted the targets defined by Maiorano et al. (2015). Most species in our analysis (217 out of 277) already met those targets, resulting in a lower number of fewer species recommended for additional investments in habitat protection. However, despite meeting these targets, species continue to face increasing threats in the wild. While habitat loss and climate change are recognized as primary threats to many EU species, their impact on extinction risk remains poorly understood. Species survival will depend on various other factors, such as the effectiveness of management efforts in protected areas (Geldmann et al., 2013) control of invasive species, human disturbances, and disease management (European Commission, 2020).
Our prioritization relies on European IUCN Red List assessments, which restricts the scope of this study to species recognized by this framework. Insufficient taxonomic research, for example for European mammals, greatly impacts conservation policies in Europe, often neglecting subspecies due to data gaps and changing taxonomic lists. For example, out of the 24 mammals occurring in Italy, for which species status has been proposed since 2005, only one (Neomys milleri) is currently recognized by the IUCN Red List and has been assessed globally, but not regionally (Gippoliti and Groves, 2018; Gazzard and Meinig, 2023). Recognizing that taxonomic research is the cornerstone for effective conservation strategies, it becomes evident that enhancing taxonomic efforts as well as supporting efforts to assess these species within the IUCN regional frameworks is imperative. Moreover, additional research is needed to refine extinction probabilities, taking into account climate-related threats. Here, to develop probabilistic analyses, we transformed categorical values (IUCN RL categories and climate change vulnerability) into probabilities. We assumed that species categorized as vulnerable to climate change would experience increased risk of extinction and that protecting a species’ target area would linearly decrease extinction risk and have an equal impact on all species. However, the extent to which climate change affects extinction risk on a per-species basis, and how this translates to probabilities, remains uncertain.
Despite these limitations, our model, which includes species not currently classified as threatened but facing future threats (such as climate change), presents a proactive conservation approach compared to the reactive approach of extracting individuals from already small populations. For example, the common hamster (Cricetus cricetus) has recently been uplisted from Least Concern to Critically Endangered on the global IUCN Red List, despite being a previously abundant species in Europe and Russia (Banaszek et al., 2020). Presently, there are approximately 481 individuals of this species in EU zoos registered in ZIMS (Species360 Zoological Information Management System (ZIMS), 2021), which can be managed to establish insurance populations until threats in the wild are reduced, if at all. Furthermore, our model allows for the testing of assumptions and enables further refinement of prioritization approaches as more comprehensive and improved data become available. For example, we found that varying estimates of captive breeding expertise and extinction risk from climate change had minimal impact on our results, suggesting these variables influenced decisions and rankings less than estimates of costs or value judgments by decision-makers.
A crucial aspect that requires improvement upon is the estimation of captive-breeding costs, as accurate data are currently unavailable. When deciding between alternative options, most individuals will naturally take costs into consideration, and a prioritization framework aims to make these costs explicit. We emphasize the importance of including costs in the analysis, as neglecting them could result in misallocation of resources. Investing heavily in saving highly threatened species with limited potential for recovery while disregarding lesser threatened species that require fewer resources may lead to suboptimal outcomes (Joseph et al., 2009). However, resources may not be as limited as commonly assumed. For example, Wiedenfeld et al. (2021) argue that additional funding could be leveraged from previously unexplored sources, such as the private sector.
To accommodate the different perspectives, we present two approaches: one including and one excluding costs. The cost-effectiveness analysis reveals that the additional contribution to species conservation from captive breeding incurs much higher expenses compared to habitat protection (~1 billion € for captive breeding versus a total cost of ca. 5 million € for habitat protection if all species are protected). However, the costs of habitat protection are likely underestimated, as they are based on average country-level costs and do not consider the specific distribution of the species. Similarly, the cost of captive breeding, particularly for birds and mammals, is solely based on body mass. Consequently, we urge zoos to make information regarding costs of keeping and managing their animals available to facilitate more informed decision-making.
The goal is to prevent species extinction in the wild and, ultimately, the complete loss of a species. Thus, our model assigns lower value to the outcome that a species only persists in zoos, while placing higher value on the outcomes of the species persisting in the wild or in both zoo and wild settings. The recommendations were highly sensitive to those hypothetical decision-makers’ preferences. Consequently, if our model is utilized to select among various options, it is crucial to carefully elicit and consider the preferences of the decision-makers involved (Rout et al., 2013). The societal view on captive breeding programs in Europe, and how to evaluate the significance of species becoming extinct in the wild will be crucial in shaping discussions about species conservation strategies in the future.
While our study relies on generalizations among species, it serves as a valuable initial step towards prioritizing species for the rigorous assessment process outlined in the IUCN Ex-situ guidelines. While our framework primarily focuses on additional investments to current conservation efforts in habitat protection and captive breeding, it has the potential to be expanded to include other crucial conservation actions. These actions may include temporary rescue efforts, establishing sources for reintroduction, population restoration or assisted colonization initiatives, research, training, prioritization of genetically important individuals for a species, and the collection of frozen live cells for genetic rescue (IUCN/SSC, 2014). Further evaluation against the IUCN Ex-situ guidelines will capture additional factors not incorporated into our analysis, such as country-level regulations on pollutants that directly impact a species, human population pressure, and the genetic variability. As in other data-intensive assessment schemes (such as IUCN Red List extinction risk assessments), initial screening and prioritization of species may be useful (Bland et al., 2015).
Given the current extinction crisis, EU zoos are uniquely positioned to prevent further extinctions of EU threatened species but will need to orient themselves to managing populations more sustainably. Our framework can facilitate further critical analysis to maximize the impact of ex-situ actions to support species survival in the wild and align zoo conservation efforts with existing EU Biodiversity targets.
Data availability statement
The original contributions presented in the study are included in the article/Supplementary Material. R code is available on GitHub at: https://github.com/jostaerk/Staerk_etal_EU_Zoos. Further inquiries can be directed to the corresponding authors.
Author contributions
JS: Data curation, Formal Analysis, Methodology, Visualization, Writing – original draft, Writing – review & editing. FC: Methodology, Visualization, Writing – review & editing, Funding aquisition. MK: Writing – review & editing, Validation. KW: Data curation, Writing – review & editing. WF: Data curation, Writing – review & editing. JC: Data curation, Writing – review & editing. ZP: Writing – review & editing. LB: Writing – review & editing. NF: Writing – review & editing. TM: Writing – review & editing. LM: Data curation, Writing – review & editing. JF: Writing – review & editing. HP: Methodology, Writing – review & editing. DC: Conceptualization, Funding acquisition, Methodology, Supervision, Writing – original draft, Writing – review & editing.
Funding
The author(s) declare financial support was received for the research, authorship, and/or publication of this article. This project was hosted and supported financially by the Interdisciplinary Centre on Population Dynamics at the University of Southern Denmark and the Max Planck Institute for Evolutionary Anthropology, Germany and funded by the Zeidler Foundation and the Sponsor-Partners of the Species360 Conservation Science Alliance (Copenhagen Zoo, the World Association of Zoos and Aquariums and The Mandai Wildlife Group).
Acknowledgments
We thank Markus Gusset, Danny de Man, Rita da Silva, and Maria Baden for comments, and Philip Miller and Kathy Traylor-Holzer from the IUCN Conservation Planning Specialist Group for constructive advice on the IUCN Ex-situ guidelines. We further express our gratitude to all contributors of the databases used in this study for making their data openly available, and the >1200 Species360 members across >100 counties for sharing standardized data in the Zoological Information Management System, ZIMS. Their data in the Species Holdings module allowed us to develop these analyses via the data-sharing site (https://conservation.species360.org/data-sharing/).
Conflict of interest
Author LB was employed by company Eurika Publishing.
The remaining authors declare that the research was conducted in the absence of any commercial or financial relationships that could be construed as a potential conflict of interest.
Publisher’s note
All claims expressed in this article are solely those of the authors and do not necessarily represent those of their affiliated organizations, or those of the publisher, the editors and the reviewers. Any product that may be evaluated in this article, or claim that may be made by its manufacturer, is not guaranteed or endorsed by the publisher.
Supplementary material
The Supplementary Material for this article can be found online at: https://www.frontiersin.org/articles/10.3389/fcosc.2023.1298850/full#supplementary-material
References
Akçakaya R. H., Butchart S. H. M., Mace G. M., Stuart S. N., Hilton-Taylor C. (2006). Use and misuse of the IUCN red list criteria in projecting climate change impacts on biodiversity. Glob. Change Biol. 12, 2037–2043. doi: 10.1111/j.1365-2486.2006.01253.x
Alliance for Zero Extinction (AZE) (2010) AZE update. Available at: https://www.zeroextinction.org (Accessed August 19, 2020).
Amphibian Ark (2019) Progress of programs. Available at: https://progress.amphibianark.org/progress-of-programs (Accessed May 20, 2019).
Council Directive 92/43/EEC. (1992). Council Directive 92/43/EEC of 21 May 1992 on the conservation of natural habitats and of wild fauna and flora. Official Journal of the European Communities, L 206(35), 7–50. Available at: https://eur-lex.europa.eu/legal-content/EN/TXT/PDF/?uri=CELEX:31992L0043&from=EL.
Balmford A., Mace G. M., Leader-Williams N. (1996). Designing the ark: setting priorities for captive breeding. Conserv. Biol. 10, 719–727. doi: 10.1046/j.1523-1739.1996.10030719.x
Banaszek A., Bogomolov P., Feoktistova N., La Haye M., Monecke S., Reiners T. E., et al. (2020). Cricetus cricetus. IUCN Red List Threatened Species2020, e.T5529A111875852. doi: 10.2305/IUCN.UK.2020-2.RLTS.T5529A111875852.en
BirdLife International (2021). European red list of birds (Luxembourg: Publications Office of the European Union).
Bland L. M., Orme C. D. L., Bielby J., Collen B., Nicholson E., Mccarthy M. A. (2015). Cost-effective assessment of extinction risk with limited information. J. Appl. Ecol. 52, 861–870. doi: 10.1111/1365-2664.12459
Bolam F. C., Mair L., Angelico M., Brooks T. M., Burgman M., Hermes C., et al. (2021). How many bird and mammal extinctions has recent conservation action prevented? Conserv. Lett. 14, 1–11. doi: 10.1111/conl.12762
Byers O., Lees C., Wilcken J., Schwitzer C. (2013). The One Plan approach: The philosophy and implementation of CBSG’s approach to integrated species conservation planning. WAZA magazine 14, 2–5.
Carr J. (2011). Climate change vulnerability of European reptiles: Development and application of an IUCN assessment framework [Master’s thesis] (Norwich: University of East Anglia).
Chamberlain S. A., Szöcs E. (2013). Taxize: Taxonomic search and retrieval in R. F1000Research 2. doi: 10.12688/f1000research.2-191.v2
Conde D. A., Colchero F., Güneralp B., Gusset M., Skolnik B., Parr M., et al. (2015). Opportunities and costs for preventing vertebrate extinctions. Curr. Biol. 25 (6), R219–R221. doi: 10.1016/j.cub.2015.01.048
Conde D. A., Colchero F., Gusset M., Pearce-Kelly P., Byers O., Flesness N., et al. (2013). Zoos through the lens of the IUCN red list: A global metapopulation approach to support conservation breeding programs. PloS One 8 (12), e80311. doi: 10.1371/journal.pone.0080311
Cox N. A., Temple H. J. (2009). European red list of reptiles. Luxembourg, Luxembourg: Office for Official Publications of the European Communities. doi: 10.2779/091372
Directive 2009/147/EC. (2009). Directive 2009/147/EC of the European Parliament and of the Council of 30 November 2009 on the conservation of wild birds. Official Journal of the European Union 20 (7). doi: 10.3000/17252555.L_2010.020.eng
Dunning J. B. (2007). CRC handbook of avian body masses, 2nd ed. Boca Raton, FL: CRC Press. doi: 10.1201/9781420064452
EAZA (2017) Position statement on the EU zoos directive 1999/22/EC. Available at: https://www.eaza.net/assets/Uploads/EAZADocuments-Other/EAZA-Position-Statement-Zoos-Directive-2017-03-FINAL.pdf.
EAZA (2019) EAZA Ex-situ Programme overview. Available at: https://www.eaza.net/conservation/programmes/ (Accessed December 11, 2019).
European Commission (2015). Report from the Commission to the European Parliament and the Council, the mid-term review of the EU Biodiversity Strategy to 2020, Brussels Belgium: European Commission Report.
European Commission (2020). Communication from the Commission to the European Parliament, the Council, the European Economic and Social Committee and the Committee of the regions EU Biodiversity Strategy for 2030 Bringing nature back into our lives (Brussels Belgium: European Commission Report).
Evans M. C., Tulloch A. I. T., Law E. A., Raiter K. G., Possingham H. P., Wilson K. A. (2015). Clear consideration of costs, condition and conservation benefits yields better planning outcomes. Biol. Conserv. 191, 716–727. doi: 10.1016/j.biocon.2015.08.023
Foden W. B., Butchart S. H. M., Stuart S. N., Vié J. C., Akçakaya H. R., Angulo A., et al. (2013). Identifying the world’s most climate change vulnerable species: A systematic trait-based assessment of all birds, amphibians and corals. PloS One 8 (6), e65427. doi: 10.1371/journal.pone.0065427
Gascon C., Collins J. P., Moore R. D., Church D. R., McKay J. E., Mendelson J. R. III (2007). Amphibian conservation action plan (Gland, Switzerland and Cambridge, UK: IUCN/SSC Amphibian Specialist Group), 64pp.
Gazzard A., Meinig H. (2023). Neomys milleri. IUCN Red List Threatened Species 2023. doi: 10.2305/IUCN.UK.2023-1.RLTS.T221738646A221738688.en. (Accessed December 11, 2023).
Geldmann J., Barnes M., Coad L., Craigie I. D., Hockings M., Burgess N. D. (2013). Effectiveness of terrestrial protected areas in reducing habitat loss and population declines. Biol. Conserv. 161, 230–238. doi: 10.1016/j.biocon.2013.02.018
Gippoliti S., Groves C. P. (2018). Overlooked mammal diversity and conservation priorities in Italy: Impacts of taxonomic neglect on a Biodiversity Hotspot in Europe. Zootaxa 4434 (3), 511. doi: 10.11646/ZOOTAXA.4434.3.7
Gumbs R., Gray C. L., Wearn O. R., Owen N. R. (2018). Tetrapods on the EDGE: Overcoming data limitations to identify phylogenetic conservation priorities. PloS One 13 (4), e0194680. doi: 10.1371/journal.pone.0194680
IUCN (2019) The IUCN red list of threatened species. Version 2019-2. Available at: http://www.iucnredlist.org (Accessed August 15, 2019).
IUCN/SSC (2014). Guidelines on the use of ex situ management for species conservation. Version 2.0. Gland, Switzerland: IUCN Species Survival Commission.
Joseph L. N., Maloney R. F., Possingham H. P. (2009). Optimal allocation of resources among threatened species: a project prioritization protocol. Conserv. Biol. 23. doi: 10.1111/j.1523-1739.2008.01124.x
Keith D. A., Mahony M., Hines H., Elith J., Regan T. J., Baumgartner J. B., et al. (2014). Detecting extinction risk from climate change by IUCN red list criteria. Conserv. Biol. 28 (3), 810–819. doi: 10.1111/cobi.12234
Lacy R. C. (2013). Achieving true sustainability of zoo populations. Zoo Biol. 32 (1), 19–26. doi: 10.1002/zoo.21029
Lees C. M., Wilcken J. (2009). Sustaining the Ark: the challenges faced by zoos in maintaining viable populations. Int. Zoo Yearbook 43 (1), 6–18. doi: 10.1111/j.1748-1090.2008.00066.x
Littlewood N. A., Rocha R., Smith R. K., Martin P. A., Lockhart S. L., Schoonover R. F., et al. (2020). Terrestrial Mammal Conservation: Global evidence for the effects of interventions for terrestrial mammals excluding bats and primates. Cambridge, UK: Open Book Publishers.
Maiorano L., Amori G., Montemaggiori A., Rondinini C., Santini L., Saura S., et al. (2015). On how much biodiversity is covered in Europe by national protected areas and by the Natura 2000 network: Insights from terrestrial vertebrates. Conserv. Biol. 29 (4), 986–995. doi: 10.1111/cobi.12535
Metrick A., Weitzman M. L. (1998). Conflicts and choices in biodiversity preservation. J. Econ. Perspect. 12 (3), 21–34. doi: 10.1257/jep.12.3.21
Mooers A., Faith D. P., Maddison W. P. (2008). Converting endangered species categories to probabilities of extinction for phylogenetic conservation prioritization. PloS One 3 (11), e3700. doi: 10.1371/journal.pone.0003700
Pacifici M., Santini L., Di Marco M., Baisero D., Francucci L., Marasini G. G., et al. (2013). Generation length for mammals. Nat. Conserv. 5, 89–94. doi: 10.3897/natureconservation.5.5734
R Core Team (2017). R: A language and environment for statistical computing (Vienna, Austria: R Foundation for Statistical Computing). Available at: https://www.R-project.org/.
Rout T. M., McDonald-Madden E., Martin T. G., Mitchell N. J., Possingham H. P., Armstrong D. P. (2013). How to decide whether to move species threatened by climate change. PloS One 8 (10), e75814. doi: 10.1371/journal.pone.0075814
Shoo L. P., Hoffmann A. A., Garnett S., Pressey R. L., Williams Y. M., Taylor M., et al. (2013). Making decisions to conserve species under climate change. Clim. Change 119, 239–246. doi: 10.1007/s10584-013-0699-2
Sikkema R., Rodríguez-Guerra M., Herranz Muñoz V., Galhardo L., Fàbregas M., Schrijver R. (2015) EU zoos directive good practices document. Available at: https://ec.europa.eu/environment/nature/pdf/EU_Zoos_Directive_Good_Practices.pdf.
Soulé M., Gilpin M., Conway W., Foose T. (1986). The millenium ark: How long a voyage, how many staterooms, how many passengers? Zoo Biol. 5 (2), 101–113. doi: 10.1002/zoo.1430050205
Species360 Zoological Information Management System (ZIMS). (2021). Available at: https://www.zims.Species360.org (Accessed January 21, 2021).
Temple H. J., Cox N. A. (2009). European red list of amphibians. Luxembourg (Luxembourg, Luxembourg: Office for the Official Publication of the European Communities).
Temple H. J., Terry A. (2007). The status and distribution of european mammals (Luxembourg, Luxembourg: Office for Official Publication of the European Communities), viii + 48pp, 210 x 297 mm.
Verburg R. W., Hennen W. H. G., Puister L. F., Michels R., van Duijvendijk K. (2017). Estimating costs of nature management in the European Union : Exploration modelling for PBL’s Nature Outlook (Wageningen, Netherlands: Wageningen University Research). doi: 10.18174/425041
Wiedenfeld D. A., Alberts A. C., Angulo A., Bennett E. L., Byers O., Contreras-MacBeath T., et al. (2021). Conservation resource allocation, small population resiliency, and the fallacy of conservation triage. Conserv. Biol. 35 (5), 1388–1395. doi: 10.1111/cobi.13696
Keywords: captive breeding, conservation planning, cost-effectiveness, zoos, prioritization, Natura2000, Species360, EU zoos directive
Citation: Staerk J, Colchero F, Kenney MA, Wilson KA, Foden WB, Carr JA, Pereboom Z, Bland L, Flesness N, Martin T, Maiorano L, Fa JE, Possingham HP and Conde DA (2024) A decision framework to integrate in-situ and ex-situ management for species in the European Union. Front. Conserv. Sci. 4:1298850. doi: 10.3389/fcosc.2023.1298850
Received: 22 September 2023; Accepted: 18 December 2023;
Published: 11 January 2024.
Edited by:
Eliana Pintus, Czech University of Life Sciences Prague, CzechiaReviewed by:
Yan Hua, Guangdong Academy of Forestry, ChinaSpartaco Gippoliti, Storia della Fauna, Italy
Copyright © 2024 Staerk, Colchero, Kenney, Wilson, Foden, Carr, Pereboom, Bland, Flesness, Martin, Maiorano, Fa, Possingham and Conde. This is an open-access article distributed under the terms of the Creative Commons Attribution License (CC BY). The use, distribution or reproduction in other forums is permitted, provided the original author(s) and the copyright owner(s) are credited and that the original publication in this journal is cited, in accordance with accepted academic practice. No use, distribution or reproduction is permitted which does not comply with these terms.
*Correspondence: Dalia A. Conde, ZGFsaWFAYmlvbG9neS5zZHUuZGs=; Johanna Staerk, am9oYW5uYS5zdGFlcmtAZ21haWwuY29t