 Xinwei Li
 Junichiro Kono
 Qimiao Si
 Silke Paschen
- 1Department of Physics, California Institute of Technology, Pasadena, CA, United States
- 2Institute for Quantum Information and Matter, California Institute of Technology, Pasadena, CA, United States
- 3Department of Electrical and Computer Engineering, Rice University, Houston, TX, United States
- 4Department of Materials Science and Nanoengineering, Rice University, Houston, TX, United States
- 5Department of Physics and Astronomy, Center for Quantum Materials, Rice University, Houston, TX, United States
- 6Institute of Solid State Physics, Technische Universität Wien, Vienna, Austria
Strange metal behavior appears across a variety of condensed matter settings and beyond, and achieving a universal understanding is an exciting prospect. The beyond-Landau quantum criticality of Kondo destruction has had considerable success in describing the behavior of strange metal heavy fermion compounds, and there is some evidence that the associated partial localization-delocalization nature can be generalized to diverse materials classes. Other potential overarching principles at play are also being explored. An intriguing proposal is that Planckian scattering, with a rate of kBT/ℏ, leads to the linear temperature dependence of the (dc) electrical resistivity, which is a hallmark of strange metal behavior. Here we extend a previously introduced analysis scheme based on the Drude description of the dc resistivity to optical conductivity data. When they are well described by a simple (ac) Drude model, the scattering rate can be directly extracted. This avoids the need to determine the ratio of charge carrier concentration to effective mass, which has complicated previous analyses based on the dc resistivity. However, we point out that strange metals typically exhibit strong deviations from Drude behavior, as exemplified by the “extreme” strange metal YbRh2Si2. This calls for alternative approaches, and we point to the power of strange metal dynamical (energy-over-temperature) scaling analyses for the inelastic part of the optical conductivity. If such scaling extends to the low-frequency limit, a strange metal relaxation rate can be estimated, and may ultimately be used to test whether strange metals relax in a Planckian manner.
1 Introduction
The standard theory of metals is Fermi liquid theory. It describes materials across the correlation spectrum, from the simplest metals such as sodium or aluminum to heavy fermion compounds (Stewart, 1984) with mass renormalizations of more than three orders of magnitude (Kadowaki and Woods, 1986; Jacko et al., 2009). However, under certain circumstances, behavior at odds with this theory, dubbed non-Fermi liquid behavior, is observed. From the perspective of Fermi liquid theory, this regime arises when the quasiparticle weight factor Z, which decreases with increasing correlation strength, vanishes. This is where Fermi liquid theory breaks down and alternative descriptions are needed. In spite of tremendous efforts and much progress, a full understanding of non-Fermi liquids is an outstanding challenge.
One of the best understood settings in which non-Fermi liquid behavior arises are continuous quantum phase transitions (Sachdev, 1999). Heavy fermion compounds have proven particularly suitable to study them because the competing energy scales governing these materials make them readily tunable by external control parameters (v. Löhneysen et al., 2007; Kirchner et al., 2020; Paschen and Si, 2021a; b). Through a large body of investigations on many different compounds it became clear that two broad categories can be distinguished. In the first one, the quantum critical behavior, typically observed at the border of antiferromagnetic order in these materials, is dominated by fluctuations of the order parameter. This leads to strong scattering at “hot spots” on the Fermi surface that are associated with the ordering wave vector. In the clean case, the resistivity is proportional to T2 (where T is the temperature) given that the current is primarily carried by Landau quasiparticles that reside in the “cold regions” of the Fermi surface (Hlubina and Rice, 1995). In the presence of disorder, the electrical resistivity is predicted to vary as Tϵ, with 1 ≲ ϵ ≲ 1.5 depending on the amount of disorder (Rosch, 1999). Predictions for such order parameter fluctuation or spin density wave (SDW)-type quantum critical points (QCPs) have also been made for other physical properties (Hertz, 1976; Millis, 1993; Moriya and Takimoto, 1995, v. Löhneysen et al., 2007; Zhu et al., 2003), and have been verified in some cases (Küchler et al., 2003).
In the second category of materials, however, observations at odds with these predictions have been made (Paschen and Si, 2021a; b), which have provided support for the beyond-Landau quantum criticality of Kondo destruction (Coleman et al., 2001; Si et al., 2001; Senthil et al., 2004). These observations include energy-over-temperature scaling of inelastic neutron scattering (Schröder et al., 2000) and optical conductivity data (Prochaska et al., 2020), and an abrupt change of the Fermi surface across the QCP as evidenced by de Haas–van Alphen (Shishido et al., 2005) and Hall effect measurements (Paschen et al., 2004; Friedemann et al., 2010; Custers et al., 2012; Martelli et al., 2019). The sudden reconstruction from a small to a large Fermi surface characterizes a (partial, 4f selective) localization-delocalization transition, and is emerging as a potential universal organizing principle with supporting evidence in a variety of other correlated materials classes (Paschen and Si, 2021a), including the cuprates (Badoux et al., 2016; Fang et al., 2022). The interacting nature of the fixed point describing a Kondo-destruction QCP (Coleman et al., 2001; Si et al., 2001; Senthil et al., 2004) means that kBT is the only energy scale, suggesting that the electrical resistivity would be linearly proportional to kBT. Quite remarkably, all heavy fermion compounds of this second category indeed exhibit a linear-in-temperature dc electrical resistivity (Taupin and Paschen, 2022). Thus, quantum criticality beyond order parameter fluctuations appears to be tied to the “strange metal” linear-in-temperature resistivity in heavy fermion compounds.
The most striking case in this second category is YbRh2Si2, where the electrical resistivity is linear in temperature over 3.5 orders of magnitude in temperature, from above 10 K down to the onset of unconventional superconductivity near 3 mK at the quantum critical field (Nguyen et al., 2021). Recently, an attempt has been made (Taupin and Paschen, 2022) to answer the question whether this extreme linear-in-temperature resistivity might be characterized by “Planckian dissipation” (Zaanen, 2004)—scattering at a rate equal to the inverse of the Planckian time scale (the shortest possible time scale in analogy with the Planck time in quantum gravity). While the physics and implications of the Planckian form of scattering remain unclear, its applicability to strange metals is an intriguing question to ascertain empirically. As proposed in (Bruin et al., 2013) and more recently taken up by others (Legros et al., 2019; Cao et al., 2020; Ghiotto et al., 2021; Grissonnanche et al., 2021; Mousatov and Hartnoll, 2021), this has been done by assuming a Drude description of the (dc) resistivity. For YbRh2Si2, the scattering rate was found to be much smaller, unless the charge carriers were assumed to have unreasonably light masses. The same analysis was also carried out for other strange metal heavy fermion compounds, with similar results (Taupin and Paschen, 2022). As such light carriers are absent in the heavy Fermi liquid ground state of these materials, even at tuning parameter values far away from the quantum critical value, it was concluded that dissipation was not Planckian (Taupin and Paschen, 2022). Nevertheless, a technique that could independently determine the effective mass (more precisely, the ratio of charge carrier concentration to effective mass) and the scattering rate is highly desirable. Here we show that the optical conductivity can in principle accomplish this goal, albeit only if the data can be described by the simple Drude form. As this is, however, typically not the case in the strange metal regime, we discuss approaches based on dynamical scaling as the way forward.
In this perspective paper, we start by introducing the Drude model of the optical conductivity in the notation used here (Section 2), and the Planckian scattering analysis based on this model (Section 3). Next, we use this description to first analyse the optical conductivity of simple, non-interacting materials at high temperatures, where the scattering from phonons leads to a linear-in-temperature dc resistivity (Section 4). Then we try to apply this Drude-based Planckian scattering scheme to the optical conductivity of YbRh2Si2 (Section 5). As anticipated, the strong deviation from Drude behavior in the compound’s strange metal regime limits this analysis to temperatures and frequencies outside this regime, where Drude behavior is recovered. Section 6 is devoted to dynamical scaling analyses, which are the appropriate tool to characterize strange metal optical conductivities. In Section 7, we propose a scheme that can determine a relevant strange metal relaxation rate—without resorting to a Drude description—provided that data in the relevant temperature and frequency regimes can be obtained. Before closing with a discussion and outlook (Section 9), we comment on the relation of the temperature and frequency dependences of the optical conductivity in the Fermi liquid regime (Section 8).
2 Drude formulation of the optical conductivity
In the Drude model, conduction electrons in solids are described as particles of a classical gas executing diffusive motion with an average relaxation time τ. The equation of motion in the presence of a dc electric field leads to the Drude form of the dc electrical conductivity
where n is the charge carrier concentration, m their effective mass, and −e the electronic charge. In an ac field, a complex, frequency-dependent optical conductivity
results, with the real part
and the imaginary part
We also introduce the plasma frequency
with the permittivity of free space ϵ0.
Frequently, it is useful to discriminate between residual scattering due to defects and intrinsic scattering. In the case of the dc resistivity, this is what underlies the usually adopted forms
and
for Fermi liquids and strange metals, respectively. Here ρ0 and
Within the Drude approach, both σres and σin should have the Drude form of Eq. 2, with τ = τres and τ = τin, respectively.
In special cases, discussed further below, the situation may arise that the residual scattering rate is much smaller than the intrinsic one, such that
One can then rewrite Eq. 2 as
3 Drude analysis of the optical conductivity for Planckian scattering analysis
Previous attempts to characterize strange metal behavior in terms of Planckian scattering using dc conductivity data faced the problem that the scattering time τ appears in a product with the ratio of charge carrier concentration to mass, n/m; see Eq. 1. Thus, to estimate τ or, more precisely, τin and compare it with the Planckian time
as typically done by quantifying the coefficient
required the knowledge of n/m, as seen explicitly by inserting Eqs 1, 7 to obtain
Because extracting n and m from different physical quantities gave different results, this led to conflicting conclusions, as discussed in (Taupin and Paschen, 2022).
Here we propose an analysis of the optical conductivity that can, in principle, avoid this problem. As can be seen from Eq. 2, in addition to appearing in a product with n/m (in the prefactor), τ enters as the only parameter in the second factor of σ(ω). Thus, fitting the Drude form to the (intrinsic) optical conductivity data allows one to extract τin and n/m independently. One can therefore determine α directly via Eq. 12 or, in combination with dc data in the linear-in-temperature regime (which gives A′), using Eq. 13. We once again emphasize that this analysis scheme requires the data to have the Drude form. We will come back to this important point in Section 5.
4 Drude-like optical conductivity of lead, aluminum, and silicon
As discussed in Section 1, strange metal behavior refers to the unusual properties exhibited by a number of strongly correlated electron systems at low temperatures, most notably a linear-in-temperature electrical resistivity where a normal metal would exhibit Fermi liquid behavior. However, this temperature dependence can also arise from entirely different physics, that of electrons scattered by classical (macroscopically populated) phonons at sufficiently high temperatures. This case was included in a previous Planckian dissipation analysis (Bruin et al., 2013), and we revisit it here with two metals, lead and aluminum, from the perspective of the optical conductivity. Combining the A′ coefficients (.071 μΩcm/K and .01 μΩcm/K, respectively) of their linear-in-temperature dc resistivities at high temperatures with n/m values estimated from quantum oscillation data, α values of 2.7 and 1.1 were obtained (Bruin et al., 2013).
Here we use tabulated optical conductivity data at 300 K (Golovashkin and Motulevich, 1968; Brändli and Sievers, 1972; Shiles et al., 1980; Ordal et al., 1983) and fit the real and imaginary parts using Eqs 3, 4 to obtain a unique parameter set of n/m and τ (Figure 1); the process minimizes the joint standard deviation, which is calculated by adding up the fitting residuals associated with both the real and imaginary parts. Because lead and aluminum are good metals, we can assume Eqs 9, 10 to be fulfilled and thus used the total conductivity without residual resistivity corrections.
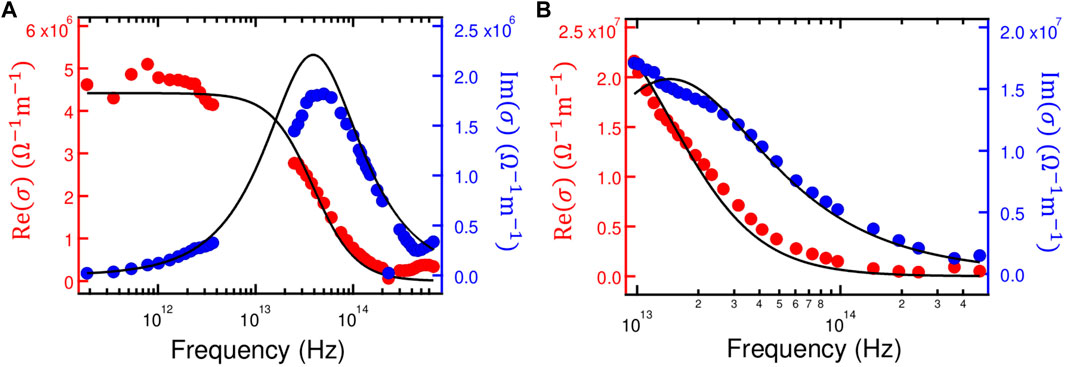
FIGURE 1. Drude fits to the optical conductivity of (A) lead (Pb) and (B) aluminum (Al) at room temperature. The real and imaginary parts of the conductivity are represented as red and blue markers, respectively. The Drude fits are shown as black solid lines. See text for the results. The raw data were obtained from (Golovashkin and Motulevich, 1968; Brändli and Sievers, 1972; Shiles et al., 1980; Ordal et al., 1983).
For lead, we obtain τ = 4.08 ⋅ 10–15 s/rad and n/m = 4.23 ⋅ 1058 m−3kg−1, which gives ατ = 6.3 and αn/m = 5.9 (with the above value for A′). Using the same method for aluminum, we obtain τ = 1.10 ⋅ 10–14 s/rad and n/m = 1.13 ⋅ 1059 m−3kg−1, which gives ατ = 2.3 and αn/m = 2.2. The good agreement between ατ and αn/m indicates internal consistency. For both metals, these α values are about two times larger than the values obtained in (Bruin et al., 2013), pointing to some inaccuracy in the estimation of n/m from quantum oscillation experiments even for simple metals.
For comparison, we also include published optical conductivity data of moderately doped silicon (van Exter and Grischkowsky, 1990) (Figure 2). At room temperature, where the scattering in such samples is known to be dominated by electron-phonon scattering, the scattering times τ obtained from the Drude fits in (van Exter and Grischkowsky, 1990) are 1.33 ⋅ 10–13 s/rad and 2.65 ⋅ 10–13 s/rad for p- and n-type samples of the carrier concentrations 1.1 ⋅ 1015 cm−3 and .42 ⋅ 1015 cm−3 and the effective masses .37m0 and .26m0, respectively (van Exter and Grischkowsky, 1990), where m0 is the free electron mass. This results in ατ = .19 and .096, respectively, at least by a factor of five below the Planckian limit.
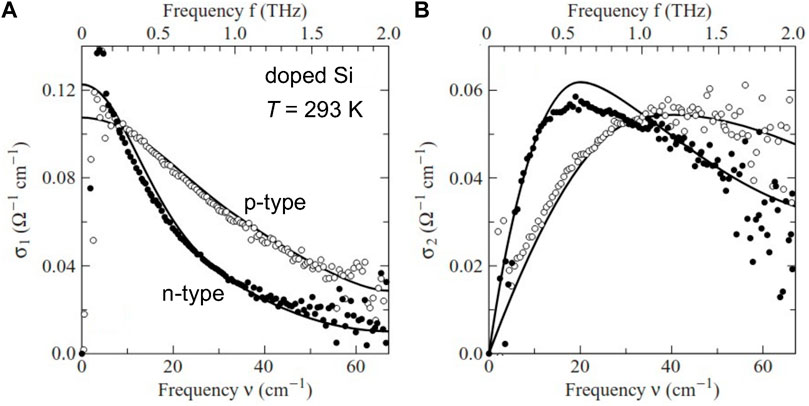
FIGURE 2. Frequency dependence of the (A) real and (B) imaginary parts of the optical conductivity of silicon, weakly doped by holes (1.1 ⋅ 1015 cm−3, open circles) or electrons (4.2 ⋅ 1014 cm−3, solid circles). The experiments were performed at T = 293 K in the time domain; the full lines correspond to Drude fits (see text). Figure adapted from (Dressel and Grüner, 2002), with original data and Drude fits from (van Exter and Grischkowsky, 1990).
Our results for both simple metals and simple semiconductors thus indicate that the scattering of electrons by classical phonons can deviate substantially from Planckian scattering (where α ≈ 1).
5 Drude contribution to the optical conductivity of YbRh2Si2
Next we address the optical conductivity of the heavy fermion compound YbRh2Si2. Strong correlations are known to push the Drude response of metals to low frequencies, frequently outside the range of standard spectrometers, making pertinent experiments on these materials challenging. When optical reflectivity measurements are used, the Kramers–Kronig transformation is needed to extract the optical conductivity. This may induce considerable uncertainty at low frequencies. These problems were overcome in a recent study on YbRh2Si2 thin films grown by molecular beam epitaxy (MBE) and measured by terahertz (THz) time-domain transmission spectroscopy (Prochaska et al., 2020). The data were shown to exhibit dynamical scaling in the strange metal regime, which we will come back to in Section 6. Here, we first examine whether a Drude description is possible in any frequency and temperature range such that the above Planckian dissipation analysis can be performed.
As shown in the Supplementary Figure S3 of Prochaska et al. (2020), only the highest-temperature Re[σ(ω)] data of YbRh2Si2 are well described by a simple Drude model across the entire available frequency range (.23–2.6 THz). At lower temperatures, pronounced deviations appear at low frequencies. In Figure 3A, we replot the real part of the frequency dependent intrinsic optical conductivity from (Prochaska et al., 2020) at different fixed temperatures between 20 and 150 K. The black lines are Drude fits to data at frequencies above 1.5 THz. Deviations from Drude behavior at lower frequencies become stronger with decreasing temperature. Below 20 K, they are so strong that such fits lose any significance (and are therefore discarded). Thus, the Drude description works only outside the material’s strange metal regime, in terms of both temperature and frequency. In the case of the dc resistivity, a non-thermal tuning parameter was used to tune the material into its Fermi liquid (and Drude) regime (Taupin and Paschen, 2022); to do the same with optical conductivity would require data at lower temperatures and frequencies—an interesting study for future work. The parameters n/m and 1/τ extracted from our high-temperature and high-frequency Drude fits are shown as a function of temperature in Figure 3B, C, respectively. The parameter n/m appears to saturate to 2.3 ⋅ 1056 m−3 kg−1 at the lowest temperatures, which corresponds to a plasma frequency of .54 eV. This is much larger than the expectation of about 45 meV for the background (not quantum critical) heavy Fermi liquid state, as estimated from
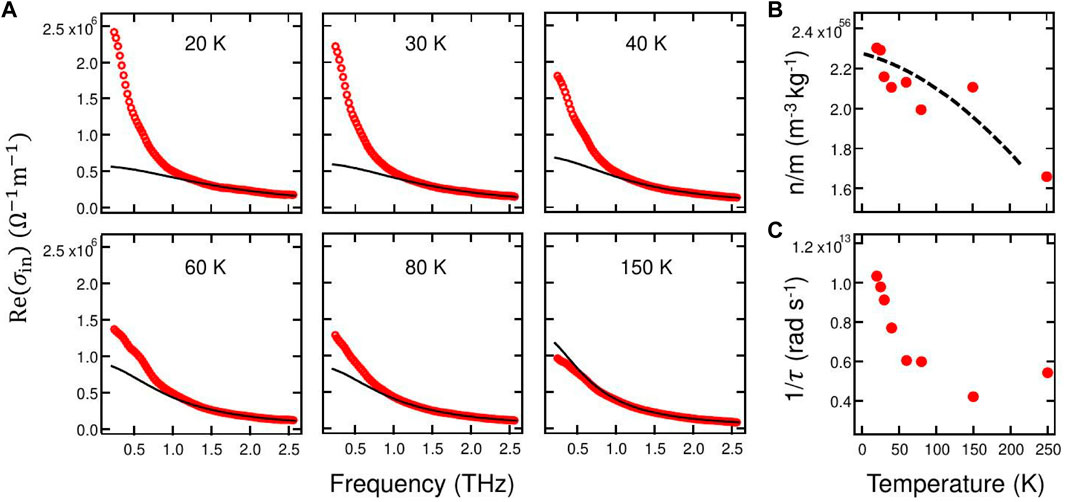
FIGURE 3. (A) Drude fits to the real part of the intrinsic optical conductivity of YbRh2Si2 at various temperatures. The subtraction of the residual resistivity is described in (Prochaska et al., 2020). The fits (black solid lines) are anchored to the high-frequency range of the experimental data (red circles). Strong deviations from Drude behavior are seen at low frequencies, in particular for the low-temperature isotherms. Temperature dependence of the ratio n/m (B) and the scattering rate 1/τ (C) extracted from the Drude fits. The black dashed line is a guide to the eyes for extrapolating the n/m value to T = 0.
We summarize the results of our Drude-based Planckian optical conductivity analyses in Figure 4, which is an expanded version of Figure 4 of Taupin and Paschen (2022). The dark grey squares and broad light grey lines were obtained in (Taupin and Paschen, 2022) by combining the effective mass (determined from the A coefficient of the low-temperature dc electrical resistivity using the Kadowaki–Woods ratio) and the charge carrier concentration (from Hall effect measurements) with the A′ coefficient via Eq. 13. For each material, the square represents the data point closest to the QCP, where the effective mass is largest, and the broad line represents the range of A values measured away from the QCP, with the top end corresponding to the largest tuning parameter separation from the quantum critical value (where the effective mass is smallest). As discussed in (Taupin and Paschen, 2022), it is clear that the α values obtained within this Drude analysis scheme are much smaller than 1, suggesting that the strange metal resistivity of quantum critical heavy fermion compounds cannot be understood as heavy quasiparticles undergoing Planckian dissipation. Also included are αn/m data of selected materials obtained in (Bruin et al., 2013) using published quantum oscillation data (green points). The effective masses of these results are much smaller than those determined through the resistivity, suggesting that quantum oscillation experiments fail to detect the heaviest masses. The α values from (Bruin et al., 2013) thus do not represent the heavy (or heaviest) quasiparticles of the respective compounds, but only lighter ones. This is supported by the fact that for UPt3, the large effective mass renormalization found in transport and thermodynamic measurements was early on confirmed by optical conductivity measurements to be above 160 (Degiorgi et al., 1997), whereas the value found in (Bruin et al., 2013) is less than 50.
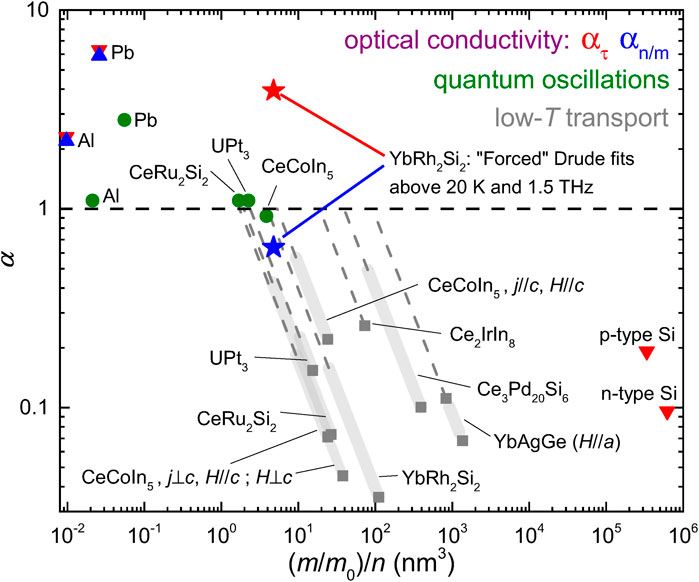
FIGURE 4. Results of various Planckian analyses, in a double-logarithmic plot of α vs. (m/m0)/n. The dark grey squares and the broad light grey lines were obtained in (Taupin and Paschen, 2022) from low-temperature transport measurements. The dashed grey lines are extrapolations to the dashed black α = 1 line of Planckian dissipation. Note that the grey lines—α vs. (m/m0)/n curves obtained from Eq. 13—are straight lines of slope −1 on this double-logarithmic plot, with offsets proportional to A′. The green circles are αn/m values obtained in (Bruin et al., 2013) from quantum oscillation data. The red and blue symbols are ατ and αn/m, respectively, determined in the present work from Drude fits to published optical conductivity data (see text). The fits for Pb, Al, and Si are of good quality in the temperature range where the scattering rates are linear in temperature due to electron-phonon scattering. For YbRh2Si2, by contrast, Drude fits fail in the strange metal regime (below 10–15 K in the dc resistivity). The α values (stars) were therefore extracted from Drude fits to data above 20 K and 1.5 THz, where the fit quality is reasonable. The discrepancy between ατ and αn/m is large in this case, which casts doubt on their significance.
The results of the present analyses are shown as red and blue symbols. The ambiguity of which effective mass and which charge carrier concentration to use is removed in the optical conductivity analysis because both τ and n/m are obtained from the Drude fits. For the simple metals (Pb and Al) and semiconductors (p- and n-type Si) at room temperature, where the resistivities are governed by linear-in-temperature electron-phonon scattering rates, αn/m and ατ agree well (when both are available), confirming that the analysis is robust. At least some of the α values are sizably larger than 1, showing that the Planckian bound is not strictly obeyed in the phonon scattering case. For YbRh2Si2, there is a large discrepancy between αn/m and ατ, indicating that the analysis is not meaningful. As discussed above, the Drude fits describe the optical conductivity only at high temperatures and frequencies, but not in the strange metal regime. The large ατ value is likely dominated by phonons. The fact that αn/m is much larger than the largest α value from the dc resistivity analysis (top end of light grey line) indicates that it describes only weakly renormalized quasiparticles with Drude behavior.
An interesting observation is that the extrapolated zero-temperature value of n/m obtained from our Drude analysis (2.3 ⋅ 1056 m−3kg−1; see Figure 3B) is very similar to the value of 2.2 ⋅ 1056 m−3kg−1 determined in (Prochaska et al., 2020) for the residual resistivity. There, it was calculated from n = 2.6 ⋅ 1028 m−3 as determined in (Paschen et al., 2004) from low-temperature Hall effect measurements and m/m0 ≈ 130 as determined from a deviation (χ2) minimization procedure performed within the dynamical scaling analysis of the data [see Supplementary Figure S5 of Prochaska et al. (2020)]. This may indicate that the quasiparticles described by our Drude fits to Re[σin(ω)] are the same as the ones that undergo residual (likely elastic) scattering. Their n/m ratios suggest only moderate mass renormalization (130 if the single-band interpretation of the Hall coefficient is trusted). The much larger mass renormalizations as extracted from the electronic specific heat coefficient γ or the linear-in-T2 resistivity coefficient A via the Kadowaki–Woods ratio, as done in (Taupin and Paschen, 2022), thus appear to be entirely dynamically generated, and to be part of the non-Drude regime in the optical conductivity even though extracted from Fermi liquid relations of the specific heat and dc resistivity.
6 Dynamical scaling of the intrinsic optical conductivity of strange metals
As seen from Figure 3 and also demonstrated in (Prochaska et al., 2020), Re[σin(ω)] of YbRh2Si2 shows pronounced deviations from Drude behavior at low temperatures and frequencies. These deviations appear to be related to the strange metal behavior of YbRh2Si2, evidenced early on by the low-temperature upturn of the electronic specific heat coefficient setting in somewhat below 30 K and the linear-in-temperature dc (intrinsic) resistivity ρin below 10–15 K (Trovarelli et al., 2000). Indeed, at the lowest temperature of 1.4 K reached in the THz spectroscopy experiments (Prochaska et al., 2020), which corresponds to a frequency kBT/h = .03 THz well below the lowest accessed frequency of .23 THz, 1/Re[σin(ω)] is linear in frequency just as ρin is linear in temperature (Figure 5).
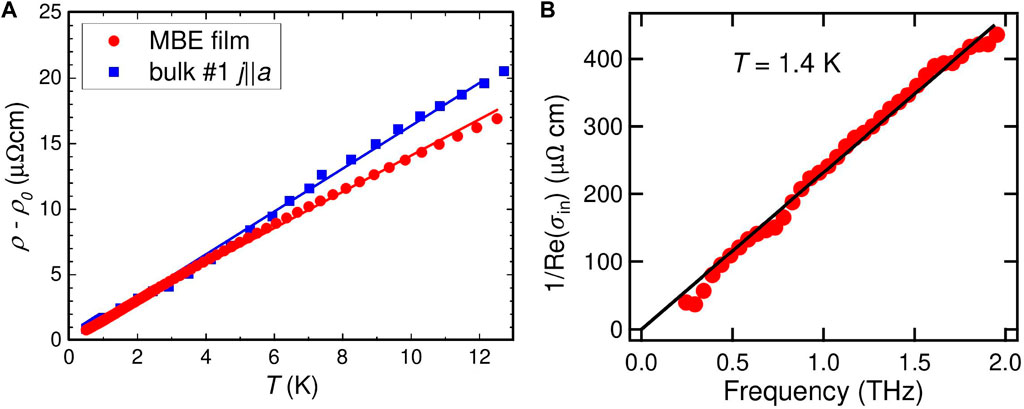
FIGURE 5. Dc and THz resistivity of YbRh2Si2. (A) The dc resistivity is linear in temperature. The slopes of the curve for an MBE film and a bulk single crystal are similar. (B) At 1.4 K, the inverse of the real part of the low-temperature intrinsic optical conductivity, 1/Re(σin), of the MBE film is approximately linear in frequency. Figures from (Prochaska et al., 2020).
One can ask whether the coefficients of the two linear dependences are related, perhaps in a similar way to what is expected for Fermi liquids (see Section 8), namely
From the data in Figure 5 we determine the ratio of a′/b′ to be about .3. In analogy with the ratio a/b = 4π2 predicted for the Fermi liquid case (Section 8) one might have expected
When the energy equivalents of temperature (kBT) and frequency (ℏω) are similar in magnitude, neither the temperature nor the frequency dependence alone can characterize the conductivity of a material. Here, testing scaling relationships in terms of frequency and temperature becomes of crucial importance. For the cuprate Bi2Sr2Ca0.92Y0.08Cu2O8+δ (van der Marel et al., 2003), the scaling behavior
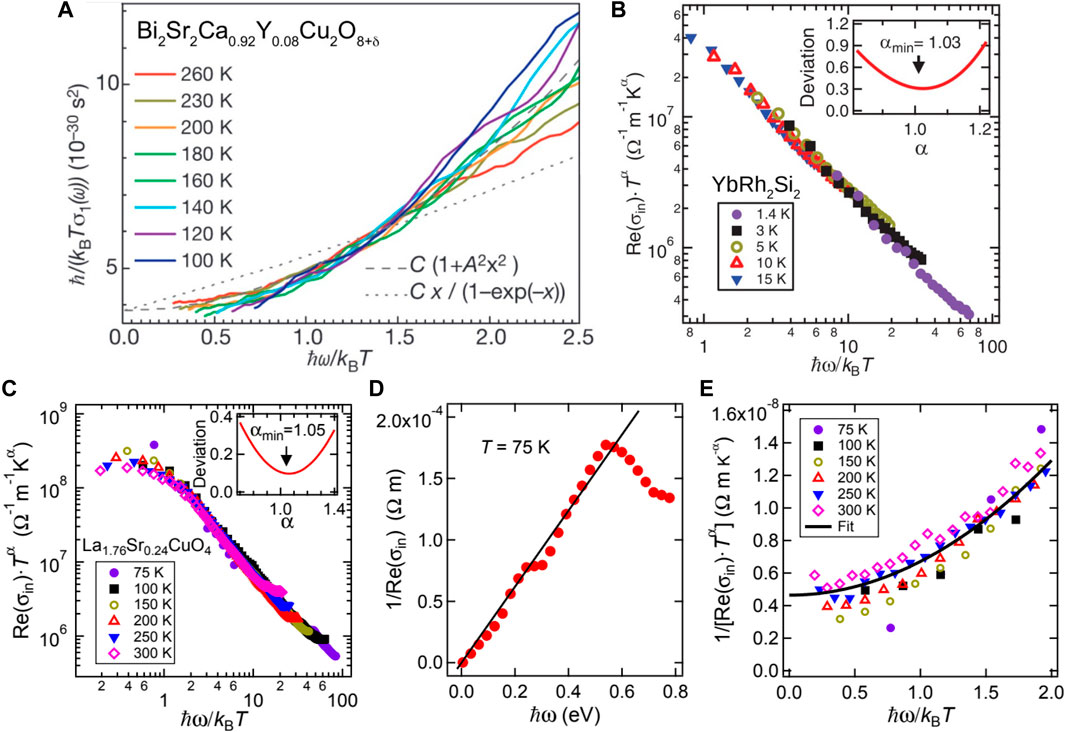
FIGURE 6. Energy-over-temperature scaling of the real part of the optical conductivity of (A) the cuprate Bi2Sr2Ca0.92Y0.08Cu2O8+δ and (B) an MBE film of YbRh2Si2. For the latter, the residual conductivity was subtracted as explained in (Prochaska et al., 2020). Note the different temperature and frequency ranges, above 100 K (above the compound’s superconducting transition temperature Tc = 96 K) and 1.5 THz (far infrared) in the former, and above 1.4 K and .23 THz (THz range) in the latter. In (C) we replot optical conductivity data of La2−xSrxCuO4 with x = .24 from (Michon et al., 2022), after subtracting the residual conductivity (see text), in the same kind of scaling plot as shown in panel (B). Using data below .6 eV, the best scaling collapse is obtained for α ≈ 1 (inset), just as for YbRh2Si2. (D) Optical resistivity 1/Re[σin(ω)] at 75 K, which is approximately linear in frequency up to .6 eV. (E) Fit of the scaled data from panel C with the scaling function defined in Eqs 17, 19, as used in (van der Marel et al., 2003) and (Michon et al., 2022). Panel A is adapted from (van der Marel et al., 2003), panel B from (Prochaska et al., 2020). Data in panel (C–E) are taken from (Michon et al., 2022).
Note that the scaling analysis of (van der Marel et al., 2003) was performed with the total optical conductivity. To examine the influence of the residual resistivity, we used optical conductivity data of the cuprate La2−xSrxCuO4 with x = .24 (which is close to the pseudogap critical point) (Michon et al., 2022) and preformed the correction using Eq. 8. As in (Prochaska et al., 2020), the residual resistivity 1/σres(ω) was calculated by assuming that σres(ω) takes the Drude form, with the dc value ρres = 12.2 μΩ as given in (Michon et al., 2022). The residual scattering rate that appears in σres(ω) was calculated using τres = m/(ne2ρres), where the ratio m/n was estimated from the plasma frequency of around 1 eV given in (Uchida et al., 1991), which is similar to that of YBa2Cu3O6+x (Orenstein et al., 1990). For Re[σin(ω)] determined in this way we attempted the same scaling procedure as in (Prochaska et al., 2020) and found that the best scaling is achieved for the exponent α ≈ 1 (Figure 6C). Some deviation is observed at ℏω/kBT < 1, likely due to the different slope of the dc electrical resistivity at temperatures above 150 K (Michon et al., 2022), which becomes most evident at low frequencies. Nevertheless, the scaling holds over an appreciable temperature and frequency range, which is quite remarkable. Furthermore, at the lowest temperature of 75 K, this scaling is anchored by an optical resistivity 1/Re[σin(ω)] that is linear in frequency over the sizable frequency range of up to .6 eV (Figure 6D), again in close similarity with YbRh2Si2 (Figure 5B).
7 Relaxation rate defined via the scaling form of the optical conductivity
Finally, we turn to the question of how to extract a relaxation rate from the scaling function of the real part of the (intrinsic) optical conductivity. On general grounds, it can be defined in the low-frequency regime ℏω ≪ kBT as
We will show that, provided the strange metal scaling relationship
extends to ℏω/kBT ≪ 1 and such data are available, it may be used to extract a meaningful ω → 0 (but finite T) strange metal relaxation rate. So far, such rates have only been estimated from Drude (or extended- or multi-Drude) fits, which is inappropriate in the strange metal regime. By rewriting this scaling form as
the relaxation rate becomes
We now illustrate the procedure of determining a strange metal relaxation rate using the function
proposed in (van der Marel et al., 2003) to describe the low-frequency Bi2Sr2Ca0.92Y0.08Cu2O8+δ data (dashed curve in Figure 6A, which gave A = .77). Note that this dimensionless coefficient A is distinct from the resistivity A coefficient in Eq. 6. Combined with Eq. 18 this leads to
Comparing this relation with Eq. 12 one can identify 1/A with the coefficient ατ.
We now test this analysis scheme with the Re[σin (ω, T)] data of La1.76Sr0.24CuO4 from Figure 6C. The fit with the scaling function of Eq. 19 describes the data fairly well even up to ℏω/kBT ≈ 2 (Figure 6E), with A = .67 (and thus the Planckian coefficient ατ = 1.5). Note, however, that Eq. 19 is only appropriate in the limit y ≪ 1 (i.e., ℏω ≪ kBT, but still in the strange metal regime). It cannot apply to y ≫ 1, as otherwise it would imply 1/Re[σin (ω, T)] ∼ ω2/T, in contradiction with the linear-in-ω behavior seen in Figure 6D. Indeed, the lowest-temperature data in Figure 6E (75 K, violet circles) are the least well described by the fit. It is clear that higher-resolution data at sufficiently low temperatures, deep in the strange metal regime, and simultaneously in the regime ℏω ≪ kBT are needed to confirm the scaling function and the value of A. Such data will be highly valuable for any strange metal, to conclusively answer the question of whether strange metals are “Planckian”. For the case of YbRh2Si2, this will require optical conductivity data in the microwave regime.
8 Relation of temperature and frequency in the Drude model
As a side aspect, we comment here on the relation between temperature and frequency in Fermi liquids. That a temperature dependent scattering rate should go along with a corresponding frequency dependence was realized early on, and formulated for the Fermi liquid case as (Gurzhi, 1959)
Surprisingly, according to (Scheffler et al., 2013), this relation has remained untested. The challenge is to resolve the frequency dependence of Eq. 21 in the Fermi liquid regime, i.e., at sufficiently low temperatures and frequencies. As shown in (Scheffler et al., 2013), this has not even been possible in heavy fermion compounds, where the prefactors are strongly enhanced (Kadowaki and Woods, 1986; Jacko et al., 2009). In a tour de force effort, the optical conductivity of MBE grown thin films of the heavy fermion compound UPd2Al3 was measured at low temperatures in the microwave regime (Scheffler et al., 2005). The data at 2.75 K (Figure 7A), however, closely follow a simple Drude law, with a frequency independent scattering rate. As a consistency check, the magnitude of the third term in Eq. 21 was estimated from the A coefficient of a bulk polycrystalline sample [A = .23 µΩcm/K2 (Dalichaouch et al., 1992) which, assuming the validity of the Kadowaki–Woods ratio (Kadowaki and Woods, 1986), is consistent with the Sommerfeld coefficient γ0 = 150 mJ/molK2 (Geibel et al., 1991)]. The relative increase of the inverse optical conductivity (Figure 7B) due to the third term was found to be well below the resolution limit of the experiment [less than .1% at 20 GHz (Scheffler, 2021)]. Using the somewhat larger value A = .51 µΩcm/K2 of a UPd2Al3 MBE film (Huth et al., 1993) would not have changed the conclusion.
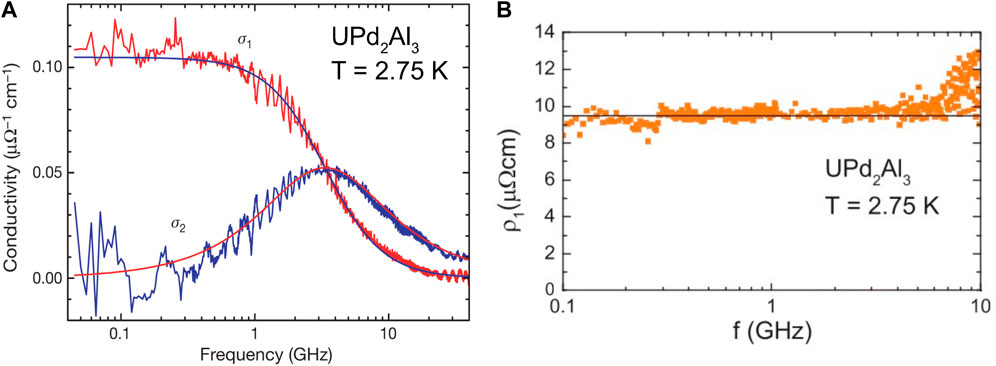
FIGURE 7. Optical conductivity of an MBE film of UPd2Al3 at 2.75 K in the microwave regime. (A) The real and imaginary parts of the conductivity, σ1 and σ2, are shown together with a Drude fit to both components that yielded the parameters σ0 = ne2τ/m = .105 μΩ−1cm−1 and τ = 4.8 ⋅ 10–11 s/rad. (B) Real part of the resistivity, ρ1(ω) = σ1(ω)/|σ(ω)|2, of the same data. The solid line includes the ω2 term estimated as explained in the text. The ω2 upturn is not resolved on the plotted scale. Panels A and B are adapted from (Scheffler et al., 2005) and (Scheffler et al., 2013), respectively.
Another heavy fermion compound on which optical conductivity measurements have been performed to rather low frequencies (10 GHz), and down to 1.2 K, is CeAl3 (Awasthi et al., 1993). Fermi liquid behavior in the dc resistivity, with a very large A coefficient of 35 µΩcm/K2, was reported below 300 mK (Andres et al., 1975). The scattering rate (and the effective mass), extracted using an extended Drude model (see Section 9), indeed show pronounced frequency dependence at low temperatures (Awasthi et al., 1993). Our analysis of these data reveals that, even at the lowest frequencies and temperatures, no clear ω2 dependence is seen. Assuming that the two lowest-frequency data points at 1.2 K represent the slope of an ω2 dependence, we estimate a/b ≈ .24, much smaller than 4π2. Data at even lower frequencies and temperatures will be needed to confirm this result.
9 Summary, discussion, and outlook
In this perspective paper, we have examined published optical conductivity data of various materials to address the question of whether strange metal behavior is captured by Planckian dissipation. The idea of using the optical conductivity instead of the dc resistivity, as was done in previous work (Bruin et al., 2013; Legros et al., 2019; Cao et al., 2020; Ghiotto et al., 2021; Grissonnanche et al., 2021; Mousatov and Hartnoll, 2021; Taupin and Paschen, 2022), was to remove the uncertainty created by estimating the charge carrier concentration and effective mass (or, more precisely, their ratio n/m). Using the Drude form of the optical conductivity can, in principle, overcome this problem because here the scattering time τ enters not only in a product with n/m (as in the dc conductivity σ = ne2τ/m) but also in a second term. This allows one to fit n/m and τ independently. The ratio α of the experimental (inelastic) scattering rate 1/τin to the Planckian scattering rate 1/τP = kBT/ℏ can then be determined.
We tested the method with high-temperature data of simple metals and semiconductors in the range where the resistivity is governed by a linear-in-temperature scattering rate due to electron-phonon scattering, and found it to be reliable. Notably, α can be obtained in two different ways, directly from τin (which we then call ατ) or by combining n/m and the linear-in-temperature dc resistivity coefficient A′ (which we call αn/m), and both gave very similar results for the simple metals.
We then attempted to apply the method to the extreme strange metal YbRh2Si2. However, as already pointed out in (Prochaska et al., 2020), the Drude form of the optical conductivity fails to describe the data at low temperatures and frequencies, which we would have deemed the most appropriate range to characterize the compound’s strange metal state. To achieve reasonable fits, the fitting range has to be constrained to sufficiently high temperatures and frequencies. In this case, a much more modest mass renormalization results than what is obtained by using the dc resistivity at low temperatures, even at tuning parameter values far away from the quantum critical value (Taupin and Paschen, 2022). As a result, both ατ and αn/m are much larger than what was found from the dc resistivity analysis. Furthermore, the large discrepancy between ατ and αn/m resulting from this procedure points to the need for alternative approaches—not based on dc or ac Drude models—to characterize strange metal behavior.
Some researchers have used the “extended” Drude model (Dressel and Grüner, 2002; Michon et al., 2022) to describe optical conductivity data of strongly correlated electron systems. It assumes a complex frequency-dependent relaxation rate 1/τ(ω) = 1/τ1(ω) + i/τ2(ω) and, via
a frequency-dependent effective mass related to it. When introduced into Eq. 2, this can be brought into the generalized Drude form
In practice, what is shown and analysed are typically the quantities
and
but this requires the knowledge of the (unrenormalized) plasma frequency ωp (see Eq. 5). At low frequencies and temperatures, residual scattering may play an important role and should be subtracted, as described in Section 2. The charge carrier concentration n is assumed to be frequency independent in this approach, which may not be true in heavy fermion strange metals (Paschen et al., 2004; Shishido et al., 2005; Friedemann et al., 2010; Custers et al., 2012; Jiao et al., 2015; Martelli et al., 2019) and related materials (Anisimov et al., 2002; Oike et al., 2015; Badoux et al., 2016; Cao et al., 2018; Jia et al., 2020). More generally, in a strange metal, any a priori assumption on n, m, and τ limits the generality and may bias the conclusions. Forcing (extended) Drude forms to the data bears the risk to overlook the essential physics. Strange metals may be governed by exotic excitations or even the absence of any well-defined quasiparticles (Coleman et al., 2001; Si et al., 2001; Senthil et al., 2004; Phillips, 2011; Chang et al., 2018; Patel and Sachdev, 2018; Komijani and Coleman, 2019; Balm et al., 2020; Cai et al., 2020; Cha et al., 2020; Guo et al., 2020; Banerjee et al., 2021; Else and Senthil, 2021; Lee, 2021; Caprara et al., 2022; Wang et al., 2022), so they defy description by the above models and require alternative approaches.
We consider scaling analyses of the (intrinsic) optical conductivity in the strange metal regime to be the most promising way forward. To reliably determine the functional form of the scaling, it will be essential to access, with high-resolution data, both the regime ℏω/kBT ≫ 1 and the regime ℏω/kBT ≪ 1. From such scaling functions, a generalized (non-Drude) relaxation rate can then be determined, and compared to theoretical expectations for strange metals. In strange metals with low energy scales, such as the heavy fermion compounds, the latter will require challenging low-temperature experiments in the microwave regime. When high-quality thin films are available, this can in principle be achieved with the broadband Corbino technique (Scheffler and Dressel, 2005), as demonstrated for the Fermi liquid heavy fermion compound UPd2Al3 (Scheffler et al., 2005) (Figure 7). We note that even in state-of-the-art THz experiments on MBE grown thin films of YbRh2Si2 (Prochaska et al., 2020), this regime was not accessed. This calls for future studies to advance the field.
Data availability statement
The original contributions presented in the study are included in the article, further inquiries can be directed to the corresponding author.
Author contributions
XL performed the Drude and scaling analyses, SP conceived the work and wrote the paper, with input from XL, JK, and QS. All authors contributed to the discussion.
Funding
XL acknowledges support from the Caltech Postdoctoral Prize Fellowship and the IQIM. JK acknowledges support from the Robert A. Welch Foundation through Grant No. C-1509. The work of QS is supported primarily by the Air Force Office of Scientific Research under Grant No. FA9550-21-1–0356, the National Science Foundation Grant No. DMR-2220603 and the Robert A. Welch Foundation under Grant No. C-1411. SP acknowledges funding from the European Union’s Horizon 2020 Research and Innovation Programme under Grant Agreement no 824109 and from the Austrian Science Fund (FWF Grants 29296-N27 and I5868-N–FOR 5249 - QUAST). SP and QS acknowledge the hospitality of the Aspen Center for Physics, which is supported by NSF grant No. PHY-1607611.
Acknowledgments
We acknowledge fruitful discussions with Peter Armitage, Antoine Georges, Patrick Lee, Subir Sachdev, Marc Scheffler, T. Senthil, Mathieu Taupin, and Eric van Heumen.
Conflict of interest
The authors declare that the research was conducted in the absence of any commercial or financial relationships that could be construed as a potential conflict of interest.
Publisher’s note
All claims expressed in this article are solely those of the authors and do not necessarily represent those of their affiliated organizations, or those of the publisher, the editors and the reviewers. Any product that may be evaluated in this article, or claim that may be made by its manufacturer, is not guaranteed or endorsed by the publisher.
References
Andres, K., Graebner, J. E., and Ott, H. R. (1975). 4f-virtual-bound-state formation in CeAl3 at low temperatures. Phys. Rev. Lett. 35, 1779. doi:10.1103/PhysRevLett.35.1779
Anisimov, V., Nekrasov, I., Kondakov, D., Rice, T., and Sigrist, M. (2002). Orbital-selective Mott-insulator transition in Ca2−xSrxRuO4. Eur. Phys. J. B 25, 191. doi:10.1140/epjb/e20020021
Awasthi, A. M., Degiorgi, L., Grüner, G., Dalichaouch, Y., and Maple, M. B. (1993). Complete optical spectrum of CeAl3. Phys. Rev. B 48, 10692–10700. doi:10.1103/PhysRevB.48.10692
Badoux, S., Tabis, W., Laliberté, F., Grissonnanche, G., Vignolle, B., Vignolles, D., et al. (2016). Change of carrier density at the pseudogap critical point of a cuprate superconductor. Nature 531, 210–214. doi:10.1038/nature16983
Balm, F., Krikun, A., Romero-Bermúdez, A., Schalm, K., and Zaanen, J. (2020). Isolated zeros destroy Fermi surface in holographic models with a lattice. J. High. Energy Phys. 2020, 151. doi:10.1007/JHEP01(2020)151
Banerjee, A., Grandadam, M., Freire, H., and Pépin, C. (2021). Strange metal from incoherent bosons. Phys. Rev. B 104, 054513. doi:10.1103/PhysRevB.104.054513
Brändli, G., and Sievers, A. J. (1972). Absolute measurement of the far-infrared surface resistance of Pb. Phys. Rev. B 5, 3550–3557. doi:10.1103/PhysRevB.5.3550
Bruin, J. A. N., Sakai, H., Perry, R. S., and Mackenzie, A. P. (2013). Similarity of scattering rates in metals showing T-linear resistivity. Science 339, 804–807. doi:10.1126/science.1227612
Cai, A., Yu, Z., Hu, H., Kirchner, S., and Si, Q. (2020). Dynamical scaling of charge and spin responses at a Kondo destruction quantum critical point. Phys. Rev. Lett. 124, 027205. doi:10.1103/PhysRevLett.124.027205
Cao, Y., Chowdhury, D., Rodan-Legrain, D., Rubies-Bigorda, O., Watanabe, K., Taniguchi, T., et al. (2020). Strange metal in magic-angle graphene with near Planckian dissipation. Phys. Rev. Lett. 124, 076801. doi:10.1103/PhysRevLett.124.076801
Cao, Y., Fatemi, V., Fang, S., Watanabe, K., Taniguchi, T., Kaxiras, E., et al. (2018). Unconventional superconductivity in magic-angle graphene superlattices. Nature 556, 43–50. doi:10.1038/nature26160
Caprara, S., Castro, C. D., Mirarchi, G., Seibold, G., and Grilli, M. (2022). Dissipation-driven strange metal behavior. Commun. Phys. 5, 10. doi:10.1038/s42005-021-00786-y
Cha, P., Wentzell, N., Parcollet, O., Georges, A., and Kim, E.-A. (2020). Linear resistivity and Sachdev-Ye-Kitaev (SYK) spin liquid behavior in a quantum critical metal with spin-1/2 fermions. Proc. Natl. Acad. Sci. U.S.A. 117, 18341–18346. doi:10.1073/pnas.2003179117
Chang, Y.-Y., Paschen, S., and Chung, C.-H. (2018). Mechanism of a strange metal state near a heavy-fermion quantum critical point. Phys. Rev. B 97, 035156. doi:10.1103/PhysRevB.97.035156
Coleman, P., Pépin, C., Si, Q., and Ramazashvili, R. (2001). How do Fermi liquids get heavy and die? J. Phys. Condens. Matter 13, R723–R738. doi:10.1088/0953-8984/13/35/202
Custers, J., Lorenzer, K., Müller, M., Prokofiev, A., Sidorenko, A., Winkler, H., et al. (2012). Destruction of the Kondo effect in the cubic heavy-fermion compound Ce3Pd20Si6. Nat. Mater. 11, 189–194. doi:10.1038/nmat3214
Dalichaouch, Y., de Andrade, M. C., and Maple, M. B. (1992). Superconducting and magnetic properties of the heavy-fermion compounds UT2Al3 (T=Ni, Pd). Phys. Rev. B 46, 8671–8674. doi:10.1103/PhysRevB.46.8671
Degiorgi, L., Thieme, S., Ott, H. R., Dressel, M., Grüner, G., Dalichaouch, Y., et al. (1997). The electrodynamic response of heavy-electron materials with magnetic phase transitions. Z. Phys. B 102, 367–380. doi:10.1007/s002570050300
Dressel, M., and Grüner, G. (2002). Electrodynamics of solids. Cambridge: Cambridge University Press.
Else, D. V., and Senthil, T. (2021). Strange metals as ersatz fermi liquids. Phys. Rev. Lett. 127, 086601. doi:10.1103/PhysRevLett.127.086601
Fang, Y., Grissonnanche, G., Legros, A., Verret, S., Laliberté, F., Collignon, C., et al. (2022). Fermi surface transformation at the pseudogap critical point of a cuprate superconductor. Nat. Phys. 18, 558–564. doi:10.1038/s41567-022-01514-1
Friedemann, S., Oeschler, N., Wirth, S., Krellner, C., Geibel, C., Steglich, F., et al. (2010). Fermi-surface collapse and dynamical scaling near a quantum-critical point. Proc. Natl. Acad. Sci. U.S.A. 107, 14547–14551. doi:10.1073/pnas.1009202107
Geibel, C., Schank, C., Thies, S., Kitazawa, H., Bredl, C. D., Böhm, A., et al. (1991). Heavy-fermion superconductivity at Tc = 2 K in the antiferromagnet UPd2Al3. Z. Phys. B 84, 1–2. doi:10.1007/BF01453750
Ghiotto, A., Shih, E.-M., Pereira, G. S. S. G., Rhodes, D. A., Kim, B., Zang, J., et al. (2021). Quantum criticality in twisted transition metal dichalcogenides. Nature 597, 345–349. doi:10.1038/s41586-021-03815-6
Golovashkin, A., and Motulevich, G. (1968). Optical properties of lead in the visible and infrared spectral ranges. JETP 26, 881–887.
Grissonnanche, G., Fang, Y., Legros, A., Verret, S., Laliberté, F., Collignon, C., et al. (2021). Linear-in temperature resistivity from an isotropic Planckian scattering rate. Nature 595, 667–672. doi:10.1038/s41586-021-03697-8
Guo, H., Gu, Y., and Sachdev, S. (2020). Linear in temperature resistivity in the limit of zero temperature from the time reparameterization soft mode. Ann. Phys. 418, 168202. doi:10.1016/j.aop.2020.168202
Hertz, J. A. (1976). Quantum critical phenomena. Phys. Rev. B 14, 1165–1184. doi:10.1103/PhysRevB.14.1165
Hlubina, R., and Rice, T. M. (1995). Resistivity as a function of temperature for models with hot spots on the Fermi surface. Phys. Rev. B 51, 9253–9260. doi:10.1103/PhysRevB.51.9253
Huth, M., Kaldowski, A., Hessert, J., Steinborn, T., and Adrian, H. (1993). Preparation and characterization of thin films of the heavy fermion superconductor UPd2Al3. Solid State Commun. 87, 1133–1136. doi:10.1016/0038-1098(93)90816-6
Jacko, A. C., Fjaerestad, J. O., and Powell, B. J. (2009). A unified explanation of the Kadowaki–Woods ratio in strongly correlated metals. Nat. Phys. 5, 422–425. doi:10.1038/nphys1249
Jia, Y.-T., Gong, C.-S., Liu, Y.-X., Zhao, J.-F., Dong, C., Dai, G.-Y., et al. (2020). Mott transition and superconductivity in quantum spin liquid candidate NaYbSe2. Chin. Phys. Lett. 37, 097404. doi:10.1088/0256-307X/37/9/097404
Jiao, L., Chen, Y., Kohama, Y., Graf, D., Bauer, E. D., Singleton, J., et al. (2015). Fermi surface reconstruction and multiple quantum phase transitions in the antiferromagnet CeRhIn5. Proc. Natl. Acad. Sci. U.S.A. 112, 673–678. doi:10.1073/pnas.1413932112
Kadowaki, K., and Woods, S. B. (1986). Universal relationship of the resistivity and specific heat in heavy-fermion compounds. Solid State Commun. 58, 507–509. doi:10.1016/0038-1098(86)90785-4
Kirchner, S., Paschen, S., Chen, Q., Wirth, S., Feng, D., Thompson, J. D., et al. (2020). Colloquium: Heavy-electron quantum criticality and single-particle spectroscopy. Rev. Mod. Phys. 92, 011002. doi:10.1103/RevModPhys.92.011002
Komijani, Y., and Coleman, P. (2019). Emergent critical charge fluctuations at the Kondo breakdown of heavy fermions. Phys. Rev. Lett. 122, 217001. doi:10.1103/PhysRevLett.122.217001
Küchler, R., Oeschler, N., Gegenwart, P., Cichorek, T., Neumaier, K., Tegus, O., et al. (2003). Divergence of the Grüneisen ratio at quantum critical points in heavy fermion metals. Phys. Rev. Lett. 91, 066405. doi:10.1103/PhysRevLett.91.066405
Lee, P. A. (2021). Low-temperature T-linear resistivity due to umklapp scattering from a critical mode. Phys. Rev. B 104, 035140. doi:10.1103/PhysRevB.104.035140
Legros, A., Benhabib, S., Tabis, W., Laliberté, F., Dion, M., Lizaire, M., et al. (2019). Universal T-linear resistivity and Planckian dissipation in overdoped cuprates. Nat. Phys. 15, 142–147. doi:10.1038/s41567-018-0334-2
Martelli, V., Cai, A., Nica, E. M., Taupin, M., Prokofiev, A., Liu, C.-C., et al. (2019). Sequential localization of a complex electron fluid. Proc. Natl. Acad. Sci. U.S.A. 116, 17701–17706. doi:10.1073/pnas.1908101116
Michon, B., Berthod, C., Rischau, C. W., Ataei, A., Chen, L., Komiya, S., et al. (2022). Planckian behavior of cuprate superconductors: Reconciling the scaling of optical conductivity with resistivity and specific heat. arXiv:2205.04030.
Millis, A. J. (1993). Effect of a nonzero temperature on quantum critical points in itinerant fermion systems. Phys. Rev. B 48, 7183–7196. doi:10.1103/PhysRevB.48.7183
Millis, A. J., and Lee, P. A. (1987). Large-orbital-degeneracy expansion for the lattice Anderson model. Phys. Rev. B 35, 3394–3414. doi:10.1103/PhysRevB.35.3394
Moriya, T., and Takimoto, T. (1995). Anomalous properties around magnetic instability in heavy electron systems. J. Phys. Soc. Jpn. 64, 960–969. doi:10.1143/JPSJ.64.960
Mousatov, C. H., and Hartnoll, S. A. (2021). Phonons, electrons and thermal transport in Planckian high-Tc materials. npj Quantum Mater. 6, 81. doi:10.1038/s41535-021-00383-w
Nguyen, D. H., Sidorenko, A., Taupin, M., Knebel, G., Lapertot, G., Schuberth, E., et al. (2021). Superconductivity in an extreme strange metal. Nat. Commun. 12, 4341. doi:10.1038/s41467-021-24670-z
Oike, H., Miyagawa, K., Taniguchi, H., and Kanoda, K. (2015). Pressure-induced Mott transition in an organic superconductor with a finite doping level. Phys. Rev. Lett. 114, 067002. doi:10.1103/PhysRevLett.114.067002
Ordal, M. A., Long, L. L., Bell, R. J., Bell, S. E., Bell, R. R., Alexander, R. W., et al. (1983). Optical properties of the metals Al, Co, Cu, Au, Fe, Pb, Ni, Pd, Pt, Ag, Ti, and W in the infrared and far infrared. Appl. Opt. 22, 1099–1119. doi:10.1364/AO.22.001099
Orenstein, J., Thomas, G. A., Millis, A. J., Cooper, S. L., Rapkine, D. H., Timusk, T., et al. (1990). Frequency- and temperature-dependent conductivity in yba2cu3o6+x crystals. Phys. Rev. B 42, 11605–11608. doi:10.1103/physrevb.41.11605
Paschen, S., Lühmann, T., Wirth, S., Gegenwart, P., Trovarelli, O., Geibel, C., et al. (2004). Hall-effect evolution across a heavy-fermion quantum critical point. Nature 432, 881–885. doi:10.1038/nature03129
Paschen, S., and Si, Q. (2021a). Quantum phases driven by strong correlations. Nat. Rev. Phys. 3, 9–26. doi:10.1038/s42254-020-00262-6
Paschen, S., and Si, Q. (2021b). The many faces (phases) of strong correlations. Europhys. News 52/4, 18–20. doi:10.1051/epn/2021403
Patel, A. A., and Sachdev, S. (2018). Critical strange metal from fluctuating gauge fields in a solvable random model. Phys. Rev. B 98, 125134. doi:10.1103/PhysRevB.98.125134
Phillips, P. (2011). Mottness collapse and T-linear resistivity in cuprate superconductors. Phil. Trans. R. Soc. A 369, 1574–1598. doi:10.1098/rsta.2011.0004
Prochaska, L., Li, X., MacFarland, D. C., Andrews, A. M., Bonta, M., Bianco, E. F., et al. (2020). Singular charge fluctuations at a magnetic quantum critical point. Science 367, 285–288. doi:10.1126/science.aag1595
Rosch, A. (1999). Interplay of disorder and spin fluctuations in the resistivity near a quantum critical point. Phys. Rev. Lett. 82, 4280–4283. doi:10.1103/PhysRevLett.82.4280
Sachdev, S. (1999). Quantum phase transitions. Cambridge University Press. doi:10.1017/CBO9780511973765
Scheffler, M., and Dressel, M. (2005). Broadband microwave spectroscopy in Corbino geometry for temperatures down to 1.7 K. Rev. Sci. Instrum. 76, 074702. doi:10.1063/1.1947881
Scheffler, M., Dressel, M., Jourdan, M., and Adrian, H. (2005). Extremely slow Drude relaxation of correlated electrons. Nature 438, 1135–1137. doi:10.1038/nature04232
Scheffler, M. (2021). Private communication; the sentence “Even at 20 GHz, the increase in ρ1 compared to the dc value is only 6 ⋅ 10−5 and thus far too small to be observed” in Scheffler et al. (2013) should be corrected to “Even at 20 GHz, the relative increase in ρ1 compared to the dc value is only 6 ⋅ 10−4 and thus far too small to be observed.”
Scheffler, M., Schlegel, K., Clauss, C., Hafner, D., Fella, C., Dressel, M., et al. (2013). Microwave spectroscopy on heavy-fermion systems: Probing the dynamics of charges and magnetic moments. Phys. Status Solidi B 250, 439–449. doi:10.1002/pssb.201200925
Schröder, A., Aeppli, G., Coldea, R., Adams, M., Stockert, O., Löhneysen, v. H., et al. (2000). Onset of antiferromagnetism in heavy-fermion metals. Nature 407, 351–355. doi:10.1038/35030039
Senthil, T., Vojta, M., and Sachdev, S. (2004). Weak magnetism and non-Fermi liquids near heavy-fermion critical points. Phys. Rev. B 69, 035111. doi:10.1103/PhysRevB.69.035111
Shiles, E., Sasaki, T., Inokuti, M., and Smith, D. Y. (1980). Self-consistency and sum-rule tests in the Kramers-Kronig analysis of optical data: Applications to aluminum. Phys. Rev. B 22, 1612–1628. doi:10.1103/PhysRevB.22.1612
Shishido, H., Settai, R., Harima, H., and Onuki, Y. (2005). A drastic change of the fermi surface at a critical pressure in CeRhIn5: dHvA study under pressure. J. Phys. Soc. Jpn. 74, 1103–1106. doi:10.1143/JPSJ.74.1103
Si, Q., Rabello, S., Ingersent, K., and Smith, J. (2001). Locally critical quantum phase transitions in strongly correlated metals. Nature 413, 804–808. doi:10.1038/35101507
Stewart, G. R. (1984). Heavy-fermion systems. Rev. Mod. Phys. 56, 755–787. doi:10.1103/RevModPhys.56.755
Taupin, M., and Paschen, S. (2022). Are heavy fermion strange metals Planckian? Crystals 12, 251. doi:10.3390/cryst12020251
Trovarelli, O., Geibel, C., Mederle, S., Langhammer, C., Grosche, F. M., Gegenwart, P., et al. (2000). YbRh2Si2: Pronounced non-Fermi-liquid effects above a low-lying magnetic phase transition. Phys. Rev. Lett. 85, 626–629. doi:10.1103/PhysRevLett.85.626 Note: The correct estimate of the single ion Kondo scale is the temperature where the integrated entropy reaches 0.65 ln 2, not 0.45 ln 2. This gives a single ion Kondo temperature of 25 K instead of 10 K.
Uchida, S., Ido, T., Takagi, H., Arima, T., Tokura, Y., and Tajima, S. (1991). Optical spectra of La2−xSrxCuO4: Effect of carrier doping on the electronic structure of the CuO2 plane. Phys. Rev. B 43, 7942–7954. doi:10.1103/PhysRevB.43.7942
v. Löhneysen, H., Rosch, A., Vojta, M., and Wölfle, P. (2007). Fermi-liquid instabilities at magnetic quantum phase transitions. Rev. Mod. Phys. 79, 1015–1075. doi:10.1103/RevModPhys.79.1015
van der Marel, D., Molegraaf, H. J. A., Zaanen, J., Nussinov, Z., Carbone, F., Damascelli, A., et al. (2003). Quantum critical behaviour in a high Tc superconductor. Nature 425, 271–274. doi:10.1038/nature01978
van Exter, M., and Grischkowsky, D. (1990). Carrier dynamics of electrons and holes in moderately doped silicon. Phys. Rev. B 41, 12140–12149. doi:10.1103/PhysRevB.41.12140
Wang, J., Chang, Y.-Y., and Chung, C.-H. (2022). A mechanism for the strange metal phase in rare-earth intermetallic compounds. Proc. Natl. Acad. Sci. U.S.A. 119, e2116980119. doi:10.1073/pnas.2116980119
Keywords: strange metals, Planckian scattering, optical conductivity, Drude model, heavy fermion compounds, quantum criticality, dynamical scaling, cuprates
Citation: Li X, Kono J, Si Q and Paschen S (2023) Is the optical conductivity of heavy fermion strange metals Planckian?. Front. Electron. Mater. 2:934691. doi: 10.3389/femat.2022.934691
Received: 02 May 2022; Accepted: 28 December 2022;
Published: 25 January 2023.
Edited by:
Vidya Madhavan, University of Illinois at Urbana-Champaign, United StatesReviewed by:
Weiwei Xie, The State University of New Jersey, United StatesPedro Schlottmann, Florida State University, United States
Copyright © 2023 Li, Kono, Si and Paschen. This is an open-access article distributed under the terms of the Creative Commons Attribution License (CC BY). The use, distribution or reproduction in other forums is permitted, provided the original author(s) and the copyright owner(s) are credited and that the original publication in this journal is cited, in accordance with accepted academic practice. No use, distribution or reproduction is permitted which does not comply with these terms.
*Correspondence: Silke Paschen, cGFzY2hlbkBpZnAudHV3aWVuLmFjLmF0