 N. Pouse1,2Y. Deng1,2
 S. Ran1,2†D. Graf3Y. Lai3J. Singleton4,5F. F. Balakirev4
 R. E. Baumbach3,6
 M. B. Maple1,2*
- 1Department of Physics, University of California, San Diego, La Jolla, CA, United States
- 2Center for Advanced Nanoscience, University of California, San Diego, La Jolla, CA, United States
- 3National High Magnetic Field Laboratory, Florida State University, Tallahassee, FL, United States
- 4National High Magnetic Field Laboratory, Los Alamos National Laboratory, Los Alamos, NM, United States
- 5Department of Physics, The Clarendon Laboratory, University of Oxford, Oxford, United Kingdom
- 6Department of Physics, Florida State University, Tallahassee, FL, United States
The correlated f-electron compound URu2Si2 exhibits superconductivity (SC) with a critical temperature Tc = 1.5 K that coexists with the “hidden order” (HO) phase that forms below a characteristic temperature T0 = 17.5 K. The SC of URu2Si2 appears to be spin singlet chiral SC with d-wave order parameter symmetry, and the pairing of SCing electrons may involve spin excitations of the HO phase. Electrical resistance R measurements were performed on single crystal specimens of URu2−xFexSi2 with increasing x throughout the transition from the HO phase to the large moment antiferromagnetic LMAFM phase in high magnetic fields H oriented at various angles θ with respect to the tetragonal c-axis. Measurements of R(θ) at H = 20, 33, 40, and 45 T were conducted in the temperature range 0.33 ≤ T ≤ 20 K and showed θ-dependent behavior in the various phase transitions of URu2−xFexSi2 (HO, LMAFM, spin density wave, Fermi surface reconstruction, etc.). These phase transitions, as functions of T, H, and θ are plotted in a phase diagram of T vs. H//c = Hcosθ for multiple values of x and show that H//c, not θ is a tuning parameter of the URu2−xFexSi2 system throughout all Fe concentrations, as previously found by Scheereret al. for the URu2Si2 parent compound.
1 Introduction
The heavy fermion superconductor (SCor) URu2Si2 has attracted an enormous amount of interest among correlated electron materials because of the wealth of extraordinary phases and phenomena it harbors in the phase space of atomic substituent composition x, pressure P, and magnetic field H. Two of these phases, the so-called “hidden order” (HO) phase and the unconventional superconducting (SCing) phase, are of particular interest and appear to be interrelated. Researchers have been especially intrigued by the HO phase, since the features in its transport, thermal and magnetic properties are prominent but its order pB27arameter has not been identified after more than 3–1/2 decades of research on URu2Si2 based materials (Mydosh and Oppeneer, 2011; Mydosh and Oppeneer, 2014; Mydosh et al., 2020). The superconductivity (SC) is also unique and appears to be spin singlet chiral SC with d-wave order parameter symmetry in which the pairing of SCing electrons may involve spin excitations of the HO phase.
We note that the HO phase of URu2Si2 has been studied extensively by means of various types of physical properties measurements via tuning of non-thermal parameters such as P (McElfresh et al., 1987; Butch et al., 2010; Hassinger et al., 2010), H (Jo et al., 2007) and x, in, for example, URu2−xMxSi2 (where M = Fe (Kanchanavatee et al., 2011), Os (Kanchanavatee et al., 2017), Re (Bauer et al., 2005; Butch and Maple, 2009), etc.), U1−xThxRu2Si2 (de la Torre et al., 1992), and URu2Si2−xPx (Gallagher et al., 2016). In the present study, we have focused on URu2−xFexSi2 in magnetic fields H oriented at angles θ with respect to the tetragonal c-axis, where the tuning parameters are x, H and θ. This study complements a study of the URu2Si2 parent compound involving the tuning parameters H and θ by Scheereret al. (Scheerer et al., 2012; Scheerer et al., 2014).
Early experiments–HO and SC: partial gapping scenario
In the earliest experiments on URu2Si2, features in the electrical resistivity ρ(T), magnetic susceptibility χ(T), and specific heat C(T) were observed at a temperature T0 = 17.5 K, signaling a transition to an ordered state, followed by a SCing transition at a critical temperature Tc = 1.5 K (Palstra et al., 1985; Maple et al., 1986; Schlabitz et al., 1986). It was noted that the anomalies in these properties at T0 are reminiscent of a charge or spin density wave (CDW or SDW) transition (Maple et al., 1986). Analysis of the electronic specific heat led to the proposal of a “partial gapping” scenario in which the phase that develops below T0 forms a gap of about 100 K over about 40% of the Fermi surface (FS) (Maple et al., 1986). The value of the gap was derived from the exponential T-dependence of the BCS-like mean field anomaly in the electronic specific heat below T0, while the amount of the FS that is gapped was estimated from the reduction in the electronic specific heat coefficient γ as T → 0 K relative to its value above T0, where γ is assumed to be proportional to the density of states (N (EF)) at the Fermi level (EF). The energy gap has been measured using various spectroscopic techniques and found to be close to the value estimated from the specific heat anomaly (Mydosh and Oppeneer, 2014). The remainder of the FS is gapped by the SC that occurs below Tc.
Temperature vs. pressure phase diagram: HO–LMAFM phase transition
Experiments on URu2Si2 under pressure have provided important clues about the HO phase and its relation to the SCing phase, as well as to other phases. Upon application of pressure, there is a first order phase transition from the HO phase to a large moment antiferromagnetic (LMAFM) phase and a concomitant suppression of the SCing phase where Tc approaches 0 K near ∼ 8 kbar, the critical pressure where the HO-LMAFM transition occurs at very low temperature (Butch et al., 2010). The SCing phase appears to coexist with the HO phase and be suppressed by the LMAFM phase (Hassinger et al., 2008; Butch et al., 2010), suggesting that the pairing of SCing electrons may be associated with particular types of spin excitations which are present in the HO phase but absent in the LMAFM phase.
The application of high pressure reveals that the phase boundary between the paramagnetic (PM) and HO/LMAFM phases increases with P in the HO phase, exhibits a kink at 15 kbar, the critical pressure (Pc) where the HO-LMAFM transition occurs, and increases with P with a larger slope in the LMAFM region. The concomitant increase of T0 and decrease of Tc with P is consistent with an increase of the area of the FS gapped by the HO phase at the expense of the FS area gapped by the SC (Maple et al., 1986; McElfresh et al., 1987). The “partial gapping scenario” can be described by the theory of Bilbro and McMillan (Bilbro, 1976), extended to include SC and SDW order by Machida (Machida, 1981), in terms of a relation between T0, Tc and the fraction of the FS gapped by the HO (Maple et al., 1986; Fisher et al., 1990; Jeffries et al., 2007; Jeffries et al., 2008). On the other hand, models based on the localized character of the U 5f electrons in URu2Si2 have been proposed that are consistent with certain aspects of HO and other phenomena. Ironically, the richness of the phenomena found in URu2Si2 and the challenge of developing a fundamental understanding of the underlying physics are associated with the admixture of localized U 5f and itinerant electron states in this system. A review of the large amount of research that has been carried out on URu2Si2, including experiments on chemically substituted URu2Si2 systems and the latest theoretical developments, can be found in a series of reviews by Mydosh, Openeer and Riseborough (Mydosh and Oppeneer, 2011; Mydosh and Oppeneer, 2014; Mydosh et al., 2020).
Superconducting phase
The nature of the SC that occurs below 1.5 K has also attracted great interest. A series of complementary experiments has provided a picture in which the SCing phase of URu2Si2 is unconventional and appears to be spin singlet, d-wave SC, with chiral kz (kx + iky) order parameter symmetry, in which the SCing gap has a horizontal line node at kz = 0 and point nodes at kx = ky = 0 (Mydosh et al., 2020). While the SCing state of URu2Si2 seems to be well established experimentally, the underlying interactions responsible for this SCing pairing state have not yet been established. However, as noted above, insofar as the unconventional SCing phase of URu2Si2 resides within and coexists with the HO phase and is suppressed by the LMAFM phase, the SCing electron pairing would seem to involve special types of spin excitations within the HO phase that are not present in the LMAFM phase. Interestingly, a theory of magnetic exciton mediated SC in URu2Si2 has been proposed by Kusunose (Kusunose, 2012) based on the Ising-like collective modes in the HO phase (Altarawneh et al., 2011; Altarawneh et al., 2012) that lead to chiral d-wave singlet pairing with Eg symmetry. The Ising character of the spin resonance modes is an essential ingredient that explains the strong anisotropy of the upper critical field Hc2(T) (Ohkuni et al., 1999)
Substitutional studies
In 2011, our group reported that the substitution of isoelectronic Fe (Kanchanavatee et al., 2011) for Ru in URu2Si2 generates a T vs. x phase diagram, where x is the Fe concentration, that is reminiscent of the T vs. P phase diagram for pure URu2Si2 (Butch et al., 2010). We noted that substitution of Fe for Ru yields a reduction in the unit cell volume similar to that obtained under pressure at the critical concentration xc = 0.15 or pressure Pc = 1.5 GPa at which the HO-LMAFM transition occurs. This led us to suggest that substitution of Fe could generate a “chemical pressure” Pch = (x/xc)Pc = (Pc/xc)x = (10 GPa)x that drives the HO-LMAFM transition.
Subsequent studies of the URu2−xFexSi2 system under pressure revealed that increases in x and P induce the HO-LMAFM phase transition in an additive manner; i.e., xc*(P) = xc–(xc/Pc)P = 0.15–0.1 (GPa)−1P (Wolowiec et al., 2016). Later it was shown that the substitution of isoelectronic Os for Ru yields a T vs. x phase diagram similar to that obtained for Fe substitution, even though the substitution of Os corresponds to an increase of the unit cell volume, or “negative” chemical pressure (Kanchanavatee et al., 2014). Studies of the URu2−xOsxSi2 system under pressure revealed that increasing both x and P are additive in inducing the HO-LMAFM transition for Os substitution, just like Fe substitutions (Wolowiec et al., 2021). An analysis of the increase in the hybridization of the U 5f states and the transition metal d-states upon substitution of Fe and Os for Ru in URu2−xMxSi2 (M = Fe, Os) suggested that the transition from HO to the LMAFM order is primarily driven by the increase in hybridization due to partial replacement of Ru 4d states with Fe 3d and Os 5d states which enhances and over compensates for the effects of positive or negative chemical pressure for Fe and Os substitutions, respectively.
Since the substitution of Fe and Os for Ru in URu2Si2 has the same effect as the application of pressure in driving the HO-LMAFM transition, the substitutional route has the attractive feature that measurements which are difficult to perform on URu2Si2 under pressure in the HO and LMAFM phases can instead be performed on URu2−xMxSi2 (M = Fe, Os) compounds at atmospheric pressure to achieve the same objective. Also, the LMAFM phase in URu2Si2 accessed by applying pressure (Jeffries et al., 2007; Jo et al., 2007; Hassinger et al., 2010) and substituting Fe for Ru (Kanchanavatee et al., 2011; Das et al., 2015; Ran et al., 2016) is especially intriguing due to the similarities between the HO and LMAFM phases (e.g., electronic structure, effective masses, c-axis wave vector downfolding). This motivated our group to undertake a study of the HO and LMAFM phases in URu2−xFexSi2 under the “effective pressure” associated with Fe substitution in high magnetic fields up to 60 T applied along the c-axis at the National High Magnetic Field Laboratory (NHMFL) facilities at Florida State University (FSU) and Los Alamos National Laboratory (LANL) (Ran et al., 2017). The R(T,H) measurements in high magnetic fields yielded some spectacular 2D T vs. H phase diagrams for various values of x and a 3D T vs. H and x phase diagram shown in the “EXPERIMENTAL RESULTS” section.
The R(T,H) measurements on the URu2Si2 parent compound reveal a rich and complex T vs. H phase diagram similar to that previously reported by Kim et al. (2003) and Jaime et al. (2002). The HO transition temperature T0 and temperature T* where the magnetoresistance changes from positive to negative are suppressed towards 0 K near 35 T and in the vicinity of a metamagnetic transition at ∼38 T (Kim et al., 2003). Between ∼33 T and ∼39 T, there is a cascade of exotic phases, one of which is an incommensurate SDW, and non-Fermi liquid behavior where ρ(T) ≈ AT∼1.3 (Kim et al., 2003). Regions within the T vs. H phase diagrams contain HO, re-entrant HO (HO*), LMAFM phases and a change in Fermi surface geometry. These phase diagrams reveal the appearance of a “re-entrant” hidden order (HO*) phase as a large magnetic field was applied at low temperatures in the LMAFM phase (Harrison et al., 2003; Aoki et al., 2010; Ran et al., 2017). With the continuing efforts to understand the underlying physics of the HO, it would be useful to probe the field-induced transition between the HO and the LMAFM phases for several values of x in URu2−xFexSi2.
Scheerer et al. (Scheerer et al., 2012) reported measurements of the electrical resistivity of URu2Si2 in high magnetic fields applied at an angle θ with respect to the c-axis and characterized the various phase transitions of URu2Si2 as a function of θ. The ultimate finding was that the observed θ-dependent behavior of the T vs. H phase diagram of URu2Si2 is actually a reflection of the phase transitions depending on the magnetic field projection onto the c-axis, where H//c = Hcosθ. This study showed that neither H nor θ independently are tuning parameters of URu2Si2, but instead H//c is the tuning parameter, possibly due to the symmetry of the g-factor of URu2Si2 (Ohkuni et al., 1999; Altarawneh et al., 2011).
Our primary motivation for the research described herein was to study the θ-dependent behavior of R at larger H, lower T, and for several values of x in the URu2−xFexSi2 system. We wanted to determine whether H//c, which is a tuning parameter for x = 0, remains a tuning parameter over the full range of Fe concentrations, x, throughout the HO phase and into the LMAFM phase. Additionally, these measurements can probe the transition between LMAFM and HO* (“re-entrant HO”), as well as potentially allowing one to distinguish the closely-related LMAFM and HO ground states from one another. These objectives can be explored by constructing a T vs. H phase diagram for URu2−xFexSi2, as presented in the work by Ranet al. (Ran et al., 2017), but with variation of θ. Our construction of the URu2−xFexSi2 phase diagram with varying T, H, and θ, not only confirmed the results for URu2Si2 presented by Scheerer et al. (Scheerer et al., 2012), but also showed that H//c, as opposed to θ, was a tuning parameter that extended throughout all x in the URu2−xFexSi2 system.
2 Experimental results
Electrical transport measurements on single crystals of URu2−xFexSi2 were made in high magnetic fields using a 65 T pulsed-field magnet at National High Magnetic Field Lab (NHMFL), Los Alamos, NM and the 45 T dc hybrid magnet at NHMFL, Tallahassee, FL. The electrical transport properties of the single crystals, with cleaved surfaces perpendicular to the c-axis, were measured using a standard four-wire technique in the ab-plane, where voltage was measured in the same direction as current. The magnetic field, H, is applied at an angle, θ, to the c-axis, such that θ = 0 represents H//c and θ = 90° represents H//ab Rotation is performed in-situ using a cryogenic goniometer (Willis et al., 2020). Figure 1 shows a depiction of this setup at both facilities.
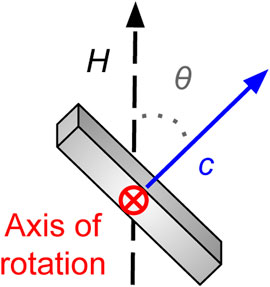
FIGURE 1. Graphic of the sample rotation in a vertical magnetic field representing the experimental setup at both the Pulsed Field facility at LANL and the DC Field facility at FSU.
2.1 Angular-dependence of magnetoresistance in URu2Si2
Measurements of the electrical transport properties of URu2Si2 were taken under a pulsed field of μ0Hmax = 65 T directed at various angles 0 ≤ θ ≤ 90° for T = 1.5, 10, and 13 K. The results of these measurements are presented in Figures 2A–C. Electrical resistance, R, of URu2Si2 is measured as H is pulsed to 65 T, and several features associated with phase transitions appear at various values of Hphase, dependent on T and θ. For fixed T, the θ-dependent behavior as θ → 90° shows these transitions being shifted to higher fields, suggesting strong correlation between Hphase and θ, where θ = 90° makes these transitions impossible to observe. We follow this idea by using the trigonometric relation, cos θ, which represents the projection of H onto the c-axis, and can reduce the scaling of H by cos θ on the bottom panels of Figures 2D–F to determine if the transitions observed in URu2Si2 are dependent on H//c. This reduced scaling, based on the geometry of the setup, shows that the transitions observed in URu2Si2 are indeed solely dependent on the application of magnetic field along the c-axis. Despite a very large μ0H up to 65 T being applied in the ab-plane, there is no deviation from this behavior. These results confirm the findings of Scheerer et al. and give strong indication that not only the HO, but all phases (Fermi surface reconstruction, SDW, etc.) in URu2Si2 are only susceptible to H applied along the c axis, suggesting that the magnetic properties of the 5f-electrons are linked to the Fermi surface (Scheerer et al., 2012).
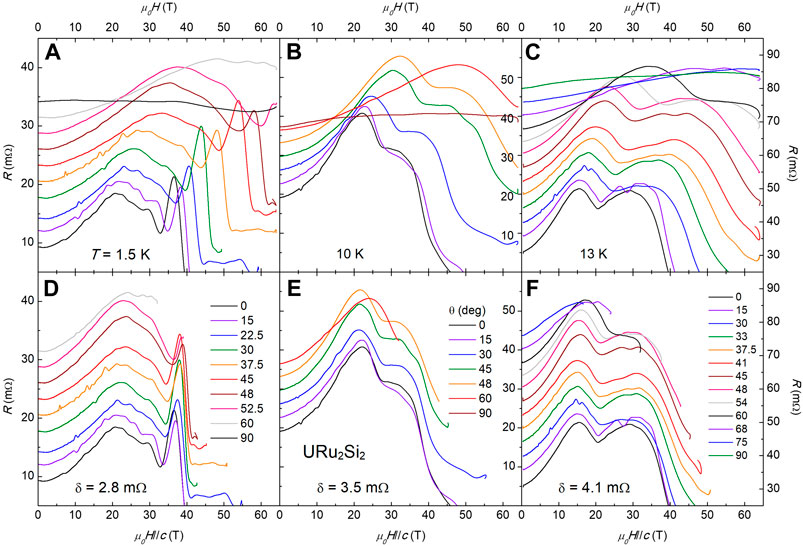
FIGURE 2. (A–C) Resistance, R, vs. magnetic field, H, of URu2Si2 at multiple angles θ for T = 1.5, 10, and 13 K, respectively. (D–F) Resistance curves from (A–C) plotted versus the projection of the magnetic field onto the c-axis of URu2Si2, H//c, where H//c = H cos θ. The behavior of magnetoresistance in URu2Si2 appears to only depend on H//c, consistent with Scheerer et al. (Scheerer et al., 2012).
2.2 Angular dependence of magnetoresistance in URu2−xFexSi2
Measurements of R vs. θ were performed on URu2−xFexSi2 in the 45 T hybrid magnet at NHMFL to characterize the angular symmetry of R(θ) at higher fields and across the phase diagram for URu2−xFexSi2 constructed by Ran et al. (2017). Measurements on R(θ) were made as θ was swept through the range 0 ≤ θ ≤ 180° for fixed magnetic fields μ0H = 20, 33, 40, and 45 T at multiple temperatures above and below the HO and LMAFM transitions in URu2−xFexSi2 for selected x. The data taken for this measurement on x = 0.2 at μ0H = 45 T are shown in Figure 3 as an example.
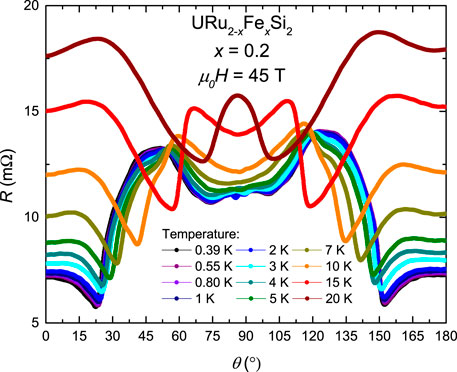
FIGURE 3. Selected R vs. θ curves at selected temperatures for x = 0.2 with the applied field magnitude of μ0H = 45 T. Features that develop at high fields represent phase transitions occurring at θc (T, H).
The features in R(θ) are actually representative of phase transitions. This explanation utilizes the knowledge that the T vs. H phase diagram for URu2Si2 does not explicitly depend on the angle, but instead on the projection of H onto the c-axis, as shown by Scheerer et al. (Scheerer et al., 2012) and confirmed in the prior discussion in this manuscript using an independent, but similar experiment on URu2Si2. Much like in Figure 2, where the magnetic field sweeps of R(H) at several θ were reduced to a system of just R vs. H//c, a reduction of parameters can be attempted where θ is converted to H//c using the magnitude of the field (45 T, for Figure 3) and the relation H//c = H cos θ. This conversion is shown for a single R vs. θ dataset in Figure 4, with x-axis values of θ being converted to H//c and shown on the top x-axis. Using the first angular derivative of resistance, dR/dθ, the features in R(θ) can be more easily identified at specific θ and H//c, as shown by the red line in Figure 4.
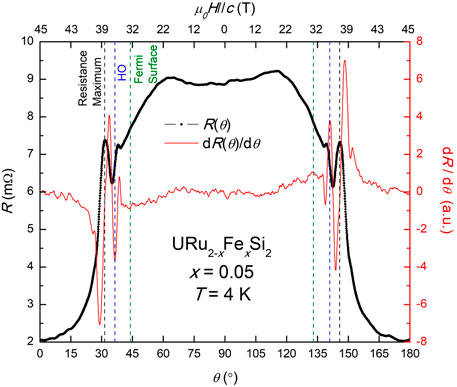
FIGURE 4. Single R vs. θ curve (black) for x = 0.05 at T = 4 K with its angular derivative dR/dθ as an overlay (red). Sharp features in the derivative data at specific values of θ can be converted to H//c (top x-axis). This reduction of H and θ into H//c shows that these features actually correspond to phase transitions which were previously mapped out by Ran et al. (2017).
The features, identified by sharp peaks in dR/dθ, were plotted in phase diagrams for all T and H, for several x, with no guidance from prior studies. The phase diagrams constructed from these data are shown in Figure 5. The newly constructed phase diagrams bear a remarkable resemblance to the phase diagrams explored by Ran et al. (2017) shown in Figure 6, suggesting that, like in URu2Si2, the T vs. H phase diagrams for URu2−xFexSi2 are strictly dependent on H//c and exhibit no angle-dependent behavior. Overlap in the T vs. H//c phase diagram confirms no angle-dependence of the phases by noting that an increase in field magnitude H does not change the anisotropy. This is particularly insightful, as one would expect that perhaps the LMAFM phase of URu2−xFexSi2 could be perturbed by a large magnetic field being applied along the ab-plane. Instead, it is shown that, no matter the Fe concentration of URu2−xFexSi2, all field-induced phase transitions in this system happen along the c-axis and may be closely intertwined. Further, the inability to show a difference in the anisotropy between the HO and LMAFM phases using this measurement technique represents a significant finding.
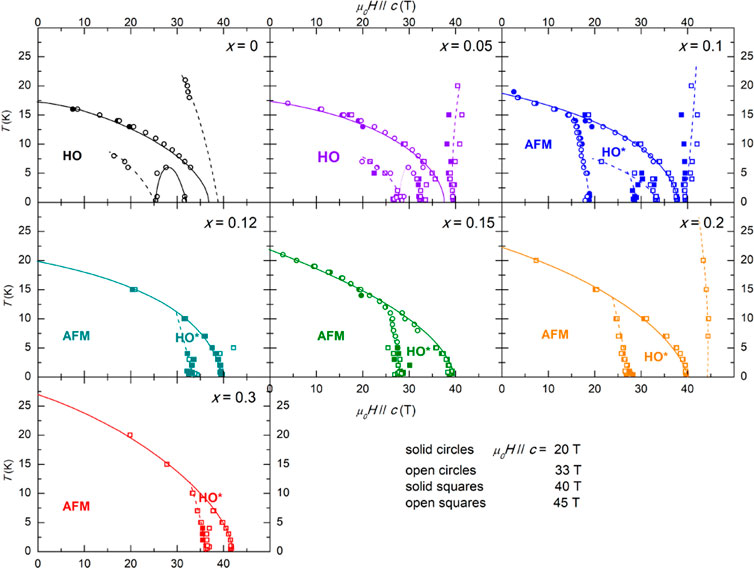
FIGURE 5. A T vs. H//c phase diagram is constructed for several x using extracted values of θ(T, H) from various R(θ) curves using the method shown in Figure 4. The phase diagrams presented show a striking similarity to what was mapped out by Ran et al. (2017) suggesting that various phases in URu2−xFexSi2 only depend on H on the c-axis.
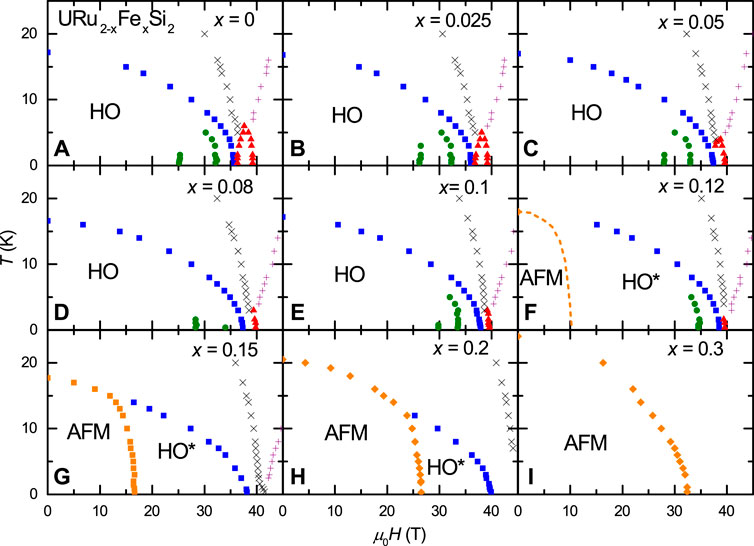
FIGURE 6. The T vs. H phase diagrams for URu2-xFexSi2 (A–I) in Ran et al. (2017). H was applied along the c-axis.
In the phase diagram we show, for samples with Fe concentration x ≥ 0.1, that the LMAFM ground state undergoes a transition into re-entrant HO as H is increased, which is expected from prior studies on re-entrant HO in URu2−xFexSi2 (Ran et al., 2017). Since our measurements yielded a large amount of data in a T vs. H, x phase diagram, and the reduction of θ and H into H//c provides redundancies in this phase diagram, we can thoroughly explore the phase boundary between LMAFM and HO*. One such visualization is presented in Figure 7, where, for x = 0.1 at μ0H = 33 T, we can show the signatures of the LMAFM and HO* transitions in dR/dθ. As expected, at higher temperatures, there is only a LMAFM phase before making a transition into the PM state, but as the temperature is lowered, a transition to HO* is observed at high fields.
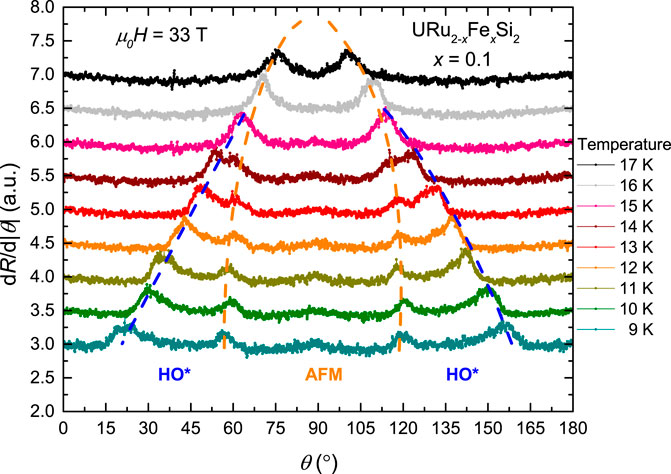
FIGURE 7. Demonstration of the LMAFM and HO* signatures in the dR/dθ data for x = 0.1 at μ0H = 33 T as HO* develops at lower temperatures. This picture is consistent with the idea that the LMAFM phase is interrupting the larger HO phase.
The interesting behavior shown in Figure 7 is the smooth nature of the transition from the PM state to HO* or LMAFM as a function of T. The PM state boundary traces out continuously with T from the LMAFM to the HO* phases for the Fe concentrations where both phases are observed. The transition between LMAFM and HO* is very abrupt, however, and its behavior may lend insight into the nature of the LMAFM phase. A possible scenario is that the substitution of Fe is actually “interrupting” the HO phase, rather than a separate re-entrant HO phase “growing out” of the LMAFM ground state. This idea may be supported by characterizing the shape of the outer boundary of the phase diagrams: HO for x = 0 and 0.05, LMAFM + HO* for x = 0.1, 0.12, 0.15, 0.2, and 0.3, and LMAFM for presumably x > 0.3. This characterization is presented in Figure 8, much like what was done by Ran et al. (2017) where the phase boundaries are normalized to one at the T and H endpoints, such that the qualitative behavior of the boundary can be observed and characterized according to Eq. 1. Using this fitting of the curvature, the data can be organized into essentially 3 clusters. The first cluster, where fitting parameter n = 1.8, is the same as observed by Ran et al. (2017), and applies to x = 0, 0.05, and 0.1 where HO is the dominant phase. The second cluster represents a flatter boundary where LMAFM is the dominant phase and n = 1.45 for x = 0.15, 0.2, and 0.3. This suppression of n may be related to the fact that T0 increases significantly between x = 0.1 and 0.15. The final cluster is a more general grouping where this boundary was mapped out to where H0 = HLMAFM, instead of the usual HHO. As discussed, the LMAFM phase cuts into the HO phase rather abruptly, yielding a phase boundary which is not smooth and therefore cannot be cleanly described by Eq. 1.
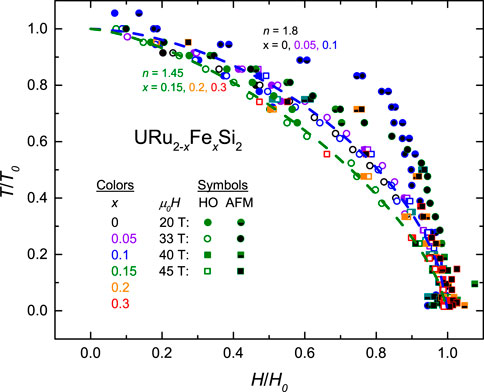
FIGURE 8. Normalized T/T0 vs. H/H0 phase boundary for both LMAFM and HO(*) phases for all x and H. Curvature of this boundary is analyzed using Eq. 1, showing two clusters for the HO(*) phases: n = 1.8 for x = 0, 0.05, and 0.1 where HO is the dominant phase and n = 1.45 for x = 0.15, 0.2, and 0.3 where LMAFM is the dominant phase. As expected, the AFM boundary does not fit into this smooth curve due to the abrupt nature of the transition into HO*.
Further visualization of the behavior of the LMAFM/HO* to PM state boundary is provided in the 3D phase diagram shown in Figure 9, with the color of the data points corresponding to the various phases in URu2−xFexSi2. For comparison, the 3D phase diagram of URu2−xFexSi2 with magnetic fields applied parallel to the c-axis is presented in Figure 10. The transition from the PM state to LMAFM/HO* follows a continuous boundary with x, whereas the HO* to LMAFM boundary cuts in abruptly. This LMAFM to HO* transition “wedge” in the 3D phase diagram cuts in at an angle such that it eventually converges with the HO* boundary at x ≥ 0.3, but near x = 0.1, this boundary rapidly disappears as the URu2−xFexSi2 system moves into a HO-only regime. The 3D phase diagram reflects the possible explanation that Fe-substitution leads to an abrupt interruption of the HO phase via introduction of the LMAFM phase at μ0H = 0 T. As Fe continues to be substituted into URu2−xFexSi2, the space in the phase diagram previously occupied by the HO phase is quickly replaced by LMAFM. One can picture a tall “dome” of LMAFM growing into a large “bubble” of HO in this 3D phase diagram. While no angular-dependent behavior is clearly observed in this phase diagram, the data collected from our measurements show a more detailed picture of the interaction between the LMAFM and HO phases in the URu2−xFexSi2 system.
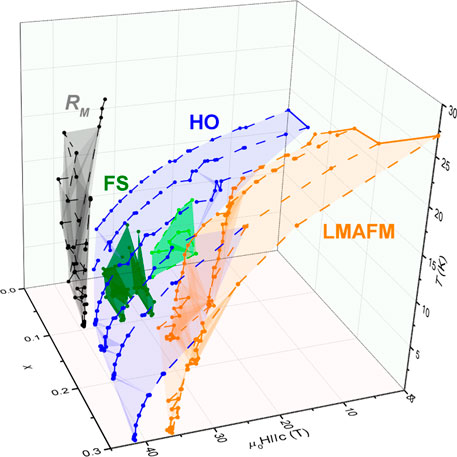
FIGURE 9. 3D phase diagram combining all of the 2D phase diagrams from Figure 5, except for x = 0.12, due to likely discrepancy in the Fe concentration. In 3D space, the joint LMAFM-HO boundary appears to curve smoothly in a consistent matter, with the only variation being where the AFM phase cuts in at higher T based on x.
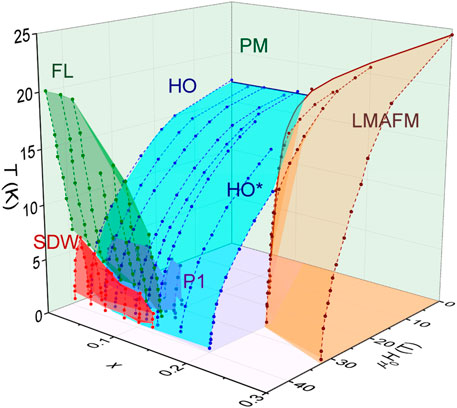
FIGURE 10. 3D phase diagram from Ran et al. (2017). SDW: spin density wave; P1: possible new phase in low field; FL: field induced recovery of the normal metallic phase. Note the similarities especially in PM-HO-LMAFM phase boundaries between this figure with H//c and Figure 9.
3 Concluding remarks
We performed a series of measurements on URu2−xFexSi2 in order to characterize the T vs. H phase diagram as a function of θ, the angle between H and the c-axis, in order to better understand the nature of the HO and LMAFM phases, which was initially explored in URu2Si2 (Kanchanavatee et al., 2017). We show that these two studies actually probe the same phenomenon, which is that the phases in the T vs. H phase diagram are strictly dependent on the magnetic field applied along the c-axis, H//c. The reduction of these two seemingly independent problems to a single phenomenon was allowed when magnetoresistance R(H) curves at various θ for fixed T could be understood as being independent of θ by converting H into its c-axis projection, such that H//c = H cos θ. This characterization of the phases as a function of H//c was initially provided by Scheerer et al. (Scheerer et al., 2012) and then separately verified with our own measurements on URu2Si2. By applying this technique to the study of the substitutional system in URu2−xFexSi2, the phase diagram behavior could be reduced by converting values of θ at fixed H to an equivalent H//c. After construction of the 2D phase diagram for several x, we found recovery of the original 2D phase diagrams constructed by Ran et al. (2017), where H was strictly parallel to c, suggesting that, despite large H being applied along the ab-plane, potentially causing perturbations to the T vs. H phase diagram, the various phases in URu2−xFexSi2 are resistant to magnetic fields H//ab, and that phenomena such as HO, LMAFM, Fermi surface reconstruction, SDW, etc. are all exclusively dependent on H//c. This suggests that these various phases are closely related to one another, with H//c, and not H or θ, being a non-thermal tuning parameter. Further, we can continue to observe the x-dependence of these various phases in URu2−xFexSi2 to provide further insight into their nature, particularly the HO and LMAFM order. By studying the characteristics of the various phase boundaries, we can actually imagine an explanation of the relationship between HO, HO*, and LMAFM, where LMAFM interrupts the continuous HO phase, as a potential alternative explanation to the idea that re-entrant HO* grows out of LMAFM at high fields. Thus, this study potentially offers two new insights into URu2−xFexSi2: 1) not only in the parent compound URu2Si2 are the phases solely dependent on H//c (Scheerer et al., 2012), but this is also true for URu2−xFexSi2 despite the introduction of LMAFM via Fe-substitution (this also provides a clear explanation for the observed “symmetry” in R(θ) for μ0H ≥ 0 T) (Kanchanavatee et al., 2017) and 2) we provide an additional visualization of the T vs. H phase diagram for several values of x, allowing for an alternative explanation of the interaction between HO and LMAFM induced via Fe-substitution.
Data availability statement
The datasets presented in this study can be found in online repositories. The names of the repository/repositories and accession number(s) can be found below: https://osf.io/puy6j/?view_only=953de102b00f49adaa7e184aedd91ecb, OSF.
Author contributions
NP and MBM designed research; NP, SR, DG, YL, JS, FFB, REB, and MBM performed research; NP, YD, and MBM wrote the paper; all coauthors provided input into the paper.
Funding
Research at UCSD was supported by the NNSA through the U.S. DOE under Grant No. DE-NA0002909 (measurements in high magnetic fields), by the DOE under Grant No. DEFG02-04-ER46105 (single crystal growth), and by the NSF under Grant No. DMR 1206553 (sample characterization). A portion of this work was performed at the National High Magnetic Field Laboratory, which is supported by National Science Foundation Cooperative Agreement Nos. DMR-1157490 and DMR-1644779, the State of Florida and the Department of Energy (DOE). JS acknowledges support from the DOE BES program Science at 100 T, which permitted the design and construction of much of the specialised equipment used in the high-field studies. This research was also funded in part by a QuantEmX grant from ICAM and the Gordon and Betty Moore Foundation through Grant No. GBMF5305 to Hector D. Rosales.
Conflict of interest
The authors declare that the research was conducted in the absence of any commercial or financial relationships that could be construed as a potential conflict of interest.
Publisher’s note
All claims expressed in this article are solely those of the authors and do not necessarily represent those of their affiliated organizations, or those of the publisher, the editors and the reviewers. Any product that may be evaluated in this article, or claim that may be made by its manufacturer, is not guaranteed or endorsed by the publisher.
References
Altarawneh, M. M., Harrison, N., Sebastian, S. E., Balicas, L., Tobash, P. H., Thompson, J. D., et al. (2011). Sequential spin polarization of the fermi surface pockets in URu2Si2 and its implications for the hidden order. Phys. Rev. Lett. 106, 146403. doi:10.1103/physrevlett.106.146403
Altarawneh, M. M., Harrison, N., Li, G., Balicas, L., Tobash, P. H., Ronning, F., et al. (2012). Superconducting pairs with extreme uniaxial anisotropy in URu2Si2. Phys. Rev. Lett. 108, 066407. doi:10.1103/physrevlett.108.066407
Aoki, D., Bourdarot, F., Hassinger, E., Knebel, G., Miyake, A., Raymond, S., et al. (2010). Field re-entrant hidden-order phase under pressure in URu2Si2. J. Phys. Condens. Matter 22, 164205. doi:10.1088/0953-8984/22/16/164205
Bauer, E. D., Zapf, V. S., Ho, P.-C., Butch, N. P., Freeman, E. J., Sirvent, C., et al. (2005). Non-Fermi-liquid behavior within the ferromagnetic phase in URu2-xRexSi2. Phys. Rev. Lett. 94, 046401. doi:10.1103/physrevlett.94.046401
Bilbro, G. (1976). Theoretical model of superconductivity and the martensitic transformation in A15 compounds. Phys. Rev. B 14, 1887–1892. doi:10.1103/physrevb.14.1887
Butch, N. P., and Maple, M. B. (2009). Evolution of critical scaling behavior near a ferromagnetic quantum phase transition. Phys. Rev. Lett. 103, 076404.
Butch, N. P., Jeffries, J. R., Chi, S., Leão, J. B., Lynn, J. W., and Maple, M. B. (2010). Antiferromagnetic critical pressure in URu2 Si2 under hydrostatic conditions. Phys. Rev. B 82, 060408(R). doi:10.1103/physrevb.82.060408
Das, P., Kanchanavatee, N., Helton, J. S., Huang, K., Baumbach, R. E., Bauer, E. D., et al. (2015). Chemical pressure tuning of URu2Si2via isoelectronic substitution of Ru with Fe. Phys. Rev. B 91, 085122.
de la Torre, A. L., Visani, P., Dalichaouch, Y., Lee, B., and Maple, M. B. (1992). Th-Doped URu2Si2: Influence of "Kondo holes" on coexisting superconductivity and magnetism. Phys. B Condens. Matter 179, 208–214. doi:10.1016/0921-4526(92)90018-n
Fisher, R. A., Kim, S., Wu, Y., Phillips, N. E., McElfresh, M. S., Torikachvili, M. S., et al. (1990). Specific heat of URu2Si2: Effect of pressure and magnetic field on the magnetic and superconducting transitions. Phys. B Condens. Matter 163, 419–423. doi:10.1016/0921-4526(90)90229-n
Gallagher, A., Chen, K.-W., Moir, C. M., Cary, S. K., Kametani, F., Kikugawa, N., et al. (2016). Unfolding the physics of URu2Si2 through silicon to phosphorus substitution. Nat. Commun. 7, 10712. doi:10.1038/ncomms10712
Harrison, N., Jaime, M., and Mydosh, J. (2003). Reentrant hidden order at a metamagnetic quantum critical end point. Phys. Rev. Lett. 90, 096402. doi:10.1103/physrevlett.90.096402
Hassinger, E., Knebel, G., Izawa, K., Lejay, P., Salce, B., and Flouquet, J. (2008). Temperature-pressure phase diagram of URu2Si2 from resistivity measurements and ac calorimetry: Hidden order and Fermi-surface nesting. Phys. Rev. B 77, 115117. doi:10.1103/physrevb.77.115117
Hassinger, E., Knebel, G., Matsuda, T. D., Aoki, D., Taufour, V., and Flouquet, J. (2010). Similarity of the fermi surface in the hidden order state and in the antiferromagnetic state of URu2Si2. Phys. Rev. Lett. 105, 216409. doi:10.1103/physrevlett.105.216409
Jaime, M., Kim, K. H., Jorge, G., McCall, S., and Mydosh, J. A. (2002). High magnetic field studies of the hidden order transition in URu2Si2. Phys. Rev. Lett. 89, 287201. doi:10.1103/physrevlett.89.287201
Jeffries, J. R., Butch, N. P., Yukich, B. T., and Maple, M. B. (2008). The evolution of the ordered states of single-crystal URu2Si2 under pressure. J. Phys. Condens. Matter 20, 095225. doi:10.1088/0953-8984/20/9/095225
Jeffries, J. R., Butch, N. P., Yukich, B. T., and Maple, M. B. (2007). Competing ordered phases in URu2Si2: Hydrostatic pressure and rhenium substitution. Phys. Rev. Lett. 99, 217207. doi:10.1103/physrevlett.99.217207
Jo, Y., Balicas, L., Capan, C., Behnia, K., Lejay, P., Flouquet, J., et al. (2007). Field-induced fermi surface reconstruction and adiabatic continuity between antiferromagnetism and the hidden-order state in URu2Si2. Phys. Rev. Lett. 98, 166404. doi:10.1103/physrevlett.98.166404
Kanchanavatee, N., Janoschek, M., Baumbach, R. E., Hamlin, J. J., Zocco, D. A., Huang, K., et al. (2011). Twofold enhancement of the hidden-order/large-moment antiferromagnetic phase boundary in the URu2−xFexSi2 system. Phys. Rev. B 84, 245122. doi:10.1103/physrevb.84.245122
Kanchanavatee, N., Janoschek, M., Huang, K., White, B. D., Riseborough, P. S., Balatsky, A. V., et al. (2017). Emergence of higher order rotational symmetry in the hidden order phase of URu2Si2. Philos. Mag. 97, 144–154. doi:10.1080/14786435.2016.1235294
Kanchanavatee, N., White, B. D., Burnett, V. W., and Maple, M. B. (2014). Enhancement of the hidden order/large moment antiferromagnetic transition temperature in the URu2−xOsxSi2 system. Philos. Mag. 94, 3681–3690. doi:10.1080/14786435.2014.886022
Kim, K. H., Harrison, N., Jaime, M., Boebinger, G. S., and Mydosh, J. A. (2003). Magnetic-field-induced quantum critical point and competing order parameters in URu2Si2. Phys. Rev. Lett. 91, 256401. doi:10.1103/physrevlett.91.256401
Kusunose, H. (2012). Magnetic exciton mediated superconductivity in the hidden-order phase of URu2Si2. J. Phys. Soc. Jpn. 81, 023704. doi:10.1143/jpsj.81.023704
Machida, K. (1981). Spin density wave and superconductivity in highly anisotropic materials. J. Phys. Soc. Jpn. 50, 2195–2202. doi:10.1143/jpsj.50.2195
Maple, M. B., Chen, J. W., Dalichaouch, Y., Kohara, T., Rossel, C., Torikachvili, M. S., et al. (1986). Partially gapped Fermi surface in the heavy-electron superconductor URu2Si2. Phys. Rev. Lett. 56, 185–188. doi:10.1103/physrevlett.56.185
McElfresh, M. W., Thompson, J. D., Willis, J. O., Maple, M. B., Kohara, T., and Torikachvili, M. S. (1987). Effect of pressure on competing electronic correlations in the heavy-electron system URu2Si2. Phys. Rev. B 35, 43–47. doi:10.1103/physrevb.35.43
Mydosh, J., Oppeneer, P. M., and Riseborough, P. (2020). Hidden order and beyond: An experimental-theoretical overview of the multifaceted behavior of URu2Si2. J. Phys. Condens. Matter 32, 143002. doi:10.1088/1361-648x/ab5eba
Mydosh, J. A., and Oppeneer, P. M. (2011). Colloquium: Hidden order, superconductivity, and magnetism: The unsolved case of URu2Si2. Rev. Mod. Phys. 83, 1301–1322. doi:10.1103/revmodphys.83.1301
Mydosh, J. A., and Oppeneer, P. M. (2014). Hidden order behaviour in URu2Si2 (A critical review of the status of hidden order in 2014). Philos. Mag. 94, 3642–3662. doi:10.1080/14786435.2014.916428
Ohkuni, H., Inada, Y., Tokiwa, Y., Sakurai, K., Settai, R., Honma, T., et al. (1999). Fermi surface properties and de Haas-van Alphen oscillation in both the normal and superconducting mixed states of URu2Si2. Philos. Mag. B 79, 1045–1077. doi:10.1080/014186399256916
Palstra, T. T. M., Menovsky, A. A., van den Berg, J., Dirkmaat, A. J., Kes, P. H., Nieuwenhuys, G. J., et al. (1985). Superconducting and magnetic transitions in the heavy-fermion system URu2Si2. Phys. Rev. Lett. 55, 2727–2730. doi:10.1103/physrevlett.55.2727
Ran, S., Jeon, I., Pouse, N., Breindel, A. J., Kanchanavatee, N., Huang, K., et al. (2017). Phase diagram of URu2- x Fex Si2 in high magnetic fields. Proc. Natl. Acad. Sci. U.S.A. 114, 9826–9831. doi:10.1073/pnas.1710192114
Ran, S., Wolowiec, C. T., Jeon, I., Pouse, N., Kanchanavatee, N., White, B. D., et al. (2016). Phase diagram and thermal expansion measurements on the system URu2−xFex Si2. Proc. Natl. Acad. Sci. U.S.A. 113, 13348–13353. doi:10.1073/pnas.1616542113
Scheerer, G. W., Knafo, W., Aoki, D., and Flouquet, J. (2012). Angular dependence of the high-magnetic-field phase diagram of URu2Si2. J. Phys. Soc. Jpn. 81, SB005. doi:10.1143/jpsjs.81sb.sb005
Scheerer, G. W., Knafo, W., Aoki, D., Nardone, M., Zitouni, A., Béard, J., et al. (2014). Fermi surface in the hidden-order state of URu2Si2 under intense pulsed magnetic fields up to 81 T. Phys. Rev. B 89, 165107. doi:10.1103/physrevb.89.165107
Schlabitz, W., Baumann, J., Pollit, B., Rauchschwalbe, U., Mayer, H. M., Ahlheim, U., et al. (1986). Superconductivity and magnetic order in a strongly interacting fermi-system: URu2Si2. Z. Phys. B - Condens. Matter 62, 171–177. doi:10.1007/bf01323427
Willis, X., Ding, X., Singleton, J., and Balakirev, F. F. (2020). Cryogenic goniometer for measurements in pulsed magnetic fields fabricated via additive manufacturing technique. Rev. Sci. Instrum. 91 (3), 036102.
Wolowiec, C. T., Kanchanavatee, N., Huang, K., Ran, S., and Maple, M. B. (2016). Evolution of critical pressure with increasing Fe substitution in the heavy-fermion system URu2−xFexSi2. Phys. Rev. B 94, 085145. doi:10.1103/physrevb.94.085145
Keywords: superconductivity, heavy fermion, hidden order, magnetic order, uranium compound, correlatated electrons, high magnetic field, phase diagram
Citation: Pouse N, Deng Y, Ran S, Graf D, Lai Y, Singleton J, Balakirev FF, Baumbach RE and Maple MB (2022) Anisotropy of the T vs. H phase diagram and the HO/LMAFM phase boundary in URu2−xFexSi2. Front. Electron. Mater. 2:991754. doi: 10.3389/femat.2022.991754
Received: 11 July 2022; Accepted: 27 July 2022;
Published: 29 August 2022.
Edited by:
Jeffrey W. Lynn, National Institute of Standards and Technology (NIST), United StatesReviewed by:
Graeme Luke, McMaster University, CanadaJinguang Cheng, Institute of Physics (CAS), China
Copyright © 2022 Pouse, Deng, Ran, Graf, Lai, Singleton, Balakirev, Baumbach and Maple. This is an open-access article distributed under the terms of the Creative Commons Attribution License (CC BY). The use, distribution or reproduction in other forums is permitted, provided the original author(s) and the copyright owner(s) are credited and that the original publication in this journal is cited, in accordance with accepted academic practice. No use, distribution or reproduction is permitted which does not comply with these terms.
*Correspondence: M. B. Maple, bWJtYXBsZUB1Y3NkLmVkdQ==
†Present Address: S. Ran, Department of Physics, Washington University in St. Louis, St. Louis, MO, United States