 Rebiya Nuli
 Junxiu Cai
 Aizhatiguli Kadeer
 Yangyi Zhang4
 Patamu Mohemaiti
- 1School of Public Health, Xinjiang Medical University, Ürümqi, China
- 2College of Basic Medical Science, Xinjiang Medical University, Ürümqi, China
- 3Medical Department, The Fifth Affiliated Hospital of Xinjiang Medical University, Ürümqi, China
- 4Health Management Institute, The First Affiliated Hospital of Xinjiang Medical University, Ürümqi, China
Objective: There is evidence that type 2 diabetes (T2DM) is affected by gut microbiota, and gut microbiota diversity modified by diet. To investigate its modifications in Uyghur patients with different glucose tolerance, we enrolled 561 subjects: newly diagnosed T2DM (n = 145), impaired glucose regulation (IGR) patients (n = 138) and in normal control (NC) population (n = 278).
Methods: The nutrient intake in food frequency questionnaire was calculated by R language. The regions V3-V4 of 16S ribosomal RNA were sequenced by using Illumina Miseq platform. Sequences were clustered by operational taxonomy units, gut microbiota composition, and diversity was analyzed. Correlations between bacterial composition at different level and dietary factors were evaluated.
Results: The α-diversity was highest in NC, followed by T2DM and IGR; β-diversity distinguished between patients and NC. Compared to NC, Saccharibacteria was significantly increased in T2DM and IGR. Deferribacteres was significantly increased in T2DM compared to NC and IGR. Veillonella, Pasteurellaceae, and Haemophilus were over-represented in IGR. Abundance of Bacteroidetes was negatively correlated with LDL-C; Abundance of Tenericutes was negatively correlated with hip circumference and total cholesterol, positively correlated with HDL-C and cake intake; Actinobacteria was positively correlated with BMI and folic acid intake, negatively correlated with oil intake. Firmicutes was negatively correlated with beverage and alcohol intake. Spirochaetae was negatively correlated with fungus, fruits, beans, vitamin C, dietary fiber, and calcium. Fusobacteria was positively correlated with beans intake, and was negatively correlated with fat intake. Proteobacteria was positively correlated with tuber crops intake. Synergistetes was positively correlated with cholesterol, nicotinic acid, and selenium intake. Deferribacteres was negatively correlated with magnesium intake.
Conclusions: At the phylum and genus level, the structure and diversity of intestinal microbiota of T2DM and IGR was altered, the number of OTUs, the relative abundance, and diversity were all decreased. The gut microbiota of the newly diagnosed T2DM, IGR, and NC were related to age, blood lipids, BMI, blood pressure, and dietary nutrient intake. Unbalanced nutrient intake in the three groups may affect the structure and abundance of the gut microbiota, which may play a role in the occurrence and development of T2DM.
Introduction
Recent studies on Type 2 diabetes mellitus (T2DM) reported that there are direct links between diet, gut microbiota, and biological metabolic markers (1). Gut microbiota is associated with metabolic diseases such as obesity and diabetes, and the changes in the gut microbiota diversity are one of the important environmental risk factors for metabolic disease (2). In addition, gut microbiota is also with diverse body functions like dietary calorific bioavailability (3). T2DM and obesity are characterized by insulin resistance and low levels of inflammatory response, while the gut microbiota regulates host energy balance and inflammatory response and is closely related to the occurrence of metabolic diseases (4). The gut microbiota is rich in diversity in normal people, while the reduced microbial diversity and dysbiosis are linked with obesity, T2DM, and low inflammation (5). According to the forecast of international diabetes federation (IDF) in 2015, the number of T2DM patients in China will increase to 150 million by 2040, and the increase in T2DM patients is proportional to the increase in obesity. The incidence of diabetes (including type 1 and type 2) in China has increased from 0.9% in 1980 to 11.6% in 2013. The number of diabetic patients in the country has reached 100 million, and it is increasing year by year, and another 50.1% of adults are in the pre-diabetes status (6). Diabetes is top risk factor for health in Xinjiang of China, and the incidence rate in the population is as high as 10.47% (7). Diabetes is a chronic disease, and impaired glucose regulation (IGR) is a pre-diabetic status of diabetes, including impaired fasting glucose (IFG), and impaired glucose tolerance (IGT). According to IDF statistics, as of 2015, 352 million of the world's population are IGR patients, with a prevalence rate of 14.1%. In recent years, the number of IGR patients in China has increasing, and the prevalence rate has increased from 15.5% in 2008 to 35.7% in 2013 (8). Pre-diabetes can progress to diabetes or cardiovascular disease (9), and about 9–20.8% of IGR patients develop diabetes within 3 years (10).
Diet is an important factor in regulating gut microbiota. Regulating gut microbiota imbalance through dietary pathways has become a new research direction. The investigation and analysis of dietary structure and dietary adjustment have also played an increasingly important role in the study of gut microbiota and metabolic diseases (11). By integrating dietary and metagenomics information, we would be better understanding the interplay between diet, gut microbiota, and host metabolism.
To explore potential characteristics of gut microbiota that associated with newly diagnosed T2DM and IGR sufferer, dietary survey and gut microbial diversity analysis are applied to find relationship between specific dietary pattern and gut microbiota diversity.
Materials and Methods
A total of 561 Uyghur subjects aged 30–70 years old were enrolled in the present study from six community health service centers of Urumqi, Xinjiang Uyghur Autonomous Region of China. Among them, 145 subjects were newly diagnosed with T2DM by oral glucose tolerance test (OGTT). They did not use any hypoglycemic drugs by that time. One hundred and thirty eight subjects were grouped in IGR. We defined diabetes by using the American Diabetes Association (ADA) 2014 criteria. The NC group comprised 278 normoglycemic subjects who were randomly selected and matched for age, gender to cases from the general population. We excluded those subjects who reported already having diabetes, cardiovascular disease (myocardial infarction, angina pectoris, coronary artery surgery, or stroke), kidney disease and cancer because diagnosis of these diseases may affect diet. Pregnant women, lactating women were not included in the study. People who could not provide written consent for the study, or who had neurological impairments, and/or severe mental illness were excluded from the study.
The study protocol was approved by the Ethics Committee of the firth affiliated Hospital of Xinjiang Medical University. Written informed consent was obtained from all subjects.
Assessments of Anthropometric and Biochemical Measurements
Anthropometric measurements data, including gender, age were collected. Height, weight, waist, and hip circumference (WC, HC) were measured. Body mass index (BMI) was calculated. Fasting plasma glucose (FPG), 2 h OGTT, total cholesterol (TC), triglyceride (TG), high-density lipoprotein cholesterol (HDL-C), low-density lipoprotein cholesterol (LDL-C) were measured by chemical analysis (Beckman Coulter AU5800 Clinical Chemistry System, Newark, USA).
Dietary Assessment
Food consumption including the type and amount of food and meal was collected by using a validated semi-quantitative food frequency questionnaire (SQFFQ), referring to nutrition, and health status survey of Chinese residents of 2010 and based on the local Chinese Uyghur population diet characteristics in Urumqi of Xinjiang. The SQFFQ included 84 food items and 16 categories, which covered 90% of the commonly consumed foods of Chinese Uyghur population in Urumqi. All participants were asked to recall the frequency of each food item over the previous 12 months and the estimated portion size by making comparisons with the specified reference portion. Participants were requested to recall the frequency of consumption of each food item (daily, weekly, monthly, annually, never). The amount of vegetable oil, animal oil, and salt were asked according to the family consumption per month as the unit. Data was converted into grams (g)/day. The daily food intake, caloric intake and various nutrients are calculated by converting into an adult male (that is, a standard person) according to age and sex in the following analysis. The Chinese Food Composition Tables (Yang YX, Wang GY, Pan XC. China Food Composition. Beijing: Beijing University Medical Press, 2009) were used to estimate intake of dietary energy (kcal/day), macronutrients and micronutrients.
The SQFFQ was designed for and validated in this population. Pearson correlation coefficients for reliability of the SQFFQ ranged from 0.65 to 0.91. The average correlation coefficient is 0.73. Generally, these data indicate that the SQFFQ provides reasonably valid and reliable measures of the average long-term dietary intake.
Microbial Diversity Analysis
Stool samples were collected from 20 newly diagnosed T2DM patients, 20 IGR patients, and 20 NC who were selected by inclusion criteria. Microbial DNA was extracted from stool sample using the QIAamp DNA Stool Mini Kit (Qiagen, Germany) according to manufacturer's protocols. The V3-V4 region of the 16S ribosomal RNA was amplified for sequencing using Illumina Miseq platform (Illumina, San Diego, USA) according to the standard protocols by Major Bio-Pharm Technology Co. Ltd., (Shanghai, China). Raw fastq files were demultiplexed, quality-filtered by Trimmomatic and merged by FLASH with the following criteria: (i) the reads were truncated at any site receiving an average quality score <20 over a 50 bp sliding window. (ii) Primers were exactly matched allowing 2 nucleotide mismatching, and reads containing ambiguous bases were removed. (iii) Sequences whose overlap longer than 10 bp were merged according to their overlap sequence. Operational taxonomic units (OTUs) were clustered with 97% similarity cutoff using PARSE (version 7.1 http://drive5.com/uparse/) and chimeric sequences were identified and removed using UCHIME. The taxonomy of each 16S rRNA gene sequence was analyzed by RDP Classifier algorithm (http://rdp.cme.msu.edu/) against the Silva (SSU123) 16S rRNA database using confidence threshold of 70%.
Univariate Statistical Analysis
All the analyses were performed by using SPSS version 21. The Shapiro-Wilk test, Q-Q plots, and histograms were applied to ensure the normal distribution of variables. Log transformation was performed for non-normally distributed variables.
Sample characteristics were presented as mean values and standard deviations for continuous variables, and percentages for categorical variables. Baseline characteristics were compared between three groups by using the analysis of chi-square test (categorical variables) and student's T-test or one-way ANOVA test (continuous variables). A Kruskal-Wallis H rank non-parametric test was used for non-normally distributed variables.
The nutrient intakes of each sample in semi quantitative frequency questionnaire were calculated by R language (version 3.2.2). Differences in α-diversity were tested using student's T-test or one-way ANOVA test. Differences in microbiota composition as assessed by β-diversity metrics were tested by one-way ANOVA.
Multivariate Statistical Analysis
Correlations between gut microbiota and dietary intake were analyzed by RDA/CCA test implemented in R vegan package and p heatmap package. Linear discriminant effect size analysis (LEfSe) based on the non-parametric factorial Kruskal-Wallis test was performed using the default parameters at phylum to genus taxonomic level to find microbial biomarkers for the gut microbiota of T2DM and IGR groups. LEfSe used linear discriminant analysis (LDA) to estimate the effect of the abundance of each component (species) on the difference effect. The threshold on the linear discriminant analysis (LDA) score for discriminative biomarkers was 2.0. All statistical analyses were conducted using R 3.2.2.
Results
A total of 561 participants (270 females, 291 males) were included in this study. The characteristics of the study population were shown in Table 1. The average values of age, WC, SBP, FPG, and TC of the T2DM and IGR patients were significantly (P < 0.01) higher than that of the NC, and the HC, DBP of the NC were significantly lower than that of T2DM group (P < 0.01). TG and LDL-C in the NC group were significantly lower than in T2DM and IGR groups. There were not statistically significant among three groups by gender, smoking status, and HDL-C.
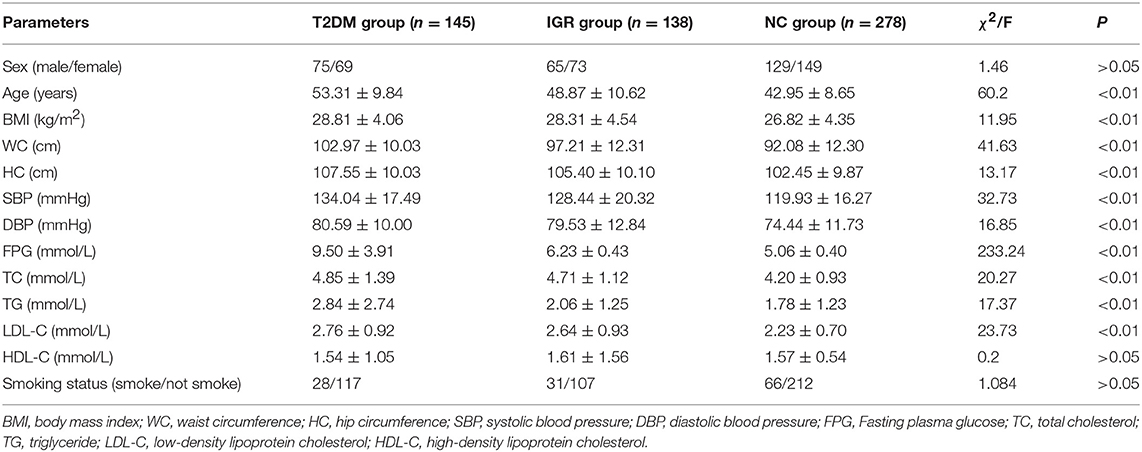
Table 1. Clinical characteristics of three groups.
Dietary Intake Analysis
Compared with the recommended amount of Chinese dietary guidelines, the intakes of vegetables, fish, shrimp and dairy products were insufficient for T2DM patients, and the intakes of cereals, meat, salt, and oil were excessive (Tables 2, 3).
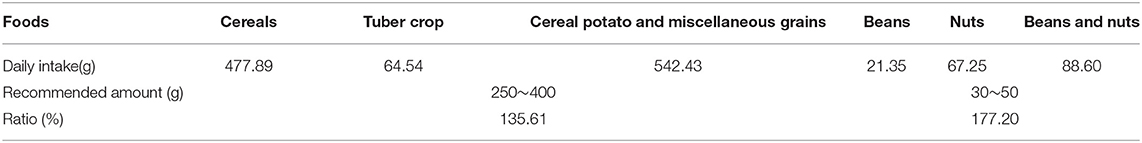
Table 2. Daily average intake of staple food and soybean nuts in T2DM group.
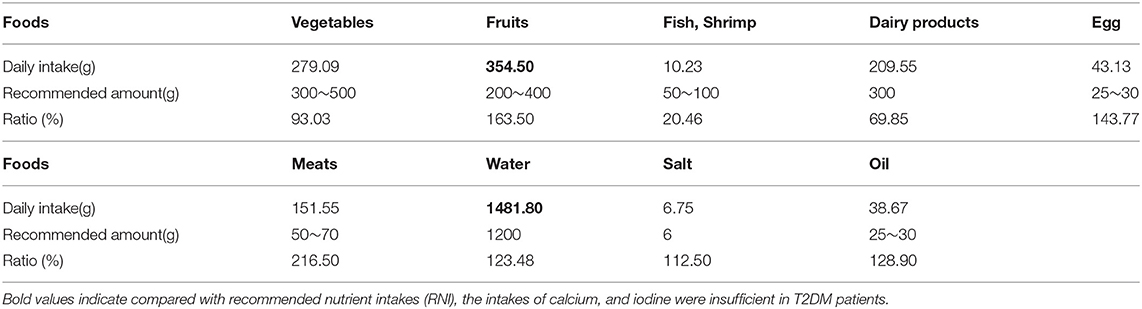
Table 3. Daily average intake of other foods in T2DM group.
Compared with recommended nutrient intakes (RNI), the intakes of vitamin B6, vitamin D, folic acid, calcium, and iodine were insufficient in T2DM patients, and intakes of fat, nicotinic acid, vitamin E, potassium, iron, copper, and manganese were excessive (Tables 4, 5).
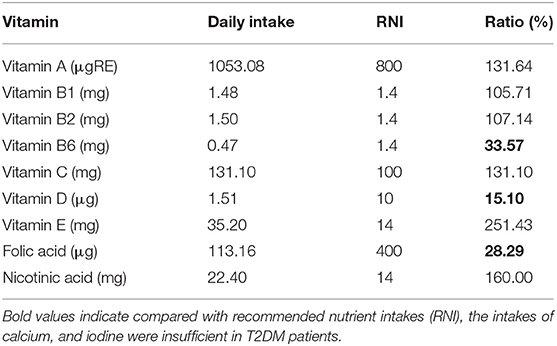
Table 4. Comparison of daily vitamin intake and recommended amount in T2DM group.
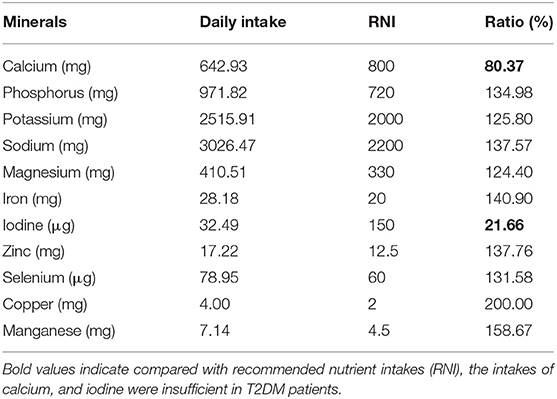
Table 5. Comparison of daily mineral intake and recommendation amount in T2DM group.
The daily intakes of vegetables, tuber crop, fruits, nuts, cakes, cholesterol, vitamin B6, vitamin E, folic acid, calcium, phosphorus and sodium were statistically different in three groups (P < 0.05) (Table S1).
Gut Microbiota Diversity
Sequencing Coverage and Bacterial Diversity Analysis
The participants' clinical information was listed in Table 6. We obtained 3,269,951 usable optimized raw sequences; average length of optimized sequence is 436.82 bp. The sequences were clustered into OTU. Seven hundred and twenty six OTUs were clustered form 60 samples by bioinformatics statistical analysis, and species classification information of each OTU was obtained.
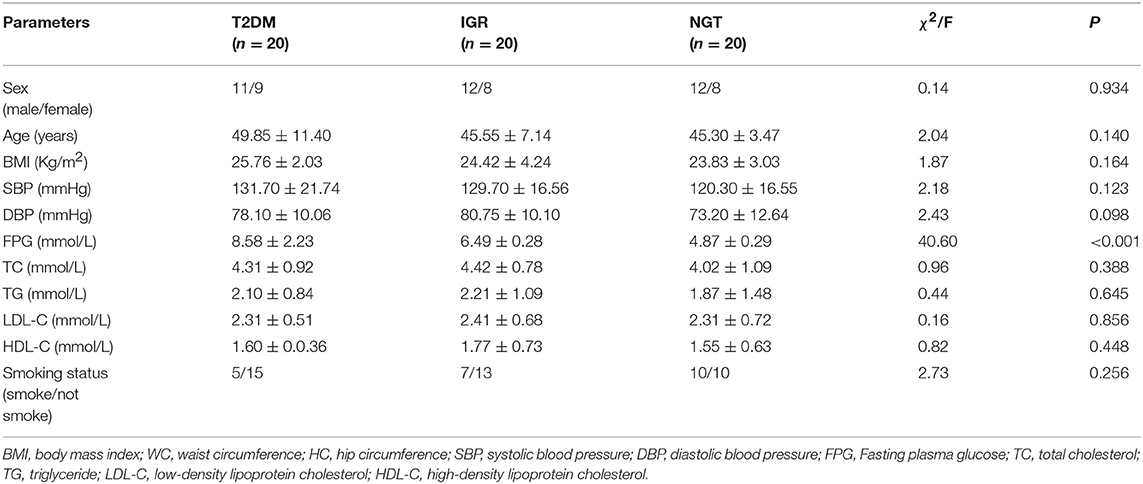
Table 6. Comparison of clinical characteristics between three groups.
Changes in the richness and diversity of the gut microbiota were estimated by Sobs index, Shannon index, Simpson index, ACE index, and Chao index. The differences of Shannon index, Sobs index, and Simpson index were statistically significant in three groups (P < 0.05; Table 7). Sobs index and Shannon index of IGR were significantly lower than that of NC, Simpson index of IGR was significantly higher than that of NC (P < 0.05). No significant differences were detected between T2DM and NC groups, T2DM and IGR based on indexes reflecting the α-diversity (Figure 1).
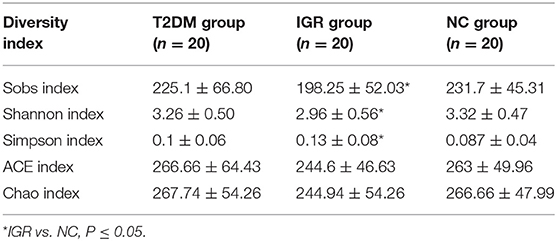
Table 7. Comparison of microbiota diversity index between three groups.
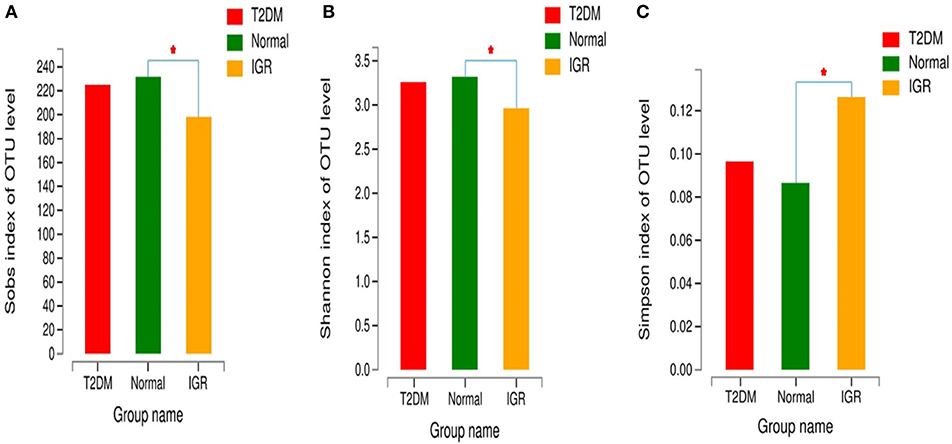
Figure 1. Comparison of α-diversity indexes in T2DM, IGR, and NC groups. *Compare two group, P < 0.05 (A) α diversity-Sobs index bar chart (B) α diversity-Shannon index bar chart (C) α diversity-Simpson index bar chart.
Gut Microbiota at Different Taxonomic Levels
According to the Venn map analysis, it was found that there were 516 common OTU of the three groups, 540 species were common in IGR and NC, 548 species were common in the IGR, and T2DM, and 568 species were common in the T2DM and NC. There were 22 species specific to the IGR group, 56 species specific to the T2DM group, and 24 species specific in the normal group (Figure 2).
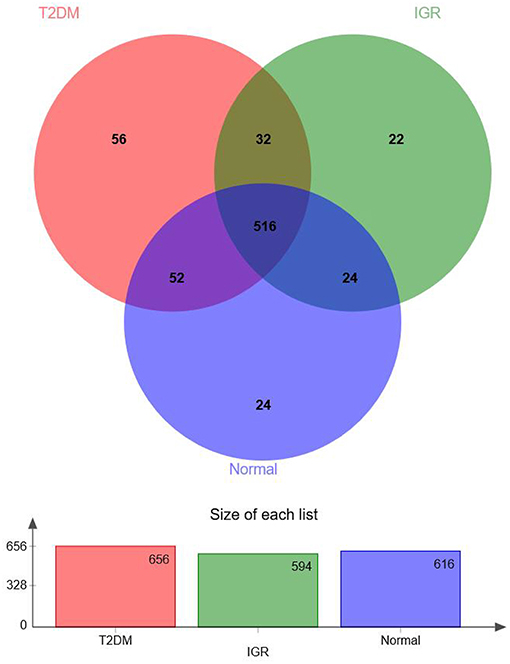
Figure 2. Venn map of OTUs.
Fifteen phyla, 223 genera and 452 species were identified. At the phylum level, dominant bacterial phyla in three groups were Firmicutes, Bacteroidetes, Proteobacteria, Actinobacteria, Verrucomicrobia, Cyanobacteria, Fusobacteria, Elusimicrobia. Among them, Firmicutes, and Bacteroidetes had the highest abundance in three groups, Bacteroidetes accounted for 32.13, 38.35, and 36.41%, respectively, and Firmicutes accounted for 62.05, 55.53, and 52.95%, respectively. The abundance of the bacterial phyla including Proteobacteria and Actinomycetes was 2.94 and 2.13% in the T2DM group, 3.14 and 2.47% in the IGR group, and 4.79 and 4.57% in the normal control group. At the phylum classification level, the structural components of the gut microbiota of the newly T2DM, IGR, and NC showed differences. Compared with the NC, the abundance of gut microbiota in T2DM and IGR was decreased, gut microbiota diversity was reduced, the relative abundance of Firmicutes and Actinobacteria were increased, and the relative abundance of Bacteroidetes and Proteobacteria were reduced (Figures 3, 4).
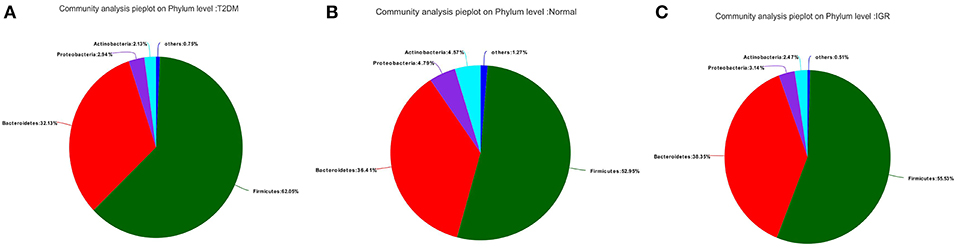
Figure 3. Pie charts of gut microbiota at phylum level in three groups. (A) T2DM group (B) NC group (C) IGR group.
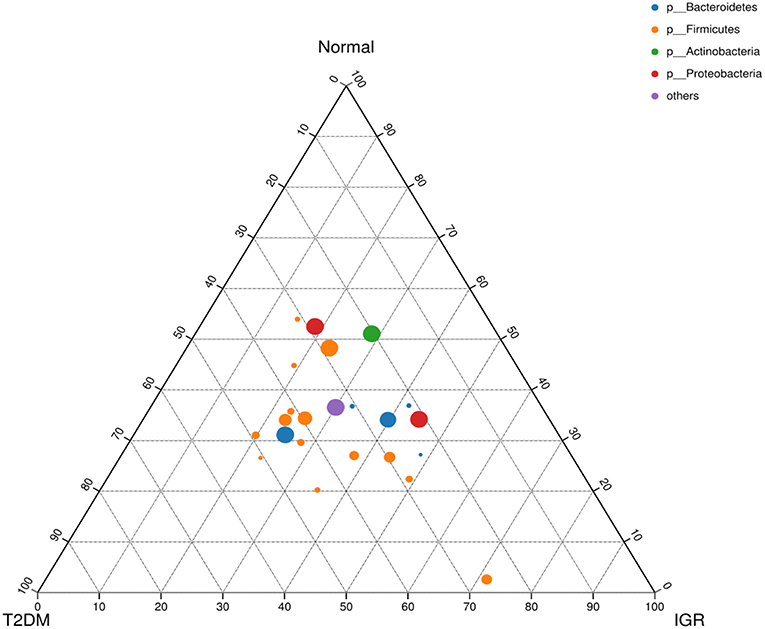
Figure 4. Ternary chart of three groups. Three angles represent three groups, colored circle in the triangle represents species at phylum level, and smaller circle represent species at genus level, the size of the circle represent the relative abundance of the species.
Compared to NC, Saccharibacteria was significantly increased in T2DM and IGR. Deferribacteres was significantly increased in T2DM compared to NC and IGR (Figure 5). Overall IGR patients had increased level of Megamonas, Haemophilus, norank_p_Saccharibacteria, had decreased levels of Ruminococcaceae, Barnesiella, Sutterella, Ruminiclostridium, Clostridiales, Coriobacteriaceae, Flavonifractor compared to NC, had decreased levels of Moryella, Lachnospiraceae_NC2004_group compared to T2DM. T2DM had increased level of Lachnospiraceae_ND3007_group, Tyzzerella_3, norank_p_Saccharibacteria, Cetobacterium, Mucispirillum, Proteiniphilum, had decreased level of Barnesiella, Ruminiclostridium_9, unclassified_o_Bacteroidales that compared to NC.

Figure 5. Bar plot of gut microbiota comparison at phylum level of three groups. (A) Gut microbiota comparison in three groups. (B) Saccharibacteria comparison in NC and IGR groups. (C) Deferribacteres comparison in NC and T2DM groups. (D) Deferribacteres comparison in T2DM and IGR groups; *Compare groups, P < 0.05.
About 50% of the total microbial abundance in three groups was represented by seven genera: Prevotella, Faecalibacterium, Bacteroides, Eubacterium_rectale_group, Megasphaera, Megamonas, and Dialister.
Linear Discriminant Effect Size (LEfSe) Analysis
Many microbial taxa significantly differed between the T2DM, IGR, and NC groups with LDA score >2 using LEfSe analysis. We found that Saccharibacteria, Veillonella, Pasteurellaceae, and Haemophilus taxa were over-represented in IGR group; Family Ruminococcaceae of the phylum Firmicutes, genus Mucispirillum, and class Deferribacteres were apparently more abundant in the T2DM groups. Genus Ruminococcaceae_UCG_002, genus Dielma, family Porphyromonadaceae, genus norank_f__Ruminococcaceae were more abundant in NC group (Figure 6).
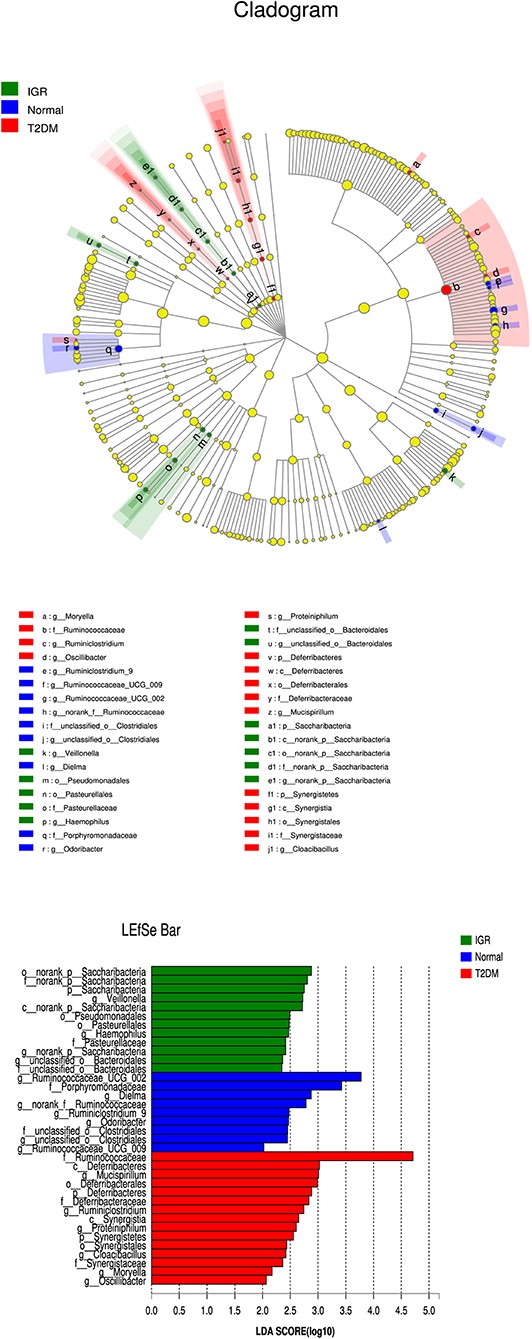
Figure 6. LEfSe cladogram and LDA bar chart. Circular cladogram for niche specialization of microbial compositions in three groups using the linear discriminant analysis effect size (LEfSe) analysis of the abundance patterns of bacterial taxa. The circles used in this diagram represent the taxonomic categories of organisms from the genus level as the outermost circle to phylum level as the innermost cycle. Within each given taxon, each small cycle represents its lower clade. The yellow nodes indicate no statistically significant differences of a given taxon between the samples of three groups, the red nodes indicate significantly higher relative abundance in T2DM than other two groups, the green nodes indicate significantly higher relative abundance in the IGR than other two groups, and the blue nodes indicate significantly higher relative abundance in NC than other two groups. The size of the node is in proportion to the LDA score. The links (lines) between the nodes mean hypothetically phylogenetic relationships among organisms, which can be traced back to where the lines branch off (hypothetical ancestor).
Association Between Microbiota Composition and Dietary Factors
Environmental factor analysis assesses the correlation between microbes and environmental variables. There are many environmental factors related to the composition of the gut microbiota, but many of them are auto-correlated. Therefore, before the environmental factor analysis, the environmental factor screening can be prioritized, and the environmental factors with less interaction are retained for subsequent research. The environmental factors collected in this study that including basic clinical data and dietary intake. Variance inflation factor (VIF) analysis is a commonly used environmental factor screening method. By analyzing the index of the variance expansion factor >10, it can be considered as an auto-correlation environmental factor and can be excluded. The VIF values of iron and zinc elements after dietary environmental factor analysis were >10 and were therefore excluded. All environmental factors in this study were divided into four parts, which first part were basic data and clinical data, including age, gender, and blood glucose and blood lipids. The second part includes all kinds of main food intakes, the third part is about macro nutrient intake, and the fourth part related to vitamin and trace element intake. RDA and CCA analysis were used to detect the relationship between environmental factor and microbial composition.
Correlation Study of Bacterial Phylum and Environmental Factors
Abundance of Bacteroidetes was negatively correlated with LDL-C; Abundance of Tenericutes was positively correlated with HDL-C and cake intake; Actinobacteria was positively correlated with BMI, WC, HC and folic acid intake, negatively correlated with fat intake. Firmicutes was negatively correlated with beverage and alcohol intake. Spirochaetae was negatively correlated with age, and negatively correlated with fungus, fruits, beans, vitamin C, dietary fiber, and calcium intake. Fusobacteria was positively correlated with beans intake, and was negatively correlated with oil intake. Proteobacteria was positively correlated with tuber crops intake. Synergistetes was positively correlated with FBG, cholesterol, nicotinic acid, and selenium intake. Deferribacteres was negatively correlated with FBG and magnesium intake (Figure 7).
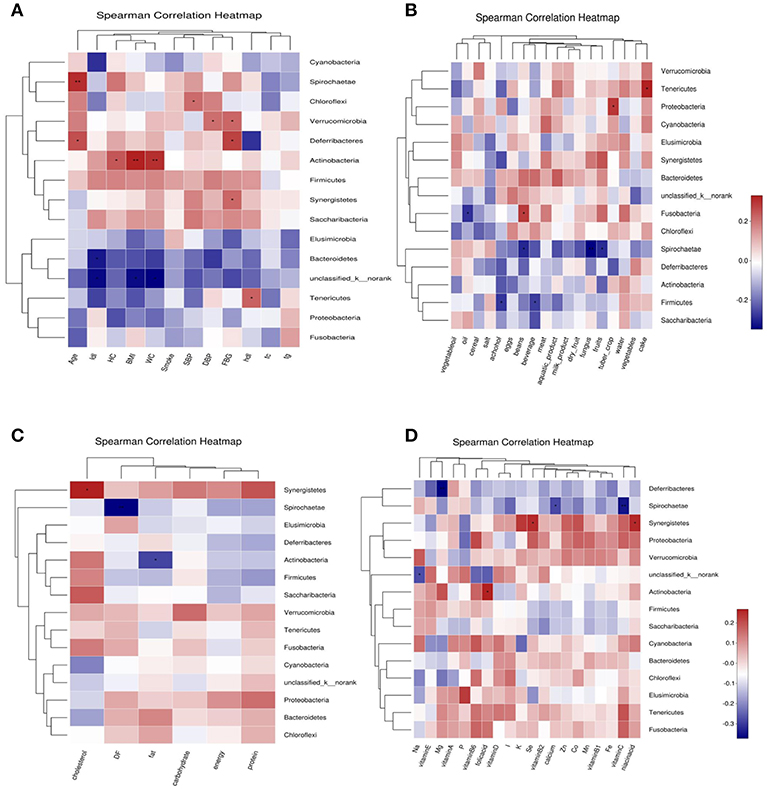
Figure 7. Correlation heatmap between bacterial phylum and clinical data (A), Correlation heatmap between bacterial phylum and daily foods (B), Correlation heatmap between bacterial phylum and daily average intake of macro nutrient (C), Correlation heatmap between bacterial phylum daily average intake of Vitamins and Minerals (D).
Correlation Study of Bacterial Genus and Environmental Factors
Among the basic clinical indicators, age (P < 0.05), BMI, LDL-C, and HC had a greater impact on the structure of bacteria genus in the three groups; there was a positive correlation between environmental factors; Prevotella_9 was negatively correlated with WC, HC, and BMI; Megamonus was positively correlated with HDL-C. Ruminococcaceae_UGC-002 was negatively correlated with BMI; Phascolarctobacterium was negatively correlated SBP, BMI, WC, and HC; Bifidobacterium was positively correlated with BMI, WC, and HC; Dialister was positively correlated with SBP, DBP, and LDL-C; Ruminococcus_1 and Faecalibacterium was positively correlated with age. In the analysis of food intake and bacterial genus correlation, the intake of cakes, eggs, dairy products and fruits had a great influence on the structure of bacterial genus in three groups; The intake of salt, beverage (P < 0.05) and alcohol (P < 0.05) also has a greater degree of influence on bacterial genus composition. Prevotella_7 was positively correlated with fruits, meat and beverage intake; Megasphaera was positively correlated with beverage intake; Megamonas was positively correlated with cake intake; Ruminococcus_1 was negatively correlated with fungus, alcohol, bean and meat intake; Dialister was positively correlated with water intake, negatively correlated with eggs and alcohol intake; Subdoligranulum was negatively correlated with crops, alcohol, and beverage intake RDA/CCA analysis of macronutrient and bacterial genus found that cholesterol intake, energy intake and protein intake had a greater impact on the bacteria composition in three groups. Prevotella-7 was positively correlated with protein and energy intake; Megasphaera was positively correlated with cholesterol intake; Dialister was positively correlated with carbohydrate intake. The intake of vitamin A (P < 0.05), vitamin D, niacin and folic acid had a great influence on the structure of the bacteria; the intake of copper (P < 0.05), sodium and manganese also had a great influence on the structure of the bacteria; Megasphaera was positively correlated with Fe, Co, K and Vitamin A intake; Dorea was positively correlated with Mg intake; Prevotella_7 was positively correlated with Vitamin B2, Se, Zn, and Fe intake; Ruminococcus_2 was positively correlated with Mg and folic acid intake. Blautia was positively correlated with Mg (Figure S1).
Discussion
The gut microbiota is a complex, diversified ecosystem that is symbiotic with humans. The gut microbiota and its genes and metabolites plays an important role in a series of pathophysiological processes such as pathogens invasion, establishment of immunity, nutrient digestion and absorption, body growth and metabolism, immunity and anti-tumor process, and can be combined with intestinal epithelial cells and other genes, and interact with organs and the entire human body. The diversity of intestinal microbiota is related to the occurrence of metabolic diseases such as obesity and diabetes. The interaction between gut microbiota and host may be one of the environmental risk factor for the development of T2DM (12). Diabetes is a complex clinical syndrome that arises from the interaction of environmental, genetic, and health behaviors, with environmental factors (diet, gut microbiota, age, lifestyle, and obesity); especially in T2DM that plays an important role. IGR is the pre-existing status of diabetes. Whether the regulation of gut microbiota can effectively improve the blood glucose level of IGR needs further study. Early prevention of environmental risk factors of diabetes from the IGR stage is beneficial to reduce the incidence of T2DM.
In this study, high-throughput sequencing of microbial diversity was applied to study the gut microbiota diversity between T2DM patients (n = 20), IGR patients (n = 20), and normal healthy controls (n = 20) with dietary survey by food frequency questionnaire (FFQ) in Uyghur population. We used strict inclusion criteria, all of Chinese Uyghur population in this study were Urumqi city citizen. T2DM patients are newly diagnosed, without using any kind of anti-diabetes medicines. Antibiotic had influence to the gut microbiota diversity (13). So we excluded people who used the antibiotics in the previous month, while excluded people who had some conditions, such as medication for hypertension, prescribed lipid lowering drugs, cardiovascular disease history, special diet, dietary supplement use, mental problems. The mean age, WC, SBP, FPG, TC of the T2DM and IGR patients were significantly (P < 0.01) higher than that of the NC in the dietary survey population, but we controlled the compound factors in the 60 subjects that had metagenomics study. The main regulator of the gut microbiota is including age, ethnicity, diet and the immunity. This study undergone in one ethnic population, and newly diagnosed T2DM and IGR population, reduced the interaction effect of nationality, dietary habit, and drug on the gut microbiota.
A high-fat diet may induce dysbiosis of gut microbiota, which can result in a low grade inflammatory state, obesity and other metabolic disorders (14). In our study, compared with the recommended amount of Chinese dietary guidelines and RNI, the daily intakes of vegetables, fish, shrimp and dairy products, vitamin B6, vitamin D, folic acid, calcium, and iodine were insufficient for T2DM patients, and the intake of cereals, meat, salt, oil, fat, nicotinic acid, vitamin E, potassium, iron, copper, and manganese were excessive. The daily intake of vegetables, tuber crop, fruits, nuts, cakes, cholesterol, vitamin B6, vitamin E, folic acid, calcium, phosphorus, and sodium was statistically different in three groups (P < 0.05). The fruit and dairy pattern may a protective factor for metabolic syndrome and hypertension and the meat eating patterns may a risk factor for fasting hyperglycemia and obesity and the Uyghur specific pattern of diet may a protective factor for fasting hyperglycemia (15). Results in our study are not completely consistent with the results of above research, which may be related to different regions where the study population was located.
The sequencing depth was adequate for all samples, and the sequencing coverage depth was >97%. The α-diversity analysis showed that the Sobs index, Shannon index, and Simpson index of the three groups were statistically significant, indicating that there were differences in gut microbiota diversity in the three groups. The Shannon index and Sobs index of the NC group larger than that of IGR group indicated that the bacterial abundance of the NC group was high; the Simpson index of the IGR group was larger than that of the NC group, indicating that the bacterial community diversity of the IGR group was low.
The bacterial structure analysis showed that the common dominant bacteria in the intestinal tract of the three groups were Firmicutes, Bacteroidetes, Proteobacteria, Actinobacteria, Verrucomicrobia, Cyanobacteria, Fusobacteria, Elusimicrobia, and others. Firmicutes is the most abundant phylum in this population, which has commonly been found to be the most abundant bacteria (16–18). Firmicutes and Bacteroidetes are the two main bacteria phylum involved in the metabolism of the host and fat accumulation. Changes in the ratio of Bacteroidetes to Firmicutes are associated with multiple disease states.
On the phylum level, Saccharibacteria has different abundance between three groups, the abundance of Saccharibacteria in the T2DM and IGR group was significantly higher than that in the NC group (P < 0.05). Deferribacteres was significantly increased in T2DM compared to NC and IGR.
The Saccharibacteria known as TM7 (19), is a newly discovered candidate bacteria (20). In the recent study, TM7 was cultured from human oral cavity, and showed that TM7 is extremely tiny cocci (200–300 nm) whose unique lifestyle has never been observed in human-related micro-organisms (21). In 2014, a study reported the aseptic culture of oral TM7, but did not provide sequence and culture methods (22). The TM7 in the environment is similar to TM7 in human skin and oral cavity, indicating that TM7, which is metabolically active in environmental sites, can be used as a model organism to better understand the role of TM7 in human health (23). Recently, Erin K. Crowley et al studied the effects of dietary supplements containing a mixture of magnesium-rich marine minerals on the diversity of the gastrointestinal microbiota, and found that the abundance of TM7 in the intervention group was reduced, indicating that the abundance of the bacteria has a certain correlation with trace element magnesium (24). Studies have reported that TM7 is associated with diseases such as periodontitis, vaginitis and IBD (21). In addition, this bacterium has been reported in the study of Crohn's disease and IBD, and it is shown that TM7 is associated with intestinal mucosal inflammatory diseases (25). Saccharibacteria may play a role in the intestinal mucosal inflammatory response of T2DM, and the mechanism needs further study.
About 50% of all bacteria were represented by seven genera: Prevotella, Faecalibacterium, Bacteroides, Eubacterium_rectale_group, Megasphaera, Megamonas, and Dialister. Overall IGR patients had increased level of Megamonas, Haemophilus, norank_p__Saccharibacteria, had decreased levels of Ruminococcaceae, Barnesiella, Sutterella, Ruminiclostridium, Clostridiales, Coriobacteriaceae, Ruminiclostridium, Flavonifractor compared to NC, had decreased levels of Moryella, Lachnospiraceae_NC2004_group compared to T2DM. T2DM had increased level of Lachnospiraceae_ND3007_group, Tyzzerella_3, norank_p__Saccharibacteria, Cetobacterium, Mucispirillum, Proteiniphilum, had decreased level of Barnesiella, Ruminiclostridium_9, unclassified_o__Bacteroidales that compared to NC. We found that Saccharibacteria, Veillonella, Pasteurellaceae, and Haemophilus taxa were over-represented in IGR group; Family Ruminococcaceae of the phylum Firmicutes, genus Mucispirillum, and class Deferribacteres were apparently more abundant in the T2DM groups. Genus Ruminococcaceae_UCG_002, genus Dielma, family Porphyromonadaceae, genus norank_f__Ruminococcaceae were more abundant in NC group.
Megamonas belongs to the Firmicutes, which is useful for organic nutrient, fermenting various carbohydrates, and the final products of Megamonas are acetic acid, propionic acid and lactic acid. Studies have shown that the abundance of Megamonas in the intestinal tract of Chinese population is lower than that of Africans (26), especially in the intestinal tract of centenarians (27). Chiu et al. (28) reported that the abundance of Megamonas in the intestines of Chinese Taiwanese obese people was higher. The abundance of Megamonas in the intestines of healthy people of Yao nationality in China is low, which is related to the special healthy eating habits of the ethnic group (29). Studies have shown that a decrease in Bacteroidetes, an increase in Firmicutes, or a decrease in the ratio of Bacteroidetes and Firmicutes can cause obesity, so it is proposed that the ratio of Firmicutes and Bacteroidetes can be used as a biomarker for T2DM. This study found that the abundance of Megamonas in the T2DM and IGR group increased, which may be related to the occurrence and development of T2DM. Haemophilus belongs to the Proteobacteria, which is a gram-negative facultative anaerobic bacterium. It is only parasitic on the intestinal mucosa of human or animal, and is sensitive to chloramphenicol, tetracycline and sulfonamide. There are several subspecies of this genus, some of which are related to clinical pathogenesis (30). This study only analyzed the differences in genus levels, and the differences in species levels are for further study. Ruminococcaceae belongs to the gram-positive bacteria of the thick-walled bacteria and produces butyric acid. The immune response caused by intestinal flora, especially the immune response caused by the short-chain fatty acids (SCFA) of the flora, plays an important role in the development of metabolic diseases such as diabetes (31). Intestinal bacteria can convert carbohydrates and polysaccharides in food that cannot be decomposed by the host itself into SCFA. SCFA is considered to be an important potential metabolic target in glucose metabolism and insulin resistance, preventing obesity and T2DM. The main components of SCFAs, acetic acid, propionic acid, and butyric acid, are absorbed by the intestinal mucosa, affecting 10% of the host's nutrient intake. Studies have found that people with a lack of butyrate-producing bacteria in the body are prone to T2DM, and patients with T2DM have reduced SCFAs in the intestine (32). In this study, the abundance of butyric acid producing bacteria in the IGR group was reduced, which was consistent with the results of Karlsson et al. (32).
Barnesiella belongs to the genus Bacteroides and is a newly discovered genus (33). In this study, the abundance of Barnesiella was reduced in the IGR group. Sutterella belongs to the Proteobacteria and is a common commensal bacteria in the human intestine. The bacteria adhere to the intestinal epithelial cells and are associated with low pre-inflammatory state of the intestine and have immunomodulatory effects (34). Clostridiale in Clostridium belongs to the Firmicutes, is a gram-positive anaerobic bacterium, cannot survive in an aerobic environment, and has strong spore resistance (35). Kelly et al. (36) reported that changes in the structure of Clostridiale are closely related to the mucosal integrity of the intestinal mucosa, and its structural changes are related to metabolic diseases such as diabetes. The abundance of Clostridiale in the intestinal flora of Danish pre-diabetic populations was reduced and correlated with low-grade inflammation, consistent with the results of this study (9). It is suggested that the abundance of Clostridiale bacteria changes during the IGR phase, and this change may play an important role in the development of diabetes.
This study found that Bacteroidetes was negatively correlated with LDL-C, Tenericumes was negatively correlated with HC and TC, Teneriquets was positively correlated with HDL-C, and Actinobacteria was positively correlated with BMI. Kasselman et al. (37) reported that the proportion of Bacteroidetes and Firmicutes in the intestinal flora of obese people was significantly lower than that of normal body mass. This study suggests that Bacteroidetes, Firmicutes, and Actinobacteria may be involved in lipid metabolism, but the mechanism is unclear. This study tried to achieve a balance between groups and reduced the impact of other confounding factors on the gut microbiota.
Diet is an important determinant of the structure and diversity of the gut microbiota. Diets that consume high fats and high sugars alter the composition of healthy microbiota, leading to microbial imbalance in the gut, a phenomenon known as “microbial dysbiosis” (38). Studies have shown that metabolic diseases such as obesity and DM are the result of interactions between gut microbiota, diet, and host (39). Numerous studies have shown that dietary intake plays an important role in shaping the gut microbiota and maintaining gut health. In healthy individuals, more than 90% of nutrients are absorbed by the small intestine and transported throughout the body to maintain the health. Complex carbohydrates (fibers) are not easily absorbed by the small intestine; enter the colon as food debris, protein residues and primary bile acids secreted by the liver in response to fat intake also enter the colon. Food entering the colon maintains intestinal health through fermentation, determines the composition and function of intestinal microbes, and plays a key role in the health of the body (40).
Dietary fiber is one of the main factors affecting microbial diversity. A comparative study of fecal samples from vegetarians, vegans, and omnivores showed that Enterobacteriaceae, Bacteroides, Bifidobacteria were significantly reduced in vegan compared to the omnivorous control group. Enterobacteriaceae levels were between vegans and controls (41). Another study conducted in remote parts of Africa and children in Europe showed that the gut microbiological structure of the two groups was significantly different, possibly related to the different dietary fiber intakes of the two groups (European children 8.4 g/day, African children 14.2 g/day) (42). Another research team conducted a two-week food exchange diet intervention experiment. After African Americans ingested a high-fiber, low-fat diet, while Africans in remote areas ingested a high-fat, low-fiber Western diet, the gut microbiota has changed in both groups (43).
Fat stimulates the secretion of bile acids, further affecting the gut microbiota. Bile acids are digested by the bacteria into secondary bile acids in the colon. Taira et al reported (44) that when the mice were changed from a low-fat diet to a high-fat diet, the structure of the gut microbiota changed, with thick-walled bacteria increasing and the number of Bacteroidetes decreasing. Similarly, in the another animal studies (45), when the animals were fed high-fat diet, flora changes, reducing Lactobacillales and Clostridium increase the subpopulations XIVa. However, because the mixed consumption of meat and fat is often accompanied by a decrease in fiber intake, there is still a lack of evidence that fat has a direct effect on the human gut microbiota.
The dietary fiber required for human body is usually obtained from whole grains of fruits, vegetables, and grains. Long-term dietary fiber-led diet may alter the gut microbiota, accompanied by an increase in the abundance of thick-walled bacteria, so dietary fiber may have some immunomodulatory and anti-inflammatory functions, affecting the host's immune response and function (46). In the previous discussion, it was found that an unbalanced diet leads to disorders in the structure and function of the gut microbiota, accompanied by an increase in metabolites that promote inflammation, promote proliferation, and increase disease risk. Based on evidence from epidemiological, animal, and human experimental studies, supportive diet plays an important role in the development and evolution of T2DM. For example, fiber and milk are associated with reduced risk of T2DM (47), while red meat and processed meat are associated with elevated T2DM risk, and this study has strong and consistent evidence in prospective studies (48). At the same time, dietary interventions can reshape the gut flora and alter the dietary residue entering the colon. Therefore, dietary intervention and intestinal flora intervention are promising options for preventing T2DM. Based on available evidence, it is recommended that people at high risk of T2DM adopt a balanced diet with a fiber-rich diet. Based on the results of studies on the intestinal flora and mechanisms of humans and animals, we believe that it is full of possibilities to prevent T2DM by continuing to study dietary strategies.
This study tried to achieve a balance between groups and reduced the impact of other confounding factors on the intestinal flora. However, there are many factors affecting the intestinal flora (dietary habits, lifestyle, disease status, etc.), so in order to further verify the results, it is necessary to increase the sample size for further research. This study analyzed the distribution characteristics of IGR from the perspective of intestinal flora, and tried to find the key bacteria to promote the development of diabetes, and provide theoretical basis and new therapeutic approaches for further intervention and treatment of diabetes.
Conclusion
In summary, imbalance of intestinal microbiota may be related to the occurrence of IGR and T2DM in Uyghur population, but its mechanism needs further study. This study analyzed the distribution of intestinal microbiota IGR and newly diagnosed T2DM patients, which showed a significant decrease in the diversity and abundance of the IGR group than healthy people, and speculated that Bacteroidetes and Saccharibacteria may be related to the occurrence of T2DM. It provides a theoretical basis and a new therapeutic approach for further intervention and treatment of diabetes.
Author Contributions
PM and RN designed and supervised this investigation. RN and JC performed this investigation. AK and YZ contributed to the data collection. All authors read and approved the final manuscript.
Funding
This work was supported by the 13th Five-year Plan Key Disciplines (Plateau Discipline: Public Health and Prevention Medicine) Foundation of Xinjiang Uyghur Autonomous region of China; and National Natural Science Foundation of China (Grant No. 81860743).
Conflict of Interest Statement
The authors declare that the research was conducted in the absence of any commercial or financial relationships that could be construed as a potential conflict of interest.
Acknowledgments
The author would like to thank the all participants in this research. We wish to thank the 22nd Scientific Meeting of the Chinese Diabetes Society displayed our research abstract as cofference poster (RN, CJ, AK, Shan Jiao-yu, Zhang Bing, Patamu Mohemaiti. Correlation study on gut microbiota and dietary intake of new-onset T2DM and IGR patients, The 22nd Scientific Meeting of the Chinese Diabetes Society; 2018 Nov 28-Dec 1; Suzhou, Jiangsu, China).
Supplementary Material
The Supplementary Material for this article can be found online at: https://www.frontiersin.org/articles/10.3389/fendo.2019.00295/full#supplementary-material
Table S1. Comparison of daily intake of foods and nutrients of three groups.
Figure S1. (A) Correlation heatmap between bacterial genus and clinical data. (B) Correlation heatmap between bacterial genus and daily average intake of foods. (C) Correlation heatmap between bacterial genus and macro nutrition intakes. (D) Correlation heatmap between bacterial genus and daily average intake of Vitamins and Minerals. Note: The different colors or shape points in the figure represent samples, the color and shape of the points represent different groupings, the distance between the points represents the similarity and difference of the samples; the green arrow represents the species; the red arrow represents the quantitative environmental factor, the environmental factor arrow The length of the environmental factor can represent the degree of influence (interpretation) of the environmental factors on the species data; the angle between the environmental factor arrows represents positive and negative correlations (sharp angle: positive correlation; obtuse angle: negative correlation; right angle: no correlation); Projecting from the sample point to the arrow of the quantitative environmental factor, the distance from the origin of the projection point represents the relative influence of the environmental factor on the sample community distribution.
References
1. Blandino G, Inturri R, Lazzara F, Di Rosa M, Malaguarnera L. Impact of gut microbiota on diabetes mellitus. Diabetes Metab. (2016) 42:303–15. doi: 10.1016/j.diabet.2016.04.004
2. Le Chatelier E, Nielsen T, Qin J, Prifti E, Hildebrand F, Falony G, et al. Richness of human gut microbiome correlates with metabolic markers. Nature. (2013) 500:541–6. doi: 10.1038/nature12506
3. Aw W, Fukuda S. Toward the comprehensive understanding of the gut ecosystem via metabolomics-based integrated omics approach. Semin Immunopathol. (2015) 37:5–16. doi: 10.1007/s00281-014-0456-2
4. Semenkovich CF, Danska J, Darsow T, Dunne JL, Huttenhower C, Insel RA, et al. American diabetes association and JDRF research symposium: diabetes and the microbiome. Diabetes. (2015) 64:3967–77. doi: 10.2337/db15-0597
5. Wang M, Monaco MH, Donovan SM. Impact of early gut microbiota on immune and metabolic development and function. Semin Fetal Neonatal Med. (2016) 21:380–7. doi: 10.1016/j.siny.2016.04.004
6. Chan JC, Zhang Y, Ning G. Diabetes in China: a societal solution for a personal challenge. Lancet Diabetes Endocrinol. (2014) 2:969–79. doi: 10.1016/S2213-8587(14)70144-5
7. Gong H, Pa L, Wang K, Mu H, Dong F, Ya S, et al. Prevalence of diabetes and associated factors in the Uyghur and Han population in Xinjiang, China. Int J Environ Res Public Health. (2015) 12:12792–802. doi: 10.3390/ijerph121012792
8. Hu C, Jia W. Diabetes in China: epidemiology and genetic risk factors and their clinical utility in personalized medication. Diabetes. (2018) 67:3–11. doi: 10.2337/dbi17-0013
9. Allin KH, Tremaroli V, Caesar R, Jensen BAH, Damgaard MTF, Bahl MI, et al. Aberrant intestinal microbiota in individuals with prediabetes. Diabetologia. (2018) 61:810–20. doi: 10.1007/s00125-018-4550-1
10. Eades CE, Leese GP, Evans JM. Incidence of impaired glucose regulation and progression to type 2 diabetes mellitus in the Tayside region of Scotland. Diabetes Res Clin Pract. (2014) 104:e16–9. doi: 10.1016/j.diabres.2014.01.012
11. Holmes AJ, Chew YV, Colakoglu F, Cliff JB, Klaassens E, Read MN, et al. Diet-microbiome interactions in health are controlled by intestinal nitrogen source constraints. Cell Metab. (2017) 25:140–51. doi: 10.1016/j.cmet.2016.10.021
12. Paun A, Danska JS. Modulation of type 1 and type 2 diabetes risk by the intestinal microbiome. Pediatr Diabetes. (2016) 17:469–77. doi: 10.1111/pedi.12424
13. Becattini S, Taur Y, Pamer EG. Antibiotic-induced changes in the intestinal microbiota and disease. Trends Mol Med. (2016) 22:458–78. doi: 10.1016/j.molmed.2016.04.003
14. Fallucca F, Porrata C, Fallucca S, Pianesi M. Influence of diet on gut microbiota, inflammation and type 2 diabetes mellitus. First experience with macrobiotic Ma-Pi 2 diet. Diabetes Metab Res Rev. (2014) 30:48–54. doi: 10.1002/dmrr.2518
15. Liu J, Yao H, Zhang L, GongShaHaTi L, Gu K, MuTaiLiPu K, et al. Study on the relationship between dietary patterns and metabolic syndrome and its components in Xinjiang Uygur population. Wei Sheng Yan Jiu. (2016) 45:725–32.
16. Pfughoeft KJ, Versalovic J. Human microbiome in health and disease. Annu Rev Pathol. (2012) 7:99–122. doi: 10.1146/annurev-pathol-011811-132421
17. The Human Microbiome Project Consortium. Structure, function and diversity of the healthy human microbiome. Nature. (2012) 486:207–14. doi: 10.1038/nature11234
18. Hollister EB, Gao C, Versalovic J. Compositional and functional features of the gastrointestinal microbiome and their effects on human health. Gastroenterology. (2014) 146:1449–58. doi: 10.1053/j.gastro.2014.01.052
19. Albertsen M, Hugenholtz P, Skarshewski A, Nielsen KL, Tyson GW, Nielsen PH. Genome sequences of rare, uncultured bacteria obtained by differential coverage binning of multiple metagenomes. Nat Biotechnol. (2013) 31:533–8. doi: 10.1038/nbt.2579
20. Pace NR. Mapping the tree of life: progress and prospects. Microbiol Mol Biol Rev. (2009) 73:565–76. doi: 10.1128/MMBR.00033-09
21. He X, McLean JS, Edlund A, Yooseph S, Hall AP, Liu SY, et al. Cultivation of a human-associated TM7 phylotype reveals a reduced genome and epibiotic parasitic lifestyle. Proc Natl Acad Sci USA. (2015) 112:244–9. doi: 10.1073/pnas.1419038112
22. Soro V, Dutton LC, Sprague SV, Nobbs AH, Ireland AJ, Sandy JR, et al. Axenic culture of a candidate division TM7 bacterium from the human oral cavity and biofilm interactions with other oral bacteria. Appl Environ Microbiol. (2014) 80:6480–9. doi: 10.1128/AEM.01827-14
23. Dinis JM, Barton DE, Ghadiri J, Surendar D, Reddy K, Velasquez F, et al. In search of an uncultured human-associated TM7 bacterium in the environment. PLoS ONE. (2011) 6:1–8. doi: 10.1371/journal.pone.0021280
24. Crowley EK, Long-Smith CM, Murphy A, Patterson E, Murphy K, O'Gorman DM, et al. Dietary supplementation with a magnesium-rich marine mineral blend enhances the diversity of gastrointestinal microbiota. Mar Drugs. (2018) 16:E216. doi: 10.3390/md16060216
25. Kuehbacher T, Rehman A, Lepage P, Hellmig S, Fölsch UR, Schreiber S, et al. Intestinal TM7 bacterial phylogenies in active inflammatory bowel disease. J Med Microbiol. (2008) 57:1569–76. doi: 10.1099/jmm.0.47719-0
26. Alolga RN, Fan Y, Chen Z, Liu LW, Zhao YJ, Li J, et al. Significant pharmacokinetic differences of berberine are attributable to variations in gut microbiota between Africans and Chinese. Sci Rep. (2016) 6:27671. doi: 10.1038/srep27671
27. Wang F, Yu T, Huang G, Cai D, Liang X, Su H, et al. Gut microbiota community and its assembly associated with age and diet in Chinese centenarians. J Microbiol Biotechnol. (2015) 25:1195–204. doi: 10.4014/jmb.1410.10014
28. Chiu CM, Huang WC, Weng SL, Tseng HC, Liang C, Wang WC, et al. Systematic analysis of the association between gut flora and obesity through high-throughput sequencing and bioinformatics approaches. Biomed Res Int. (2014) 2014:906168. doi: 10.1155/2014/906168
29. Liao M, Xie Y, Mao Y, Lu Z, Tan A, Wu C, et al. Comparative analyses of fecal microbiota in Chinese isolated Yao population, minority Zhuang and rural Han by 16sRNA sequencing. Sci Rep. (2018) 8:1142. doi: 10.1038/s41598-017-17851-8
30. Nørskov-Lauritsen N. Classification, identification, and clinical significance of Haemophilus and Aggregatibacter species with host specificity for humans. Clin Microbiol Rev. (2014) 27:214–40. doi: 10.1128/CMR.00103-13
31. Xu J, Lian F, Zhao L, Zhao Y, Chen X, Zhang X, et al. Structural modulation of gut microbiota during alleviation of type 2 diabetes with a Chinese herbal formula. ISME J. (2015) 9:552–62. doi: 10.1038/ismej.2014.177
32. Karlsson FH, Tremaroli V, Nookaew I, Bergström G, Behre CJ, Fagerberg B, et al. Gut metagenome in European women with normal, impaired and diabetic glucose control. Nature. (2013) 498:99–103. doi: 10.1038/nature12198
33. Wylie KM, Truty RM, Sharpton TJ, Mihindukulasuriya KA, Zhou Y, Gao H, et al. Novel bacterial taxa in the human microbiome. PLoS ONE. (2012) 7:e35294. doi: 10.1371/journal.pone.0035294
34. Hiippala K, Kainulainen V, Kalliomäki M, Arkkila P, Satokari R. Mucosal prevalence and interactions with the epithelium indicate commensalism of sutterella spp. Front Microbiol. (2016) 7:1706. doi: 10.3389/fmicb.2016.01706
35. Kalia VC, Mukherjee T, Bhushan A, Joshi J, Shankar P, Huma N. Analysis of the unexplored features of rrs (16S rDNA) of the Genus Clostridium. BMC Genomics. (2011) 12:18. doi: 10.1186/1471-2164-12-18
36. Kelly D, Campbell JI, King TP, Grant G, Jansson EA, Coutts AG, et al. Commensal anaerobic gut bacteria attenuate inflammation by regulating nuclear-cytoplasmic shuttling of PPAR-γ and RelA. Nat Immunol. (2004) 5:104–12. doi: 10.1038/ni1018
37. Kasselman LJ, Vernice NA, DeLeon J, Reiss AB. The gut microbiome and elevated cardiovascular risk in obesity and autoimmunity. Atherosclerosis. (2018) 271:203–13. doi: 10.1016/j.atherosclerosis.2018.02.036
38. Proctor C, Thiennimitr P, Chattipakorn N, Chattipakorn SC. Diet, gut microbiota, and cognition. Metab Brain Dis. (2017) 32:1–17. doi: 10.1007/s11011-016-9917-8
39. Ussar S, Griffin NW, Bezy O, Fujisaka S, Vienberg S, Softic S, et al. Interactions between gut microbiota, host genetics and diet modulate the predisposition to obesity and metabolic syndrome. Cell Metab. (2015) 22:516–30. doi: 10.1016/j.cmet.2015.07.007
40. Yang J, Yu J. The association of diet, gut microbiota, and colorectal cancer: what we eat may imply what we get. Protein Cell. (2018) 9:474–87. doi: 10.1007/s13238-018-0543-6
41. Zimmer J, Lange B, Frick JS, Sauer H, Zimmermann K, Schwiertz A, et al. A vegan or vegetarian diet substantially alters the human colonic faecal microbiota. Eur J Clin Nutr. (2012) 66:53–60. doi: 10.1038/ejcn.2011.141
42. De Filippo C, Cavalieri D, Di Paola M, Ramazzotti M, Poullet JB, Massart S, et al. Impact of diet in shaping gut microbiota revealed by a comparative study in children from Europe and rural Africa. Proc Natl Acad Sci USA. (2010) 107:14691–6. doi: 10.1073/pnas.1005963107
43. O'Keefe SJ, Li JV, Lahti L, Ou J, Carbonero F, Mohammed K, et al. Fat, fiber, and cancer risk in African Americans and rural Africans. Nat Commun. (2015) 6:6342. doi: 10.1038/ncomms7342
44. Taira T, Yamaguchi S, Takahashi A, Okazaki Y, Yamaguchi A, Sakaguchi H, et al. Dietary polyphenols increase fecal mucin and immunoglobulin A and ameliorate the disturbance in gut microbiota caused by a high fat diet. J Clin Biochem Nutr. (2015) 57:212–6. doi: 10.3164/jcbn.15-15
45. Higashimura Y, Naito Y, Takagi T, Uchiyama K, Mizushima K, Ushiroda C, et al. Protective effect of agaro-oligosaccharides on gut dysbiosis and colon tumorigenesis in high-fat diet-fed mice. Am J Physiol Gastrointest Liver Physiol. (2016) 310:G367–75. doi: 10.1152/ajpgi.00324.2015
46. Neish AS. Microbes in gastrointestinal health and disease. Gastroenterology. (2009) 136:65–80. doi: 10.1053/j.gastro.2008.10.080
47. Hruby A, Ma J, Rogers G, Meigs JB, Jacques PF. Associations of dairy intake with incident prediabetes or diabetes in middle-aged adults vary by both dairy type and glycemic status. J Nutr. (2017) 147:1764–75. doi: 10.3945/jn.117.253401
Keywords: gut microbiota, 16S rRNA, impaired glucose regulation, type 2 diabetes, Uyghur, dietary survey
Citation: Nuli R, Cai J, Kadeer A, Zhang Y and Mohemaiti P (2019) Integrative Analysis Toward Different Glucose Tolerance-Related Gut Microbiota and Diet. Front. Endocrinol. 10:295. doi: 10.3389/fendo.2019.00295
Received: 25 January 2019; Accepted: 24 April 2019;
Published: 27 May 2019.
Edited by:
Anca Dana Dobrian, Eastern Virginia Medical School, United StatesReviewed by:
Venu Lagishetty, University of California, Los Angeles, United StatesWensheng Pan, Zhejiang Provincial People's Hospital, China
Copyright © 2019 Nuli, Cai, Kadeer, Zhang and Mohemaiti. This is an open-access article distributed under the terms of the Creative Commons Attribution License (CC BY). The use, distribution or reproduction in other forums is permitted, provided the original author(s) and the copyright owner(s) are credited and that the original publication in this journal is cited, in accordance with accepted academic practice. No use, distribution or reproduction is permitted which does not comply with these terms.
*Correspondence: Patamu Mohemaiti, patam0616@aliyun.com