 Zhen-Ran Xu1Xiao-Yi Zhu1
 Wei Lu1Wei-Hua Sun2Ruo-Qian Cheng1Jin-Wen Ni1Li Xi1
 Khalid Hussain3
 Fei-Hong Luo1
 Miao-Ying Zhang1*
- 1Department of Pediatric Endocrinology and Inherited Metabolic Diseases, Children’s Hospital of Fudan University, Shanghai, China
- 2Pediatric Research Institute, Children's Hospital of Fudan University, Shanghai, China
- 3Department of Pediatric Medicine, Weill Cornell Medicine, Division of Endocrinology, Doha, Qatar
Background: In addition to inborn metabolic disorders, altered metabolic profiles were reported to be associated with the risk and prognosis of some non-metabolic diseases, while as a rare metabolic disease, the overall secondary metabolic spectrum in congenital hyperinsulinemic hypoglycemia (HH) is largely undetermined. Therefore, we investigated metabolic profiles in HH patients and used ketotic hypoglycemia (KH) patients as a control cohort to unveil their distinct metabolic features.
Methods: A total of 97 hypoglycemia children, including 74 with hyperinsulinemic hypoglycemia and 23 with ketotic hypoglycemia, and 170 euglycemia control subjects were studied retrospectively. Clinical and biochemical data were collected. The normoglycemic spectra of amino acids and acylcarnitines were determined by liquid chromatography tandem mass spectrometry. The serum insulin and fatty acid concentrations during standardized fasting tests in hypoglycemia patients were also collected. Receiver operating characteristic curve analysis was performed to screen potential biomarkers.
Results: Among the normoglycemic spectra of amino acids, blood valine (p < 0.001), arginine (p < 0.001), threonine (p = 0.001), glutamate (p = 0.002), methionine (p = 0.005), ornithine (p = 0.008), leucine (p = 0.014), alanine (p = 0.017), proline (p = 0.031), citrulline (p = 0.042), aspartate (p = 0.046), and glycine (p = 0.048) levels differed significantly among the three groups. Significantly decreased levels of long- (C14:1, p < 0.001; C18, p < 0.001), medium- (C8, p < 0.001; C10, p < 0.001; C10:1, p < 0.001), and short-chain (C4-OH, p < 0.001; C5OH, p < 0.001) acylcarnitines were found in the hyperinsulinemic hypoglycemia group. Hyperinsulinemic hypoglycemia children with focal lesions and diffuse lesions had similar amino acid and acylcarnitine spectra. C10:1 < 0.09 μmol/L, threonine > 35 μmol/L, and threonine/C10:1 > 440 showed sensitivities of 81.1, 66.2, and 81.1% and specificities of 72.7, 78.3, and 81.8%, respectively, in distinguishing HH from KH.
Conclusions: We found significantly different altered serum amino acid and acylcarnitine profiles at normoglycemia, especially decreased C10:1 and increased threonine levels, between HH and KH children, which may reflect the insulin ketogenesis inhibition effect in HH patients; however, the detailed mechanisms and physiological roles remain to be studied in the future.
Introduction
Hypoglycemia is a common pediatric emergency, and serious hypoglycemia might cause pediatric encephalopathy and intellectual impairment (1, 2). During the neonatal and infant periods, hyperinsulinemic hypoglycemia (HH) is the most common etiology of refractory hypoglycemia resulting from congenital gene mutations (3, 4), while ketotic hypoglycemia (KH), which is characterized by high ketone body concentrations, is more common in patients older than 1 year of age (5) despite the small portion of inborn early-onset ketone-related metabolic disorders (6). Children with HH and KH have different treatments and prognoses (7–9).
Insulin is the key hormone for maintaining glucose homeostasis and regulates metabolism in several aspects. Under normal physiological conditions, insulin suppresses counter-regulatory responses, including gluconeogenesis, proteolysis, lipolysis, fatty acid oxidation and ketogenesis, and increases the uptake of glucose from peripheral tissues (10). However, HH patients experience dysregulated insulin secretion, which leads to recurrent hypoglycemia. Therefore, HH children have different metabolic profiles from normal children and children with KH.
Except for the screening of inborn metabolic disorders, the spectra of amino acids and acylcarnitines were also reported to be associated with the risk and prognosis of some non-metabolic diseases (11–13). Previous studies have shown suppressed lipolysis and ketogenesis in HH children based on decreased serum concentrations of β-hydroxybutyrate and free fatty acids (FFAs), which may also serve as indicators for the diagnosis of HH (14, 15). However, the detailed amino acid and fat metabolic profiles of HH are still unknown. Nearly four decades ago, altered serum branched-chain amino acid levels in 14 children with documented KH and in six infants with documented hyperinsulinism were reported (16). However, no further study has been reported regarding the full spectra of acylcarnitine and amino acid metabolic profiles in patients with HH or KH.
We hypothesized that the pathophysiological characteristics of HH would elicit unique secondary metabolic profile changes in HH patients rather than merely a reduction in FFAs. Therefore, we aimed to identify differences in metabolic profiles between HH and KH to reveal the possible pathophysiology and to explore their diagnostic value.
Materials and Methods
Subjects
We retrospectively reviewed all cases with a diagnosis of hypoglycemia in our center from 2011 to 2018 according to the computerized medical record system. In total, we identified 74 children diagnosed with HH and 23 children diagnosed with KH. HH and KH were diagnosed based on the pediatric endocrinologists’ chart notes (15, 17). Children with glycogen storage diseases, pituitary dysplasia, adrenal disorders, organic acid metabolism disorder, and other inherited metabolic diseases were excluded. A flow chart is shown in Supplementary Figure 1.
For HH cases, we examined the charts for evidence to validate the diagnosis. The following parameters were used to validate the diagnosis: elevated serum concentrations of insulin and C-peptide when blood glucose levels were <2.6 mmol/L; reduced serum levels of β-hydroxybutyrate, acetoacetic acid and FFAs; a glucose infusion rate >8 mg/kg/min to maintain euglycemia; a blood glucose increase >1.5 mmol/L after an injection of glucagon; and positive 18F-DOPA PET scan results (17). Due to domestic technical unavailability, 50 of the 74 HH patients received 18F-DOPA PET scan to confirm pancreas lesions starting in 2017 (18–20). For KH cases, we also examined charts for evidence of elevated urine ketones or serum β-hydroxybutyrate at the time of hypoglycemia to validate the diagnosis. We also reviewed medical histories to exclude children with diabetes, genetic syndromes, or other metabolic defects in gluconeogenesis, glycogenolysis, proteolysis, lipolysis, fatty acid oxidation, or ketogenesis (15). We included only KH children in the acute phase who experienced hypoglycemia within one week before admission. Data, including age, sex, birthweight, and normoglycemic spectra of amino acids and acylcarnitines, were collected. Ethical permission was received from the Ethics Commission of Children’s Hospital of Fudan University (No. 2015-154).
To compare the normoglycemic spectra of amino acids and acylcarnitines in HH and KH children with those of normal children, we randomly selected 170 cases from the hospital’s Tandem Mass Laboratory’s normal reference database. The reference subjects did not have any metabolic disorder, liver dysfunction, gastrointestinal disorder, malnutrition, or other known disorder (21).
Liquid Chromatography Tandem Mass Spectrometry Assay
For amino acid and acylcarnitine spectrometry measurements, finger blood drops were collected on filter paper (S&S 903, Bio-Rad, USA) at normoglycemic status. The spectra of amino acids and acylcarnitines were assayed by liquid chromatography tandem mass spectrometry (LC-MS/MS, H ClassXevo TQD, Waters, USA). Dot blood samples provided by the Centers for Disease Control of the United States served as quality control. All tests were performed in the central laboratory of the hospital. The tests for amino acid and acylcarnitine spectrometry were completed within 48 h of sampling.
Fasting Test for Hyperglycemia Subjects
According to the medical records, the fasting test was performed for 74 cases of HH and 18 cases of KH, and the other cases denied the fasting test. The fasting tests were performed according to standard procedures (22, 23). Octreotide, glucagon, and diazoxide were stopped one day before the fasting test. The fasting programs were adjusted according to the children’s condition, including fasting until the blood glucose level was <2.6 mmol/L or weaning of the intravenous glucose infusion rate by decreases of 2 mg/kg/min every hour until the blood glucose level was <2.6 mmol/L. Bedside capillary glucose and ketone concentrations were closely monitored. The fasting test was stopped when blood glucose levels were <2.6 mmol/L or patients had suspicious hypoglycemia symptoms (24). The fasting test lasted a maximum of 12 h, and the fasting test was discontinued even if hypoglycemia did not develop. Serum concentrations of insulin and FFAs were tested at the end of the fasting test. Serum insulin levels at the end of the fasting tests were determined by chemiluminescence (IMMULITE 1000, Siemens, Germany) with a lower limit of detection of 0.03 mIU/L.
Statistical Analysis
Data were described as numbers (proportions) for categorical variables and the means (SDs) or the medians (IQRs) for continuous variables. We used χ² tests to compare categorical variables. For normally distributed continuous variables, Student’s t test was used to compare differences between two groups, and a one-way ANOVA, including the Student-Newman-Keuls test, was used to compare significant differences among the three groups. The Mann-Whitney U test and Kruskal-Wallis test were used if variables did not conform to a normal distribution, and a Dunn-Bonferroni test was used for post hoc comparisons. We generated receiver operating characteristic (ROC) curves for all amino acids and acylcarnitines with significant differences between the HH group and the KH group. The corresponding area under the curve (AUC) and 95% confidence interval (95% CI) were calculated, and the cutoff value was determined using the Youden index. A p value <0.05 was considered statistically significant. Statistical analysis was performed using SPSS 21.0 (IBM, USA).
To validate the differences among the HH, KH and control groups, we compared the spectra of amino acids and acylcarnitines not only in all cases (74 cases of HH and 23 cases of KH) but also in the subgroups that developed hypoglycemia in the fasting test (73 cases of HH and 14 cases of KH). The sensitivity and specificity of insulin were calculated only among those who developed hypoglycemia in the fasting test (14 cases of KH and 73 cases of HH). The sensitivity and specificity of amino acids and acylcarnitines were calculated among the KH (n = 23) and HH (n = 74) cases as well as among those who developed hypoglycemia in the fasting test (14 cases of KH and 73 cases of HH).
Results
Basic Clinical and Biological Characteristics
Among the 74 patients with HH, 45 boys (60.8%) were included. The HH group exhibited a significantly lower mean onset age than the KH group (1.10 ± 1.80 vs 2.56 ± 1.79 years, p = 0.001) (Table 1). HH patients also had a higher birth weight (3.78 ± 0.78 vs 2.83 ± 0.88 kg, p < 0.001), and 50 patients with HH underwent 18F-DOPA PET scans. Among these HH patients, 17 (34%) showed focal lesions, while 33 patients (66%) showed diffuse lesions.
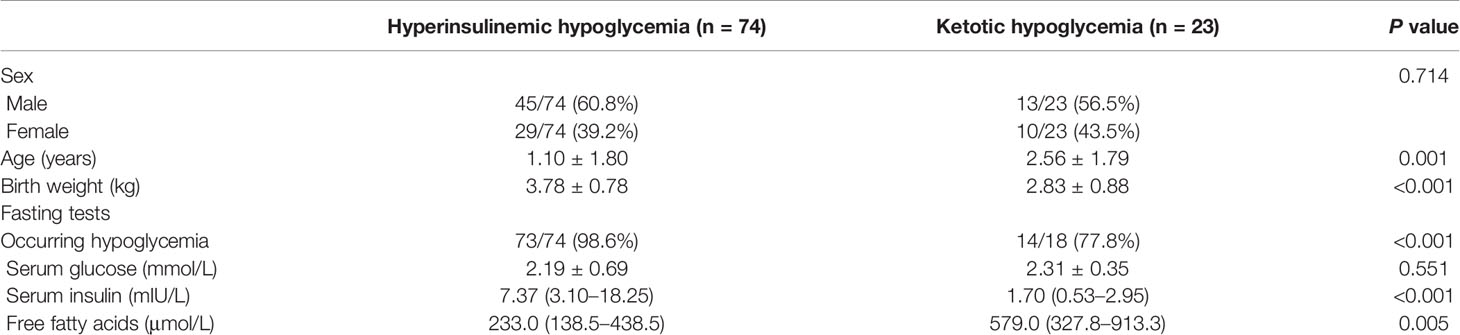
Table 1 Basic characteristics of hyperinsulinemic hypoglycemia and ketotic hyperglycemia patients.
In total, 74 patients in the HH group and 18 in the KH group underwent fasting tests. Among these patients, 73 patients in the HH group (98.6%) and 14 patients in the KH group (77.8%) developed hypoglycemia within 12 h. The HH group had significantly higher serum insulin levels during hypoglycemia compared to the KH group (p < 0.001). When applying a cutoff value of insulin of 1 mIU/L, the sensitivity was 93.2% (68 of 73 cases), while the specificity was only 42.9% (6 of 14 cases). In addition, serum FFA levels were significantly decreased in the HH group (p = 0.005) compared to the KH group.
Amino Acid Spectra
Several differences in amino acid levels were found among the HH group, KH group and control group at normoglycemia, including the levels of valine (Val, p < 0.001), arginine (Arg, p < 0.001), threonine (Thr, p = 0.001), glutamate (Glu, p = 0.002), methionine (Met, p = 0.005), ornithine (Orn, p = 0.008), leucine (Leu, p = 0.014), alanine (Ala, p = 0.017), proline (Pro, p = 0.031), citrulline (Cit, p = 0.042), aspartate (Asp, p = 0.046), and glycine (Gly, p = 0.048) (Table 2 and Supplementary Table 1). To identify potential biomarkers, we further compared the amino acids in pairs. Among the three groups, the HH group had the highest level of Glu and the lowest level of Val (a branched-chain amino acid, BCAA) (Figure 1). The HH group also had decreased levels of Leu, Pro, and Asp compared to the control group, but no significant differences were found between the HH group and KH group. The Arg level decreased in both the HH group and KH group compared to the control group. The concentrations of Met and Thr (two essential amino acids) as well as Ala were decreased in the KH group compared to the other groups, and no significant differences in these three amino acids were observed between the HH group and the control group.
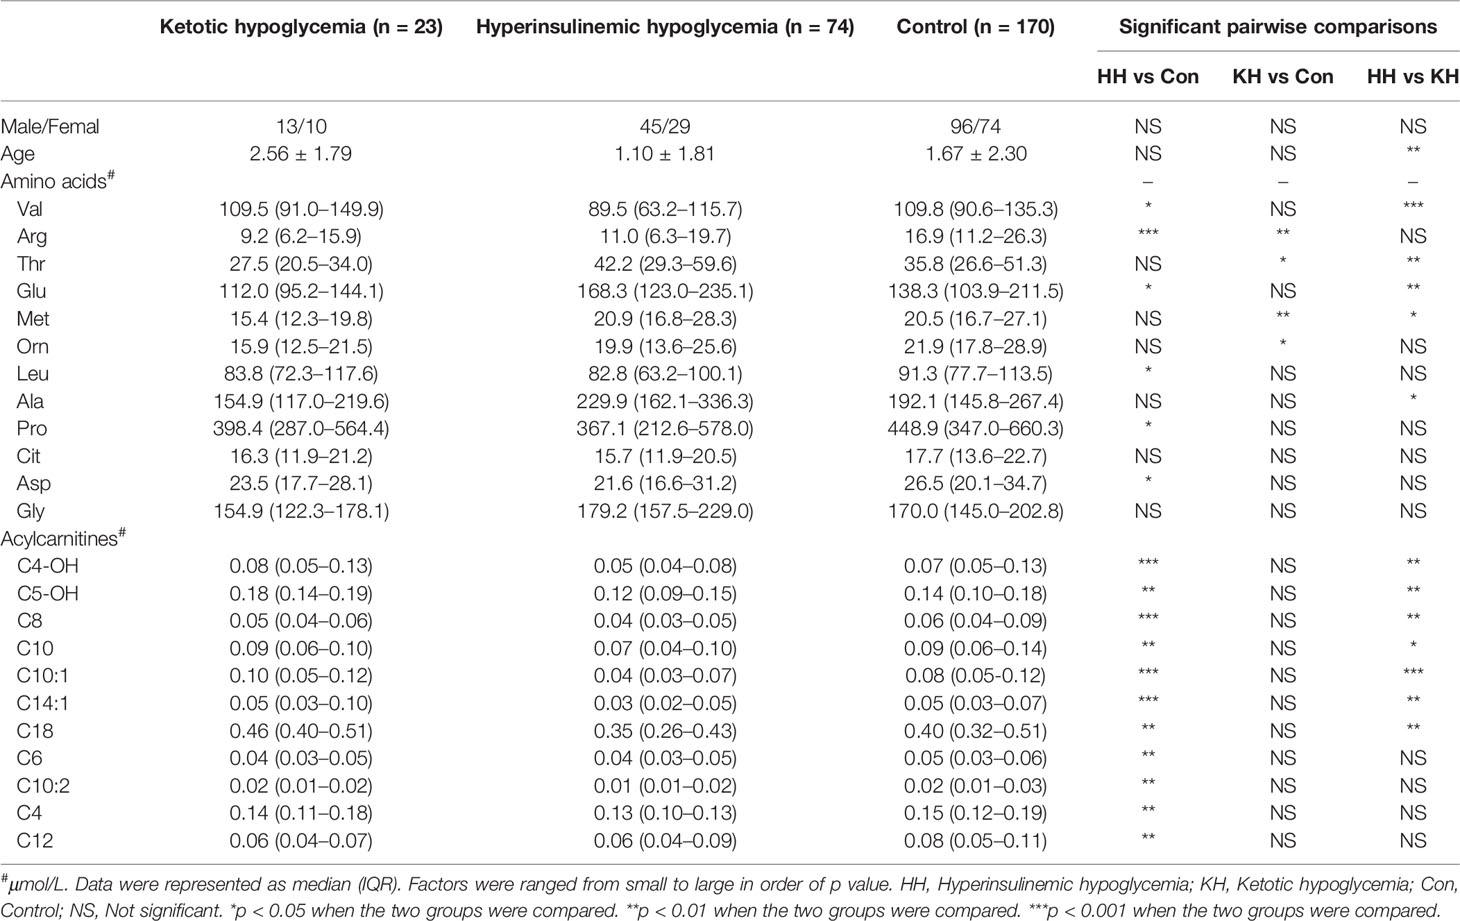
Table 2 Differences in amino acid and acylcarnitine concentrations at normoglycemia among the ketotic hypoglycemia, hyperinsulinemic hypoglycemia, and control groups.
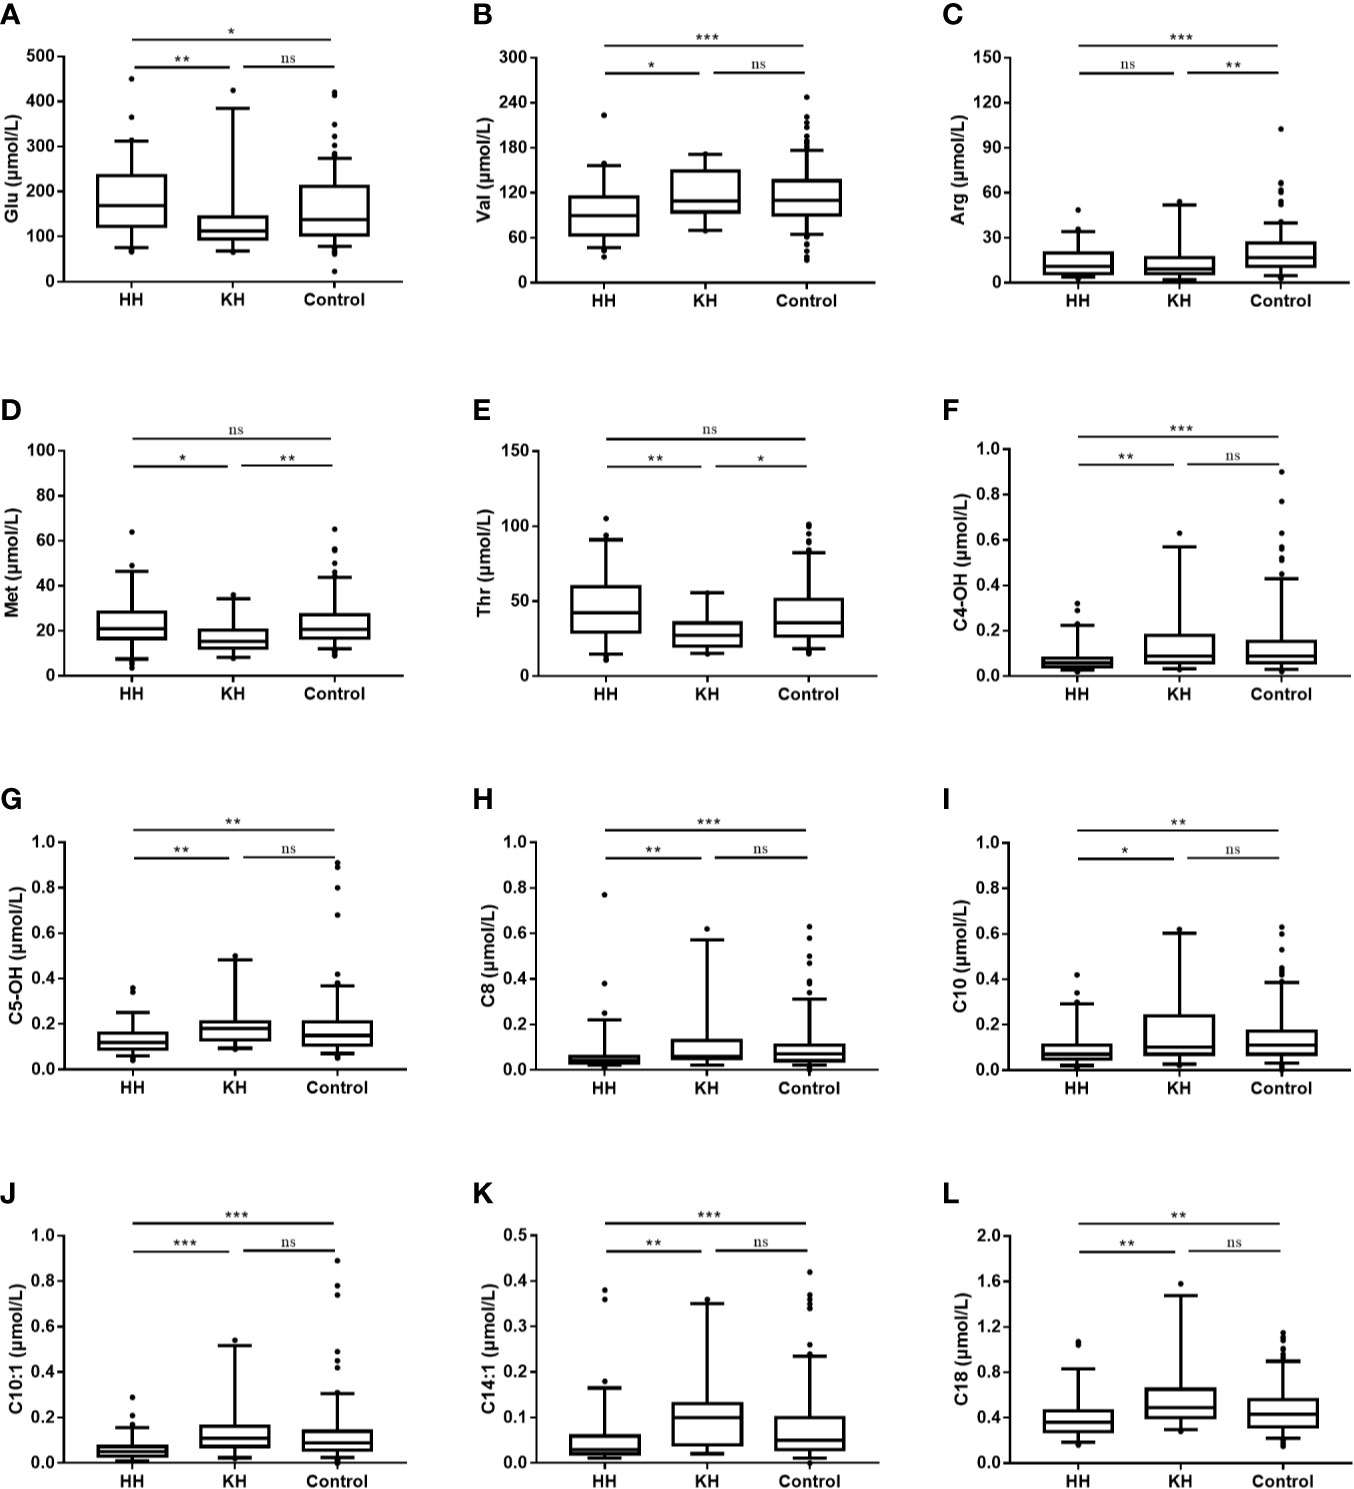
Figure 1 Differences in amino acid and acylcarnitine concentrations at normoglycemia among the ketotic hypoglycemia, hyperinsulinemic hypoglycemia and control groups. The box plots show the median (horizontal line), interquartile range (box), 5th percentiles (whiskers), 95th percentiles (whiskers), and outliers outside the 5th and 95th percentiles (dots). *p < 0.05 when the two groups were compared. **p < 0.01 when the two groups were compared. ***p < 0.001 when the two groups were compared. NS, Not significant; HH, hyperinsulinemic hypoglycemia; KH, ketotic hypoglycemia. (A) Blood glucsoce, (B) Valine, (C) Arginine, (D) Methionine, (E) Threonine, (F) Hydroxybutyrylcarnitine, (G) 3-Hydroxyisovalerylcarnitine/2-methyl-3-hydroxybutyrylcarnitine, (H) Octanoylcarnitine, (I) Decanoylcarnitine, (J) Decenoylcarnitine, (K) Tetradecenoylcarnitine, (L) Octadecanoylcarnitine.
To verify our findings, we also compared the normoglycemic amino acid spectra between KH (n = 14) and HH (n = 73) children who developed hypoglycemia in the fasting test, and the results were similar to the above findings (Supplementary Table 2).
Acylcarnitine Spectra
Overall, the HH group showed a decreasing trend of acylcarnitine levels at normoglycemia (Table 2 and Supplementary Table 3). Compared to those in the KH and control groups, the levels of long- (C14:1, p < 0.001; C18, p < 0.001), medium- (C8, p < 0.001; C10, p < 0.001; C10:1, p < 0.001), and short-chain (C4-OH, p < 0.001; C5OH, p < 0.001) acylcarnitines were significantly decreased in the HH group, while no significant differences in the acylcarnitine spectra were found between the KH group and control group (Figure 1). Furthermore, the HH group had lower levels of C4 (p = 0.007), C6 (p = 0.002), C10:2 (p = 0.002), and C12 (p = 0.008) than the control group, but no significant difference was observed compared to the KH group. Furthermore, we compared only the patients who developed hypoglycemia in the fasting test, and similar results were obtained (Supplementary Table 4).
Metabolic Profiles of Different Lesion Types of HH
To identify whether different types of HH cause different metabolic statuses, we compared the spectra of amino acids and acylcarnitines between HH patients with focal lesions and HH patients with diffuse lesions. No significant differences were found in the levels of amino acids and acylcarnitines, except for C5-OH (p = 0.045). Patients with diffuse lesions had slightly higher C5-OH levels than patients with focal lesions [0.12 μmol/L (0.10–0.16) vs 0.09 μmol/L (0.08–0.14)].
ROC Analysis
According to the ROC curves, Thr, C10:1, C5-OH, C18, and C14:1 at normoglycemia each had an AUC > 0.7 with p < 0.001 (Table 3 and Figure 2). Among these, C10:1 had the largest AUC (0.807, 95% CI: 0.698–0.915), and the threshold of C10:1, as a biomarker for the differential diagnosis of HH, was 0.09 µmol/L based on the Youden index analysis. When C10:1 < 0.09 µmol/L was used as the new screening criterion, the diagnostic specificity was substantially increased compared to that of the insulin >1.0 uIU/ml criterion (sensitivity 81.1%, specificity 72.7%). The insulin level at the time of hypoglycemia had the highest AUC of 0.866 (95% CI 0.771–0.962, p < 0.001) compared to the amino acid and acylcarnitine levels.
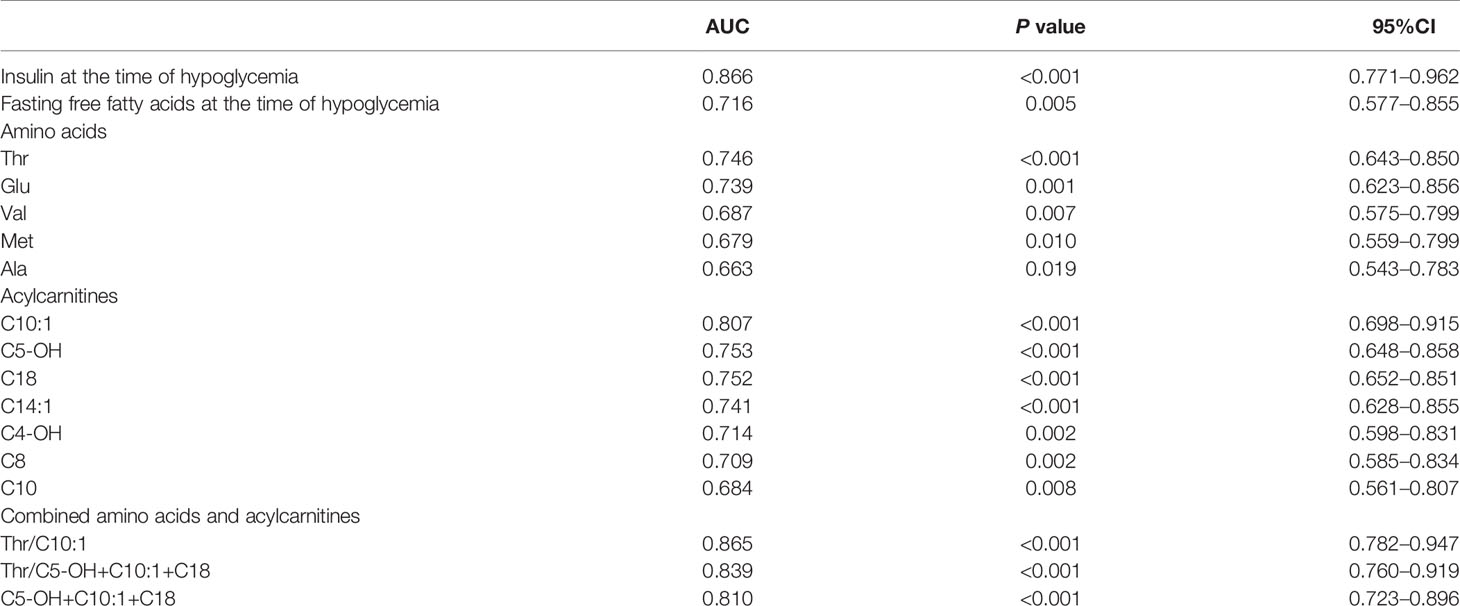
Table 3 Results of the ROC curve analysis of insulin, amino acids, and acylcarnitines.
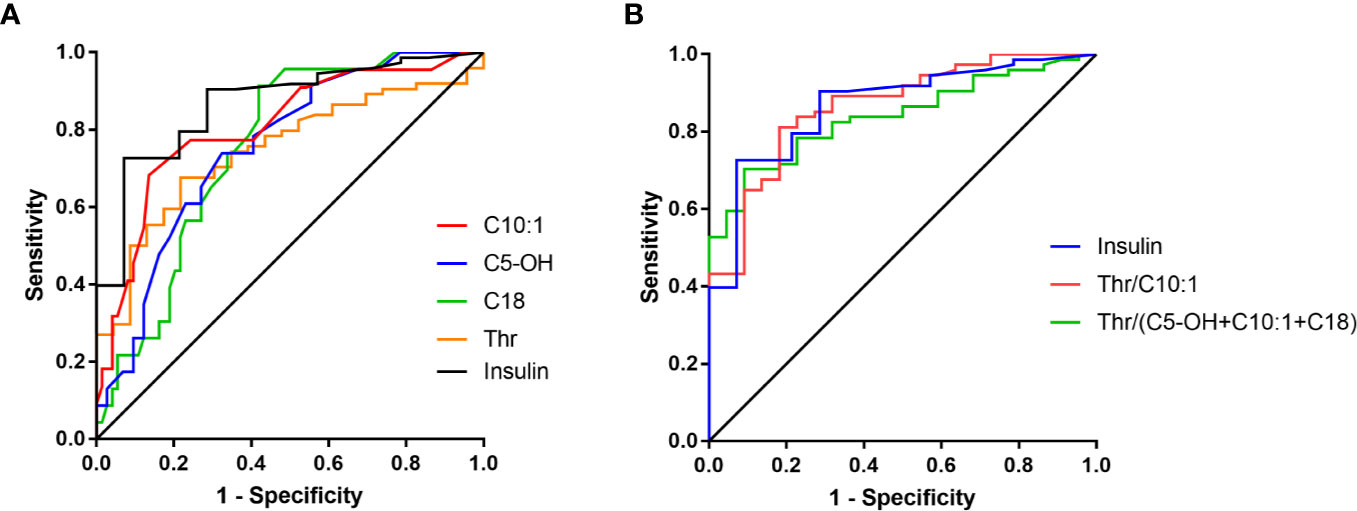
Figure 2 ROC curves of amino acids and acylcarnitines (A) and their combinations (B).
ROC curve analysis of combined amino acids and acylcarnitines indicated that C5-OH+C10:1+C18, Thr/C10:1 and Thr/(C5-OH+C10:1+C18) all had an AUC >0.8 (0.810, 0.865, and 0.839, respectively, Figure 2). Among these indexes, C5-OH+C10:1+C18 <0.64 µmol/L and Thr/(C5-OH+C10:1+C18) >54 had the highest the specificity of 91.3% at the cost of reduced sensitivity (Supplementary Table 5). However, Thr/C10:1 >440 had good sensitivity and specificity at the same time (81.1 and 81.8%, respectively). The medium Thr/C10:1 level in the HH group was more than 3.5-times that in the KH group [893.2 (503.9, 1558.3) vs 249.0 (125.3, 428.8), p < 0.001]. When considering only patients who developed hypoglycemia during the fasting test, the sensitivity of Thr/C10:1 >440 was 80.8% (59 of 73 cases), and the specificity was 85.7% (12 of 14 cases). Because children in the KH group were older than children in the HH group, we further analyzed whether fasting Thr and C10:1 levels were associated with age by comparing them among children in the control group aged less than 1 year, from 1 year to 3 years and older than 3 years. Thr and C10:1 levels were not significantly different among the various age groups (p = 0.373 and p = 0.096). Therefore, Thr/C10:1 can be applied to children of all ages.
Discussion
This study first described the spectra of amino acids and acylcarnitines in children with HH and KH in detail. The differences in amino acid and acylcarnitine levels at normoglycemia among HH, KH, and normal children suggest altered metabolic statuses caused by dysregulated secretion of insulin in HH.
Children with HH are in a state of chronic hyperinsulinemia. Thus, the metabolic statuses of lipid and amino acids might be different from those of normal children and children with KH. In the present study, the levels of short- (C4-OH, C5-OH), medium- (C8, C10, C10:1) and long-chain (C14:1, C18) acylcarnitines were significantly decreased in patients with HH compared to KH patients. Under normal circumstances, maintaining a normal blood glucose level through glycogenolysis can occur for only a limited time. Therefore, gluconeogenesis from non-carbohydrate compounds and ketogenesis act as alternative energy supply pathways for the body. Fat, the main energy source and main resource for ketogenesis, is mobilized in the form of fatty acids under the action of counter-regulatory hormones (25). Fatty acid oxidation is stimulated during hypoglycemia. Carnitine functions as a shuttle to bring long-chain fatty acids into the mitochondria for β-oxidation and then becomes acylcarnitine. Excess acylcarnitine is then released into the bloodstream (24). Thus, the acylcarnitine spectra can reflect fatty acid metabolic status and related disorders. Our study provided the first detailed evidence of acylcarnitine spectra profiles in infants and children with HH. Fatty acid mobilization was suppressed or maintained at a stable level in HH patients due to hypersecretion of insulin, resulting in relatively lower acylcarnitine levels in the HH group. Short- and medium-chain acylcarnitines also act as important energy sources, and enhanced short- and medium-chain fatty acid β-oxidation has been found in prematurity (26). Furthermore, except for fatty acid oxidation, short- and medium-chain acylcarnitine levels are also associated with other metabolic processes, including amino acid metabolism. The concentrations of some short-chain acylcarnitines were also related to the metabolism of BCAAs, which were the metabolic product of branched chain ketoacids (27). For example, an increase in C5-OH might be related to impaired catabolism of Leu when it is not ultimately converted into 3-methylglytaconyl-CoA but instead participates in another metabolic pathway to become C5-OH by crotonase and carnitine acyltransferase. This alternative pathway helps to save free CoA such that more CoA can undergo aerobic oxidation and facilitate the Krebs cycle (28). Interestingly, we found that C10:1 had the highest AUC for the prediction of HH among acylcarnitines. As a medium-chain acylcarnitine, the serum C10:1 level changed not only in patients with medium-chain acyl-CoA dehydrogenase deficiency but also in some non-metabolic diseases (12, 13, 29). Donovan et al. found that an increasing level of C10:1 was associated with an increasing number of wheezing episodes (12), and Xia et al. found that IgA nephropathy patients had a worse prognosis and treatment response if they had increased levels of C10:1 (13). However, the factors affecting changes in C10:1 and the specific role of C10:1 are still unclear, thus warranting more future studies.
As another important substrate for gluconeogenesis, the levels of amino acids in children with hypoglycemia were also changed. Excessive secretion of insulin inhibits proteolysis and stimulates amino acid uptake in the liver and muscle (30, 31). Therefore, children with HH exhibited hypoaminoacidemia compared to normal children, including reductions in Leu, Val, Pro, Arg, and Asp. The amino acid spectra of KH children were similar to those of normal children, except that KH children had relatively lower levels of Met, Thr, Arg, and Orn. Compared to HH children, KH children had lower levels of Thr, Met, Ala, and Glu but a higher level of Val; Haymond et al. also found lower Ala, Thr, Met and Orn levels during fasting compared with those of normal children. Most of these amino acids are gluconeogenic amino acids, which might be converted into ketone bodies more frequently in KH patients (32). Among these amino acids, Thr is the only amino acid that does not undergo deamination and transamination in metabolism but is directly catalyzed by threonine dehydratase, threonine dehydrogenase, and threonine aldolase, while other amino acids, including Thr, can be converted to butyryl coenzyme A, succinyl-coenzyme a, serine, glycine, etc. Excess Thr can increase the activity of lysine-α-keto gluconate reductase. Thus, the decreased Thr level in KH patients may be attributed to ketogenesis. However, the true mechanism requires further study in the future. Furthermore, the decreases in some amino acids in KH children might be a result of nutritional deficiencies because most of the 23 patients in the KH group experienced a recent decrease in intake or an increase in consumption. Thr and Met are essential amino acids and cannot be synthesized by the body. Felig et al. reported a decrease in amino acids, including Thr, Met, and Ala, after fasting in healthy adults, which may partly support our findings (33). Because insulin promotes the transport of BCAAs across cell membranes, BCAAs were decreased in the HH group (16). Chaussain et al. (16) also found a significant decrease in BCAAs in HH infants compared to KH infants and normal infants, which is consistent with our findings. However, we found a significant increase of Glu in the HH group compared to the other two groups. Glu plays an important role in signal transmission both extracellularly and intracellularly, participates in the regulation of insulin secretion, and can amplify glucose-stimulated insulin secretion (34). Mutations of insulin secretion-related pathways and different metabolic states may cause the increase in Glu in HH. Future studies will help us better understand the mechanism of amino acid and fat metabolism in children with HH.
The identification of focal lesions in HH is crucial for treatment selection for HH patients, and 18F-DOPA PET can precisely predict focal lesions in HH (19). Furthermore, focal lesions in HH are associated with specific genetic mutations (4). The spectra of amino acids and acylcarnitines were similar between HH children with focal lesions and those with diffuse lesions. These findings suggested that the changes in metabolic spectra are mainly caused by enhanced insulin secretion, and that the different types of pathogenesis may not have a significant impact on the metabolic spectra. Future studies should consider focusing on differences in metabolic profiles among HH patients with different genetic types.
Based on the above distinguishing metabolic features among the HH, KH, and normal groups, we found that Thr, C10:1 and Thr/C10:1 levels at normoglycemia might provide clues and aid in the diagnosis of HH, especially before the fasting test. At present, HH is diagnosed mainly based on serum indicators at the time of hypoglycemia, and blood samples must often be obtained through provocative fasting tests. Our findings offer new insights into the diagnosis of hypoglycemia in children prior to the fasting test, which may allow pediatricians to use more readily available samples to obtain an approximate idea of the type of hypoglycemia before the fasting test. Notably, however, insulin levels at the time of hypoglycemia remain the gold standard for diagnosing HH.
Because HH and KH are rare diseases, matching patients based on age was difficult. One of the limitations of our study was the age difference between the HH and KH groups. Patients in the HH group were 0.57 years younger than those in the control group and 1.46 years younger than those in the KH group due to the early onset of HH, which may cause potential age-matched metabolic profile changes. However, Van Rijt et al. compared the fasting spectra of acylcarnitines between children under 2 years of age and children between 2–7 years of age (35) and found no significant difference in their acylcarnitine profiles. Therefore, we believe that the age difference had only a limited effect on the current results. Furthermore, we noticed that some metabolites had relatively large scales, and overlaps between different groups were identified despite the lack of statistically significant differences among the groups. However, we still found a large difference between KH and HH in Thr and C10:1 levels.
In conclusion, our study confirmed the suppression of fatty acid mobilization and proteolysis caused by excessive secretion of insulin in HH children according to the detailed description of the spectra of amino acids and acylcarnitines at normoglycemia. However, the mechanisms that caused changes in certain amino acids and acylcarnitines are still largely unknown. Future studies are still needed to determine the detailed underlying mechanism of the above amino acid and acylcarnitine profile changes in HH.
Data Availability Statement
The original contributions presented in the study are included in the supplementary material, and further inquiries can be directed to the corresponding author.
Ethics Statement
The studies involving human participants were reviewed and approved by the Ethics Committee of Children’s Hospital of Fudan University (NO. 2015-154). Written informed consent to participate in this study was provided by the participants’ legal guardian/next of kin.
Author Contributions
F-HL and M-YZ designed the study. Z-RX and X-YZ collected and analyzed the data. Z-RX wrote the first draft of the manuscript. F-HL and KH provided advice on the first draft and revised the manuscript. WL, W-HS, R-QC, M-YZ, J-WN, and LX helped with the clinical management of the patients. All authors contributed to the article and approved the submitted version.
Funding
This project was funded by Shanghai Science and Technology Committee (15411961700).
Conflict of Interest
The authors declare that the research was conducted in the absence of any commercial or financial relationships that could be construed as a potential conflict of interest.
Acknowledgments
We would like to thank the parents and children for participating in the study. We thank the doctors and nursing staff of our center for their detailed assessments and dedicated care of these young patients.
Supplementary Material
The Supplementary Material for this article can be found online at: https://www.frontiersin.org/articles/10.3389/fendo.2020.577373/full#supplementary-material
Abbreviations
HH, hyperinsulinemic hypoglycemia; KH, ketotic hypoglycemia; FFAs, free fatty acids; ROC, receiver operating characteristic; AUC, area under the curve; BCAAs, branched-chain amino acids. Abbreviations for amino acids and acylcarnitines are listed in Appendix Table 1.
References
1. Thornton PS, Stanley CA, De Leon DD, Harris D, Haymond MW, Hussain K, et al. Pediatric Endocrine Society. Recommendations from the Pediatric Endocrine Society for Evaluation and Management of Persistent Hypoglycemia in Neonates, Infants, and Children. J Pediatr (2015) 167(2):238–45. doi: 10.1016/j.jpeds.2015.03.057
2. Canadian Diabetes Association Clinical Practice Guidelines Expert Committee, Clayton D, Woo V, Yale JF. Hypoglycemia. Can J Diabetes (2013) 37 Suppl 1:S69–71. doi: 10.1016/j.jcjd.2013.01.022
3. Nessa A, Rahman SA, Hussain K. Hyperinsulinemic Hypoglycemia - The Molecular Mechanisms. Front Endocrinol (Lausanne) (2016) 7:29. doi: 10.3389/fendo.2016.00029
4. Arnoux JB, Verkarre V, Saint-Martin C, Montravers F, Brassier A, Valayannopoulos V, et al. Congenital hyperinsulinism: current trends in diagnosis and therapy. Orphanet J Rare Dis (2011) 6:63. doi: 10.1186/1750-1172-6-63
5. Brown LM, Corrado MM, van der Ende RM, Derks TG, Chen MA, Siegel S, et al. Evaluation of glycogen storage disease as a cause of ketotic hypoglycemia in children. J Inherit Metab Dis (2015) 38(3):489–93. doi: 10.1007/s10545-014-9744-1
6. Stanley CA. Parsing ketotic hypoglycaemia. Arch Dis Child (2006) 91(6):460–1. doi: 10.1136/adc.2006.096495
7. Bahi-Buisson N, Roze E, Dionisi C, Escande F, Valayannopoulos V, Feillet F, et al. Neurological aspects of hyperinsulinism-hyperammonaemia syndrome. Dev Med Child Neurol (2008) 50(12):945–9. doi: 10.1111/j.1469-8749.2008.03114.x
8. Helleskov A, Melikyan M, Globa E, Shcherderkina I, Poertner F, Larsen AM, et al. Both Low Blood Glucose and Insufficient Treatment Confer Risk of Neurodevelopmental Impairment in Congenital Hyperinsulinism: A Multinational Cohort Study. Front Endocrinol (Lausanne) (2017) 8:156. doi: 10.3389/fendo.2017.00156
9. Al-Nassar S, Sakati N, Al-Ashwal A, Bin-Abbas B. Persistent hyperinsulinaemic hypoglycaemia of infancy in 43 children: long-term clinical and surgical follow-up. Asian J Surg (2006) 29(3):207–11. doi: 10.1016/S1015-9584(09)60089-0
10. Hussain K, Blankenstein O, De Lonlay P, Christesen HT. Hyperinsulinaemic hypoglycaemia: biochemical basis and the importance of maintaining normoglycaemia during management. Arch Dis Child (2007) 92(7):568–70. doi: 10.1136/adc.2006.115543
11. Bower A, Imbard A, Benoist JF, Pichard S, Rigal O, Baud O, et al. Diagnostic contribution of metabolic workup for neonatal inherited metabolic disorders in the absence of expanded newborn screening. Sci Rep (2019) 9(1):14098. doi: 10.1038/s41598-019-50518-0
12. Donovan BM, Ryckman KK, Breheny PJ, Gebretsadik T, Turi KN, Larkin EK, et al. Association of newborn screening metabolites with risk of wheezing in childhood. Pediatr Res (2018) 84:619–24. doi: 10.1038/s41390-018-0070-4
13. Xia FY, Zhu L, Xu C, Wu QQ, Chen WJ, Zeng R, et al. Plasma acylcarnitines could predict prognosis and evaluate treatment of IgA nephropathy. Nutr Metab (Lond) (2019) 16:2. doi: 10.1186/s12986-018-0328-1
14. Sakakibara A, Hashimoto Y, Kawakita R, Hosokawa Y, Nagahara K, Hasegawa Y, et al. Diagnosis of congenital hyperinsulinism: Biochemical profiles during hypoglycemia. Pediatr Diabetes (2018) 19(2):259–64. doi: 10.1111/pedi.12548
15. Ferrara C, Patel P, Becker S, Stanley CA, Kelly A. Biomarkers of Insulin for the Diagnosis of Hyperinsulinemic Hypoglycemia in Infants and Children. J Pediatr (2016) 168:212–9. doi: 10.1016/j.jpeds.2015.09.045
16. Chaussain JL, Georges P, Gendrel D, Donnadieu M, Job JC. Serum branched-chain amino acids in the diagnosis of hyperinsulinism in infancy. J Pediatr (1980) 97(6):923–6. doi: 10.1016/S0022-3476(80)80421-5
17. Petraitienė I, Barauskas G, Gulbinas A, Malcius D, Hussain K, Verkauskas G, et al. Congenital hyperinsulinism. Medicina (Kaunas) (2014) 50(3):190–5. doi: 10.1016/j.medici.2014.08.006
18. Yorifuji T, Horikawa R, Hasegawa T, Adachi M, Soneda S, Minagawa M, et al. Clinical practice guidelines for congenital hyperinsulinism. Clin Pediatr Endocrinol (2017) 26(3):127–52. doi: 10.1297/cpe.26.127
19. Christiansen CD, Petersen H, Nielsen AL, Detlefsen S, Brusgaard K, Rasmussen L, et al. 18F-DOPA PET/CT and 68Ga-DOTANOC PET/CT scans as diagnostic tools in focal congenital hyperinsulinism: a blinded evaluation. Eur J Nucl Med Mol Imaging (2018) 45(2):250–61. doi: 10.1007/s00259-017-3867-1
20. Ni J, Ge J, Zhang M, Hussain K, Guan Y, Cheng R, et al. Genotype and Phenotype Analysis of a Cohort of Patients With Congenital Hyperinsulinism Based on DOPA-PET CT Scanning. Eur J Pediatr (2019) 178(8):1161–9. doi: 10.1007/s00431-019-03408-6
21. Sun W, Wang Y, Yang Y, Wang J, Cao Y, Luo F, et al. The screening of inborn errors of metabolism in sick Chinese infants by tandem mass spectrometry and gas chromatography/mass spectrometry. Clin Chim Acta (2011) 412(13-14):1270–4. doi: 10.1016/j.cca.2011.03.028
22. Roženková K, Güemes M, Shah P, Hussain K. The Diagnosis and Management of Hyperinsulinaemic Hypoglycaemia. J Clin Res Pediatr Endocrinol (2015) 7(2):86–97. doi: 10.4274/jcrpe.1891
23. Shah P, Rahman SA, Demirbilek H, Güemes M, Hussain K. Hyperinsulinaemic hypoglycaemia in children and adults. Lancet Diabetes Endocrinol (2017) 5(9):729–42. doi: 10.1016/S2213-8587(16)30323-0
24. Cornblath M, Hawdon JM, Williams AF, Aynsley-Green A, Ward-Platt MP, Schwartz R, et al. Controversies regarding definition of neonatal hypoglycemia: suggested operational thresholds. Pediatrics (2000) 105(5):1141–5. doi: 10.1542/peds.105.5.1141
25. Battezzati A, Benedini S, Fattorini A, Piceni Sereni L, Luzi L. Effect of hypoglycemia on amino acid and protein metabolism in healthy humans. Diabetes (2000) 49(9):1543–51. doi: 10.2337/diabetes.49.9.1543
26. Alexandre-Gouabau MC, Courant F, Moyon T, Küster A, Le Gall G, Tea I, et al. Maternal and cord blood LC-HRMS metabolomics reveal alterations in energy and polyamine metabolism, and oxidative stress in very-low birth weight infants. J Proteome Res (2013) 12(6):2764–78. doi: 10.1021/pr400122v
27. Huffman KM, Koves TR, Hubal MJ, Abouassi H, Beri N, Bateman LA, et al. Metabolite signatures of exercise training in human skeletal muscle relate to mitochondrial remodelling and cardiometabolic fitness. Diabetologia (2014) 57(11):2282–95. doi: 10.1007/s00125-014-3343-4
28. Horvath TD, Stratton SL, Bogusiewicz A, Pack L, Moran J, Mock DM. Quantitative Measurement of Plasma 3-Hydroxyisovaleryl Carnitine by LC-MS/MS as a Novel Biomarker of Biotin Status in Humans. Analytical Chem (2010) 82(10):4140–4. doi: 10.1021/ac1003213
29. Dobrowolski SF, Ghaloul-Gonzalez L, Vockley J. Medium chain acyl-CoA dehydrogenase deficiency in a premature infant. Pediatr Rep (2017) 9(4):7045. doi: 10.4081/pr.2017.7045
30. Battezzati A, Terruzzi I, Perseghin G, Bianchi E, Di Carlo V, Pozza G, et al. Defective insulin action on protein and glucose metabolism during chronic hyperinsulinemia in subjects with benign insulinoma. Diabetes (1995) 44(7):837–44. doi: 10.2337/diab.44.7.837
31. Minguetti-Câmara VC, Marques Ade C, Schiavon FP, Vilela VR, Bruschi ML, Bazotte RB. A comparison of the effects of oral glutamine dipeptide, glutamine, and alanine on blood amino acid availability in rats submitted to insulin-induced hypoglycemia. Nutrients (2014) 6(10):4520–30. doi: 10.3390/nu6104520
32. Haymond MW, Karl IE, Pagliara AS. Ketotic hypoglycemia: an amino acid substrate limited disorder. J Clin Endocrinol Metab (1974) 38(4):521–30. doi: 10.1210/jcem-38-4-521
33. Felig P, Owen OE, Wahren J, Cahill GF Jr. Amino acid metabolism during prolonged starvation. J Clin Invest (1969) 48(3):584–94. doi: 10.1172/JCI106017
34. Stanley CA. Regulation of glutamate metabolism and insulin secretion by glutamate dehydrogenase in hypoglycemic children. Am J Clin Nutr (2009) 90(3):862S–6S. doi: 10.3945/ajcn.2009.27462AA
35. van Rijt WJ, van der Ende RM, Volker-Touw CML, van Spronsen F, Derks TGJ, Heiner-Fokkema MR. Changes in pediatric plasma acylcarnitines upon fasting for refined interpretation of metabolic stress. Mol Genet Metab (2019) 127(4):327–35. doi: 10.1016/j.ymgme.2019.06.007
Appendix A.
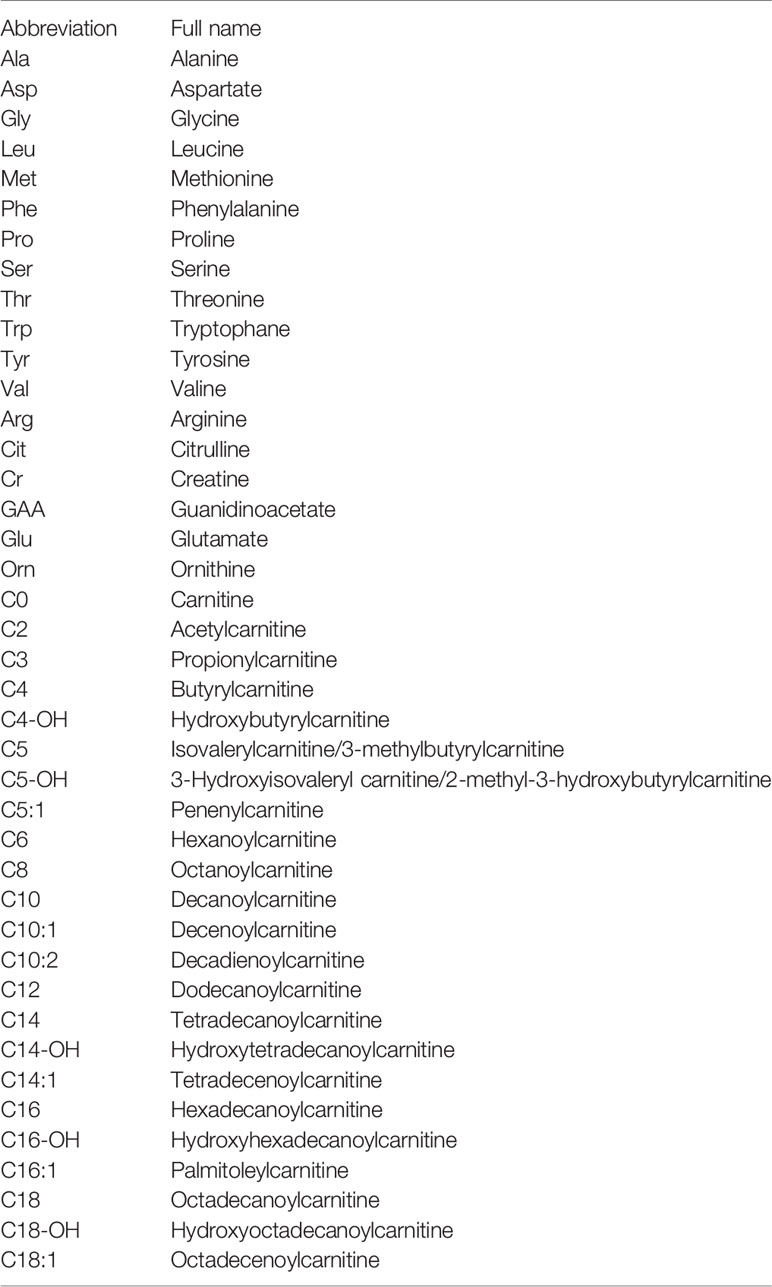
Table A.1 Abbreviations of amino acids and acylcarnitines.
Keywords: hypoglycemia, hyperinsulinemic hypoglycemia, amino acid, acylcarnitine, ketotic hypoglycemia
Citation: Xu Z-R, Zhu X-Y, Lu W, Sun W-H, Cheng R-Q, Ni J-W, Xi L, Hussain K, Luo F-H and Zhang M-Y (2020) Altered Serum Amino Acid and Acylcarnitine Profiles in Hyperinsulinemic Hypoglycemia and Ketotic Hypoglycemia. Front. Endocrinology 11:577373. doi: 10.3389/fendo.2020.577373
Received: 29 June 2020; Accepted: 22 September 2020;
Published: 08 October 2020.
Edited by:
Madhusmita Misra, Massachusetts General Hospital and Harvard Medical School, United StatesReviewed by:
Charles Alfred Stanley, Children’s Hospital of Philadelphia, United StatesTandy Aye, Stanford University, United States
Copyright © 2020 Xu, Zhu, Lu, Sun, Cheng, Ni, Xi, Hussain, Luo and Zhang. This is an open-access article distributed under the terms of the Creative Commons Attribution License (CC BY). The use, distribution or reproduction in other forums is permitted, provided the original author(s) and the copyright owner(s) are credited and that the original publication in this journal is cited, in accordance with accepted academic practice. No use, distribution or reproduction is permitted which does not comply with these terms.
*Correspondence: Miao-Ying Zhang, bWlhb3lpbmd6aGFuZ0AxMjYuY29t