 Lingwang An1
 Juming Lu
- 1Department of Endocrinology, Beijing Ruijing Diabetes Hospital, Beijing, China
- 2Department of Endocrinology, Heilongjiang Ruijing Diabetes Hospital, Haerbin, China
- 3Department of Endocrinology, Taiyuan Diabetes Hospital, Taiyuan, China
- 4Department of Share-care Center, Chengdu Ruien Diabetes Hospital, Chengdu, China
- 5Department of Endocrinology, Lanzhou Ruijing Diabetes Hospital, Lanzhou, China
- 6Department of Endocrinology, Beijing Aerospace General Hospital, Beijing, China
- 7Lee’s Endocrinology Clinic, Taiwan, China
- 8Department of Endocrinology, The General Hospital of the People’s Liberation Army, Beijing, China
Objective: This study aimed to explore the relationship between short-term (≤12 months) changes in the estimated glomerular filtration rate (eGFR) and hemoglobin A1c (HbA1c) in patients with type 2 diabetes (T2D).
Method: A total of 2,599 patients with T2D were enrolled if they were registered in the Diabetes Sharecare Information System, were aged 18–75 years, and had 2–3 HbA1c and eGFR measurements within the preceding 12 months. The studied patients were categorized into five groups based on eGFR, i.e., the relatively stable (RS), fast decline (FD), modest decline (MD), modest increase (MI), and fast increase (FI) groups.
Results: The median eGFR changes from baseline were −22.14, −6.44, 0.00, 6.32, and 20.00 ml/min per 1.73 m2 for patients in the FD, MD, RS, MI, and FI groups, respectively. Up to 1,153 (44.4%) subjects experienced an eGFR decline of ≥3.5 ml/min per 1.73 m2, including 821 (31.6%) FD subjects and 332 (12.8%) MD subjects. A decreased trend was found between the eGFR change and HbA1c decrease category, even after multivariable adjustment. In general, an eGFR FD was frequently found in patients who had an HbA1c reduction of ≥3.00% and a baseline HbA1c ≥8.0%; alternatively, such a result was also observed for a urinary albumin-to-creatinine ratio (UACR) of 30.0–300.0 mg/g, regardless of a diabetes duration of <10.0 or ≥10.0 years, or in patients who had an HbA1c reduction of ≥1.00% accompanied by hyperfiltration.
Conclusions: Some patients with T2D experienced an eGFR FD or MD during the ≤12-month follow-up period. A significant downward trend in eGFR change was demonstrated alongside an HbA1c reduction, independent of UACR stage, diabetes duration, and hyperfiltration. Sustained monitoring and cautious interpretation of the HbA1c and eGFR changes will be needed in clinical practice.
Introduction
Diabetes has become a major global public health problem. It is an age-related disease, and its prevalence increases with age (1). With the aging of the population, there is an ongoing increase in the number of patients with diabetes in China. The harm caused by diabetes concerns not only the elevation of sugar levels in the bloodstream but also the complications that arise as a result. Diabetic kidney disease (DKD) is one of the most common complications of diabetes (2, 3), which, in turn, is the main cause of chronic kidney disease (CKD) and can eventually lead to end-stage renal disease and death. According to statistics (4), 25%–40% of patients with type 2 diabetes (T2D) will eventually develop diabetic nephropathy. The diagnosis of DKD is typically based on the presence of albuminuria and/or a reduced estimated glomerular filtration rate (eGFR) in the absence of signs or symptoms of other primary causes of kidney damage (5, 6). Sustained attention should be paid to a change in eGFR and urinary albumin-to-creatinine ratio (UACR), which is the standard method for assessing glomerular damage and renal function changes in clinical practice. The eGFR is generally considered an important predictor of overall renal function; it is typically calculated with serum creatinine using the Chronic Kidney Disease Epidemiology Collaboration (CKD-EPI) equation or the simplified Modification of Diet in Renal Disease (MDRD) equation and is reported by laboratories (7, 8). The normal eGFR decline was 1 ml/min per year after the age of 40 (9). The slope of eGFR changes over time varied widely among individuals with type 1 diabetes (T1D), from −72 to −3.0 ml/min per 1.73 m2 per year, and was reflected as a very fast, fast, moderate, or slow decline; however, less evidence was found in participants with T2D (10, 11). The eGFR changes indicated the progression of CKD in patients with diabetes. Furthermore, the eGFR equations were less accurate in the diabetic than in the non-diabetic group, regardless of using the CKD-EPI or MDRD equations, and hemoglobin A1c (HbA1c) was an independent factor associated with accuracy in eGFR equations (12). The eGFR value after glycemic control will thus be clinically more meaningful.
HbA1c is an important indicator for observing whether or not the condition of diabetes is being well controlled; it reflects the average blood glucose level 2–3 months prior to a medical examination (13) and has been widely used in clinical practice. It is also a good indicator of diabetes diagnosis, efficacy evaluation, the observation of treatment compliance, and prognosis judgment and plays an important role in evaluating the occurrence and development of various diabetes complications. It was shown that HbA1c reduction after a few months was associated with a significant reduction in eGFR, and each +1% HbA1c was associated with +5.3 ml/min per 1.73 m2 eGFR using the MDRD equation (14). However, there are few reports on the relationship between changes in HbA1c level and eGFR in T2D patients. Accordingly, we studied the association between short-term changes in eGFR and HbA1c in patients with T2D during a 12-month follow-up period.
Materials and Methods
Study Design
This was an observational, multicenter, retrospective study based on medical records included in the Diabetes Sharecare Information System (DSIS) of Ruijing diabetes chain hospitals (RDCHs), five primary care medical institutes located in the cities of Beijing, Taiyuan, Chengdu, Harbin, and Lanzhou. This DSIS was developed for diabetic patients’ registration, follow-up, and preservation of clinical and biochemical measurements. Only patients who provided oral consent for inclusion in the study were allowed to be registered. RDCHs began using DSIS in 2016. All data were aggregated for each person after registration (baseline) and during each follow-up visit. The analysis was based on individuals with a documented T2D onset and clinical visits at the baseline measurement and second/third follow-ups. The Declaration of Helsinki guidelines were followed while conducting this study. The research was approved by the Ethics Committee of Beijing Ruijing Diabetes Hospital. Due to the nature of the study (i.e., retrospective/database), patient consent was not required.
Study Population
The inclusion criteria for the present study were patients with T2D, aged 18–75 years, age at diabetes diagnosis ≥18 years, patients who had second (if no third) or third records of HbA1c and eGFR values at the 12-month follow-up visits. Patients were excluded if they had a history of T1D, gestational and/or secondary diabetes, a malignant tumor, blindness, dialysis, diabetic foot ulcers, other kidney diseases; no medical records of baseline HbA1c, eGFR, or body mass index (BMI) and eGFR values <30.00 or ≥200 ml/min per 1.73 m2 at the baseline or follow-up visits; or uncontrolled blood pressure [systolic blood pressure (SBP) ≥180 mmHg, diastolic blood pressure (DBP) ≥110 mmHg], a triglyceride (TG) level ≥9 mmol/L (which typically causes chylous blood) (15), and a UACR ≥300 mg/g. The inclusion period lasted from January 27, 2016, to April 26, 2020. The final cohort comprised 2,599 adults with T2D (Figure 1).
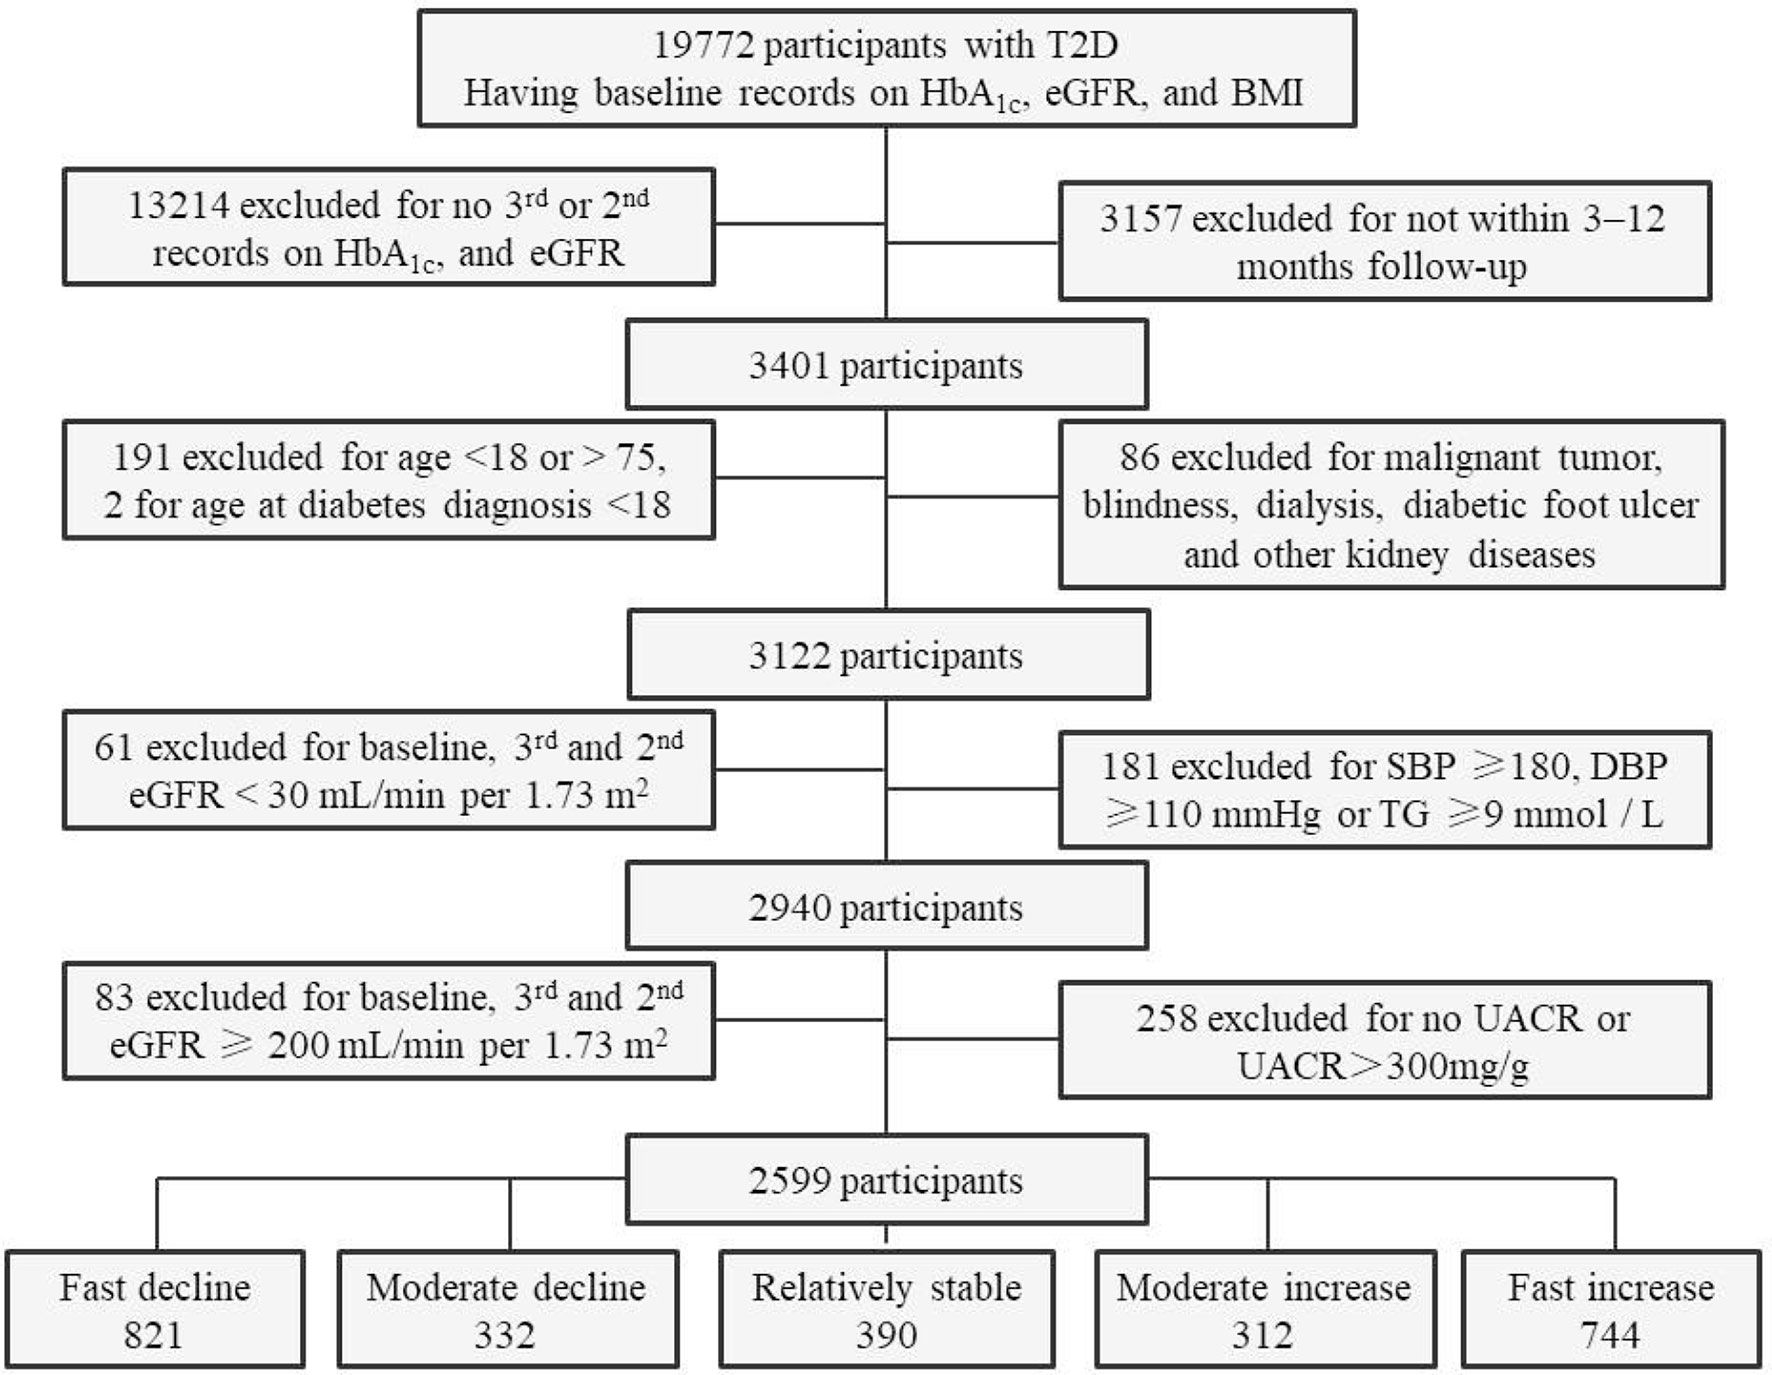
Figure 1 Flowchart and sample size of participants for the final analyses. T2D, type 2 diabetes; eGFR, estimated glomerular filtration rate; BMI, body mass index; SBP, systolic blood pressure; DBP, diastolic blood pressure; TG, triglyceride; UACR, urinary albumin-to-creatinine ratio.
Measures and Category
The HbA1c measurements were tested with high-performance liquid chromatography using HA-8180 (ARKAY, Inc., Kyoto, Japan) and MQ-2000PT (Medconn Diagnostics, Shanghai, China) chromatograph, standardized according to the Diabetes Control and Complications Trial (16). Biochemical parameters, including serum creatinine, low-density lipoprotein cholesterol (LDL-C), and urinary albumin and creatinine were tested by automatic biochemical analyzers using a TBA-120FR (Toshiba, Beijing, China), CS-1200 (DIRUI, Changchun, China) and BS-450 (Mindray, Shenzhen, China) in regular quality control and meeting the local internal quality control standards. Clinical measurements of HbA1c and serum creatinine were obtained from the laboratory database from the time of cohort entry to the second (if no third) record or third follow-up exam. BMI was categorized as not overweight/obese: <24.0 kg/m2 and overweight/obese: BMI ≥24.0 kg/m2. The target LDL-C was <2.60 mmol/L; target blood pressure (BP) was <130/80 mmHg (16). Albuminuria was categorized as normal (stage A1): UACR <30 mg/g; microalbuminuria (stage A2): UACR was 30–300 mg/g; macroalbuminuria (stage A3): UACR >300 mg/g (6, 17).
The simplified (Chinese) MDRD equation was used to calculate the eGFR as follows: MDRD = 175× serum creatinine (mg/dl) −1.234 × years −0.179 × (0.79, if female) (8). According to changes in serum creatinine or eGFR from the second/third visit compared with the baseline, patients were categorized into five groups, i.e., a relatively stable (RS) control group, eGFR change −3.49 to 3.49 ml/min per 1.73 m2; fast decline (FD), where eGFR change <−10.00 ml/min per 1.73 m2; a moderate decline (MD) group, where eGFR change was −10.00 to −3.50 ml/min per 1.73 m2; a moderate increase (MI) group, where eGFR change was 3.50–10.00 ml/min per 1.73 m2; a fast increase (FI) group, where eGFR change was >10.00 ml/min per 1.73 m2 (10, 11). The CKD stages were defined as follows: G1, eGFR ≥90.0 ml/min per 1.73 m2; G2, eGFR 60.0–89.9 ml/min per 1.73 m2; G3, eGFR 30.0–59.9 ml/min per 1.73 m2. Stages 4/5 for CKD were not included (5, 18). The hyperfiltration was defined as eGFR >120 ml/min per 1.73 m2 or, alternatively, using age-unadjusted eGFR threshold (1) 18–49 years, eGFR >120 ml/min per 1.73 m2; (2) 50–59 years, eGFR >110 ml/min per 1.73 m2; (3) 60–69 years, eGFR >100 ml/min per 1.73 m2; (4) 70–75 years, eGFR >90 ml/min per 1.73 m2 (9, 19).
Medication
Medication information was obtained on the registration date and during follow-up visits. Treatment for hyperglycemia was categorized into two groups, i.e., a non-insulin [lifestyle, oral anti-diabetic (OAD) drugs or glucagon-like peptide-1 receptor agonist (GLP-1RA)] and insulin (insulin only or insulin plus other management) usage. Whether the patients used sodium-glucose cotransporter-2 inhibitors (SGLT-2i), GLP-1RA, and angiotensin-converting enzyme inhibitors (ACEIs)/angiotensin receptor blockers (ARBs) was also categorized.
Statistical Analysis
Patient characteristics were summarized using mean and standard deviation and median and interquartile range or numbers (percentages). Additionally, 95% confidence intervals were reported. One‐way analysis of variance tests were used for normally distributed continuous variables, Kruskal–Wallis tests were used for non-normally distributed continuous variables, and Pearson’s chi‐square tests were used for categorical variables. Interactions with HbA1c changes were determined. Subgroup analyses were conducted according to baseline HbA1c category (HbA1c <8.0 and ≥8.0%), baseline hyperfiltration (yes or no), baseline BMI category (BMI <24.0 and ≥24.0 kg/m2), and diabetes duration (<10.0 and ≥10.0 years). Multivariable-adjusted general linear models (adjusted for age, gender, disease duration, baseline hyperfiltration, BMI and HbA1c category, UACR stage, follow-up insulin, SGLT-2i, ACEI/ARB usage, and BP control) were reported separately. A two-sided P-value of <0.05 was considered to be statistically significant. All analyses were performed using the SPSS Statistics 22.0 software.
Results
Patient Characteristics
The final analytic cohort comprised 2,599 individuals with T2D, with a median age at entry of 59.7 years, diabetes duration of 8.2 years, and follow-up of 8 months. The proportion of patients that had a history of hypertension, dyslipidemia, diabetic retinopathy (DR), or DKD was 37.9%, 33.5%, 14.7%, and 9.7%, respectively (Table 1).

Table 1 Demographic and clinical characteristics for the overall study population.
Comparisons Among the 5 eGFR Change Groups
The median eGFR changes from baseline were −22.14, −6.44, 0.00, 6.32, and 20.00 ml/min per 1.73 m2 for patients in the FD, MD, RS, MI, and FI groups. Up to 1,153 (44.4%) of the study subjects experienced an eGFR decline of ≥3.5 ml/min per 1.73 m2, including 821 (31.6%) FD subjects and 332 (12.8%) MD subjects. The baseline eGFR, HbA1c, the age-adjusted prevalence of hyperfiltration decreased from group FD to FI, while HbA1c change increased gradually from group FD to RS (P < 0.001) (Table 2). Baseline and follow-up BMI and BP and LDL-C control medication use, including insulin, SGLT2i, GLP-1RA, and ACEI/ARB, were reported (Table 3).
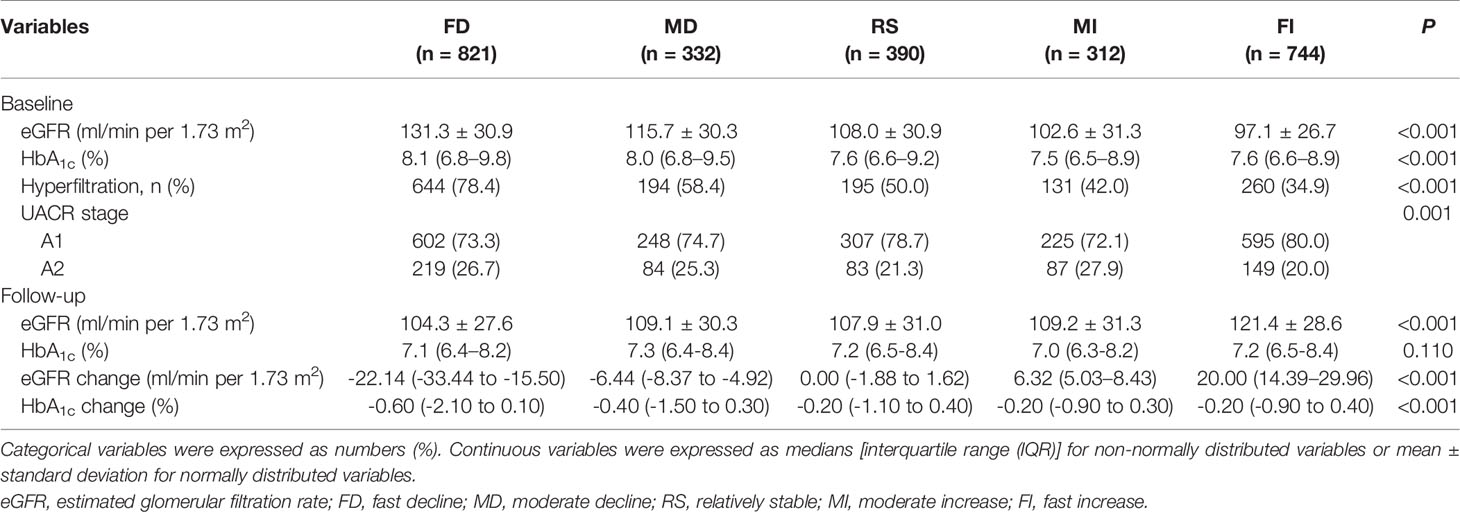
Table 2 Characteristics among subjects stratified by eGFR changes.
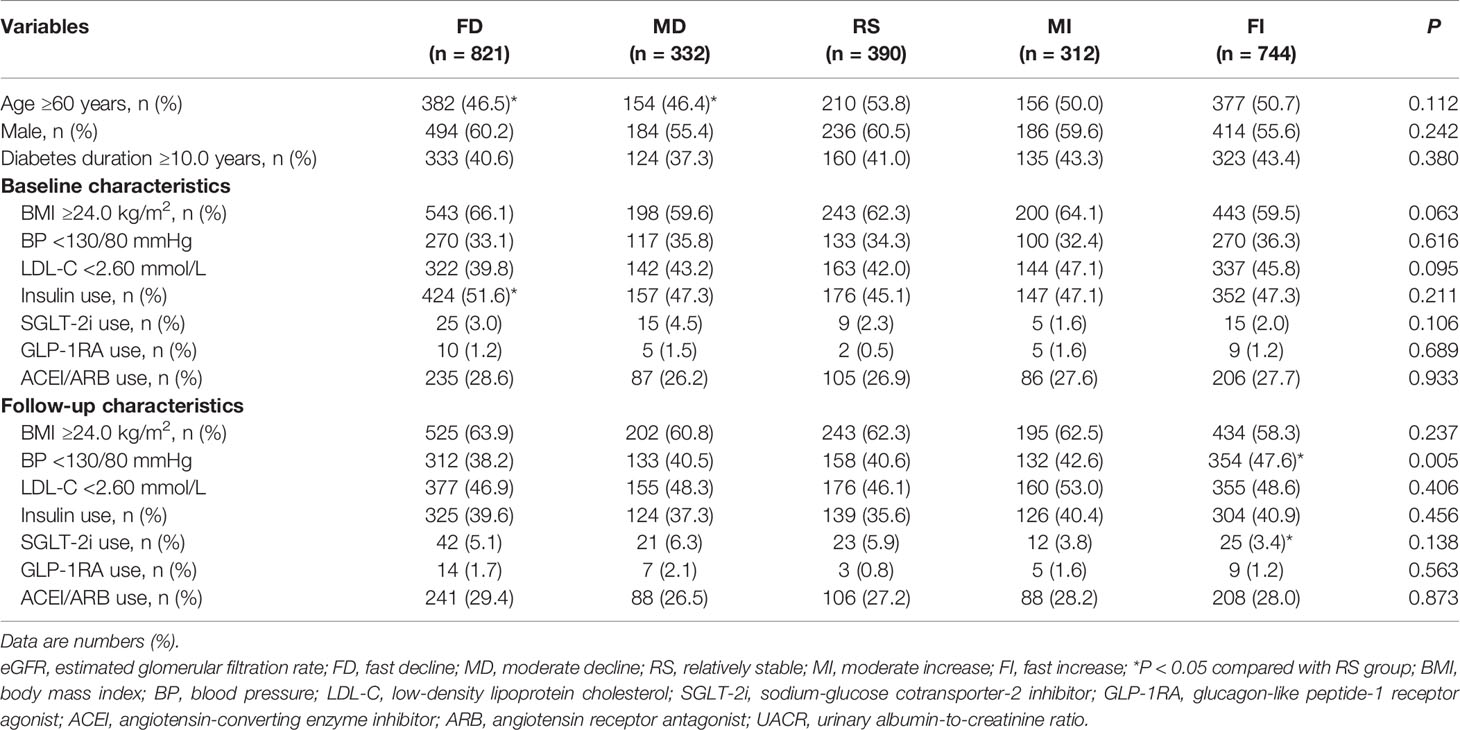
Table 3 Demographic and clinical characteristics for the five different eGFR change groups.
HbA1c Reduction and eGFR Change
A decreased trend in eGFR change was found among the HbA1c decreasing groups (P < 0.001; Figure 2A) but not the HbA1c increasing groups (Figure 2B). We evaluated the factors associated with the average eGFR changes. Overall, compared with an HbA1c change of −0.49% to –0.49%, eGFR decreased significantly with an HbA1c change of ≤−1.00%, even after multivariable adjustment (P < 0.001). Patients who showed an HbA1c change of ≤−3.00% had the largest decline in eGFR (−12.61 ml/min per 1.73 m2) (Table 4). In the subgroup analysis (baseline HbA1c <8.0% or ≥8.0%) of the association between HbA1c reduction ranges and eGFR change, no significant association was found when baseline HbA1c <8.0%; however, a significant association was found when baseline HbA1c ≥8.0% (P < 0.001). The HbA1c reduction played an important role in the eGFR decrease in subjects with hyperfiltration. The decline of eGFR reached −21.25 ml/min per 1.73 m2 when HbA1c reduced ≥3.00%. This association was not found in the subgroup with no hyperfiltration (P = 0.076). When comparing groups of baseline UACR stages of A1 (<30 mg/g) and A2 (30–300 mg/g) and groups of diabetes duration of <10.0 and ≥10.0 years, a significant association was found between HbA1c reduction range and eGFR change (P < 0.001). In general, eGFR FD was frequently found in patients with a baseline HbA1c ≥8.0% and an HbA1c change of ≤−3.00% or in patients with hyperfiltration and an HbA1c change of ≤−1.00% and patients with UACR stage A2 and an HbA1c change of ≤−3.00%. Regardless of a diabetes duration <10.0 or ≥10.0 years, eGFR FD was frequently found in patients with an HbA1c change of ≤−3.00% (Table 4).

Figure 2 Trend of estimated glomerular filtration rate (eGFR) change in different HbA1c decrease (A) and increase (B) groups.
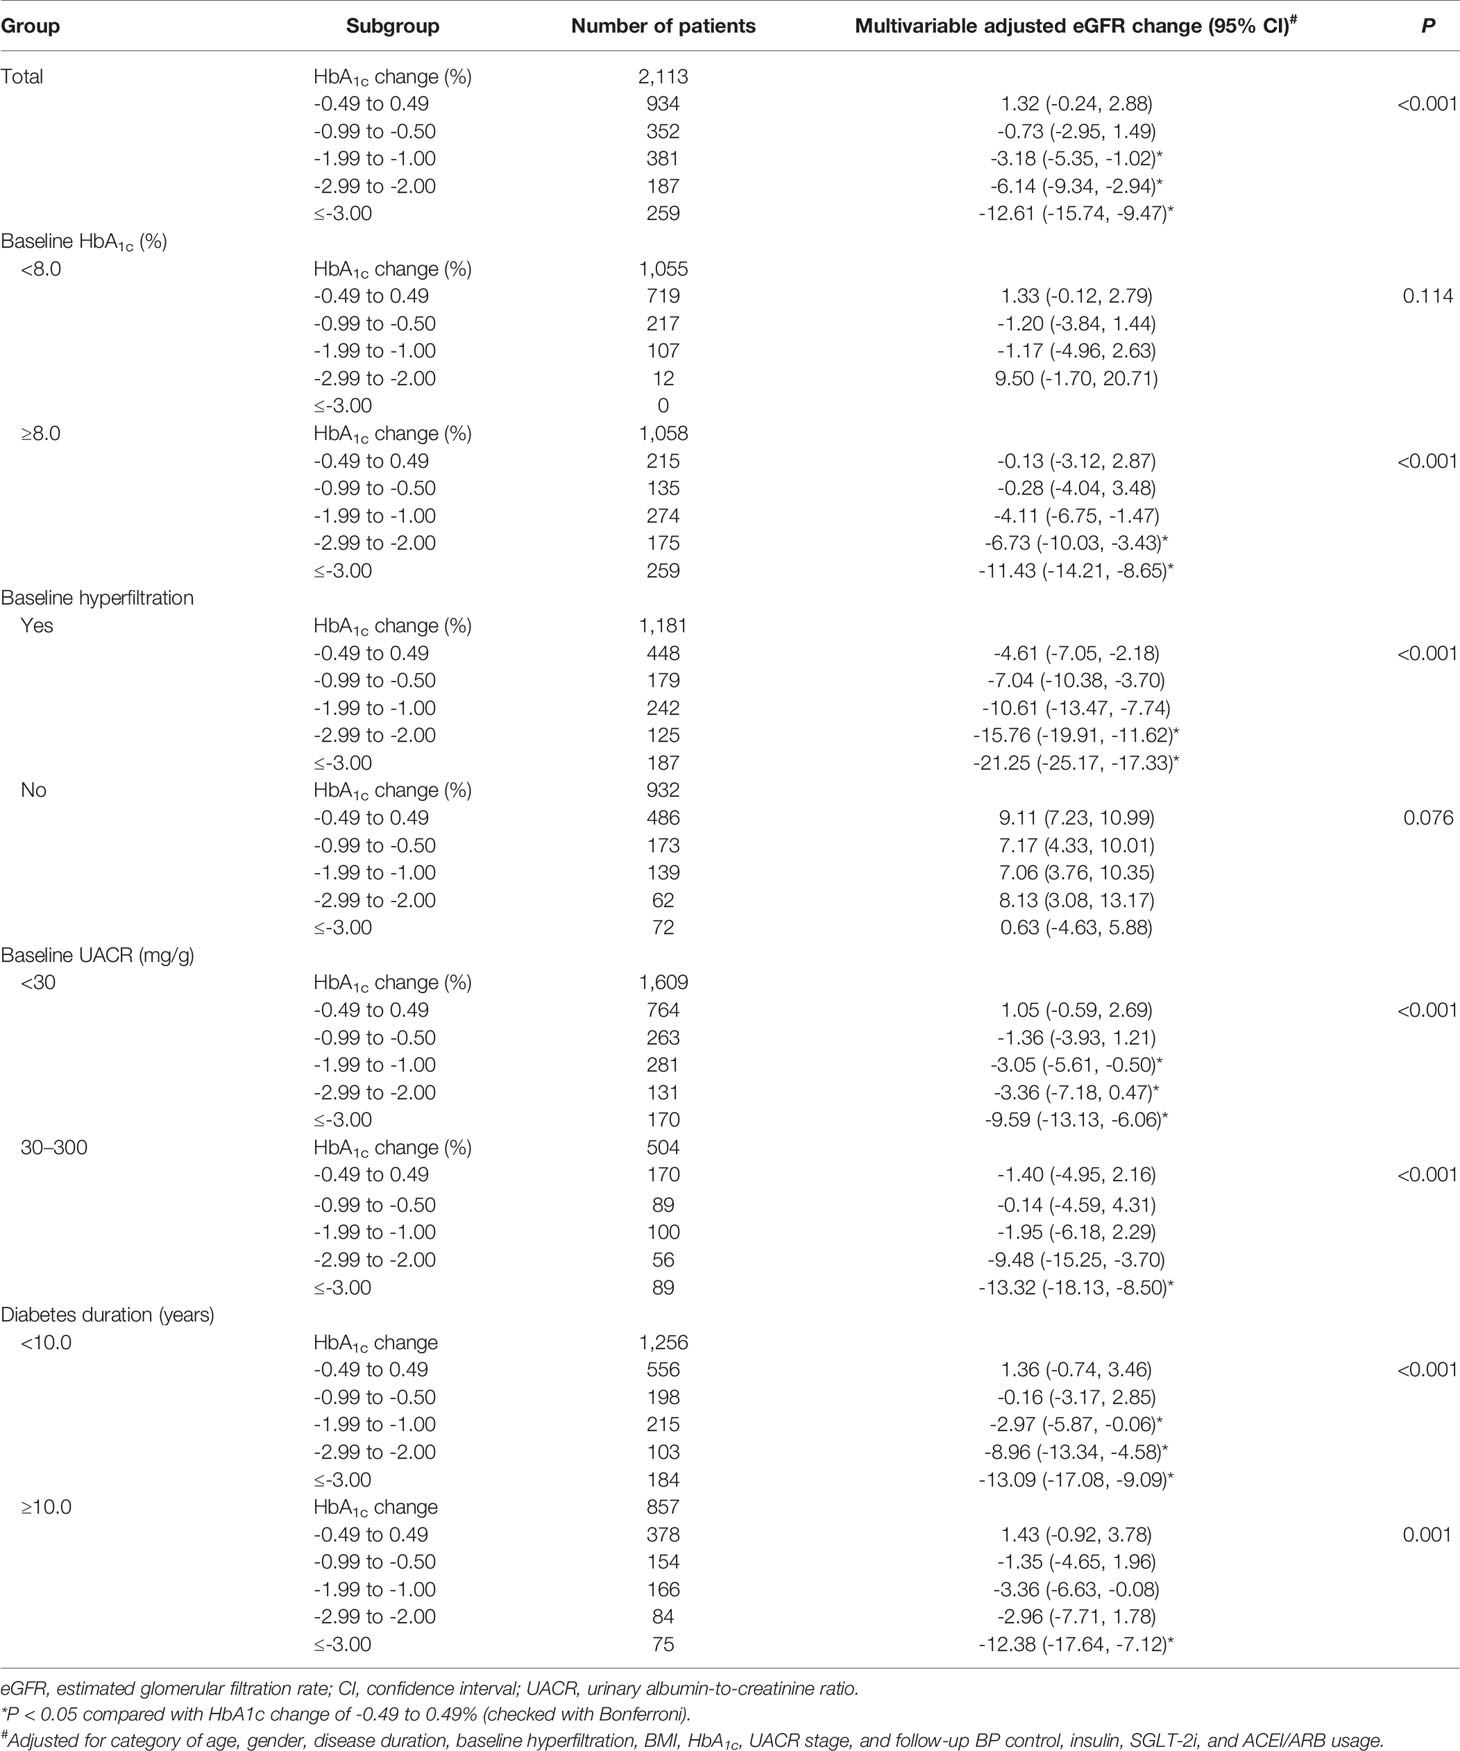
Table 4 Comparison of mean eGFR change in the different HbA1c decrease groups.
Discussion
The eGFR is a marker used to evaluate renal function and to predict the risk for ESRD and renal death in diabetes cases, whereas the implication of creatinine-based eGFR is limited to hyperglycemia status. Due to hyperglycemia-related hyperfiltration, the measured GFR decreased from 149 to 129 ml/min per 1.73 m2 (16% reduction) after HbA1c dropped from 10% to 7% and increased significantly toward the baseline values along with HbA1c control deterioration in patients with T1D (20). Additionally, HbA1c was positively associated with eGFR, whether independently or together with fasting plasma glucose (FPG), in participants with prediabetes and was associated with significantly increased odds ratios (ORs) of hyperfiltration (21, 22). It was reported that every 1% increase in HbA1c levels and a 2.0 mmol/L increase in 2-h post-load glucose (2hPG) were associated with a 17% and 61.4% higher risk of hyperfiltration, respectively (23, 24). It was also demonstrated that eGFR equations were less accurate in the diabetic group than in the non-diabetic group, and HbA1c was an independent factor associated with the accuracy of eGFR equations (12). This study aimed to identify the association between short-term (≤12 months) changes in eGFR and HbA1c in patients with T2D and to provide perspectives for carefully interpreting eGFR changes in clinical practice.
Several patients with T2D experienced eGFR FD or MD during the median 8-month follow-up. From group FI to FD, baseline HbA1c level, HbA1c reduction range, and the age-adjusted prevalence of hyperfiltration increased gradually. Patients with FD had the highest baseline HbA1c level, HbA1c reduction, and a prevalence of hyperfiltration as high as 78.4%. A downward trend of eGFR change was demonstrated along with HbA1c reduction, even in subgroup analysis after multivariable adjustment, regardless of its value at stages A1 and A2 or with a diabetes duration <10.0 or ≥10.0 years, indicating a close association between eGFR decline and HbA1c reduction. This may be due to the HbA1c reduction itself, but not as a result of hyperfiltration, since the association remained significant even after adjusting for the presence of hyperfiltration. This was not the case at first sight. Existing research demonstrated HbA1c reduction after a few months to be associated with a significant reduction in eGFR, and the correlation could be extended to both types of diabetes and more advanced stages of renal impairment. Moreover, each +1% of HbA1c was associated with +5.3 ml/min per 1.73 m2 eGFR using the MDRD equation (14). In day-to-day clinical practice, the prediction of GFR becomes crucial when renal function declines. We note here that eGFR and its estimations would be significantly higher in poorly controlled patients. The reduction of HbA1c by ≥3.00% will possibly lead to a fast decline in eGFR of ≥10.0% ml/min per 1.73 m2 and reflect true renal function.
There may be concerns about whether a decrease in eGFR indicates the decline of renal function, since the link between acute intensive glycemic control and acute neuropathies or DR progression is described in the literature (25–28). The neuropathies experienced by patients were acute, severe but reversible, and did not occur as a consequence of chronic hyperglycemia. The most important factors for the early worsening of DR were a higher HbA1c level at screening and a reduction in this level during the first 6 months of treatment (28). However, we cannot deny the long-term benefits of blood glucose control. The retinal morphology improved during the following years, and intensive glycemic control continued to reduce DR progression (25, 27, 29). Early worsening of diabetic nephropathy was found in T2D after rapid improvement in chronic severe hyperglycemia, with eGFR falling by 23–35 ml/min per 1.73 m2 in the first year and the most significant loss occurring in the first 6 months (mean 41 ml/min/year), however, followed by a slower rate of loss (30). A transient decrease in eGFR during the intervention period and its return to near the baseline level at 104 weeks with SGLT-2i treatment indicated possible similar pathophysiological mechanisms and the development of a process for HbA1c reduction (31, 32). A threshold for HbA1c levels related to the risk of complications was observed. Above the threshold of 6.5%, every 1% increase in HbA1c level was associated with a 40% higher risk of a microvascular event, including CKD (33). No significant downward trend in eGFR changes was found in patients with a baseline HbA1c <8.0%, indicating a threshold for suboptimal glycemic control but not an increased risk for rapid eGFR decline.
The largest eGFR decline trend, along with HbA1c reduction, was found in patients with hyperfiltration. The age-adjusted prevalence of hyperfiltration in this study was higher than that in a previous report (34). The reason for this difference may have resulted from the different GFR measurement methods, definition criteria, study population, and HbA1c levels (19, 34). It was found that a more considerable reduction in eGFR at 6 months significantly predicted a slower subsequent decline, and the amelioration of hyperfiltration was significantly associated with a slower long-term eGFR decline on follow-up (19). Patients with hyperfiltration may benefit from an eGFR decline to the normal range. It is noted that hyperfiltration was also observed in subjects with a diabetes duration of ≥9.0 years and an HbA1c level of approximately 8.3% (34). Thus, caution is advised when interpreting eGFR before reaching adequate glycemic control and the amelioration of hyperfiltration, even in patients with long-term diabetes duration. Moreover, since eGFR equations were considered less accurate in patients with diabetes, regardless of using either the CKD-EPI or MDRD equations, eGFR changes and their response to treatment should be monitored better and regularly alongside HbA1c.
This study identified the association between short-term changes in eGFR and HbA1c in patients with T2D during the 12-month follow-up period. Some patients with T2D experienced eGFR FD or MD during the median 8-month follow-up period. Since a downward trend in eGFR change was demonstrated alongside an HbA1c reduction, regardless of the UACR stage and diabetes duration independent of hyperfiltration, sustained monitoring and the cautious interpretation of HbA1c and eGFR changes are required in clinical practice. We do not know whether the rapid eGFR decline associated with an HbA1c reduction in this analysis will partly recover in future follow-ups, which requires further observation.
Limitations and Strengths
A weakness of this study concerns its retrospective nature. Thus, the study findings are hypothesis-generated and require further testing. The major strengths of the study were that it included a large study population and demonstrated an association between HbA1c changes and short-term eGFR changes in populations with T2D; furthermore, all subjects were prospectively monitored using gold-standard procedures. The results may thus present extensive external validity.
Data Availability Statement
The original contributions presented in the study are included in the article/supplementary material. Further inquiries can be directed to the corresponding author.
Ethics Statement
The studies involving human participants were reviewed and approved by the Ethics Committee of Beijing Ruijing Diabetes Hospital. Written informed consent for participation was not required for this study in accordance with the national legislation and the institutional requirements.
Author Contributions
LA and JL conceived and designed the study. LA analyzed the data and drafted the article. JL and YLe reviewed/edited the article. All authors contributed to data collection, critically reviewed the article, and approved the final version to be published.
Funding
This work was supported by the Beijing Fengtai District health system project (No. 2017-81).
Conflict of Interest
The authors declare that the research was conducted in the absence of any commercial or financial relationships that could be construed as a potential conflict of interest.
Publisher’s Note
All claims expressed in this article are solely those of the authors and do not necessarily represent those of their affiliated organizations, or those of the publisher, the editors and the reviewers. Any product that may be evaluated in this article, or claim that may be made by its manufacturer, is not guaranteed or endorsed by the publisher.
Acknowledgments
We would like to express our gratitude to all those who helped us during the writing of this article.
References
1. Diabetes Atlas Group IDF. Update of Mortality Attributable to Diabetes for the IDF Diabetes Atlas: Estimates for the Year 2013. Diabetes Res ClinPract (2015) 109(3):461–5. doi: 10.1016/j.diabres.2015.05.037
2. Yu Y, Lin Q, Ye D, Wang Y, He B, Li Y, et al. Neutrophil Count as a Reliable Marker for Diabetic Kidney Disease in Autoimmune Diabetes. BMC EndocrDisord (2020) 20(1):158. doi: 10.1186/s12902-020-00597-2
3. Jin D, Huang WJ, Meng X, Yang F, Bao Q, Zhang MZ, et al. Chinese Herbal Medicine Tangshen Formula Treatment for Type 2 Diabetic Kidney Disease in the Early Stage: Study Protocol for a Randomized Controlled Trial. Trials (2019) 20(1):756. doi: 10.1186/s13063-019-3821-6
4. Moon J, Lee CJ, Lee SH, Kang SM, Choi D, Yoo TH, et al. The Impact of Diabetes Mellitus on Vascular Biomarkers in Patients With End-Stage Renal Disease. Yonsei Med J (2017) 58(1):75–81. doi: 10.3349/ymj.2017.58.1.75
5. American Diabetes Association. Microvascular Complications and Foot Care: Standards of Medical Care in Diabetesd 2021. Diabetes Care (2021) 44(Suppl. 1):S151–67. doi: 10.2337/dc21-S011
6. The Microvascular Complications Group of Chinese Diabetes Association. Chinese Clinical Practice Guideline of Diabetic Kidney Disease. Chin J Diabetes Mellitus (2019) 11(1):15–28.
7. National Kidney Foundation. KDIGO 2012 Clinical Practice Guideline for the Evaluation and Management of Chronic Kidney Disease. Chapter 1: Definition and classification of CKD. Kidney Intsuppl (2013) 3:19–62. doi: 10.1038/kisup.2012.64
8. National eGFR project cooperation group Collaboration. Modification and Evaluation of MDRD Estimating Equation for Chinese Patients With Chronic Kidney Disease. Chin J Nephrol (2006) 22(10):589–95.
9. Espinel E, Agraz I, Ibernon M, Ramos N, Fort J, Serón D, et al. Renal Biopsy in Type 2 Diabetic Patients. J Clin Med (2015) 4:998–1009. doi: 10.3390/jcm4050998
10. Krolewski AS, Skupien J, Rossing P, Warram JH. Fast Renal Decline to End-Stage Renal Disease: An Unrecognized Feature of Nephropathy in Diabetes. Kidney Int (2017) 91(6):1300–11. doi: 10.1016/j.kint.2016.10.046
11. Skupien J, Warram JH, Smiles AM, Niewczas MA, Gohda T, Pezzolesi MG, et al. The Early Decline in Renal Function in Patients With Type 1 Diabetes and Proteinuria Predicts the Risk of End-Stage Renal Disease. Kidney Int (2012) 82(5):589–97. doi: 10.1038/ki.2012.189
12. Xie D, Shi H, Xie J, Ding Y, Zhang W, Ni L, et al. A Validation Study on eGFR Equations in Chinese Patients With Diabetic or Non-Diabetic CKD. Front Endocrinol (Lausanne) (2019) 10:581. doi: 10.3389/fendo.2019.00581
13. Hsu CC, Kao WL, Steffes MW, Gambir T, Brancati FL, Heilig CW, et al. Genetic Variation of Glucose Transporter-1 (GLUT1) and Albuminuria in 10,278 European Americans and African Americans: A Case-Control Study in the Atherosclerosis Risk in Communities (ARIC) Study. BMC Med Genet (2011) 12:16. doi: 10.1186/1471-2350-12-16
14. Rigalleau V, Lasseur C, Raffaitin C, Perlemoine C, Barthe N, Chauveau P, et al. Glucose Control Influences Glomerular Filtration Rate and its Prediction in Diabetic Subjects. Diabetes Care (2006) 29(7):1491–5. doi: 10.2337/dc06-0407
15. Preventive group of Chinese Society of Cardiology. Chinese Expert Consensus on the Management of Elevated Triglycerides in Patients With Atherosclerosis. Chin J Gen Pract (2019) 17(5):709–13.
16. J WP, L JM, J LN, W JP, ZH DL, Z DJ, et al. Chinese Guideline for Prevention and Treatment of Type 2 Diabetes (2017 Edition). Chin J Diabetes Mellitus (2018) 10(1):4–67.
17. Levey AS, Coresh J, Balk E, Kausz AT, Levin T, Steffes MW, et al. National Kidney Foundation. National Kidney Foundation Practice Guidelines for Chronic Kidney Disease: Evaluation, Classification, and Stratification. Ann Intern Med (2003) 139:137–47. doi: 10.7326/0003-4819-139-2-200307150-00013
18. Zhang J, Wei J, Jiang S, Xu L, Wang L, Cheng F, et al. Macula Densa SGLT1-NOS1-Tubuloglomerular Feedback Pathway, a New Mechanism for Glomerular Hyperfiltration During Hyperglycemia. J Am SocNephrol (2019) 30(4):578–93. doi: 10.1681/ASN.2018080844
19. Ruggenenti P, Porrini EL, Gaspari F, Trevisan R, Bossi A, Zaletel J, et al. GFR Study Investigators. Glomerular Hyperfiltration and Renal Disease Progression in Type 2 Diabetes. Diabetes Care (2012) 35(10):2061–8. doi: 10.2337/dc11-2189
20. Wiseman MJ, Saunders AJ, Keen H, Viberti G. Effect of Blood Glucose Control on Increased Glomerular Filtration Rate and Kidney Size in Insulin-Dependent Diabetes. N Engl J Med (1985) 312(10):617–21. doi: 10.1056/NEJM198503073121004
21. Rodríguez-Poncelas A, Franch-Nadal J, Coll-de Tuero G, Mata-Cases M, Alonso-Fernández M, Mur-Marti T, et al. High Levels of Fasting Glucose and Glycosylated Hemoglobin Values are Associated With Hyperfiltration in a Spanish Prediabetes Cohort. The PREDAPS Study. PloS One (2019) 14(9):e0222848. doi: 10.1371/journal.pone.0222848
22. Rodriguez-Poncelas A, Coll-de-Tuero G, Blanch J, Comas-Cufí M, Saez M, Barceló MA, et al. Prediabetes Is Associated With Glomerular Hyperfiltration in a European Mediterranean Cohort Study. J Nephrol (2018) 31(5):743–9. doi: 10.1007/s40620-018-0524-0
23. Sun ZJ, Yang YC, Wu JS, Wang MC, Chang CJ, Lu FH, et al. Increased Risk of Glomerular Hyperfiltration in Subjects With Impaired Glucose Tolerance and Newly Diagnosed Diabetes. Nephrol Dial Transplant (2016) 31(8):1295–301. doi: 10.1093/ndt/gfv385
24. Hou X, Wang C, Wang S, Yang W, Ma Z, Wang Y, et al. Fluctuation Between Fasting and 2-H Postload Glucose State Is Associated With Glomerular Hyperfiltration in Newly Diagnosed Diabetes Patients With HbA1c < 7%. PloS One (2014) 9(10):e111173. doi: 10.1371/journal.pone.0111173
25. Lauritzen T, Frost-Larsen K, Larsen HW, Deckert T. Two-Year Experience With Continuous Subcutaneous Insulin Infusion in Relation to Retinopathy and Neuropathy. Diabetes (1985) 34:74–9. doi: 10.2337/diab.34.3.S74
26. Siddique N, Durcan R, Smyth S, Tun TK, Sreenan S, McDermott JH. Acute Diabetic Neuropathy Following Improved Glycaemic Control: A Case Series and Review. Endocrinol Diabetes Metab Case Rep (2020) 2020:19–0140. doi: 10.1530/EDM-19-0140
27. Lauritzen T, Frost-Larsen K, Larsen HW, Deckert T. Effect of 1 Year of Near-Normal Blood Glucose Levels on Retinopathy in Insulin-Dependent Diabetics. Lancet (1983) 1:200–4. doi: 10.1016/S0140-6736(83)92585-0
28. Early Worsening of Diabetic Retinopathy in the Diabetes Control and Complications Trial. Arch Ophthalmol (1998) 116:874–86. doi: 10.1001/archopht.116.7.874
29. Zoungas S, Arima H, Gerstein HC, Holman RR, Woodward M, Reaven P, et al. Collaborators on Trials of Lowering Glucose (CONTROL) Group. Effects of Intensive Glucose Control on Microvascular Outcomes in Patients With Type 2 Diabetes: A Meta-Analysis of Individual Participant Data From Randomised Controlled Trials. Lancet Diabetes Endocrinol (2017) 5:431–7. doi: 10.1016/S2213-8587(17)30104-3
30. Cundy T, Holden A, Stallworthy E. Early Worsening of Diabetic Nephropathy in Type 2 Diabetes After Rapid Improvement in Chronic Severe Hyperglycemia. Diabetes Care (2021) 44:e55–6. doi: 10.2337/dc20-2646
31. Ito D, Inoue K, Sumita T, Hamaguchi K, Kaneko K, Yanagisawa M, et al. Long-Term Effects of Ipragliflozin on Diabetic Nephropathy and Blood Pressure in Patients With Type 2 Diabetes: 104-Week Follow-Up of an Open-Label Study. J Clin Med Res (2018) 10(9):679–87. doi: 10.14740/jocmr3491w
32. Wanner C, Inzucchi SE, Lachin JM, Fitchett D, von Eynatten M, Mattheus M, et al. EMPA-REG OUTCOME Investigators: Empagliflozin and Progression of Kidney Disease in Type 2 Diabetes. N Engl J Med (2016) 375:323–34. doi: 10.1056/NEJMoa1515920
33. Zoungas S, Chalmers J, Ninomiya T, Li Q, Cooper ME, Colagiuri S, et al. ADVANCE Collaborative Group. Association of HbA1c Levels With Vascular Complications and Death in Patients With Type 2 Diabetes: Evidence of Glycaemic Thresholds. Diabetologia (2012) 55(3):636–43. doi: 10.1007/s00125-011-2404-1
Keywords: diabetes, type 2, hemoglobin A1c (HbA1c), estimated glomerular filtration rate (eGFR), hyperfiltration
Citation: An L, Yu Q, Chen L, Tang H, Liu Y, Yuan Q, Ji Y, Lee Y and Lu J (2022) The Association Between the Decline of eGFR and a Reduction of Hemoglobin A1c in Type 2 Diabetic Patients. Front. Endocrinol. 12:723720. doi: 10.3389/fendo.2021.723720
Received: 17 August 2021; Accepted: 09 December 2021;
Published: 19 January 2022.
Edited by:
Nehal Mohsen Elsherbiny, Mansoura University, EgyptReviewed by:
Nada H. Eisa, Mansoura University, EgyptZeinab A. Kasemy, University of Menoufia, Egypt
Hidemichi Kouzu, Sapporo Medical University School of Medicine, Japan
Randa Salam, Cairo University, Egypt
Copyright © 2022 An, Yu, Chen, Tang, Liu, Yuan, Ji, Lee and Lu. This is an open-access article distributed under the terms of the Creative Commons Attribution License (CC BY). The use, distribution or reproduction in other forums is permitted, provided the original author(s) and the copyright owner(s) are credited and that the original publication in this journal is cited, in accordance with accepted academic practice. No use, distribution or reproduction is permitted which does not comply with these terms.
*Correspondence: Juming Lu, zhaoq_2021@163.com