 Atsuko Hayata-Takano1,2*†
 Yusuke Shintani1†
 Keita Moriguchi1
 Naoki Encho1
 Kohei Kitagawa1
 Takanobu Nakazawa1,3
 Hitoshi Hashimoto1,2,4,5,6*
- 1Laboratory of Molecular Neuropharmacology, Graduate School of Pharmaceutical Sciences, Osaka University, Suita, Japan
- 2Molecular Research Center for Children’s Mental Development, United Graduate School of Child Development, Osaka University, Kanazawa University, Hamamatsu University School of Medicine, Chiba University and University of Fukui, Suita, Japan
- 3Department of Bioscience, Tokyo University of Agriculture, Setagaya-ku, Japan
- 4Division of Bioscience, Institute for Datability Science, Osaka University, Suita, Japan
- 5Transdimensional Life Imaging Division, Institute for Open and Transdisciplinary Research Initiatives, Osaka University, Suita, Japan
- 6Department of Molecular Pharmaceutical Science, Graduate School of Medicine, Osaka University, Suita, Japan
Mice lacking pituitary adenylate cyclase-activating polypeptide (PACAP) display psychomotor abnormalities, most of which are ameliorated by atypical antipsychotics with serotonin (5-HT) 2A receptor (5-HT2A) antagonism. Heterozygous Pacap mutant mice show a significantly higher hallucinogenic response than wild-type mice to a 5-HT2A agonist. Endogenous PACAP may, therefore, affect 5-HT2A signaling; however, the underlying neurobiological mechanism for this remains unclear. Here, we examined whether PACAP modulates 5-HT2A signaling by addressing cellular protein localization. PACAP induced an increase in internalization of 5-HT2A but not 5-HT1A, 5-HT2C, dopamine D2 receptors or metabotropic glutamate receptor 2 in HEK293T cells. This PACAP action was inhibited by protein kinase C inhibitors, β-arrestin2 silencing, the PACAP receptor PAC1 antagonist PACAP6-38, and PAC1 silencing. In addition, the levels of endogenous 5-HT2A were decreased on the cell surface of primary cultured cortical neurons after PACAP stimulation and were increased in frontal cortex cell membranes of Pacap−/− mice. Finally, intracerebroventricular PACAP administration suppressed 5-HT2A agonist-induced head twitch responses in mice. These results suggest that PACAP–PAC1 signaling increases 5-HT2A internalization resulting in attenuation of 5-HT2A-mediated signaling, although further study is necessary to determine the relationship between behavioral abnormalities in Pacap−/− mice and PACAP-induced 5-HT2A internalization.
Introduction
Pituitary adenylate cyclase-activating polypeptide (PACAP) is a multifunctional neuropeptide that regulates a wide array of physiological responses, including emotion, cognition and motor function. It acts upon three G protein-coupled receptor subtypes: a PACAP-preferring receptor (PAC1) and two vasoactive intestinal polypeptide (VIP) receptors (VPAC1 and VPAC2) (1, 2). PAC1 signaling mediates cellular functions, such as transcriptional responses and cell survival, partly through its own internalization (3, 4). We previously reported that PACAP-deficient (Pacap−/−) mice show behavioral abnormalities such as locomotor hyperactivity in an open-field, deficits in prepulse inhibition (PPI) of the startle response, depression-like behavior and memory impairment (5–10). The hyperlocomotion and PPI deficits in Pacap−/− mice were reversed by risperidone, an atypical antipsychotic drug with antagonism of serotonin (5-HT)2 receptors and dopamine D2 receptors (D2) (10). The depression-like behavior in Pacap−/− mice were ameliorated by risperidone and the selective 5-HT 2A receptor (5-HT2A) antagonist, ritanserin (7). In addition, Pacap−/− mice (7) and heterozygous mutant mice (Pacap+/−) (11) show exaggerated (±)-2,5-dimethoxy-4-iodoamphetamine (DOI)-induced head-twitch responses compared with wild-type mice. Pacap−/− mice also have increased 5-HT content and 5-HT-immunoreactive cell counts in the dorsal raphe (12) and slightly decreased levels of the 5-HT metabolite, 5-hydroxyindoleacetic acid, in the cortex and striatum (5). These findings indicate that 5-HT2A function may be involved in psychiatric conditions in which PACAP signaling is dysfunctional and that functional crosstalk may exist between PACAP and 5-HT2A signaling pathways. However, the underlying molecular mechanisms for this remain unclear.
5-HT2A has been implicated in many psychiatric disorders, such as schizophrenia and affective disorders (13). Clinical studies have indicated that impaired 5-HT2A signaling plays a major role in schizophrenic episodes (14). Almost all currently available atypical antipsychotic drugs possess antagonistic effects against D2 and 5-HT2A (15). Cellular internalization is known to play a critical role in the regulation of 5-HT2A functions (16, 17). 5-HT, dopamine, DOI and clozapine induce 5-HT2A internalization and recycling, and the signaling processes through which each ligand induces its effect are differentially regulated (17). In addition, different classes of G-protein-coupled receptors (GPCRs) can form heteromeric complexes that potentially contribute to the regulation of receptor internalization or alteration of pharmacological signaling properties (18, 19). 5-HT2A/metabotropic glutamate receptor 2 (mGlu2) and 5-HT2A/D2 form heteromeric complexes that induce unique hallucinogen-specific signaling (20–23). Thus, the signaling pathways involved in 5-HT2A function are complicated, and the precise signaling pathways responsible for hallucinogenic and therapeutic effects remain unclear.
Our previous studies indicated that there are no significant differences in 5-HT content in the cortex and striatum or in 5-HT2A protein levels in the somatosensory cortex between PACAP mutant and wild-type mice (5, 11, 24). Therefore, here, we examined the effect of PACAP signaling on 5-HT2A internalization and revealed that the PACAP–PAC1 signaling pathway regulates 5-HT2A internalization in a protein kinase C (PKC)- and β-arrestin2-dependent manner. These results further suggest the existence of functional crosstalk between PACAP and 5-HT2A-mediated signaling pathways in the brain.
Materials and Methods
Animals
ICR mice were purchased from Japan SLC (Shizuoka, Japan). Generation of Pacap−/− mice by gene targeting was reported previously (5). Pacap−/− mice and wild-type littermates on the ICR background were obtained by crossing Pacap+/− heterozygous mice.
All animal care and handling procedures were performed in accordance with protocols approved by the Animal Care and Use Committee of the Graduate School of Pharmaceutical Sciences, Osaka University. All efforts were made to minimize the number of animals used.
Drugs
PACAP (PACAP-38, 4221-v), PACAP6-38 (4286-v) and VIP (4110-v) were purchased from Peptide Institute (Osaka, Japan). D-sphingosine (S7049), H89 (B1427) and 5-HT hydrochloride (H9523) were purchased from Sigma-Aldrich (St Louis, MO, USA). PD98059 (513000) was purchased from Calbiochem (CA, USA). H7 (BML-EI148) and HA1004 (BML-EI184) were purchased from ENZO Life Science (NY, USA).
Vector Construction
The vector, pFN21A (HaloTag technology, Promega, Madison, WI, USA), encoding the secretory IL-6 signal peptide fused to the N-terminus of Halo-tag was a gift from Dr. Nagase (Kazusa DNA Research Institute). To generate the Halo-PAC1 construct, the hop1 splicing variant of a human PAC1 cDNA was subcloned into the pFN21A vector at SgfI and PmeI restriction sites as described previously (4). Human 5-HT1A, 5-HT2A, D2 and mGlu2 cDNAs were obtained from the Kazusa Collection of Flexi ORF Clones (Kazusa DNA Research Institute, Chiba, Japan). These clones were also subcloned into the pFN21A vector at SgfI and PmeI restriction sites.
Receptor Internalization in HEK293T Cells
Receptor internalization was quantitatively assessed using HaloTag technology (Promega) as described previously (4). HEK293T cells were maintained in Dulbecco’s modified Eagle’s medium (DMEM, 5919, Nissui, Tokyo, Japan) supplemented with 10% fetal bovine serum. The cells were transfected with Halo-expressing vector and labeled with the cell-impermeable Alexa Fluor 488 ligand (Promega) in Opti-MEM for 15 min at 37°C. Each inhibitor or antagonist pretreatment was for 30 min. The cells were then treated with 1 µM PACAP, 5-HT or saline, washed with phosphate-buffered saline and fixed in 4% paraformaldehyde. Cells were imaged using an FV1000D confocal microscope (Olympus, Tokyo, Japan) in sequential mode and membrane protein internalization was quantified using ImageJ software (NIH, MD, USA). To assess the internalization ratio, we defined the shape of a whole-cell (region of interest, ROI, A) and its cytoplasmic region (ROI B) by reducing the size by 5–10 pixels and then determining the fluorescence in both ROIs. The internalization ratio (%) was defined by dividing the amount of luminescence in ROI B by that in ROI A.
β-Arrestin Silencing
siRNA-mediated silencing of β-arrestins was performed exactly as described in our previous study (4). β-arrestin1 (6218S; Cell Signaling Technology, Danvers, MA, USA), β-arrestin2 (sc-29743; Santa Cruz Biotechnology, Dallas, TX) or control siRNA (6568S; Cell Signaling Technology), each at 25 mM, were transfected using Lipofectamine RNAiMAX (Invitrogen) according to the manufacturer’s protocol. We confirmed that the β-arrestin1 and β-arrestin2 siRNAs effectively decreased the respective β-arrestin levels to less than 35% in HEK293T cells in our previous study (4).
Antibodies
The following commercially available antibodies were used: rabbit polyclonal anti-PAC1 (ab54980, Abcam, Cambridge, UK), rabbit polyclonal anti-5-HT1A (ab44635, Abcam), rabbit polyclonal anti-5-HT2A (ab16028, Abcam), rabbit polyclonal anti-D2 (ab21218, Abcam), rabbit polyclonal anti-mGlu2/3 (06-676, Millipore, Darmstadt, Germany), mouse monoclonal anti-β-actin (MAB1501, Millipore), mouse monoclonal anti-alpha 1 sodium potassium ATPase (ab7671, Abcam). Horseradish peroxidase-conjugated anti-rabbit IgG and anti-mouse IgG were purchased from Cappel (Cochranville, PA, USA).
Surface Biotinylation Assay and Membrane Protein Isolation
A receptor biotinylation assay was performed using the Pierce cell surface protein isolation kit (Thermo Fisher Scientific, Waltham, MA, USA) as described previously (25). Primary cultures of cortical neurons were prepared as described previously (4). The surface proteins of mouse primary cultured cortical neurons at 14 days in vitro were biotinylated with EZ-Link Sulfo-NHS-SS-biotin for 30 min at 4°C. To collect the surface proteins, cells were lysed with lysis buffer and biotinylated proteins were precipitated with NeutrAvidin agarose. The collected surface proteins were analyzed by western blotting.
Membrane protein isolation was performed using a plasma membrane protein isolation kit (Invent Biotechnologies, Plymouth, MN, USA) according to the manufacturer’s instructions. The collected membrane proteins were analyzed by western blotting.
Western Blotting
Collected surface proteins were suspended in RIPA buffer (50 mM Tris-HCl, pH 7.4, 150 mM NaCl, 1 mM EDTA, 0.1% NP-40, 0.5% sodium deoxycholate, 0.1% sodium dodecyl sulfate), separated by sodium dodecyl sulfate-polyacrylamide gel electrophoresis, and then transferred electrophoretically onto polyvinylidene fluoride membranes (Millipore). After blocking with 2% BSA in TBS buffer (50 mM Tris-HCl, pH 7.4, 150 mM NaCl), the membranes were incubated with an anti-PAC1 antibody (1:1,000 dilution), anti-5-HT1A antibody (1:1,000 dilution), anti-5-HT2A antibody (1:1,000 dilution), anti-D2 antibody (1:1,000 dilution), anti-mGlu2/3 antibody (1:1,000 dilution), anti-β-actin antibody (1:2000 dilution) or anti-alpha 1 sodium potassium ATPase antibody (1:1000 dilution) overnight at 4°C. After incubation with a horseradish peroxidase-conjugated anti-rabbit IgG (1:2,000 dilution) or anti-mouse IgG (1:2,000 dilution) secondary antibody for 1 h at room temperature, proteins were detected by chemiluminescence and visualized with an ImageQuant LAS 4000 system (GE Healthcare, Little Chalfont, UK). For quantification, the bands of specific immune-complexes were analyzed using ImageJ software.
Head Twitch Response and Intracerebroventricular Injections
Intracerebroventricular injections were performed as described previously (26). Head twitch responses were assessed as described previously (10). ICR mice were anesthetized and placed in a stereotaxic instrument (Narishige, Tokyo, Japan). A G-4 cannula (Eicom, Kyoto, Japan) was implanted, −0.4 mm posterior, 1.0 mm lateral, and 2.3 mm ventral from the bregma. After cannula implantation, each mouse was given 1 mg/kg buprenorphine (Sigma-Aldrich) to relieve pain and housed individually for at least 10 days before performing head-twitch experiments. Thirty minutes before DOI (Sigma-Aldrich) treatment, PACAP (10 pmol) was diluted in Ringer’s solution (1:100, Fuso Pharmaceutical Industries, Osaka, Japan) and a 3 μl volume was injected at an infusion rate of 1 μl/min using a microinjection pump (KD Scientific, MA, USA). For the pretreatment of the PAC1 antagonist, PACAP6-38 (100 pmol) were diluted and injected in the same way 30 min before PACAP treatment. The mice were individually placed in observation cages (19 × 10 × 11 cm) for a 30 min habituation period. They were then intraperitoneally injected with either saline or DOI, which were prepared just before use, and recordings were made for a duration of 60 min. Scoring began immediately after injection by trained observers who were blind to the treatment. The head twitch response is a distinctive paroxysmal head-twitching behavior that is easily distinguished from head-bobbing, lateral movements of the head and grooming. The intracerebroventricular injection was judged successful if the third ventricle was stained by Evans blue.
Statistical Analysis
Experimental data were analyzed using Student’s t-test, or one-way, two-way or two-way repeated measures analysis of variance (ANOVA). The Tukey-Kramer post hoc test was also performed after significant main effects for interaction were observed. The criterion for statistical significance was p < 0.05. Statistical analyses were performed using StatView software (version 5.0; SAS Institute, Cary, NC, USA). All experiments were performed in a blinded manner. The observers were blinded to the group of samples during the analyses by random numbering.
Results
PACAP-Induced Internalization of 5-HT2A in HEK293T Cells
To examine whether PACAP signaling modulates the internalization of 5-HT2A and related GPCRs in HEK293T cells, we constructed membrane-specific Halo-tagged receptors for PAC1, 5-HT2A, 5-HT1A, 5-HT2c, D2 and mGlu2. As a first step, we examined whether PAC1, VPAC1, VPAC2, and 5-HT2A mRNAs were expressed in HEK293T cells using reverse transcription (RT)-PCR analysis. In our HEK293T cell cultures, we detected the mRNA expression of PAC1 and VPAC1; however, the expression of VPAC2 and 5-HT2A was below the detection limit of our RT-PCR analysis (Supplementary Figure 1A). Quantitative RT-PCR analysis showed that PC12 cells and SH-SY5Y cells expressed relatively higher levels of PAC1 mRNA as expected from the previous reports (27–29), and both our HEK293T cell cultures and the HEK293T cells provided by RIKEN BRC Cell Bank (RCB2202; the National Bio-Resource Project of the MEXT/AMED, Japan) moderately expressed PAC1 mRNA at similar levels. In Hela cells, PAC1 expression was below the detection limit of our quantitative RT-PCR analysis (Supplementary Figure 1B). The nucleotide sequence of the cDNA fragment amplified from our HEK293T cell cultures was identical to that of the cDNA encoding the human PAC1 hop1 splice variant (NCBI Reference Sequence: NM_001199635.2).
We then examined whether PACAP, maxadilan, a potent and specific PAC1 agonist (30), and VIP increase intracellular cyclic adenosine monophosphate (cAMP) levels in our HEK293T cell cultures and confirmed that PACAP and maxadilan, both at ≥ 0.01 nM, significantly increased intracellular cAMP levels, while VIP at higher concentrations (≥ 1 nM) increased intracellular cAMP levels (Supplementary Figure 1C).
To detect receptor internalization, only cell surface GPCR-Halo proteins were labeled with the cell-impermeable Alexa Fluor 488 HaloTag ligand and the signal ratio of internalized GPCR vs. total GPCR was determined in each cell after 30 min of PACAP treatment. PACAP (1 µM) induced an increase in the internalization of 5-HT2A (saline, 10.64 ± 1.40; PACAP, 29.50 ± 2.07, p < 0.001, Student’s t-test) in HEK293T cells (Figures 1A, B). In accordance with previous reports (3, 4, 31, 32), PACAP also induced the internalization of PAC1 (saline, 9.52 ± 1.45; PACAP, 33.08 ± 0.56, p < 0.001, Student’s t-test) (Figures 1A, B). In contrast, PACAP did not affect the internalization of 5-HT1A (saline, 6.19 ± 0.61; PACAP, 7.18 ± 0.64, not significant), 5-HT2c (saline, 49.35 ± 2.72; PACAP, 42.06 ± 2.09, not significant), D2 (saline, 20.95 ± 1.93; PACAP, 17.87 ± 1.81, not significant), or mGlu2 (saline, 11.64 ± 0.84; PACAP, 9.44 ± 0.95, not significant) (Figures 1A, B). We also analyzed the time course of PACAP-induced internalization. The internalization ratios of 5-HT2A and PAC1 were similarly increased within 15 min after PACAP treatment and remained elevated for at least 45 min (two-way repeated-measures ANOVA; 5-HT2A, treatment effect, F(1, 82) = 65.77, p < 0.001; time effect, F(3, 246) = 11.77, p < 0.001; interaction, F(3, 246) = 11.75, p < 0.001; PAC1, treatment effect, F(1, 54) = 96.14, p < 0.001; time effect, F(3, 162) = 19.41, p < 0.001; interaction, F(3, 162) = 18.66, p < 0.001) (Figure 1C). In accordance with previous reports (15, 16), 5-HT increased 5-HT2A internalization in a time-dependent manner, the pattern of which was similar to that of PACAP-induced 5-HT2A internalization (Supplementary Figure 2).
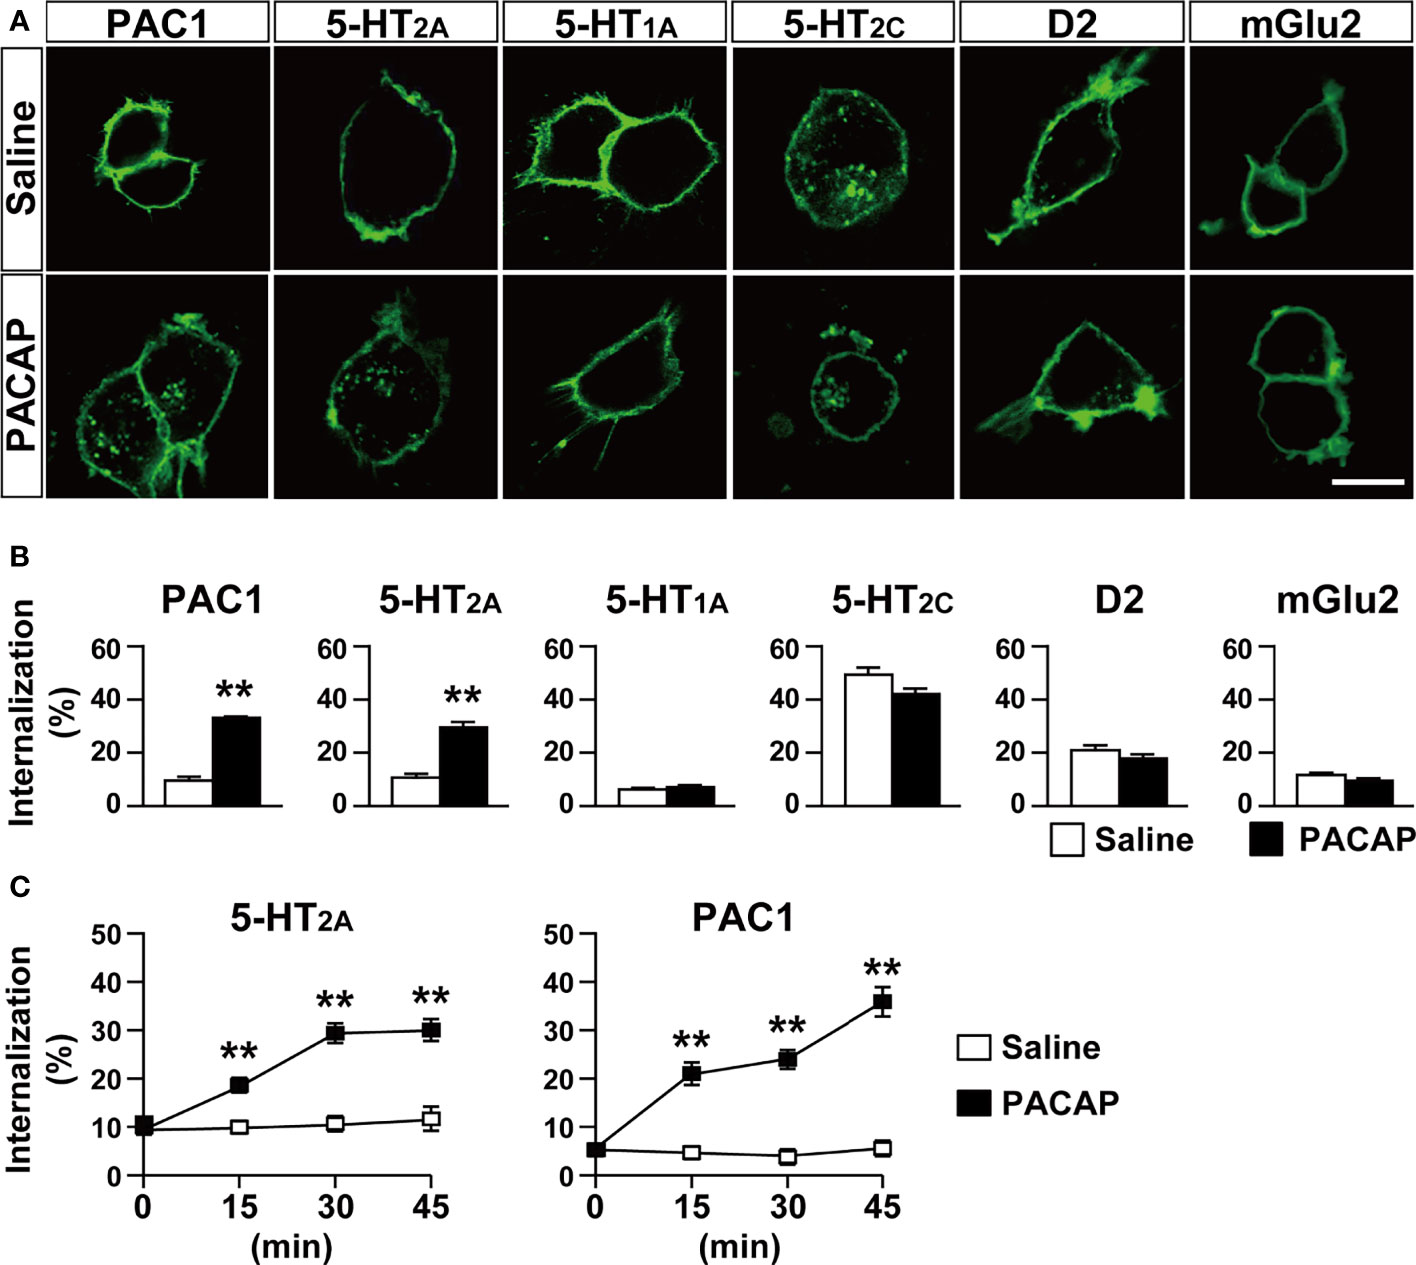
Figure 1 PACAP induces internalization of 5-HT2A in HEK293T cells. (A) Representative images of HEK293T cells transfected with the indicated HaloTag receptors. The cells were labeled with Alexa Fluor 488 HaloTag membrane impermeable ligand for 15 min and then treated with 1 μM PACAP or saline for 30 min. Scale bar, 10 μm. (B) Quantification of the indicated HaloTag receptor internalization. Values are the mean ± SEM of 40–64 cells obtained from three independent experiments. **p < 0.01 vs. saline, Student’s t-test. (C) Time course of 5-HT2A and PAC1 internalization for 45 min after PACAP treatment. Values are the mean ± SEM of 23–69 cells obtained from three independent experiments. **p < 0.01 vs. saline, two-way repeated-measures ANOVA followed by the Tukey-Kramer test.
PAC1 Mediates PACAP-Induced 5-HT2A Internalization
To examine the subtypes of the three PACAP receptors (PAC1, VPAC1 and VPAC2) involved in PACAP-induced 5-HT2A internalization, we compared 5-HT2A internalization following administration of various doses of PACAP and VIP. PACAP (0.01, 0.1, and 1 µM) dose-dependently increased 5-HT2A internalization (one-way ANOVA, F(3, 321) = 29.44, p < 0.001), but VIP (0.01, 0.1, and 1 µM) did not (one-way ANOVA, F(3, 304) = 3.62, p = 0.054) (Figures 2A, B). Pretreatment with PACAP6-38, a PAC1 antagonist, significantly inhibited the PACAP-induced 5-HT2A internalization (one-way ANOVA, F(2, 246) = 17.54, p < 0.001) (Figures 2C, D). In addition, shRNA-mediated PAC1 silencing in HEK293T cells, which effectively decreased PAC1 mRNA levels to less than 5% of normal levels, blocked the PACAP-induced 5-HT2A internalization (two-way ANOVA, PACAP effect, F(1, 156) = 79.51, p < 0.001; shRNA effect, F(1, 156) = 76.58, p < 0.001; interaction, F(1, 156) = 81.72, p < 0.001) (Supplementary Figure 3). Taken together these results indicate that PAC1 is involved in PACAP-induced 5-HT2A internalization.
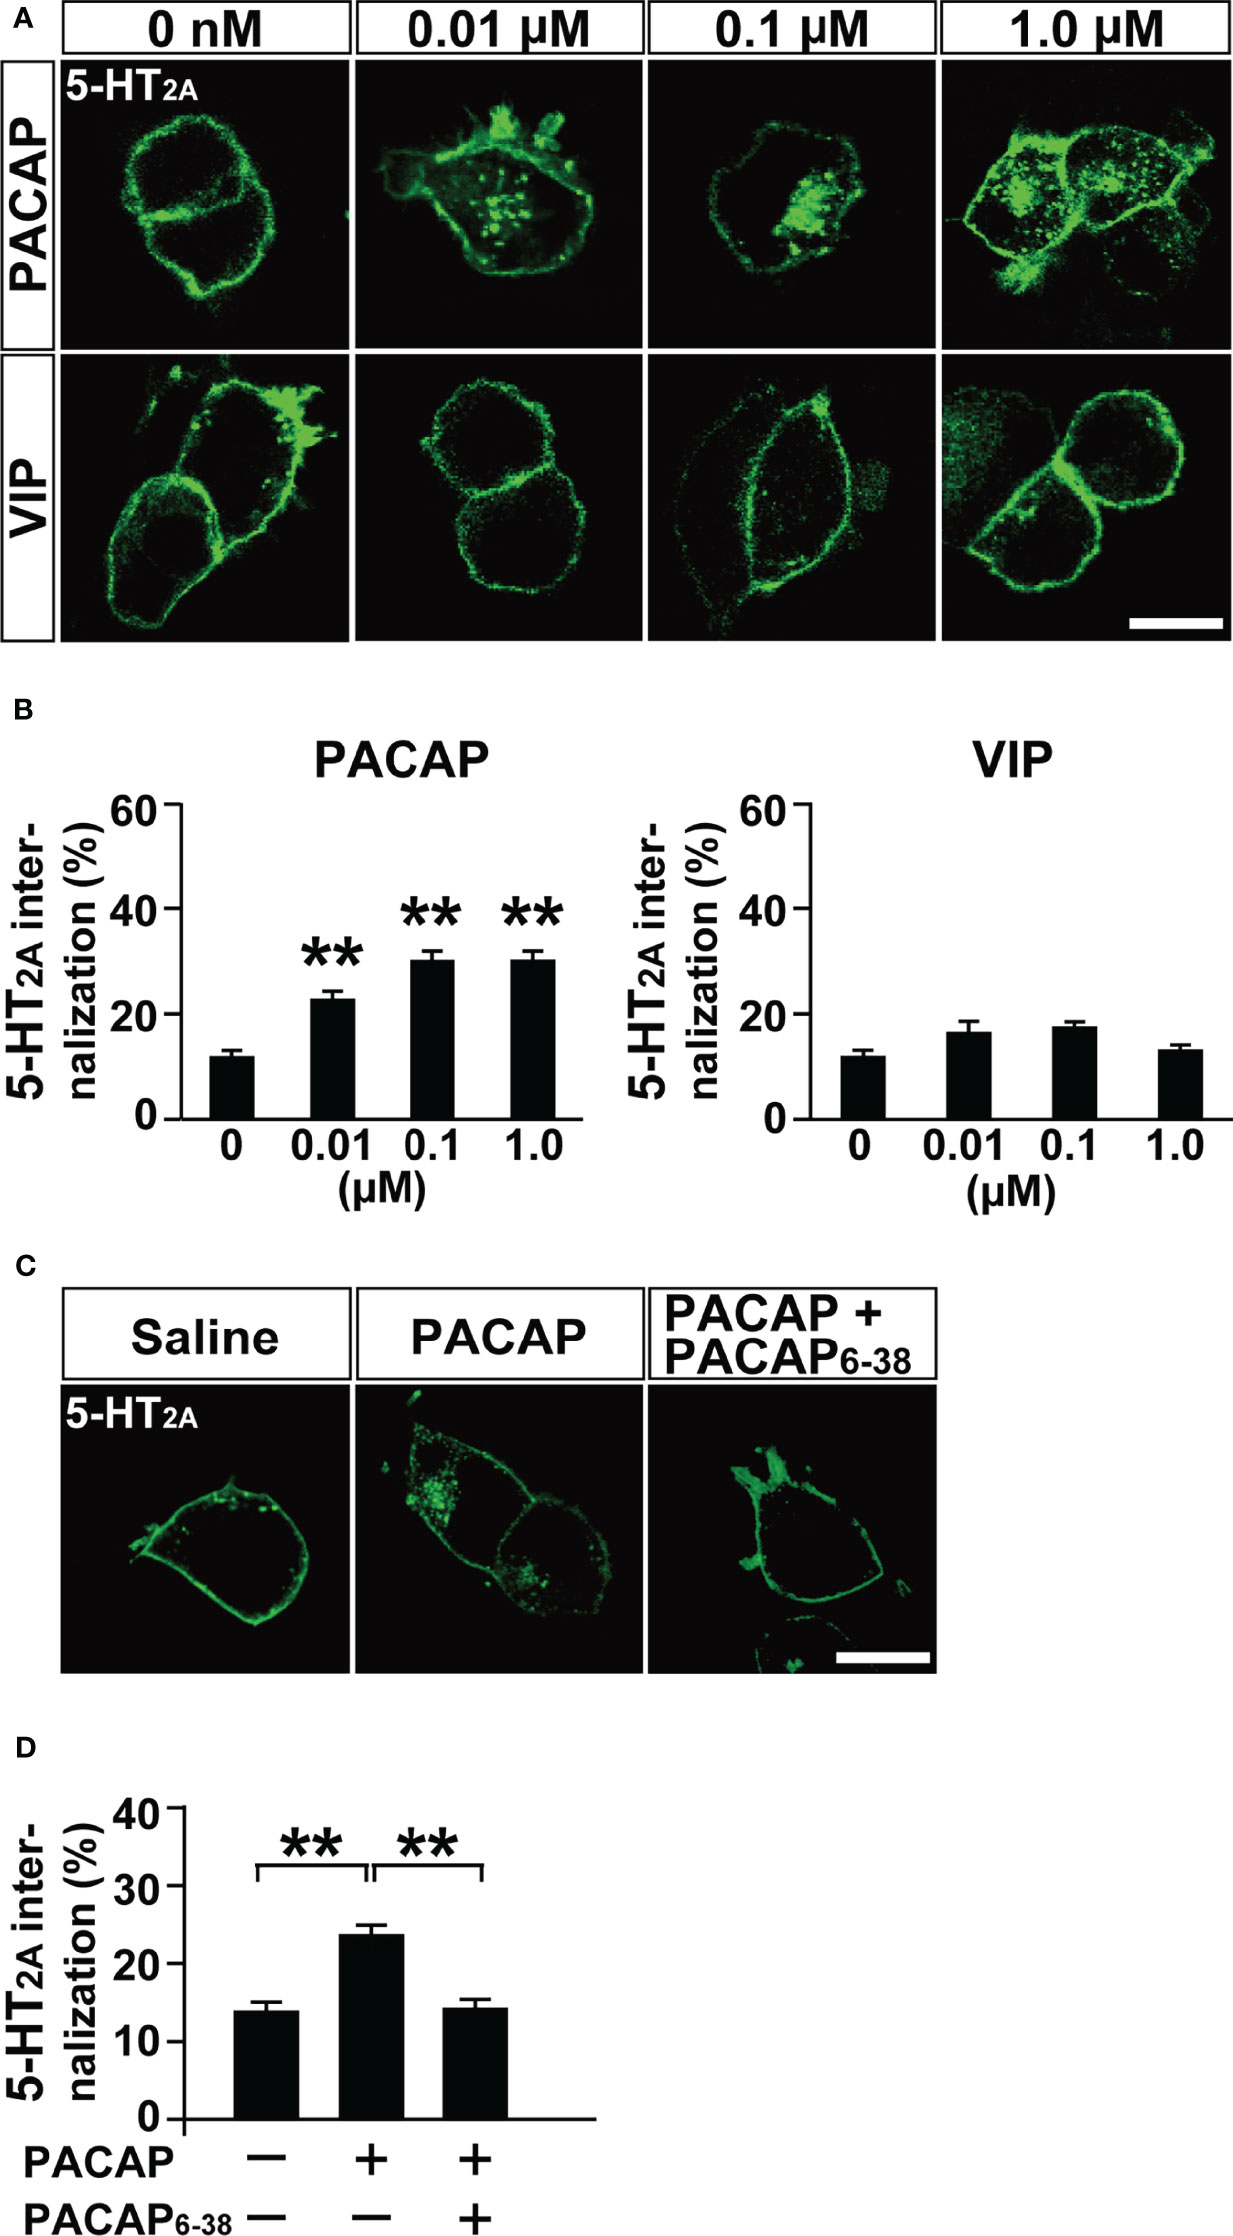
Figure 2 PACAP induces 5-HT2A internalization via PAC1 in HEK293T cells. (A) Representative images of HEK293T cells transfected with HaloTag 5-HT2A. The cells were labeled with Alexa Fluor 488 HaloTag membrane impermeable ligand for 15 min and then treated with the indicated concentrations of PACAP or VIP for 30 min. Scale bar, 10 μm. (B) Quantification of 5-HT2A internalization. Values are the mean ± SEM of 46–71 cells obtained from three independent experiments. **p < 0.01 vs. 0 μM, one-way ANOVA followed by the Tukey-Kramer test. (C) Representative images of HEK293T cells transfected with 5-HT2A. The cells were pretreated with 2 μM PACAP6-38 or saline for 30 min, labeled with Alexa Fluor 488 HaloTag membrane impermeable ligand for 15 min and then treated with 100 nM PACAP or saline for 30 min. Scale bar, 10 μm. (D) Quantification of 5-HT2A internalization. Values are the mean ± SEM of 80–86 cells obtained from three independent experiments. **p < 0.01, one-way ANOVA followed by the Tukey-Kramer test.
PKC Is Involved in PACAP-Induced 5-HT2A Internalization
We then addressed the signaling pathways involved in PACAP-induced 5-HT2A internalization. Pretreatment with the PKC inhibitor D-sphingosine (50 µM), but not the protein kinase A inhibitor H89 (20 µM), or the mitogen-activated protein kinase kinase (MEK) inhibitor PD98059 (50 µM), blocked the PACAP-induced 5-HT2A internalization (two-way ANOVA, PACAP effect, F(1, 372) = 44.34, p < 0.001; inhibitor effect, F(3, 372) = 18.41, p < 0.001; interaction, F(3, 372) = 8.04, p < 0.001) (Figures 3A, B). Another PKC inhibitor 1-(5-isoquinolinesulfonyl)-2-methylpiperazine dihydrochloride (H7) also significantly blocked PACAP-induced 5-HT2A internalization, whereas HA1004, a structural analog of H7 and used as a control, did not significantly inhibit the PACAP-induced 5-HT2A internalization (two-way ANOVA, PACAP effect, F(1, 448) = 33.37, p < 0.001; inhibitor effect, F(2, 448) = 8.98, p < 0.001; interaction, F(2, 448) = 4.53, p = 0.011) (Supplementary Figure 4).
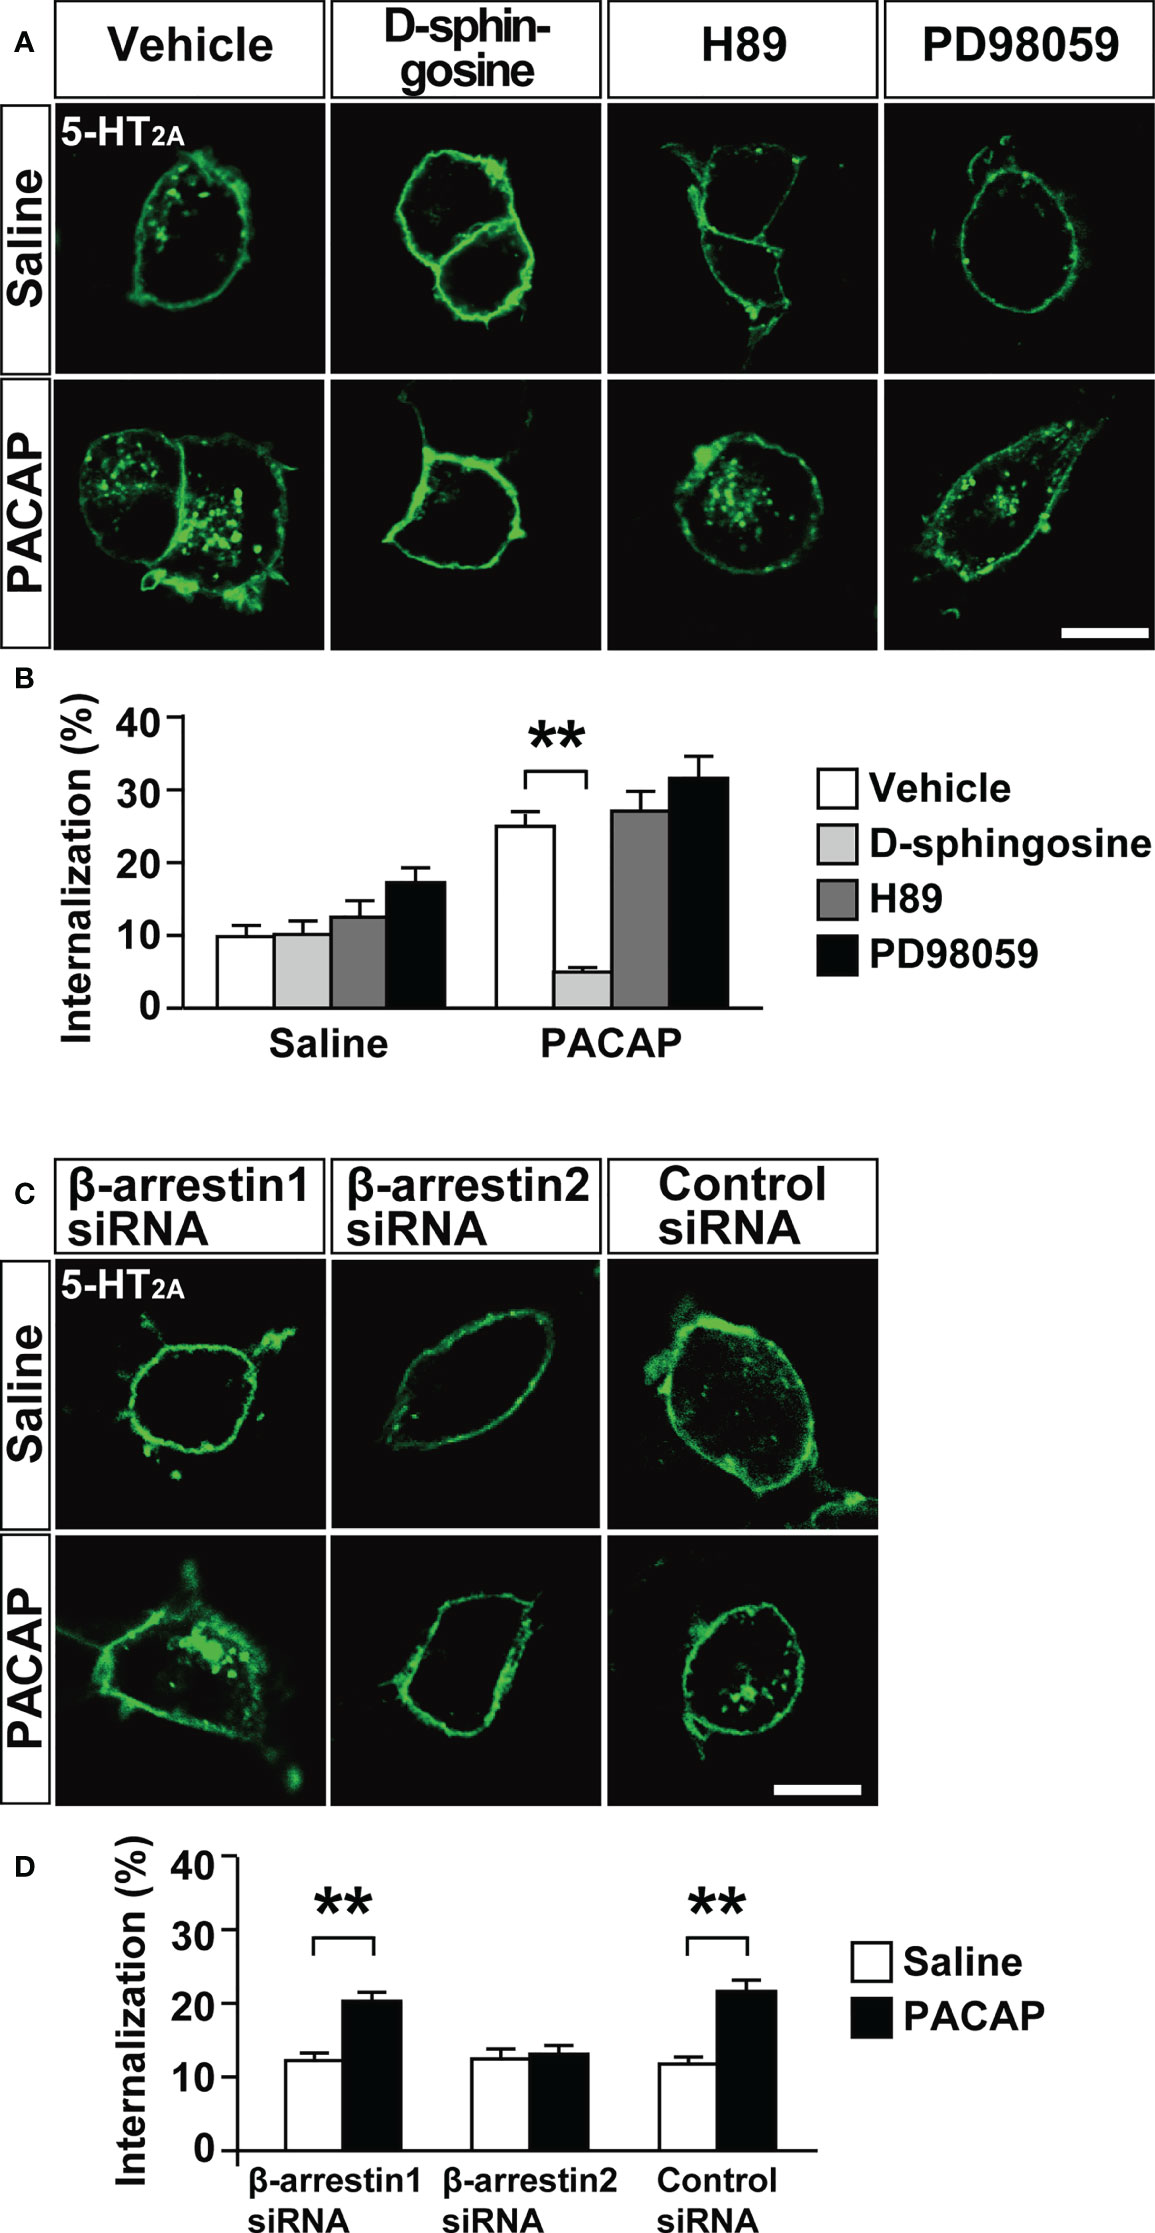
Figure 3 Effect of kinase inhibitors or β-arrestin silencing on PACAP-induced 5-HT2A internalization in HEK293T cells. (A) Representative images of HEK293T cells transfected with 5-HT2A. The cells were pretreated with 50 μM D-sphingosine (PKC inhibitor), 20 μM H89 (protein kinase A inhibitor), 50 μM PD98059 (MEK inhibitor) or saline for 30 min, labeled with Alexa Fluor 488 HaloTag membrane impermeable ligand for 15 min and then treated with 1 μM PACAP or saline for 30 min. Scale bar, 10 μm. (B) Quantification of 5-HT2A internalization. Values are the mean ± SEM of 34–51 cells obtained from three independent experiments. **p < 0.01, two-way ANOVA followed by the Tukey-Kramer test. (C) Representative images of HEK293T cells cotransfected with 5-HT2A plus β-arrestin1 siRNA, β-arrestin2 siRNA or the negative control siRNA. The cells were labeled with Alexa Fluor 488 HaloTag membrane impermeable ligand for 15 min and then treated with 1 μM PACAP or saline for 30 min. Scale bar, 10 μm. (D) Quantification of 5-HT2A internalization. Values are the mean ± SEM of 77–87 cells obtained from three independent experiments. **p < 0.01, two-way ANOVA followed by the Tukey-Kramer test.
β-Arrestin2 Is Involved in PACAP-Induced 5-HT2A Internalization
We recently reported that β-arrestin2, but not β-arrestin1, is involved in PACAP-induced internalization of PAC1 (4). We therefore examined whether β-arrestins are also involved in PACAP-induced 5-HT2A internalization. Although the β-arrestin1 and β-arrestin2 siRNAs effectively decreased respective β-arrestin levels to less than 35% of normal levels in HEK293T cells (4), β-arrestin2 siRNA, but not β-arrestin1 siRNA, blocked the PACAP-induced 5-HT2A internalization (two-way ANOVA, PACAP effect, F(1, 490) = 37.78, p < 0.001; silencing effect, F(2, 490) = 5.85, p = 0.0031; interaction, F(2, 490) = 7.61, p < 0.001) (Figures 3C, D). A negative control siRNA showed no effect on PACAP-induced 5-HT2A internalization (Figures 3C, D).
PACAP Decreases Cell Surface Localization of Endogenously Expressed 5-HT2A
To confirm the phenomenon of PACAP-induced 5-HT2A internalization in more neurologically relevant cells, we examined the effect of PACAP on the cell surface localization of endogenously expressed 5-HT2A in mouse primary cultured cortical neurons using a cell surface biotinylation assay. PACAP significantly decreased the levels of cell-surface biotinylated 5-HT2A (saline, 1.00 ± 0.14; PACAP, 0.46 ± 0.10; p = 0.0077, Student’s t-test) (Figures 4A, B). As expected, cell-surface biotinylated PAC1 levels were also decreased by PACAP (saline, 1.00 ± 0.09; PACAP, 0.26 ± 0.055; p < 0.001, Student’s t-test) (Figures 4A, B). In contrast, levels of cell-surface biotinylated 5-HT1A (saline, 1.00 ± 0.17; PACAP, 1.50 ± 0.45; not significant), D2 (saline, 1.00 ± 0.058; PACAP, 1.37 ± 0.22; not significant) and mGlu2/3 (saline, 1.00 ± 0.10; PACAP, 0.68 ± 0.13; not significant) were not affected by PACAP (Figures 4A, B).
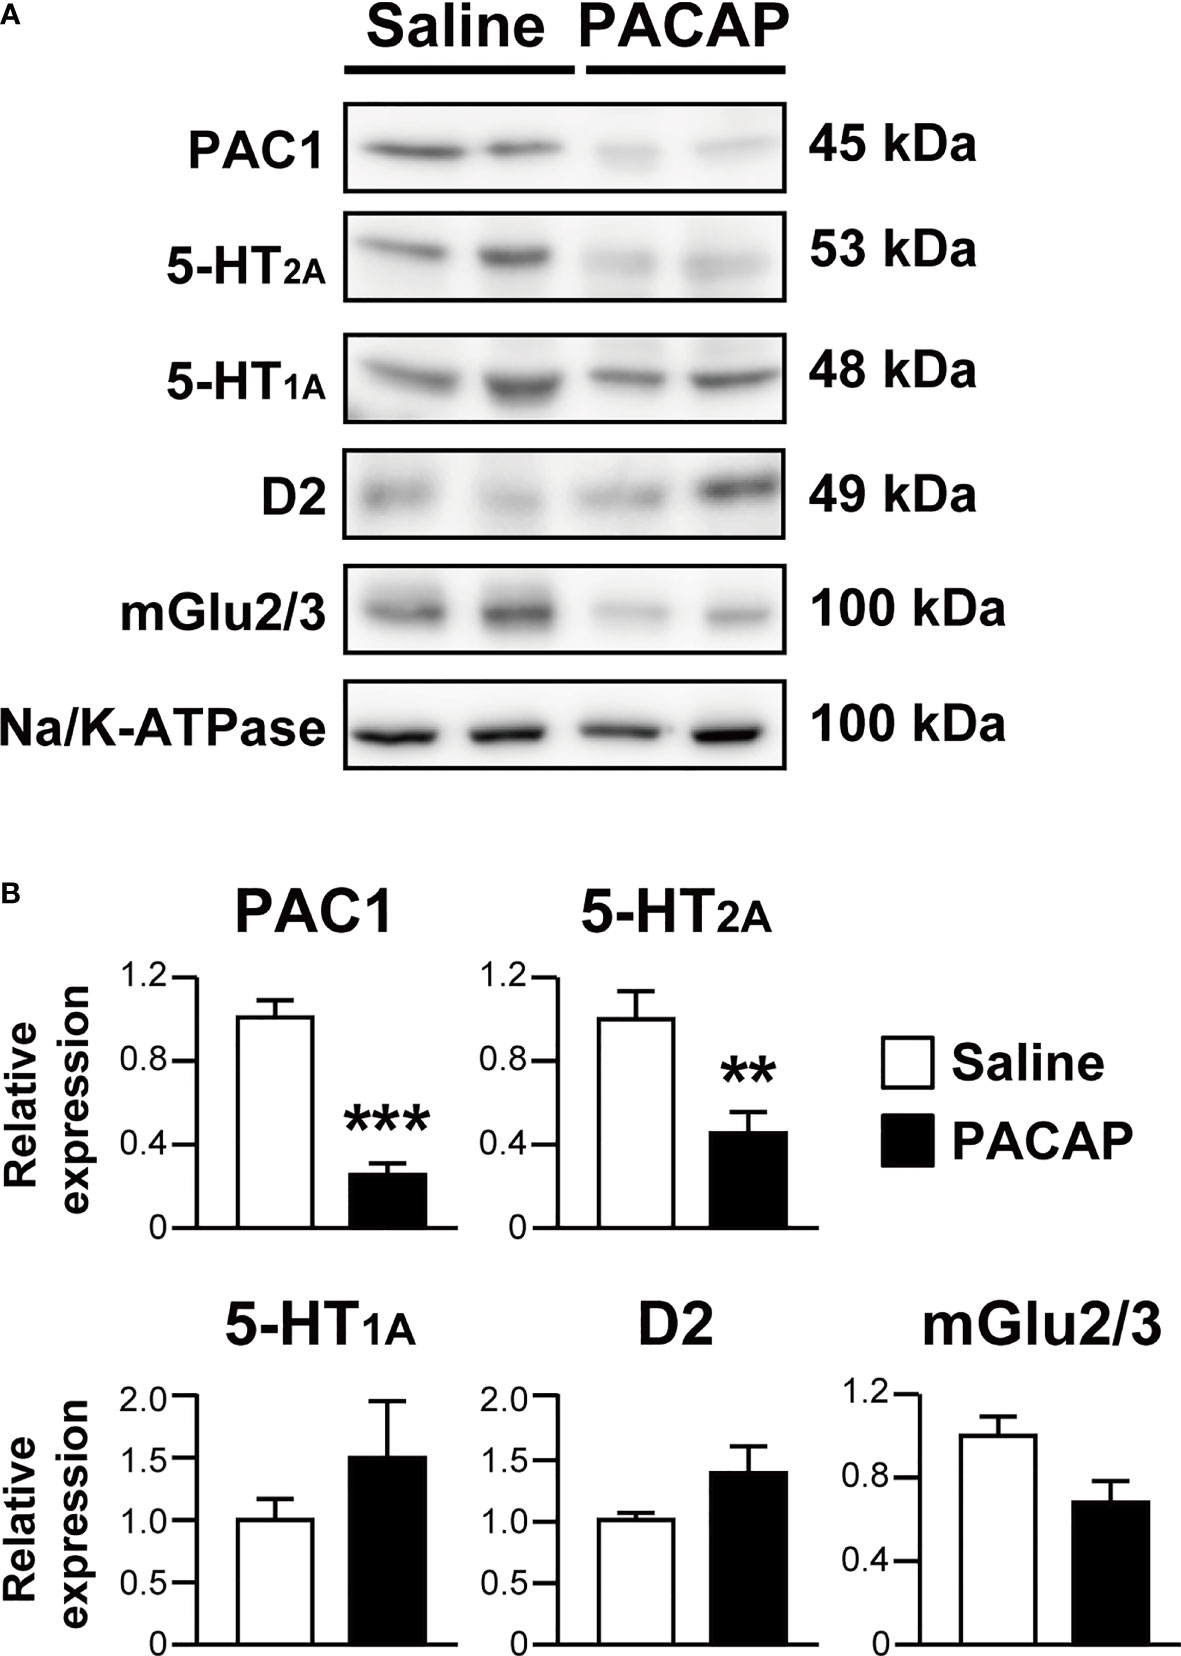
Figure 4 PACAP significantly decreases cell surface localization of 5-HT2A in primary cultured cortical neurons. (A) Representative immunoblots of cell surface biotinylated PAC1, 5-HT2A, 5-HT1A, D2, mGlu2/3 and alpha 1 sodium potassium ATPase (Na/K-ATPase) in primary cultured cortical neurons at 14 days in vitro treated with 1 μM PACAP or saline for 30 min. The band size is indicated for each blot. (B) Quantification of cell surface levels of PAC1, 5-HT2A, 5-HT1A, D2 and mGlu2/3 normalized to the levels of Na/K-ATPase. Values are the mean ± SEM from three or four independent experiments. **p < 0.01, ***p < 0.001 vs. saline, Student’s t-test.
In addition, 5-HT2A levels in the membrane fraction of the frontal cortex were increased in Pacap–/– mice compared with wild-type mice (saline, 1.00 ± 0.10; PACAP, 1.64 ± 0.10; p = 0.002, Student’s t-test), although no significant change was observed in total 5-HT2A protein levels between Pacap–/– and wild-type mice (saline, 1.00 ± 0.03; PACAP, 0.94 ± 0.03; not significant, Student’s t-test) (Figures 5A, B).
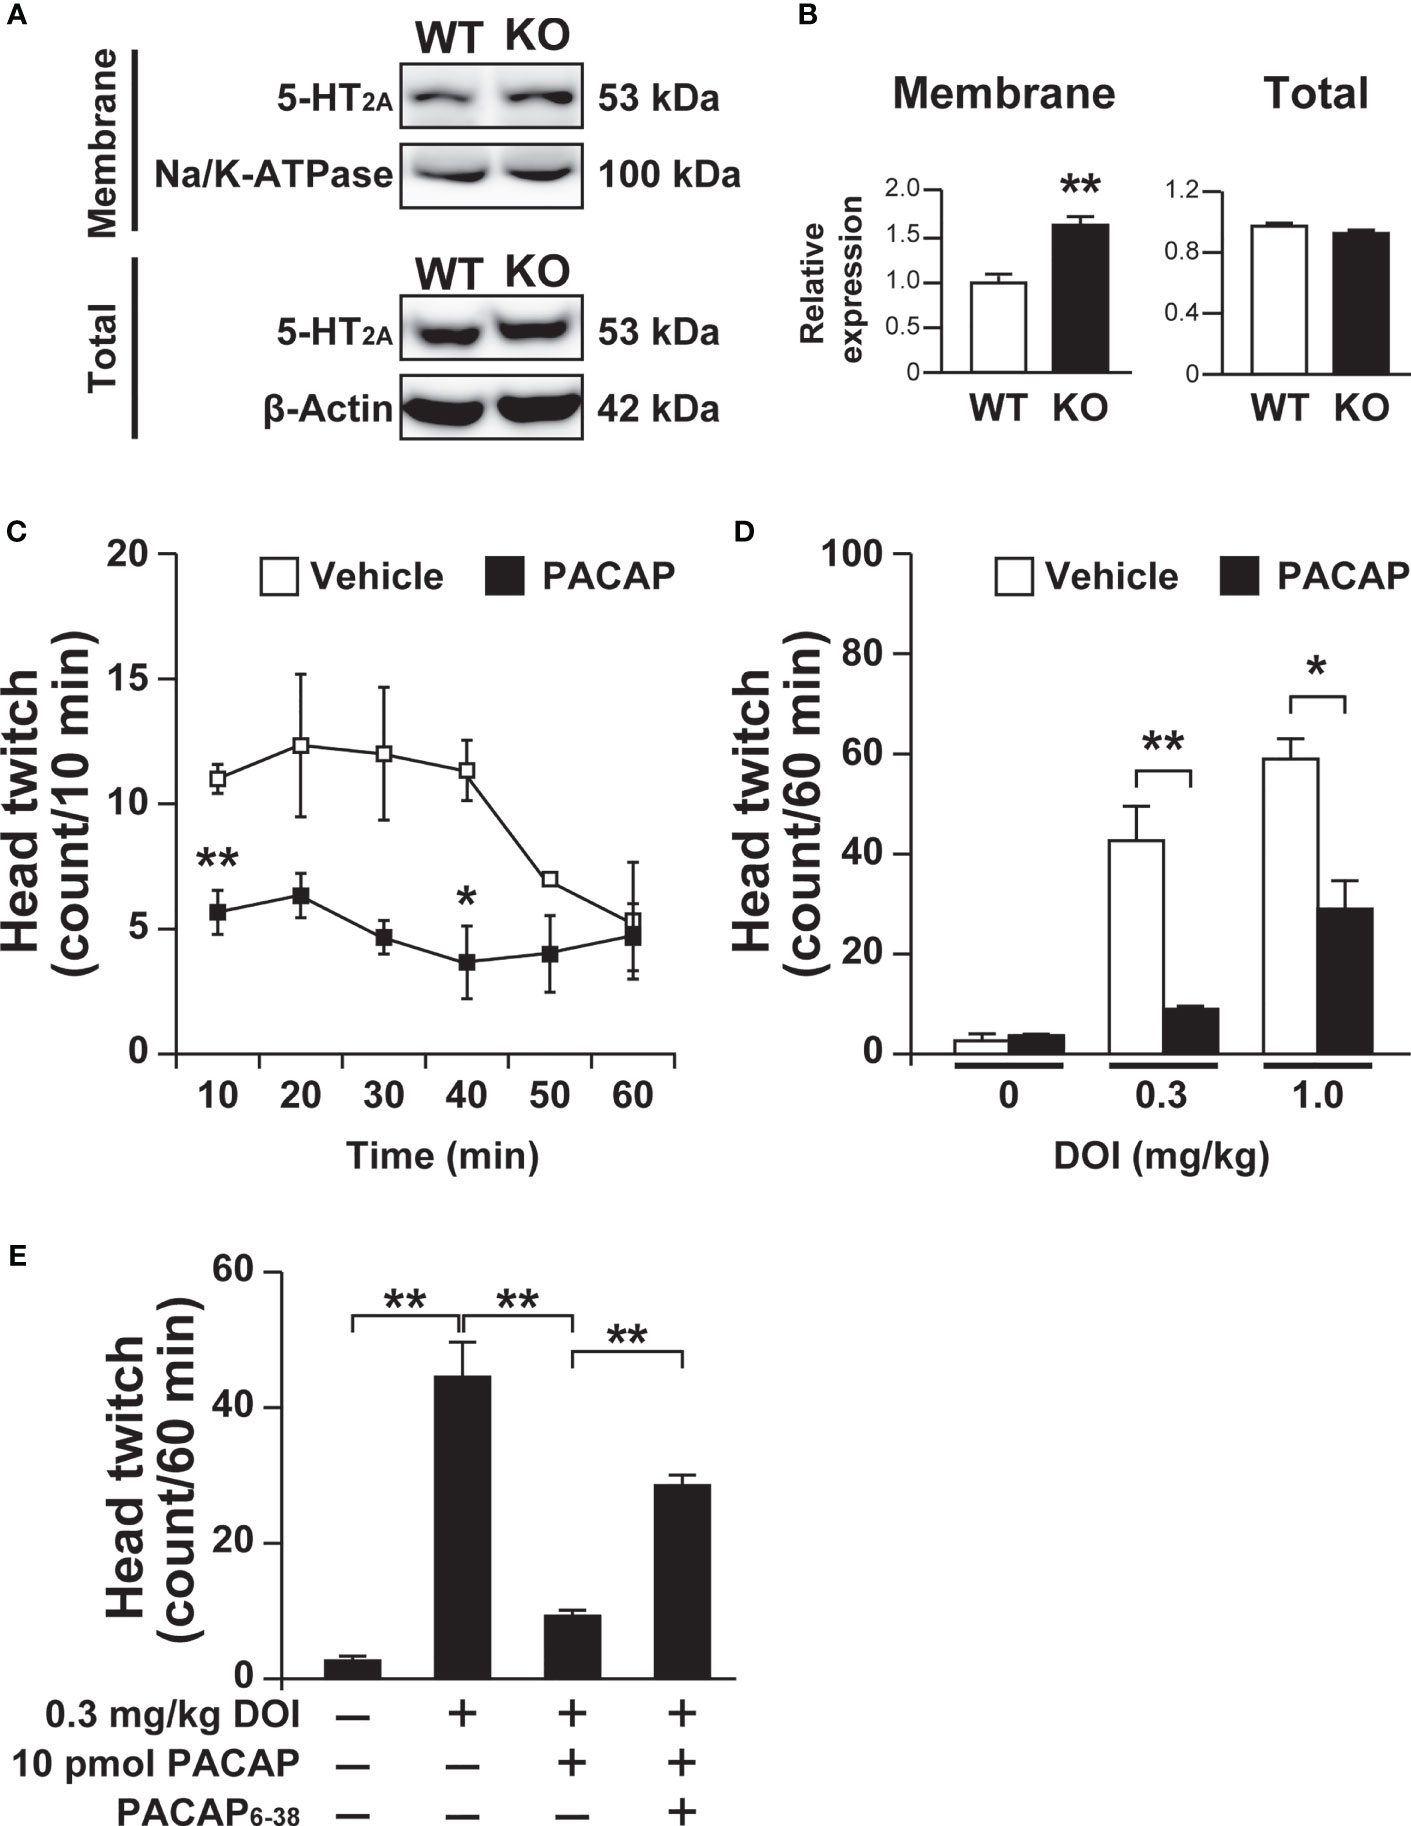
Figure 5 Increased 5-HT2A levels in the membrane fraction of the frontal cortex in Pacap–/– mice and PACAP-induced attenuation of DOI-induced head twitch response. (A) Representative immunoblots of 5-HT2A in the cell membrane fraction (membrane) or total cell lysate (total) of the frontal cortex from wild-type (WT) or Pacap–/– (KO) mice. As internal controls, Na/K-ATPase (membrane) and β-actin (total) were used. (B) Quantification of 5-HT2A levels normalized to Na/K-ATPase (membrane) or β-actin (total). Values are the mean ± SEM (n = 5). **p < 0.01 vs. saline, Student’s t-test. (C, D) Mice intracerebroventricularly administered PACAP (10 pmol) or vehicle were treated with DOI and their head-twitch responses were counted. (C) Time course of DOI (1 mg/kg)-induced head twitch responses. (D) Head twitch responses during 60 min in mice injected with the indicated doses of DOI. Values are the mean ± SEM (n = 3 per group). *p < 0.05, **p < 0.01 vs. vehicle, two-way repeated measures ANOVA (C) and two-way ANOVA (D) followed by the Tukey-Kramer test. (E) Effect of the PAC1 antagonist PACAP6-38 on the PACAP inhibition of DOI-induced head twitch response. Thirty minutes before PACAP administration, PACAP6-38 (100 pmol) were preadministered intracerebroventricularly. Values are the mean ± SEM (n = 4 per group). **p < 0.01 vs. vehicle, one-way ANOVA followed by the Tukey-Kramer test.
Intracerebroventricular PACAP Administration Ameliorates the Hallucinogenic Head Twitch Response
We then addressed PACAP signaling involvement in 5-HT2A-dependent behavioral responses by examining the head twitch response, which is a characteristic head-shaking movement induced by a hallucinogenic drug through the stimulation of 5-HT2 receptors (33). DOI (1.0 mg/kg)-induced head twitch responses were significantly fewer in mice administered PACAP (10 pmol) compared with vehicle control mice in the first, third and fourth 10 min-bins of a 60-min observation period (Figure 5C). The numbers of head twitch responses induced by 0.3 and 1.0 mg/kg DOI during 60 min were significantly lower in mice administered PACAP compared with vehicle control mice (two-way ANOVA, PACAP effect, F(1, 12) = 39.80, p < 0.001; dose effect, F(2, 12) = 50.90, p < 0.001; interaction, F(2, 12) = 11.03, p = 0.0019) (Figure 5D). In addition, we examined whether the inhibitory effect of PACAP on DOI-induced head twitch response is mediated by PAC1 by using the PAC1 antagonist PACAP6-38. Intracerebroventricular preadministration of PACAP6-38 (100 pmol) significantly blocked the inhibitory effect of PACAP on DOI-induced head twitch response (one-way ANOVA, F(3, 12) = 47.77, p < 0.001) (Figure 5E).
Discussion
In the present study, we investigated the mechanisms underlying the relationship between PACAP and 5-HT2A signaling pathways. We found that PACAP time- and dose-dependently increased the internalization of 5-HT2A, but not 5-HT1A, 5-HT2c, D2 or mGlu2, in HEK293T cells and that the effect of PACAP was mediated by PAC1, PKC and β-arrestin2. In addition, we showed that PACAP decreased the cell surface levels of endogenously expressed 5-HT2A in mouse primary cultured cortical neurons and that 5-HT2A levels in the membrane fraction of the frontal cortex were increased in Pacap–/– mice compared with wild-type mice. Finally, we observed that intracerebroventricular administration of PACAP suppressed DOI-induced head twitch responses in mice. These results suggest that PACAP–PAC1 signaling increases 5-HT2A internalization, resulting in attenuation of 5-HT2A-meadiated signaling.
In the present study, it is still uncertain whether PACAP-induced 5-HT2A internalization can be a mechanism for behavioral abnormalities including hyperactivity, PPI deficits, depressive-like behavior and memory impairment, reversal of the depressive-like behavior by the 5-HT2A antagonist ritanserin, and exaggerated DOI-induced hallucinogenic behaviors in Pacap–/– mice. In order to address this, it is necessary to examine if increased cell surface expression of 5-HT2A in the frontal cortex (and possibly other brain regions as well) is relevant to behavioral impairments including exaggerated DOI-induced hallucinogenic behaviors and the effects of 5-HT2A antagonists on reversal of the impairments in Pacap–/– mice (5–10). Given that increased cell surface expression of 5-HT2A leads to supersensitivity of the 5-HT2A-mediated 5-HT response, it is reasonable that 5-HT2A antagonists effectively reverse the behavioral impairments in Pacap–/– mice. The issue should also be addressed by examining whether 5-HT2A antagonists affect PAC1 and 5-HT2A interactions.
We examined 5-HT2A levels in the membrane fraction of the frontal cortex in Pacap–/– mice, since both 5-HT2A, PACAP and PAC1 are expressed in this brain region (34–37), suggesting a potential colocalization of 5-HT2A and PAC1 in the frontal cortex. In addition, 5-HT2A expressed in the frontal cortex plays an important role in the pathophysiology and therapeutic effects of schizophrenia (12, 14). However, further analyses in other brain regions are needed, which will be investigated in our future work.
5-HT2A internalization is involved in diverse signaling pathways depending on different ligands. Recent studies indicate that 5-HT2A internalization signaling may be separated into hallucinogenic and antipsychotic specific pathways, because hallucinogenic and non-hallucinogenic 5-HT2A ligands induce distinct immediate early gene expression patterns (38–41). Hallucinogenic DOI-induced 5-HT2A internalization is independent on β-arrestins and antipsychotic clozapine-mediated internalization is independent on PKC (16, 42). Urs et al. (43) reported that β-arrestin-biased D2 ligands exert unique brain region-specific antipsychotic actions (43). The present observation that PACAP–PAC1 signaling regulates 5-HT2A internalization in a PKC- and β-arrestin2-dependent manner provides a new molecular mechanism for this peptidergic signaling that cross-talks with serotonergic signaling in the brain.
We also examined the protein-protein interaction between PAC1 and 5-HT2A by co-immunoprecipitation using an anti-5-HT2A antibody; however, co-immunoprecipitation of PAC1 with 5-HT2A was not detected (data not shown). Therefore, it remains unclear how PACAP–PAC1 signaling induces 5-HT2A receptor internalization. We previously reported that PACAP–PAC1 signaling markedly reduces the association between DISC1 and DBZ in PC12 cells (44). DISC1 forms a protein complex of DISC1/Kalirin-7/PSD-95 (45). The Kalirin-7/PSD-95 complex is also directly associated with the 5-HT2A receptor and regulates 5-HT2A signaling and trafficking in HEK293 cells (46, 47). In addition, we previously showed that β-arrestin2, but not β-arrestin1, was involved in PACAP-induced internalization of PAC1 (4). PACAP–PAC1 signaling may regulate 5-HT2A internalization through these adaptor proteins.
In the present study, we observed, in our HEK293T cell cultures, expression of PAC1 transcript, maxadilan-induced cAMP elevation, PACAP-induced 5-HT2A internalization as well as inhibition of the PACAP-induced 5-HT2A internalization by PACAP6-38 and shRNA-mediated PAC1 silencing. In addition, we observed that the HEK293T cells which was newly obtained from RIKEN BRC Cell Bank expressed PAC1 mRNA at a similar level with our HEK293T cell cultures used in the present 5-HT2A internalization study. However, previous studies have shown that HEK293T cells did not express PAC1 (3, 28, 48, 49) and therefore PAC1 was exogenously expressed to investigate the signal transduction system. In contrast, it was also reported that HEK293T cells expressed the PAC1 protein as observed by western blot analysis (50, 51). The reason for the disagreement in PAC1 expression in HEK293T cells is currently unknown but might be related with passage number and culture conditions.
Serotonin syndrome is caused by adverse side effects of serotonergic drugs and is associated with increased serotoninergic activity (52). By indirectly antagonizing 5-HT2A function, PACAP signaling may have the potential to ameliorate serotonin syndrome. Accumulating evidence suggests that PACAP–PAC1 signaling in the brain provides clues to elucidating the pathomechanisms of neurological and psychiatric disorders (53–55). The present study furthers understanding of PACAP–PAC1 signaling and shows that this pathway is a promising target for the development of neurotherapeutics.
Data Availability Statement
The raw data supporting the conclusions of this article will be made available by the authors.
Ethics Statement
This animal study was reviewed and approved by the Animal Care and Use Committee of the Graduate School of Pharmaceutical Sciences, Osaka University.
Author Contributions
AH-T: design, experimentation, statistics, visualization, and writing. YS: experimentation and statistics. KM: experimentation and statistics. NE: experimentation and statistics. KK: experimentation. TN: writing and supervision. HH: conception, writing, and supervision. All authors contributed to the article and approved the submitted version.
Funding
This work was supported in part by the Japan Society for the Promotion of Science (JSPS) KAKENHI, grant numbers JP16K08269 (AH-T), JP19K07121 (AH-T), JP20H00492 (HH), JP20H03429 (HH, AH-T), JP20K07736 (HH, AH-T), JP21K19335 (HH), MEXT KAKENHI, grant number JP18H05416 (HH), AMED, grant numbers JP21dm0207117 (HH), and JP21am0101084 (HH), and a grant from the Takeda Science Foundation (HH).
Conflict of Interest
The authors declare that the research was conducted in the absence of any commercial or financial relationships that could be construed as a potential conflict of interest.
Publisher’s Note
All claims expressed in this article are solely those of the authors and do not necessarily represent those of their affiliated organizations, or those of the publisher, the editors and the reviewers. Any product that may be evaluated in this article, or claim that may be made by its manufacturer, is not guaranteed or endorsed by the publisher.
Acknowledgments
We are grateful to Dr. Atsuro Miyata at the Graduate School of Medical and Dental Sciences, Kagoshima University for his indispensable support. We are also grateful to the Center for Medical Research and Education, Graduate School of Medicine, Osaka University, for confocal microscopy analyses.
Supplementary Material
The Supplementary Material for this article can be found online at: https://www.frontiersin.org/articles/10.3389/fendo.2021.732456/full#supplementary-material
References
1. Arimura A. Perspectives on Pituitary Adenylate Cyclase Activating Polypeptide (PACAP) in the Neuroendocrine, Endocrine, and Nervous Systems. Jpn J Physiol (1998) 48:301–31. doi: 10.2170/jjphysiol.48.301
2. Vaudry D, Falluel-Morel A, Bourgault S, Basille M, Burel D, Wurtz O, et al. Pituitary Adenylate Cyclase-Activating Polypeptide and Its Receptors: 20 Years After the Discovery. Pharmacol Rev (2009) 61:283–357. doi: 10.1124/pr.109.001370
3. May V, Clason TA, Buttolph TR, Girard BM, Parsons RL. Calcium Influx, But Not Intracellular Calcium Release, Supports PACAP-Mediated ERK Activation in HEK PAC1 Receptor Cells. J Mol Neurosci (2014) 54:342–50. doi: 10.1007/s12031-014-0300-0
4. Shintani Y, Hayata-Takano A, Moriguchi K, Nakazawa T, Ago Y, Kasai A, et al. Beta-Arrestin1 and 2 Differentially Regulate PACAP-Induced PAC1 Receptor Signaling and Trafficking. PLoS One (2018) 13:e0196946. doi: 10.1371/journal.pone.0196946
5. Hashimoto H, Shintani N, Tanaka K, Mori W, Hirose M, Matsuda T, et al. Altered Psychomotor Behaviors in Mice Lacking Pituitary Adenylate Cyclase-Activating Polypeptide (PACAP). Proc Natl Acad Sci U S A (2001) 98:13355–60. doi: 10.1073/pnas.231094498
6. Tajiri M, Hayata-Takano A, Seiriki K, Ogata K, Hazama K, Shintani N, et al. Serotonin 5-HT(7) Receptor Blockade Reverses Behavioral Abnormalities in PACAP-Deficient Mice and Receptor Activation Promotes Neurite Extension in Primary Embryonic Hippocampal Neurons: Therapeutic Implications for Psychiatric Disorders. J Mol Neurosci (2012) 48(3):473–81. doi: 10.1007/s12031-012-9861-y
7. Hashimoto H, Hashimoto R, Shintani N, Tanaka K, Yamamoto A, Hatanaka M, et al. Depression-Like Behavior in the Forced Swimming Test in PACAP-Deficient Mice: Amelioration by the Atypical Antipsychotic Risperidone. J Neurochem (2009) 110:595–602. doi: 10.1111/j.1471-4159.2009.06168.x
8. Gaszner B, Kormos V, Kozicz T, Hashimoto H, Reglodi D, Helyes Z. The Behavioral Phenotype of Pituitary Adenylate-Cyclase Activating Polypeptide-Deficient Mice in Anxiety and Depression Tests is Accompanied by Blunted C-Fos Expression in the Bed Nucleus of the Stria Terminalis, Central Projecting Edinger-Westphal Nucleus, Ventral Lateral Septum, and Dorsal Raphe Nucleus. Neuroscience (2012) 202:283–99. doi: 10.1016/j.neuroscience.2011.11.046
9. Hattori S, Takao K, Tanda K, Toyama K, Shintani N, Baba A, et al. Comprehensive Behavioral Analysis of Pituitary Adenylate Cyclase-Activating Polypeptide (PACAP) Knockout Mice. Front Behav Neurosci (2012) 6:58. doi: 10.3389/fnbeh.2012.00058
10. Hashimoto R, Hashimoto H, Shintani N, Chiba S, Hattori S, Okada T, et al. Pituitary Adenylate Cyclase-Activating Polypeptide Is Associated With Schizophrenia. Mol Psychiatry (2007) 12:1026–32. doi: 10.1038/sj.mp.4001982
11. Hazama K, Hayata-Takano A, Uetsuki K, Kasai A, Encho N, Shintani N, et al. Increased Behavioral and Neuronal Responses to a Hallucinogenic Drug in PACAP Heterozygous Mutant Mice. PLoS One (2014) 9:e89153. doi: 10.1371/journal.pone.0089153
12. Kormos V, Gaspar L, Kovacs LA, Farkas J, Gaszner T, Csernus V. Reduced Response to Chronic Mild Stress in PACAP Mutant Mice Is Associated With Blunted FosB Expression in Limbic Forebrain and Brain Stem Centers. Neurosci (2016) 330:335–58. doi: 10.1016/j.neuroscience.2016.06.004
13. Norton N, Owen MJ. HTR2A: Association and Expression Atudies in Neuropsychiatric Genetics. Ann Med (2005) 37(2):121–9. doi: 10.1080/07853890510037347
14. Kang K, Huang XF, Wang Q, Deng C. Decreased Density of Serotonin 2A Receptors in the Superior Temporal Gyrus in Schizophrenia–A Postmortem Study. Prog Neuropsychopharmacol Biol Psychiatry (2009) 33:867–71. doi: 10.1016/j.pnpbp.2009.04.010
15. Meltzer HY, Li Z, Kaneda Y, Ichikawa J. Serotonin Receptors: Their Key Role in Drugs to Trear Schizophrenia. Prog Neuropsychopharmacol Biol Psychiatry (2003) 27(7):1159–72. doi: 10.1016/j.pnpbp.2003.09.010
16. Bhattacharyya S, Puri S, Miledi R, Panicker MM. Internalization and Recycling of 5-HT2A Receptors Activated by Serotonin and Protein Kinase C-Mediated Mechanisms. Proc Natl Acad Sci U S A (2002) 99:14470–5. doi: 10.1073/pnas.212517999
17. Raote I, Bhattacharyya S, Panicker MM. Functional Selectivity in Serotonin Receptor 2A (5-HT2A) Endocytosis, Recycling, and Phosphorylation. Mol Pharmacol (2013) 83:42–50. doi: 10.1124/mol.112.078626
18. Bulenger S, Marullo S, Bouvier M. Emerging Role of Homo- and Heterodimerization in G-Protein-Coupled Receptor Biosynthesis and Maturation. Trends Pharmacol Sci (2005) 26:131–7. doi: 10.1016/j.tips.2005.01.004
19. Milligan G. G Protein-Coupled Receptor Hetero-Dimerization: Contribution to Pharmacology and Function. Br J Pharmacol (2009) 158:5–14. doi: 10.1111/j.1476-5381.2009.00169.x
20. Gonzalez-Maeso J, Ang RL, Yuen T, Chan P, Weisstaub NV, Lopez-Gimenez JF, et al. Identification of a Serotonin/Glutamate Receptor Complex Implicated in Psychosis. Nature (2008) 452:93–7. doi: 10.1038/nature06612
21. Gonzalez-Maeso J, Sealfon SC. Psychedelics and Schizophrenia. Trends Neurosci (2009) 32:225–32. doi: 10.1016/j.tins.2008.12.005
22. Albizu L, Holloway T, Gonzalez-Maeso J, Sealfon SC. Functional Crosstalk and Heteromerization of Serotonin 5-HT2A and Dopamine D2 Receptors. Neuropharmacology (2011) 61:770–7. doi: 10.1016/j.neuropharm.2011.05.023
23. Fribourg M, Moreno JL, Holloway T, Provasi D, Baki L, Mahajan R, et al. Decoding the Signaling of a GPCR Heteromeric Complex Reveals a Unifying Mechanism of Action of Antipsychotic Drugs. Cell (2011) 147:1011–23. doi: 10.1016/j.cell.2011.09.055
24. Shibasaki Y, Hayata-Takano A, Hazama K, Nakazawa T, Shintani N, Kasai A. Atomoxetine Reverses Locomotor Hyperactivity, Impaired Novel Object Recognition, and Prepulse Inhibition Impairment in Mice Lacking Pituitary Adenylate Cyclase-Activating Polypeptide. Neuroscience (2015) 297:95–104. doi: 10.1016/j.neuroscience.2015.03.062
25. Hayata-Takano A, Kamo T, Kijima H, Seiriki K, Ogata K, Ago Y, et al. Pituitary Adenylate Cyclase-Activating Polypeptide Modulates Dendritic Spine Maturation and Morphogenesis via MicroRNA-132 Upregulation. J Neurosci (2019) 39:4208–20. doi: 10.1523/JNEUROSCI.2468-18.2019
26. Kawaguchi C, Shintani N, Hayata-Takano A, Hatanaka M, Kuromi A, Nakamura R, et al. Lipocalin-Type Prostaglandin D Synthase Regulates Light-Induced Phase Advance of the Central Circadian Rhythm in Mice. Commun Biol (2020) 3:557. doi: 10.1038/s42003-020-01281-w
27. Cavallaro S, D'Agata V, Guardabasso V, Travali S, Stivala F, Canonicon PL. Differentiation Induces Pituitary Adenylate Cyclase-Activating Polypeptide Receptor Expression in PC-12 Cells. Mol Pharmacol (1995) 48(1):56–62.
28. Hashimoto H, Hagihara N, Koga K, Yamamoto K, Shintani N, Tomimoto S, et al. Synergistic Induction of Pituitary Adenylate Cyclase-Activating Polypeptide (PACAP) Gene Expression by Nerve Growth Factior and PACAP in PC12 Cells. J Neurochem (2000) 74(2):501–7. doi: 10.1046/j.1471-4159.2000.740501.x
29. Lutz EM, Ronaldson E, Shaw P, Johnson MS, Holland PJ, Mitchell R. Characterization of Novel Splice Variants of the PAC1 Receptor in Human Neuroblastoma Cells: Consequences for Signaling by VIP and PACAP. Mol Cell Neurosci (2006) 31(2):193–209. doi: 10.1016/j.mcn.2005.09.008
30. Uchida D, Tatsuno I, Tanaka T, Hirai A, Saito Y, Moro O, et al. Maxadilan is a Specific Agonist and its Deleted Peptide (M65) Is a Specific Antagonist for PACAP Type 1 Receptor. Ann N Y Acad Sci (1998) 865:253–8. doi: 10.1111/j.1749-6632.1998.tb11185.x
31. Merriam LA, Baran CN, Girard BM, Hardwick JC, May V, Parsons RL. Pituitary Adenylate Cyclase 1 Receptor Internalization and Endosomal Signaling Mediate the Pituitary Adenylate Cyclase Activating Polypeptide-Induced Increase in Guinea Pig Cardiac Neuron Excitability. J Neurosci (2013) 33(10):4614–22. doi: 10.1523/JNEUROSCI.4999-12.2013
32. May V, Buttolph TR, Girard BM, Clason TA, Parsons RL. PACAP-Induced ERK Activation in HEK Cells Expressing PAC1 Receptors Involves Both Receptor Internalization and PKC Signaling. Am J Physiol Cell Physiol (2014) 306(11):C1068–79. doi: 10.1152/ajpcell.00001.2014
33. Darmani NA, Shaddy J, Gerdes CF. Differential Ontogenesis of Three DOI-Induced Behaviors in Mice. Physiol Behav (1996) 60:1495–500. doi: 10.1016/s0031-9384(96)00323-x
34. Weber ET, Andrade R. Htr2a Gene and 5-HT2A Receptor Expression in the Cerebral Cortex Studied Using Genetically Modified Mice. Front Neurosci (2010) 4:36. eCollection 2010. doi: 10.3389/fnins.2010.00036
35. Hashimoto H, Nogi H, Mori K, Ohishi H, Shigemoto R, Yamamoto K, et al. Distribution of the mRNA for a Pituitary Adenylate Cyclase-Activating Polypeptide Receptor in the Rat Brain: An in Situ Hybridization Study. J Comp Neurol (1996) 371(4):567–77. doi: 10.1002/(SICI)1096-9861(19960805)371:4<567::AID-CNE6>3.0.CO;2-2
36. Hannibal J. Pituitary Adenylate Cyclase-Activating Peptide in the Rat Central Nervous System: An Immunohistochemical and in Situ Hybridization Study. J Comp Neurol (2002) 453(4):389–417. doi: 10.1002/cne.10418
37. Martelle SE, Cotella EM, Nawreen N, Chen C, Packard BA, Fitzgerald M, et al. Prefrontal Cortex PACAP Signaling: Organization and Role in Stress Regulation. Stress (2021) 24(2):196–205. doi: 10.1080/10253890.2021.1887849
38. González-Maeso J, Weisstaub NV, Zhou M, Chan P, Ivic L, Ang R, et al. Hallucinogens Recruit Specific Cortical 5-HT(2A) Receptor-Mediated Signaling Pathways to Affect Behavior. Neuron (2007) 53:439–52. doi: 10.1016/j.neuron.2007.01.008
39. Dong C, Ly C, Dunlap LE, Vargas MV, Sun J, Hwang IW. Psychedelic-Inspired Drug Discovery Using an Engineered Biosensor. Cell (2021) 184(10):2779–92. doi: 10.1016/j.cell.2021.03.043
40. Cameron LP, Tombari RJ, Lu J, Pell AJ, Hurley ZQ, Ehinger Y, et al. A Non-Hallucinogenic Psychedelic Analogue With Therapeutic Potential. Nature (2021) 589:474–9. doi: 10.1038/s41586-020-3008-z
41. López-Giménez JF, González-Maeso J. Hallucinogens and Serotonin 5-HT2A Receptor-Mediated Signaling Pathways. Curr Top Behav Neurosci (2018) 36:45–73. doi: 10.1007/7854_2017_478
42. Schmid RK, Bohn CL, Bohn LM. Agonist-Directed Signaling of the Serotonin 2A Receptor Depends on β-Arrestin-2 Interactions In Vivo. Proc Natl Acad Sci U S A (2008) 105:1079–84. doi: 10.1073/pnas.0708862105
43. Urs NM, Peterson SM, Caron MG. New Concepts in Dopamine D2 Receptor Biased Signaling and Implications for Schizophrenia Therapy. Biol Psychiatry (2017) 81:78–85. doi: 10.1016/j.biopsych.2016.10.011
44. Hattori T, Baba K, Matsuzaki S, Honda A, Miyoshi K, Inoue K, et al. A Novel DISC1-Interacting Partner DISC1-Binding Zinc-Finger Protein: Implication in the Modulation of DISC1-Dependent Neurite Outgrowth. Mol Psychiatry (2007) 12:398–407. doi: 10.1038/sj.mp.4001945
45. Hayashi-Takagi A, Takaki M, Graziane N, Seshadri S, Murdoch H, Dunlop AJ, et al. Disrupted-In-Schizophrenia 1 (DISC1) Regulates Spines of the Glutamate Synapse via Rac1. Nat Neurosci (2010) 13:327–32. doi: 10.1038/nn.2487
46. Xia Z, Gray JA, Compton-Toth BA, Roth BL. A Direct Interaction of PSD-95 With 5-HT2A Serotonin Receptors Regulates Receptor Trafficking and Signal Transduction. J Biol Chem (2003) 278:21901–8. doi: 10.1074/jbc.M301905200
47. Jones KA, Srivastava DP, Allen JA, Strachan RT, Roth BL, Penzes P. Rapid Modulation of Spine Morphology by the 5-HT2A Serotonin Receptor Through Kalirin-7 Signaling. Proc Natl Acad Sci U S A (2009) 106:19575–80. doi: 10.1073/pnas.0905884106
48. Emery AC, Eiden MV, Mustafa T, Eiden LE. Rapgef2 Connects GPCR-Mediated cAMP Signals to ERK Activation in Neuronal and Endocrine Cells. Sci Signal (2013) 6(281):ra51. doi: 10.1126/scisignal.2003993
49. Emery AC, Alvarez RA, Abboud P, Xu W, Westover CD, Eiden MV, et al. C-Terminal Amidation of PACAP-38 and PACAP-27 Is Dispensable for Biological Activity at the PAC1 Receptor. Peptides (2016) 79:39–48. doi: 10.1016/j.peptides.2016.03.003
50. Yan Y, Zhou X, Pan Z, Ma J, Waschek JA, DiCicco-Bloom E. Pro- and Anti-Mitogenic Actions of Pituitary Adenylate Cyclase-Activating Polypeptide in Developing Cerebral Cortex: Potential Mediation by Developmental Switch of PAC1 Receptor mRNA Isoforms. J Neurosci (2013) 33(9):3865–78. doi: 10.1523/JNEUROSCI.1062-12.2013
51. Egri P, Fekete C, Dénes Á., Reglődi D, Hashimoto H, Fülöp BD, et al. Pituitary Adenylate Cyclase-Activating Polypeptide (PACAP) Regulates the Hypothalamo-Pituitary-Thyroid (HPT) Axis via Type 2 Deiodinase in Male Mice. Endocrinology (2016) 157(6):2356–66. doi: 10.1210/en.2016-1043
52. Sun-Edelstein C, Tepper SJ, Shapiro RE. Drug-Induced Serotonin Syndrome: A Review. Expert Opin Drug Saf (2008) 7(5):587–96. doi: 10.1517/14740338.7.5.587
53. Mabuchi T, Shintani N, Matsumura S, Okuda-Ashitaka E, Hashimoto H, Muratani T, et al. Pituitary Adenylate Cyclase-Activating Polypeptide Is Required for the Development of Spinal Sensitization and Induction of Neuropathic Pain. J Neurosci (2004) 24:7283–91. doi: 10.1523/JNEUROSCI.0983-04.2004
54. Ressler KJ, Mercer KB, Bradley B, Jovanovic T, Mahan A, Kerley K. Post-Traumatic Stress Disorder Is Associated With PACAP and the PAC1 Receptor. Nature (2011) 470(7335):492–7. doi: 10.1038/nature09856
Keywords: pituitary adenylate cyclase-activating polypeptide (PACAP), internalization, hallucination, β-arrestin, G protein-coupled receptor (GPCR), serotonin 2A receptor (5-HT2A)
Citation: Hayata-Takano A, Shintani Y, Moriguchi K, Encho N, Kitagawa K, Nakazawa T and Hashimoto H (2021) PACAP–PAC1 Signaling Regulates Serotonin 2A Receptor Internalization. Front. Endocrinol. 12:732456. doi: 10.3389/fendo.2021.732456
Received: 29 June 2021; Accepted: 27 September 2021;
Published: 25 October 2021.
Edited by:
Hubert Vaudry, Université de Rouen, FranceReviewed by:
Lee E. Eiden, National Institutes of Health (NIH), United StatesAlessandro Castorina, University of Technology Sydney, Australia
Copyright © 2021 Hayata-Takano, Shintani, Moriguchi, Encho, Kitagawa, Nakazawa and Hashimoto. This is an open-access article distributed under the terms of the Creative Commons Attribution License (CC BY). The use, distribution or reproduction in other forums is permitted, provided the original author(s) and the copyright owner(s) are credited and that the original publication in this journal is cited, in accordance with accepted academic practice. No use, distribution or reproduction is permitted which does not comply with these terms.
*Correspondence: Hitoshi Hashimoto, hasimoto@phs.osaka-u.ac.jp; Atsuko Hayata-Takano, a-hayata@phs.osaka-u.ac.jp
†These authors have contributed equally to this work and share first authorship