 Gaiqin Pei1,2†
 Aiya Qin1,3†
 Lingqiu Dong1,3
 Siqing Wang1,3
 Xiang Liu1,3
 Dandan Yang1,3
 Jiaxing Tan3
 Xiaoyuan Zhou4
 Yi Tang3*
 Wei Qin3*
- 1West China School of Medicine, Sichuan University, Chengdu, Sichuan, China
- 2Department of Rehabilitation Medicine Center, West China Hospital, Sichuan University, Sichuan, China
- 3Department of Nephrology, West China Hospital of Sichuan University, Chengdu, Sichuan, China
- 4West China School of Public Health, West China Forth Hospital of Sichuan University, Chengdu, China
Background: The triglycerides to high-density lipoprotein cholesterol (TG/HDL-C) ratio is an easy-to-use atherogenic and prognostic marker which has attracted increasing attention these days. However, whether TG/HDL-C correlate with outcomes in IgA nephropathy (IgAN) patients remains unknown. To clarify these issues, we conducted this study.
Methods: A total of 1146 patients from West China Hospital of Sichuan University were retrospectively analysed between 2008 and 2018.The demographic, clinical and pathological data of all patients at the time of biopsy were collected. Then, patients were divided into the high TG/HDL group (TG/HDL ≥ 1.495, N=382) and the low TG/HDL group (TG/HDL-C < 1.495, N=764) based on the optimal cut-off value of the TG/HDL-C using receive operating curve. Cox proportional hazard models and Kaplan–Meier curves were used to evaluate the renal outcomes of IgAN.
Results: The median age of the patients was 33 (26-42) years, and 44.5% were men. By correlation analysis, we found that the TG/HDL-C ratio was negatively correlated with the eGFR (r = 0.250, P < 0.001) but positively correlated with proteinuria (r = 0.230, P< 0.001), BMI (r=0.380, P<0.001) and serum uric (r =0.308, P< 0.001). Patients with a higher TG/HDL-C ratio tended to have hypertension [odds ratio (OR), 1.987; 95% CI, 1.527-2.587; P<0.001] and more severe pathologic lesions with tubular atrophy/interstitial fibrosis (OR, 1.610; 95% CI, 1.203-2.154; P=0.001). During a median follow-up period of 54.1 (35.6-73.2) months, a high TG/HDL ratio was strongly associated with worse renal survival in IgAN patients (log-rank: P <0.001). Multivariate Cox analysis demonstrated that a high TG/HDL-C ratio (HR 1.775, 95% CI 1.056-2.798; P=0.029) was an independent predictive marker to ESRD.
Conclusion: In this study, we addressed the importance of TG/HDL-C ratio as a predictive marker for IgAN progression.
Background
Immunoglobulin A (IgA) nephropathy (IgAN), characterized by diffusely deposited IgA in the kidneys, is the most prevalent primary glomerulonephritis and a leading cause of end-stage renal disease (ESRD), in which 20–40% of IgAN patients reach ESRD 10–20 years after the initial diagnosis (1). Recognizing risk factors of ESRD would be beneficial for to slowing the progression of IgAN.
Abnormal lipoprotein metabolism, which could lead to impaired renal function and accelerated atherosclerosis (2), is often characterized by the presence of high TG and low HDL-C in chronic kidney disease (CKD) (3). It is well known TG usually increases in the early stages of CKD and is associated with delayed catabolism. However, TG levels fluctuate substantially based on feeding status, thus limiting its utility as a predictive biomarker (4). The single HDL-C, despite the functions of anti-inflammatory and antithrombotic, remains controversial in predicting cardiovascular disease (CVD) or mortality (5). The combination of TG and HDL-C, which is the TG/HDL-C ratio, could therefore overcome the problem and has been proposed as a more practical atherogenic and insulin resistance marker (6, 7). It has attracted increasing attention for the better predictive value for CVD (6, 8) and disease prognosis such as peritoneal dialysis (7), coronavirus disease 2019 (9), type 2 diabetes (10), and CKD (11). However, whether the TG/HDL-C ratio could be another predictor of IgAN progression remains unknown. To clarify these issues, we conducted this study.
Materials and Methods
Patients
A total of 1449 patients from West China Hospital of Sichuan University between 2008 and 2018 were initially enrolled. patients with systemic disease, such as systemic lupus erythematosus, diabetes, Henoch-Schönlein purpura, liver cirrhosis or disorder of liver function, malignancy, etc., and without complete clinical and pathologic data were excluded in this study. Patients were followed up for at least 12 months or until study-defined endpoints were reached. Finally, 1146 adult biopsy-proven IgAN patients (age > 14 years) were enrolled. The research was in compliance with the Declaration of Helsinki and was approved by the ethical committees of West China Hospital of Sichuan University (2019-33). Informed consent was obtained from each patient or their legal guardians prior to treatment.
Clinical Data
Patient information, including age, sex, clinical manifestations, laboratory indexes, renal pathology reports, and treatment strategies, systolic/diastolic blood pressure (SBP/DBP), body mass index (BMI) was obtained from electronic medical records. Laboratory values included 24-h proteinuria (UPRO), hematuria level (URBC), hemoglobin (Hb), serum albumin (ALB), serum creatinine (Cr), estimated glomerular filtration rate (eGFR), uric acid (UA), triglycerides (TG), total cholesterol (TC), and high-density lipoprotein cholesterol (HDL-C). The TG/HDL-C ratio was obtained by dividing the serum triglyceride level by the plasma high-density lipoprotein cholesterol level. Anemia, hypertension and hyperuricaemia was defined as described previously (12, 13). eGFR was calculated using the CKD-EPI equation (14). Renal biopsy samples were evaluated by an experienced pathologist and a nephrologist according to the Oxford classification (15)
Treatments
All patients received optimal support treatment, including a full dose of angiotensin-converting-enzyme inhibitor (ACEI) or angiotensin receptor blockers (ARBs). Glucocorticoids and immunosuppressant therapy included cyclophosphamide (2 mg/kg daily for 3 months), mycophenolate mofetil (1-2 g daily for 6-8 months), tacrolimus (0.03-0.05 mg/kg daily for 6-8 months) or cyclosporin was used based on pathological classification and clinical severity according to the guidelines.
Outcome Definition
The renal outcome was progression to ESRD, defined by commencement of renal replacement therapy or an eGFR <15 mL/min/1.73 m2.
Statistical Analysis
Continuous variables are expressed as the means ± SDs or medians (interquartile ranges). Categorical variables were expressed as numbers and percentages (%). Student’s t test or the Mann–Whitney U test was used for continuous variables, and the χ2 test was used for categorical variables. The optimal thresholds of the TG/HDL ratio were obtained according to the highest Youden’s index using receiver operating curve (ROC) analyses. Kidney survival in each group was estimated by the Kaplan–Meier method. Univariate and multivariate Cox proportional hazard models were used to evaluate renal progression of IgAN. Three statistical models were used in analysis: model 1 (demographics + pathological features + TG/HDL-C), model 2 (demographics + clinical features +TG/HDL-C) and model 3 (demographics + clinical+ pathological features +TG/HDL-C). All the data were analysed by the software package SPSS 23.0 software package (SPSS, Chicago, IL, USA) and GraphPad Prism 8.0. Two-tailed P<0.05 was considered statistically significant.
Results
Demographic and Clinicopathological Characteristics
A total of 1146 biopsy-proven IgA nephropathy patients from West China Hospital of Sichuan University were finally enrolled in this retrospective study (Figure 1). The demographic, clinical, and pathologic characteristics of the included patients are shown in Table 1. The median age of the patients was 33 (26-42) years, and 44.5% were men. The median follow-up period was 54.1(35.6-73.2) months. ROC analysis revealed that the optimal cut-off TG/HDL-C ratio with which to predict the progression of ESRD in patients with IgAN was 1.495 (Supplementary Figure 1). Thus, according to their TG/HDL-C ratio at the time of renal biopsy, patients were divided into two groups: a high TG/HDL-C group (TG/HDL ≥ 1.495, N=382) and a low TG/HDL group (TG/HDL-C < 1.495, N=764). The median eGFR in the high TG/HDL-C and low TG/HDL-C groups was 9100.0 and 81.5 mL/min/1.73 m2, respectively. Interestingly, higher SBP, DBP and BMI levels were shown in the high TG/HDL-C group. Compared with the low TG/HDL-C group, patients in the high TG/HDL-C group had a higher incidence of anemia, hyperuricemia and hypertension (all P <0.001), a higher proportion of males (P <0.001), and worse renal function (P<0.001). Moreover, higher levels of TG (P<0.001), TC (P=0.003), UPRO (P<0.001), and Cr (P<0.001) and lower HDL-C (P<0.001) and URBC (P=0.009) levels were observed in the high TG/HDL-C group. Regarding pathological lesions, patients with a high TG/HDL-C always had mesangial hypercellularity (P=0.06), segmental glomerulosclerosis (P=0.053) and tubular atrophy/interstitial fibrosis (P=0.002).
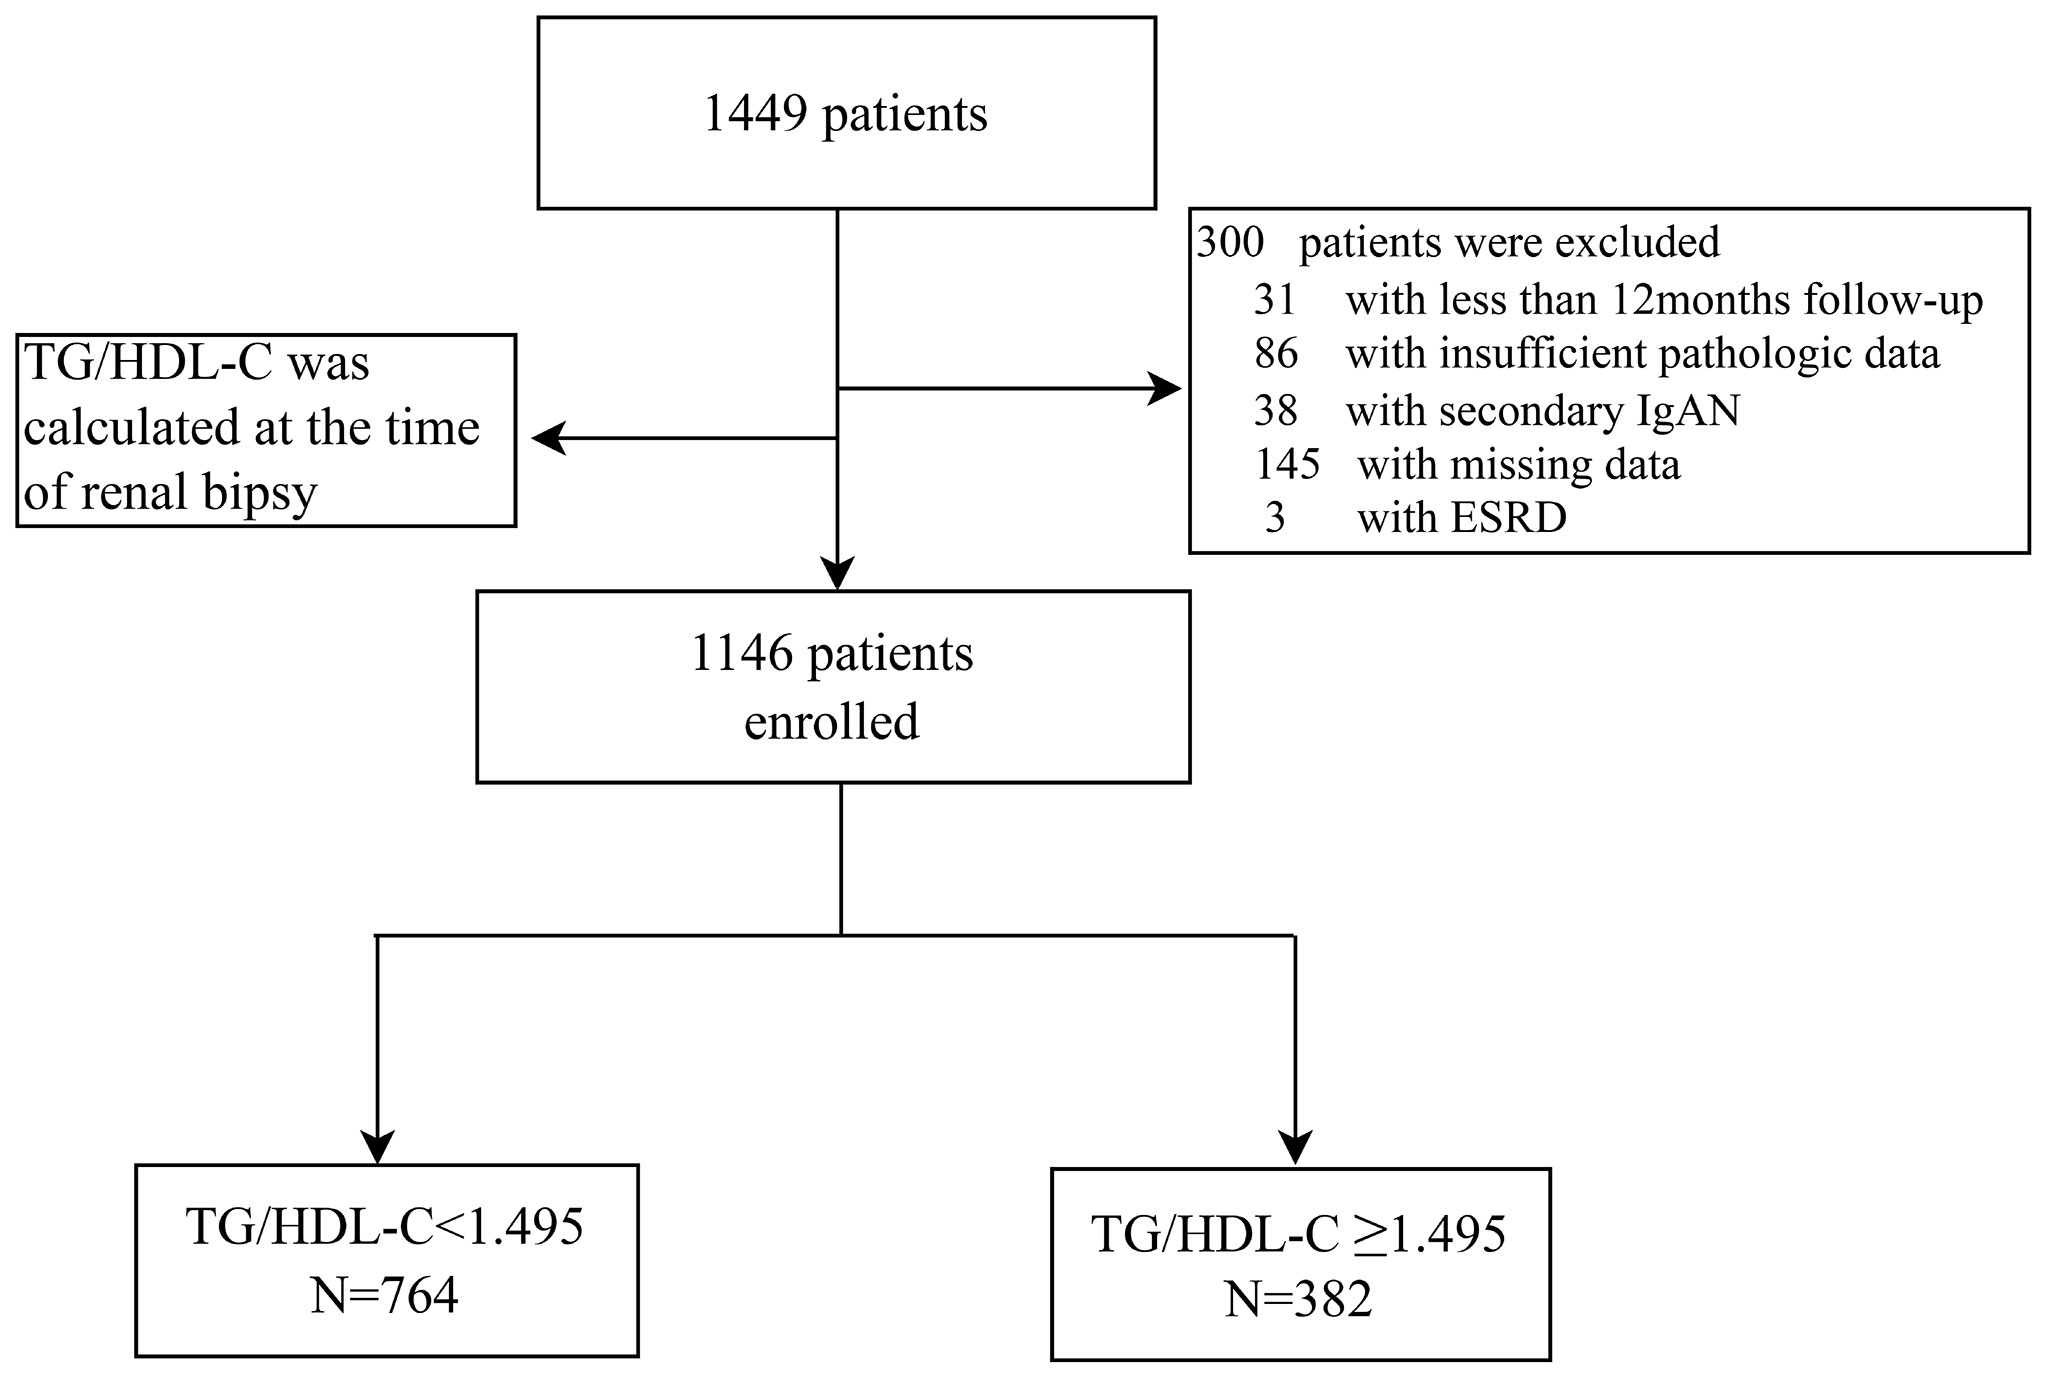
Figure 1 Flow diagram.
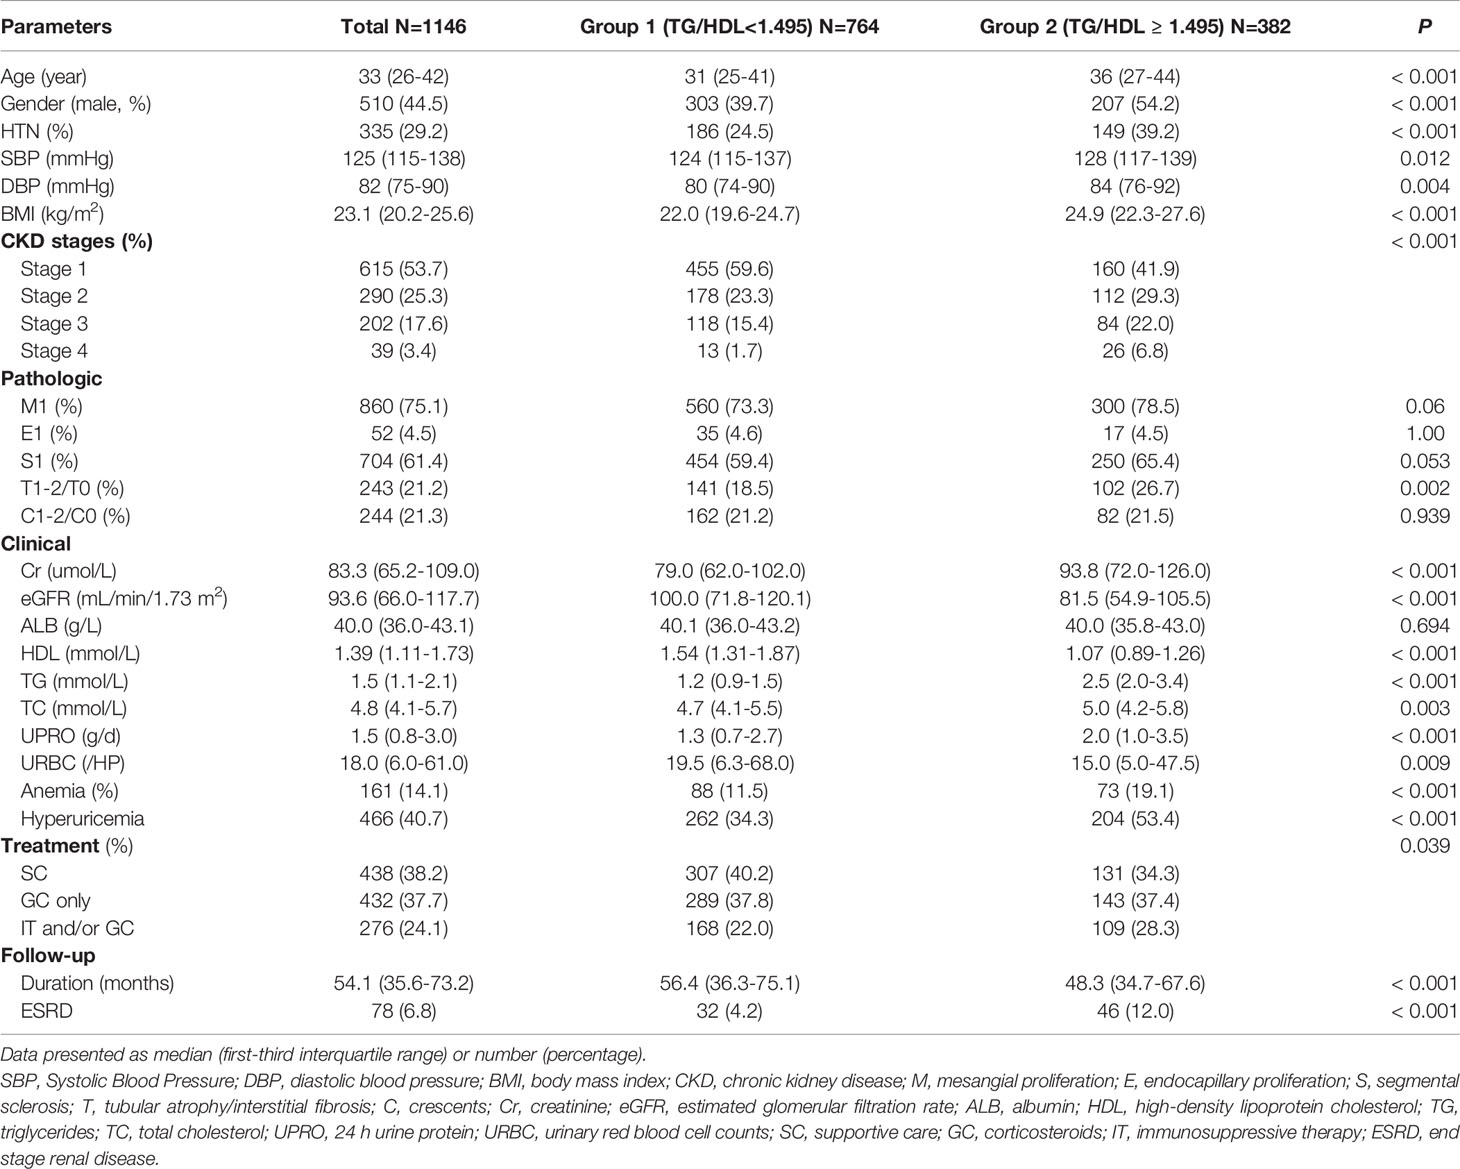
Table 1 Demographic and clinicopathological characteristics of 1146 IgAN patients.
Correlation of the TG/HDL-C Ratio With Clinical Parameters and Pathological Lesions
The correlations between the TG/HDL-C levels and clinicopathological findings are illustrated in Tables 2, 3. Our results showed that TG/HDL-C was significantly negatively correlated with the eGFR (r = -0.250, P < 0.001) but positively correlated with proteinuria (r = 0.230, P < 0.001), BMI (r=0.380, P < 0.001) and serum uric (r =0.308, P< 0.001). Logistic regression analysis was conducted to analyse the relationship between TG/HDL and clinicopathologic features. The high TG/HDL-C group IgAN patients were more likely to have hypertension [odds ratio (OR), 1.987; 95% CI, 1.527-2.587; P<0.001] and pathologic lesions with tubular atrophy/interstitial fibrosis (OR, 1.610; 95% CI, 1.203-2.154; P<0.001) and segmental sclerosis (OR, 1.293; 95% CI, 1.002-1.670; P=0.049)
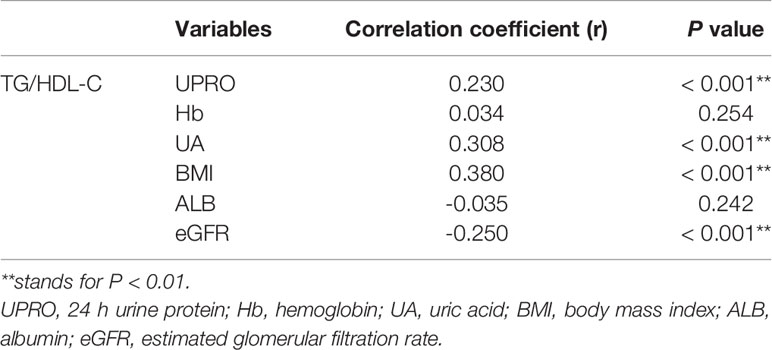
Table 2 Correlation between related variables and TG/HDL-C.
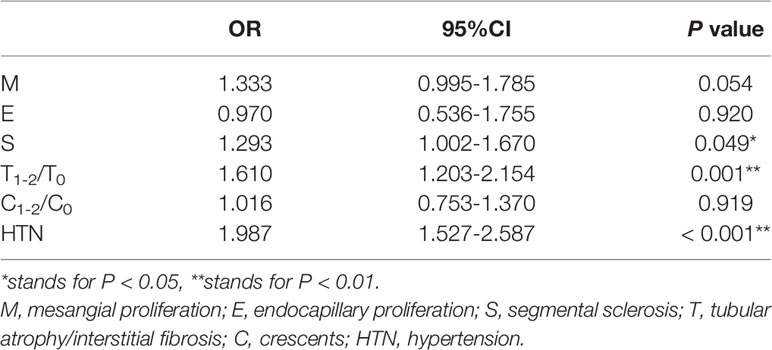
Table 3 Logistics regression models for the relationship between TG/HDL-C and kidney pathologic lesion.
Renal Survival
During a median follow-up period of 54.1 (35.6-73.2) months, a total of 78 (6.8%) patients developed ESRD. For renal survival, our results reveal that TG/HDL-C ≥1.495 was significantly associated with ESRD (Figure 2, P < 0.001). Subgroup analysis of mesangial hypercellularity and tubular atrophy/interstitial fibrosis, CKD stages and proteinuria for ESRD by Kaplan–Meier analysis is shown in Figure 3. Our results indicated that a high TG/HDL-C ratio was a risk factor for ESRD in patients with IgAN, especially patients with eGFR<60 mL/min/1.73 m2 (P<0.001) (Figures 3A–C), 24-hour urine protein ≥1 g/day (P< 0.001) (Figure 3D), or mesangial hypercellularity and tubular atrophy/interstitial fibrosis (Figures 3E, F) in pathologic lesions.
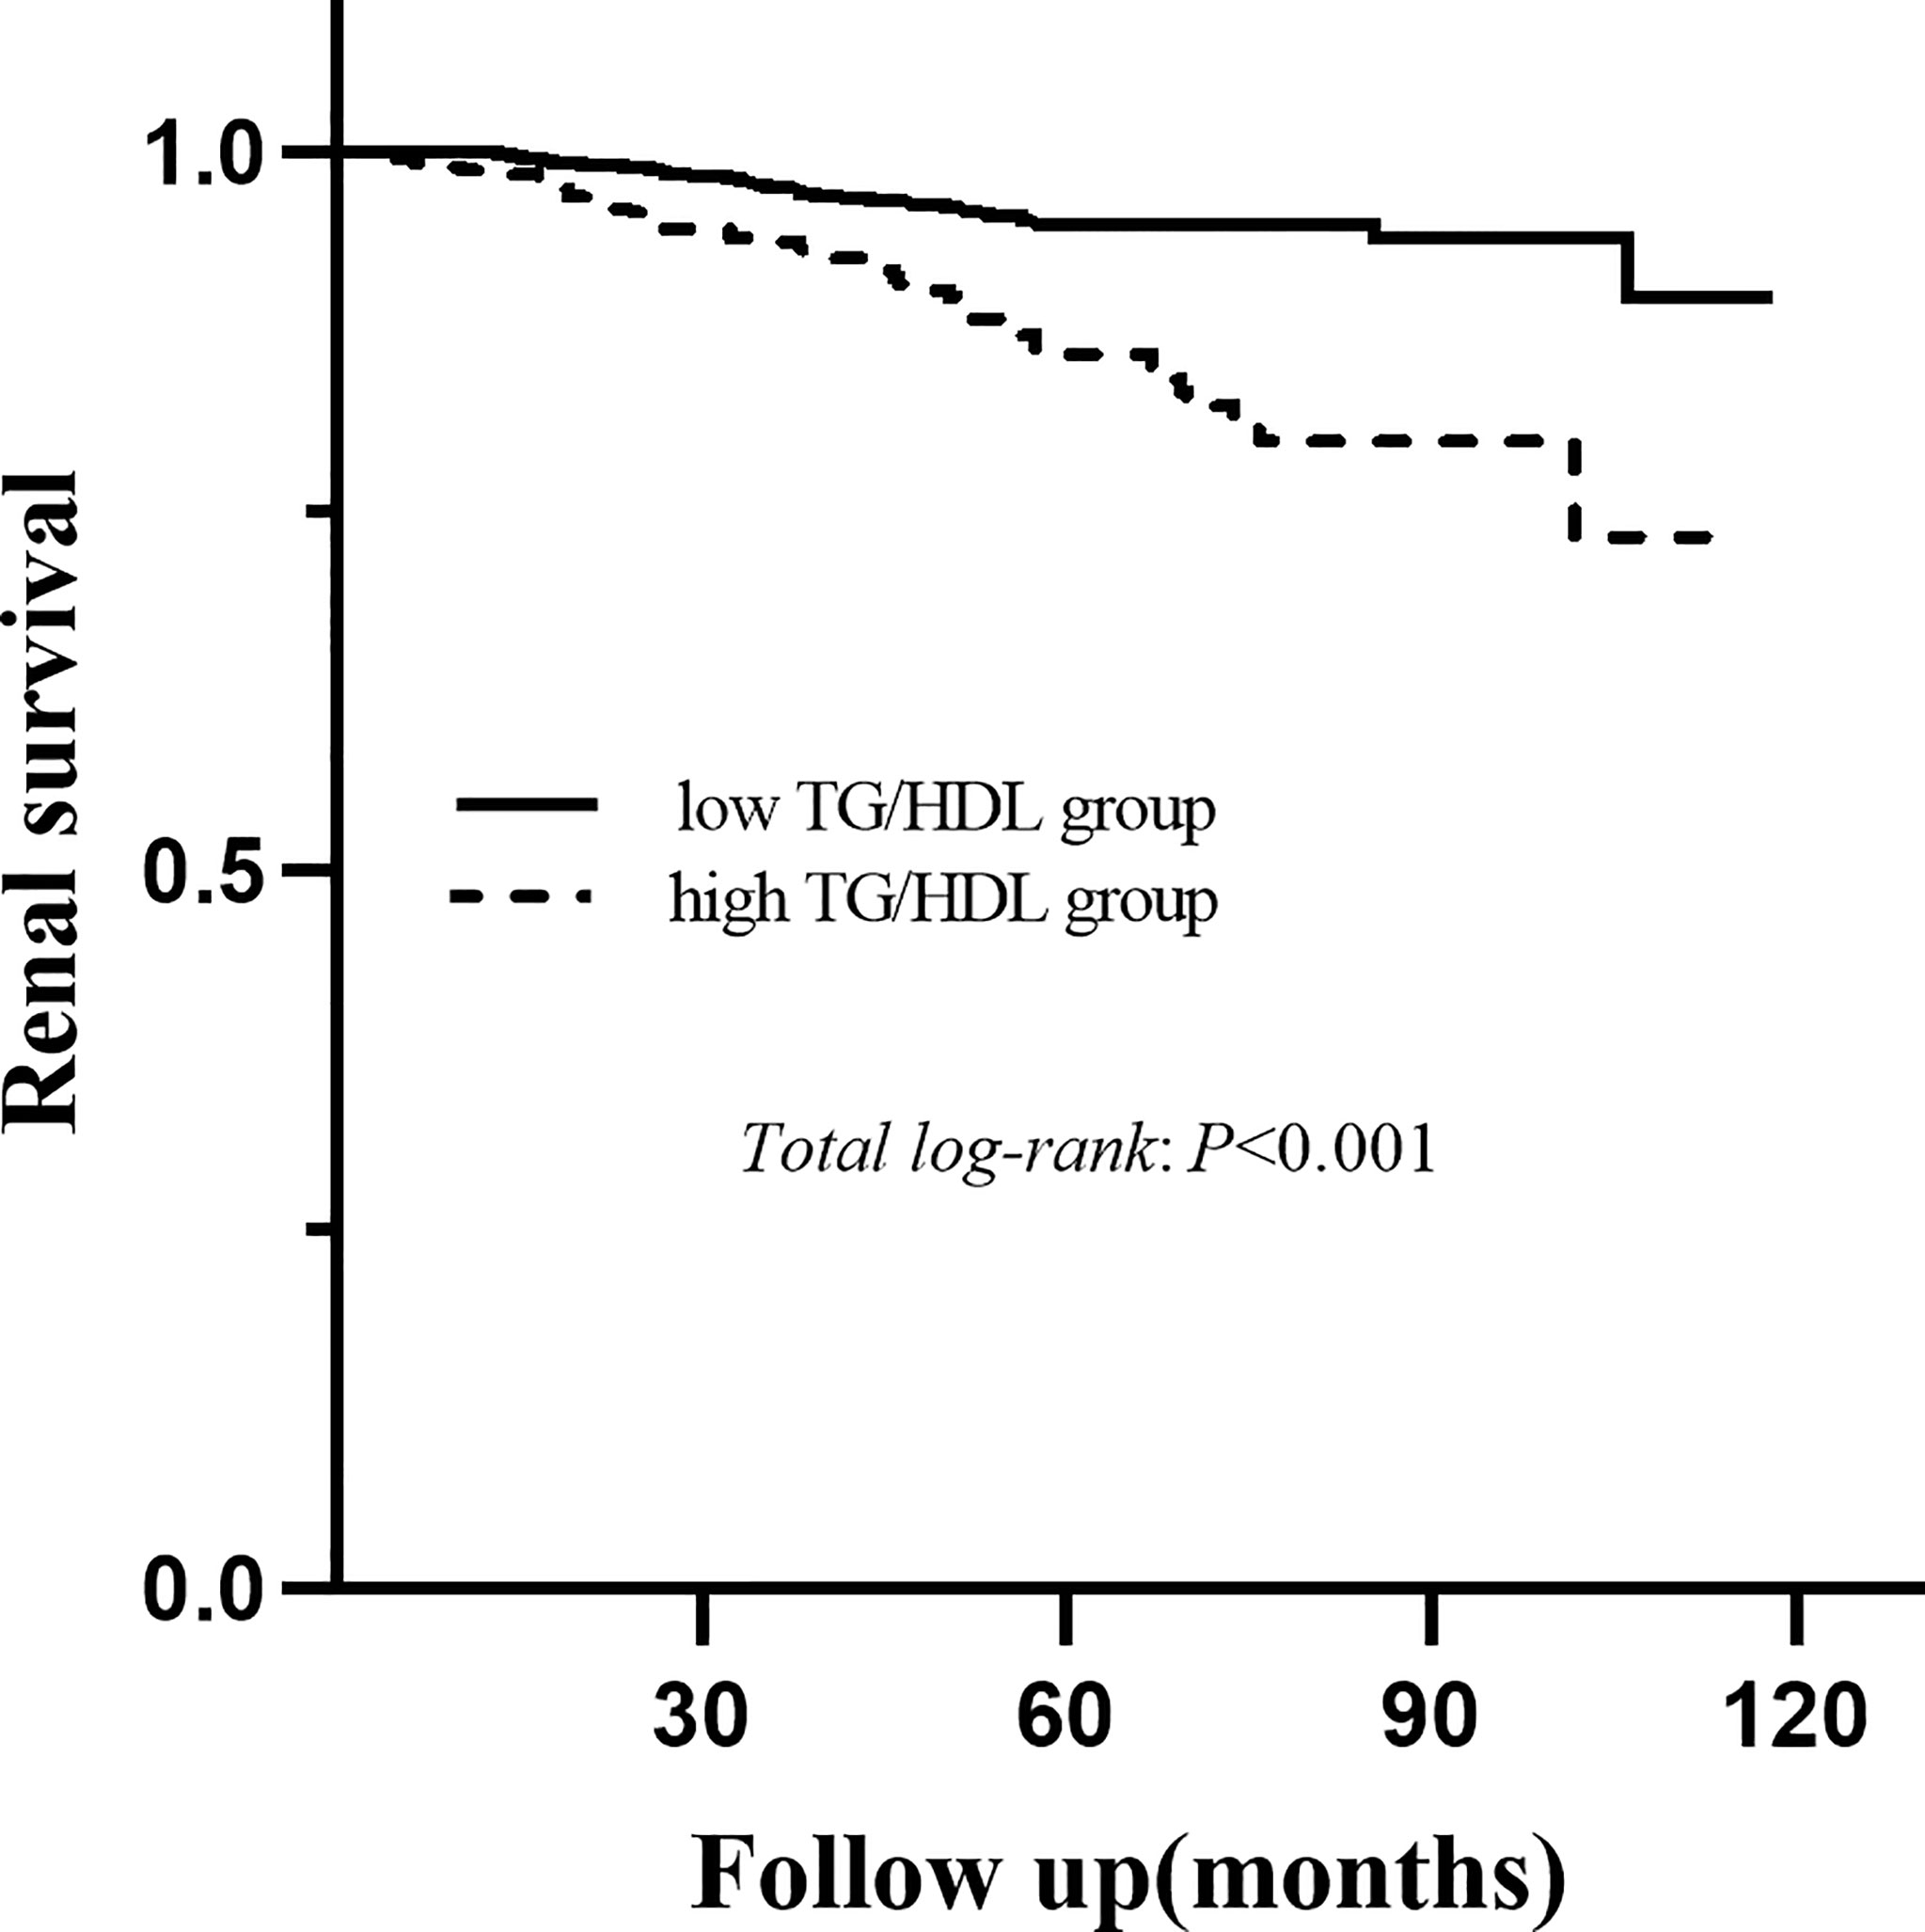
Figure 2 Kaplan-Meier analysis for the endpoint of ESRD stratified by the cutoff point of the TG/HDL-C.
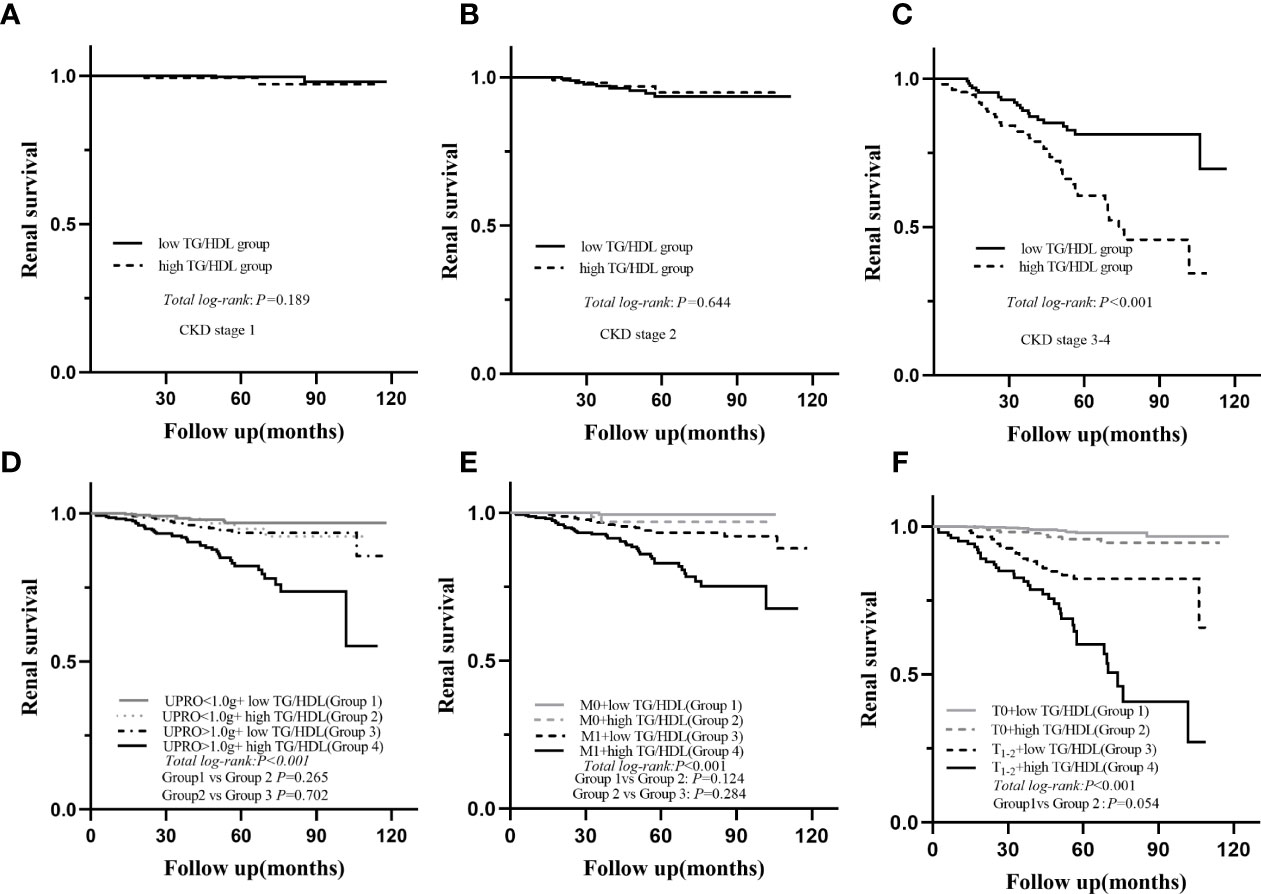
Figure 3 Subgroup Kaplan-Meier analysis for endpoint of ESRD; eGFR (A–C), UPRO (D), M (E), T (F); eGFR, estimated glomerular filtration rate; UPRO, 24 h urine protein; M, mesangial proliferation; T, tubular atrophy/interstitial fibrosis.
TG/HDL-C as an Independent Risk Factor for Progression of IgAN to ESRD
We performed Cox regression analyses to evaluate risk factors for ESRD in patients with IgAN, which showed that a high TG/HDL-C ratio was significantly associated with a higher risk of ESRD (HR=3.290, 95% CI: 2.093-5.173, P<0.001) in univariate analysis. Then, three models were used for multivariate Cox regression (Table 4 and Supplementary Tables 1, 2), which indicated that high TG/HDL-C was an independent risk factor of renal endpoints (model 1: HR 4.158, 95% CI 1.970-8.775, P<0.001; model 2: HR 3.944, 95% CI 1.825-8.523, P<0.001; model 3: HR 1.775, 95% CI 1.056-2.798, P=0.029). Moreover, when stratified by the quartiles of baseline level of TG/HDL-C as Q1, Q2, Q3 and Q4 group (Supplementary Figure 2), significant difference were also shown between Q4 (highest quartiles) and other groups (Q1, Q2, and Q3)
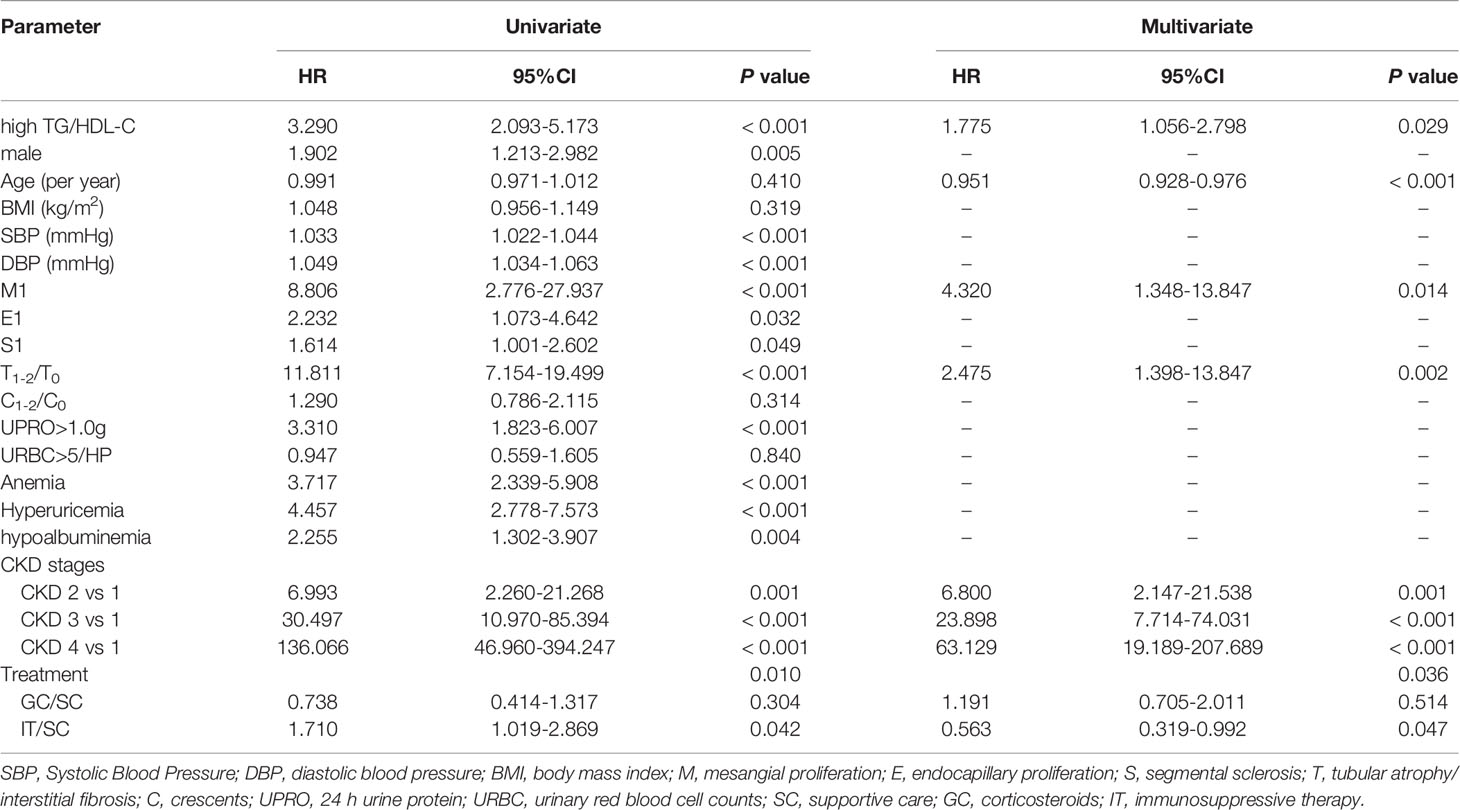
Table 4 Analysis of factors associated with renal outcomes in model 3 (demographics+ clinical indicators+ pathological features+ TG/HDL-C).
Discussion
Dyslipidemia is common in China, with a prevalence of 41.9 %, and is commonly characterized by the presence of high TG and low HDL-C in CKD (16). Recently, the combination of TG and HDL-C, the TG/HDL-C ratio, has attracted increasing attention for its better predictive power for cardiovascular events and insulin resistance than the lonely combination (17, 18). Noticeably, several studies have shown a positively relationship between the TG/HDL-C ratio and renal function decline in CKD patients (16, 18–20). However, whether TG/HDL-C has a role in IgAN progression remains unknown.
In this study, 78 (6.8%) patients developed ESRD in our 1146 biopsy-proven IgAN patients. A higher TG/HDL-C ratio in patients with IgAN was associated with more severe clinical features and pathologic lesions. Our further analysis revealed a higher serum TG/HDL-C level was an independent risk factor for the progression to ESRD (HR 1.775, 95% CI 1.056-2.798, P=0.029).
Previous studies have reported that the reduction in renal function in patients is related to high TG/HDL-C levels (11, 16), but no study has focused on IgAN patients. To our knowledge, this is the first study assessing the correlation between the TG/HDL-C ratio and ESRD in IgAN patients. Moreover, the TG/HDL-C ratio has a greater influence in advanced IgAN patients (eGFR< 60 mL/min/1.73 m2) or these with 24-hour urine protein of ≥1 g/day in our study. This might be due to the slow progression of mild renal disease, especially within a limited follow-up period (12).
Here, higher SBP, DBP and BMI levels were shown in the high TG/HDL-C group. Further analysis showed TG/HDL was positively correlated with BMI (r=0.380, P < 0.001). In our multivariate Cox regression analyses, BMI was not independent risk factor for renal progression. It is well known obesity often result in excessive accumulation of energy, accompanied by abnormalities in lipid parameter levels. Some studies showed it was associated with the early development of hypertension and CKD progression (21). However, emerging epidemiologic evidence indicated that obesity was not a direct and independent risk factor for IgAN (22). It was possible that high BMI indirectly accelerated the progression of IgAN by inducing metabolic syndrome on patients, in which TG/HDL-C is strongly associated with it (23). Additionally, we would like to stress that high TG/HDL-C patients tend to have hypertension and more severe renal pathologic lesions of segmental glomerulosclerosis and tubular atrophy/interstitial fibrosis. Considering that abnormalities in lipid parameter levels could accelerated atherosclerosis is plausible to believe that pathology of IgAN patients with a high TG/HDL-C level.
Abnormalities in lipid parameter levels could lead to impaired renal function and accelerated atherosclerosis (2). TG usually increases in the early stages of CKD and is associated with delayed catabolism and decreased activity of hepatic TG lipase and peripheral lipoprotein lipase. However, based on feeding status, TG levels could fluctuate substantially, thus limiting its utility as a predictive biomarker (4). HDL-C, inversely associated with outcomes, decreases in patients with CKD (11). The combination of these two markers could therefore overcome this problem and lead to a far more consistent, stable, fasting measurement of dyslipidaemia, which has indeed attracted much more attention in disease prognosis, including cardiovascular disease (6), diabetes (10), and peritoneal dialysis (7). Here, the potential mechanisms by which the TG/HDL-C ratio serves as a prognostic biomarker in IgAN patients may be as follows. TG/HDL-C is a reliable indicator of insulin resistance, which induces oxidative stress. Oxidative stress impairs the activation of nuclear factor erythroid-2-related factor-2, which protects against kidney tissue injury (16). The filtered proteins, such as fatty acids, phospholipids, and cholesterol contained in the filtered proteins (albumin and lipoproteins), could include direct toxic effects of lipids on glomerular cells and promote matrix production (3, 24). Moreover, these materials act as damage-associated molecular patterns (DAMPs) and are recognized by Toll-like receptors (TLR2 and TLR4), which can activate inflammatory responses, causing tubulointerstitial fibrosis and injury in the reabsorption process (25, 26). Additionally, further tissue injury is contributed owing to impaired HDL-mediated reverse cholesterol transport by limiting the unloading of the excess cellular cholesterol and phospholipid burden (25). Thus, in the future, recognizing the TG/HDL-C ratio as a potentially modifiable risk factor for patients may allow the utilization of preventative strategies to optimize both treatment and survival outcomes.
Some limitations warrant consideration. First, this was a retrospective study based on a single-center database. Second, the median follow-up time of 54 months was relatively short. Further multicenter validation in different ethnic populations with longer follow-ups was needed.
Conclusion
The TG/HDL-C ratio may be considered as a prognostic biomarker in IgAN patients.
Data Availability Statement
The raw data supporting the conclusions of this article will be made available by the authors, without undue reservation.
Ethics Statement
The studies involving human participants were reviewed and approved by the ethical committees of West China Hospital of Sichuan University (2019-33). The patients/participants provided their written informed consent to participate in this study.
Author Contributions
GP, AQ, SW, LD, XL, and DY collected and analysed the data. GP and AQ wrote the main manuscript text. YT, XZ and JT reviewed and edited the manuscript. WQ supervised all the work and revised the manuscript. All authors contributed to the article and approved the submitted version.
Funding
This study is partly supported by the National Key R&D Program of China (2020YFC2006503) &(2020YFC2006500).
Conflict of Interest
The authors declare that the research was conducted in the absence of any commercial or financial relationships that could be construed as a potential conflict of interest.
Publisher’s Note
All claims expressed in this article are solely those of the authors and do not necessarily represent those of their affiliated organizations, or those of the publisher, the editors and the reviewers. Any product that may be evaluated in this article, or claim that may be made by its manufacturer, is not guaranteed or endorsed by the publisher.
Acknowledgments
We are indebted to all the people who kindly participated in this study.
Supplementary Material
The Supplementary Material for this article can be found online at: https://www.frontiersin.org/articles/10.3389/fendo.2022.877794/full#supplementary-material
Supplementary Figure 1 | ROC curves (AUC) of TG/HDL-C for prediction of ESRD.
Supplementary Figure 2 | Kaplan-Meier analysis for the endpoint of ESRD stratified by quartile: Q1, first quartile; Q2, median; Q3, third quartile, Q4, fourth quartile.
References
1. Rodrigues JC, Haas M, Reich HN. IgA Nephropathy. Clin J Am Soc Nephrol (2017) 12:677–86. doi: 10.2215/cjn.07420716
2. Florens N, Calzada C, Lyasko E, Juillard L, Soulage CO. Modified Lipids and Lipoproteins in Chronic Kidney Disease: A New Class of Uremic Toxins. Toxins (Basel) (2016) 8:376. doi: 10.3390/toxins8120376
3. Raikou VD, Kyriaki D, Gavriil S. Triglycerides to High-Density Lipoprotein Cholesterol Ratio Predicts Chronic Renal Disease in Patients Without Diabetes Mellitus (STELLA Study). J Cardiovasc Dev Dis (2020) 7:28. doi: 10.3390/jcdd7030028
4. Anderson JLC, Bakker SJL, Tietge UJF. The Triglyceride to HDL-Cholesterol Ratio and Chronic Graft Failure in Renal Transplantation. J Clin Lipidol (2021) 15:301–10. doi: 10.1016/j.jacl.2021.01.009
5. Vaziri ND. HDL Abnormalities in Nephrotic Syndrome and Chronic Kidney Disease. Nat Rev Nephrol (2016) 12:37–47. doi: 10.1038/nrneph.2015.180
6. Reiner Ž. Hypertriglyceridaemia and Risk of Coronary Artery Disease. Nat Rev Cardiol (2017) 14:401–11. doi: 10.1038/nrcardio.2017.31
7. Xia W, Yao X, Chen Y, Lin J, Vielhauer V, Hu H. Elevated TG/HDL-C and non-HDL-C/HDL-C Ratios Predict Mortality in Peritoneal Dialysis Patients. BMC Nephrol (2020) 21:324. doi: 10.1186/s12882-020-01993-5
8. Sultani R, Tong DC, Peverelle M, Lee YS, Baradi A, Wilson AM. Elevated Triglycerides to High-Density Lipoprotein Cholesterol (TG/HDL-C) Ratio Predicts Long-Term Mortality in High-Risk Patients. Heart Lung Circ (2020) 29:414–21. doi: 10.1016/j.hlc.2019.03.019
9. Alcántara-Alonso E, Molinar-Ramos F, González-López JA, Alcántara-Alonso V, Muñoz-Pérez MA, Lozano-Nuevo JJ, et al. High Triglyceride to HDL-Cholesterol Ratio as a Biochemical Marker of Severe Outcomes in COVID-19 Patients. Clin Nutr ESPEN (2021) 44:437–44. doi: 10.1016/j.clnesp.2021.04.020
10. Orsi E, Penno G, Solini A, Bonora E, Fondelli C, Trevisan R, et al. Independent Association of Atherogenic Dyslipidaemia With All-Cause Mortality in Individuals With Type 2 Diabetes and Modifying Effect of Gender: A Prospective Cohort Study. Cardiovasc Diabetol (2021) 20:28. doi: 10.1186/s12933-021-01224-7
11. Kim Y, Lee S, Lee Y, Kang MW, Park S, Park S, et al. Predictive Value of Triglyceride/High-Density Lipoprotein Cholesterol for Major Clinical Outcomes in Advanced Chronic Kidney Disease: A Nationwide Population-Based Study. Clin Kidney J (2021) 14:1961–68. doi: 10.1093/ckj/sfaa252
12. Wang S, Dong L, Pei G, Jiang Z, Qin A, Tan J, et al. High Neutrophil-To-Lymphocyte Ratio Is an Independent Risk Factor for End Stage Renal Diseases in IgA Nephropathy. Front Immunol (2021) 12:700224. doi: 10.3389/fimmu.2021.700224
13. Al-Makki A, DiPette D, Whelton PK, Murad MH, Mustafa RA, Acharya S, et al. Hypertension Pharmacological Treatment in Adults: A World Health Organization Guideline Executive Summary. Hypertension (2022) 79:293–301. doi: 10.1161/hypertensionaha.121.18192
14. Stevens LA, Claybon MA, Schmid CH, Chen J, Horio M, Imai E, et al. Evaluation of the Chronic Kidney Disease Epidemiology Collaboration Equation for Estimating the Glomerular Filtration Rate in Multiple Ethnicities. Kidney Int (2011) 79:555–62. doi: 10.1038/ki.2010.462
15. Trimarchi H, Barratt J, Cattran DC, Cook HT, Coppo R, Haas M, et al. Oxford Classification of IgA Nephropathy 2016: An Update From the IgA Nephropathy Classification Working Group. Kidney Int (2017) 91:1014–21. doi: 10.1016/j.kint.2017.02.003
16. Lv S, Zhang H, Chen J, Shen Z, Zhu C, Gu Y, et al. The Effect of Triglycerides to High-Density Lipoprotein Cholesterol Ratio on the Reduction of Renal Function: Findings From China Health and Retirement Longitudinal Study (CHARLS). Lipids Health Dis (2021) 20:110. doi: 10.1186/s12944-021-01542-5
17. Yu L, Zhou L, Zhou D, Hu G. Nonlinear Relationship Between Triglyceride/High-Density Lipoprotein Cholesterol Ratio and Chronic Kidney Disease in US Adults: A National Health and Nutrition Examination Survey Investigation. Int Urol Nephrol (2019) 51:2005–14. doi: 10.1007/s11255-019-02287-y
18. Wang X, Chen H, Shao X, Xiong C, Hong G, Chen J, et al. Association of Lipid Parameters With the Risk of Chronic Kidney Disease: A Longitudinal Study Based on Populations in Southern China. Diabetes Metab Syndr Obes (2020) 13:663–70. doi: 10.2147/dmso.S229362
19. Ho CI, Chen JY, Chen SY, Tsai YW, Weng YM, Tsao YC, et al. Relationship Between TG/HDL-C Ratio and Metabolic Syndrome Risk Factors With Chronic Kidney Disease in Healthy Adult Population. Clin Nutr (2015) 34:874–80. doi: 10.1016/j.clnu.2014.09.007
20. Tsuruya K, Yoshida H, Nagata M, Kitazono T, Iseki K, Iseki C, et al. Impact of the Triglycerides to High-Density Lipoprotein Cholesterol Ratio on the Incidence and Progression of CKD: A Longitudinal Study in a Large Japanese Population. Am J Kidney Dis (2015) 66:972–83. doi: 10.1053/j.ajkd.2015.05.011
21. Berthoux F, Mariat C, Maillard N. Overweight/obesity Revisited as a Predictive Risk Factor in Primary IgA Nephropathy. Nephrol Dial Transplant (2013) 28(Suppl 4):iv160–6. doi: 10.1093/ndt/gft286
22. Wu C, Wang AY, Li G, Wang L. Association of High Body Mass Index With Development of Interstitial Fibrosis in Patients With IgA Nephropathy. BMC Nephrol (2018) 19:381. doi: 10.1186/s12882-018-1164-2
23. Panwar B, Hanks LJ, Tanner RM, Muntner P, Kramer H, McClellan WM, et al. Obesity, Metabolic Health, and the Risk of End-Stage Renal Disease. Kidney Int (2015) 87:1216–22. doi: 10.1038/ki.2014.384
24. Sieber J, Lindenmeyer MT, Kampe K, Campbell KN, Cohen CD, Hopfer H, et al. Regulation of Podocyte Survival and Endoplasmic Reticulum Stress by Fatty Acids. Am J Physiol Renal Physiol (2010) 299:F821–9. doi: 10.1152/ajprenal.00196.2010
25. Vaziri ND. Dyslipidemia of Chronic Renal Failure: The Nature, Mechanisms, and Potential Consequences. Am J Physiol Renal Physiol (2006) 290:F262–72. doi: 10.1152/ajprenal.00099.2005
Keywords: triglyceride, high-density lipoprotein cholesterol, IgA nephropathy, prognosis, TG/HDL-C ratio
Citation: Pei G, Qin A, Dong L, Wang S, Liu X, Yang D, Tan J, Zhou X, Tang Y and Qin W (2022) Prognostic Value of Triglyceride to High-Density Lipoprotein Cholesterol Ratio (TG/HDL-C) in IgA Nephropathy Patients. Front. Endocrinol. 13:877794. doi: 10.3389/fendo.2022.877794
Received: 17 February 2022; Accepted: 17 May 2022;
Published: 20 June 2022.
Edited by:
Nehal Mohsen Elsherbiny, Mansoura University, EgyptReviewed by:
Elena Rampanelli, Amsterdam University Medical Center, NetherlandsEnrique Rodilla, Hospital de Sagunto, Spain
Copyright © 2022 Pei, Qin, Dong, Wang, Liu, Yang, Tan, Zhou, Tang and Qin. This is an open-access article distributed under the terms of the Creative Commons Attribution License (CC BY). The use, distribution or reproduction in other forums is permitted, provided the original author(s) and the copyright owner(s) are credited and that the original publication in this journal is cited, in accordance with accepted academic practice. No use, distribution or reproduction is permitted which does not comply with these terms.
*Correspondence: Yi Tang, tmka1986@163.com; Wei Qin, qinweihx@scu.edu.cn
†These authors have contributed equally to this work