 Shengqing Hu1,2†
 Lulu Chen1,2
 Tianshu Zeng1,2
 Wenyi Wang1,2Yan Yan1,2Kangli Qiu1,2
 Yajuan Xie1,2Yunfei Liao1,2*
- 1Department of Endocrinology, Union Hospital, Tongji Medical College, Huazhong University of Science and Technology, Wuhan, China
- 2Hubei Provincial Clinical Research Center for Diabetes and Metabolic Disorders, Wuhan, China
Objective: Epigenetics was reported to mediate the effects of environmental risk factors on disease pathogenesis. We intend to unleash the role of DNA methylation modification in the pathological process of cardiovascular diseases in diabetes.
Methods: We screened differentially methylated genes by methylated DNA immunoprecipitation chip (MeDIP-chip) among the enrolled participants. In addition, methylation-specific PCR (MSP) and gene expression validation in peripheral blood of participants were utilized to validate the DNA microarray findings.
Results: Several aberrantly methylated genes have been explored, including phospholipase C beta 1 (PLCB1), cam kinase I delta (CAMK1D), and dopamine receptor D5 (DRD5), which participated in the calcium signaling pathway. Meanwhile, vascular endothelial growth factor B (VEGFB), placental growth factor (PLGF), fatty acid transport protein 3 (FATP3), coagulation factor II, thrombin receptor (F2R), and fatty acid transport protein 4 (FATP4) which participated in vascular endothelial growth factor receptor (VEGFR) signaling pathway were also found. After MSP and gene expression validation in peripheral blood of participants, PLCB1, PLGF, FATP4, and VEGFB were corroborated.
Conclusion: This study revealed that the hypomethylation of VEGFB, PLGF, PLCB1, and FATP4 might be the potential biomarkers. Besides, VEGFR signaling pathway regulated by DNA methylation might play a role in the cardiovascular diseases’ pathogenesis of diabetes.
Introduction
The worldwide incidence of diabetes has increased sharply in recent years (1). It is acknowledged that cardiovascular diseases are the leading cause of morbidity and mortality among diabetic patients (2, 3). Compared to microvascular complications, macrovascular complications including cardiovascular diseases contribute more to mortality in diabetics (4). However, the underlying mechanism of diabetic cardiovascular diseases remains largely unknown. Meanwhile, the present interventions for cardiovascular diseases in diabetic patients show limited effectiveness. Thus, understanding the mechanisms of diabetes-associated cardiovascular diseases are of great importance.
The Diabetes Control and Complications Trial (DCCT) and its follow-up research (Epidemiology of Diabetes Interventions and Complications Study, EDIC) identified a widespread phenomenon known as “metabolic memory”. Several studies have implicated the epigenetic role of hyperglycemia in ‘metabolic memory’ (5–7). It has been demonstrated that hyperglycemia could regulate gene expression by epigenetic modifications, such as DNA methylation, which can persist after glucose normalization (8). Meanwhile, increasing evidence showed that epigenetic modifications might play a critical role in the pathophysiology of diabetes and its related cardiovascular complications (9, 10). Recently, DNA methylation is involved in the pathogenesis of diabetes and microvascular complications (11). However, the role of DNA methylation in macrovascular complications in diabetes remains uncertain. The whole genome was hypomethylation in peripheral blood mononuclear and aortas of 4-week-old ApoE-null mice, a classic atherosclerotic animal model, in which stage that none of histological signs of atherosclerosis appears (12). Furthermore, altered DNA methylation of several candidate genes linked to atherosclerosis was identified in vascular smooth muscle cells (VSMCs), endothelial cells (ECs) and mouse models (13, 14).
Moreover, risk factors for type 2 diabetes, such as obesity and aging, could also affect the methylome in non-diabetic subjects, which might trigger impaired insulin secretion, insulin resistance, and the progression of diabetes (15). As other risk factors for cardiovascular diseases, hyperhomocysteinemia and hypercholesterolemia have also been involved in DNA methylation association with candidate genes involved in atherosclerosis (14, 16, 17). Therefore, elucidating whether epigenetic alterations are involved in the development of diabetic macrovascular diseases would provide a potential therapeutic target for these diseases.
The purpose of this study was to investigate whether DNA methylation exists in diabetic patients with macrovascular complications and to identify the potential circulating biomarkers for early intervention. This study enrolled 154 participants which were divided into three groups: normal control (NC group, n=43), diabetes without cardiovascular diseases (DM group, n=60), and diabetes with cardiovascular diseases (CVD group, n=51). We performed the methylation gene chip based on DNA microarray combined with methylated DNA immunoprecipitation (MeDIP) method, and then compared abnormal DNA methylated genes between patients with or without cardiovascular diseases. Furthermore, we investigated the expressions of aberrantly methylated genesin the serum of these patients.
Materials and methods
Patients and study design
The subjects enrolled in this study were recruited from the endocrinology department of Wuhan Union Hospital from January 2019 to December 2019. This study has been approved by the Institutional Research Ethics Committee of Union Hospital, Huazhong University of Science and Technology. A prior written informed consent was obtained from each participant in this study. The subjects were dividedinto three groups: normal control (NC group, n=43), diabetes without cardiovascular diseases (DM group, n=60), and diabetes with cardiovascular diseases (CVD group, n=51). The inclusion criteria of subjects in the NC group were: no history of diabetes or cardiovascular diseases, normal glucose tolerance in OGTT, normal coronary angiography, no history of carotid artery disease or peripheral arterial disease. Diabetes were diagnosed according to the World Health Organization (WHO, 1999) (18). Data on vital signs, anthropometric factors, medical history and behaviors as well as physical activity were collected. Additional data, including weight, height, BMI, waist circumference, hip circumference, glycemia and glycated hemoglobin were obtained for each individual. Diabetes patients in CVD group were evidenced as follows: ischemic heart disease defined by clinical history, and/or ischemic electrocardiographic alterations; peripheral vascular disease including atherosclerosis obliterans and cerebrovascular disease based on history, physical examinations and Doppler velocimetry.
MeDIP-chip
Genomic DNA (gDNA) was extracted from nine blood samples (3 from NC group, 3 from DM group, and 3 from CVD group) by a DNeasy Blood & Tissue Kit (Qiagen, Fremont, CA). Using Biomag™ magnetic beads that coupled with the mouse monoclonal antibody against 5-methylcytidine, methylated DNA was immunoprecipitated, which was then eluted and purified by QiagenMinElute columns (Qiagen, Fremont, CA). The total input genomic DNA and immunoprecipitated DNA were labeled with Cy3- and Cy5-fluorophere, respectively. They were then hybridized to NimbleGen Human DNA Methylation 3×720K CpG Island Plus RefSeq Promoter Microarray. Scanning was performed with the Axon GenePix 4000B microarray scanner according to the manufacturer’s guidelines detailed in NimbleGen MeDIP-Chip protocol (NimbleGen Systems Inc., Madison, USA). The MeDIP-chip data were submitted to Gene Expression Omnibus (GEO) data repository (http://www.ncbi.nlm.nih.gov/projects/geo/) under accession number GSE188395.
Analysis of MeDIP-chip data
The log2 ratio obtained from raw data values has been normalized to ensure technical invariability and evaluate methylation differences. Median centering, quantile normalization, and linear smoothing were then performed using Bioconductor packages Ringo, Limma and MEDME (19). We then applied a sliding-window (750bp) peak-finding algorithm which was provided by NimbleScan v2.5 (Roche-NimbleGen) to analysis the MeDIP-chip data. Furthermore, to confirm whether the probes drawnwere from a more positive distribution of intensity log2 ratio, a one-sided Kolmogorov-Smirnov (KS) test was applied. Each probe received a -log10 P scores from the windowed KS test around that probe. The region of which adjacent probes significantly rose above a set threshold was assigned to an enrichment peak (EP). The peaks were detected by searching for at least two probes that above a P-value minimum cut-off (-log10) of 2. Peaks that within 500bp of each other are merged.
Functional and pathway enrichment analysis
The Gene Ontology (GO) enrichment and Kyoto Encyclopedia of Genes and Genomes (KEGG) pathway analysis were applied to investigate the potential biological processes and the DNA methylation function (20, 21). The DAVID Functional Annotation Tool (http://david.abcc.ncifcrf.gov/) was adopted for GO enrichment, and KEGG pathway analysis with a 0.05 cut-off for Benjamini adjusted P value (Q-value) (22). According to GO annotation, the differentially methylated genes were divided into cellular component (CC), molecular function (MF), and biological process (BP). The source genes used to analysis are freely available at https://github.com/hsqhaha/2021-10-08.
Methylation-specific PCR
In order to confirm the MeDIP-chip data, MSP was applied to identify the methylation status of specific genes (23). Peripheral blood of the subjects (40 from NC group, 57 from DM group, and 48 from CVD group) were collected. The MSP primers are designed by online MethPrimer software (http://www.urogene.org/methprimer). The sequences and product length of each primer used for MSP analysis were listed in Table 1.
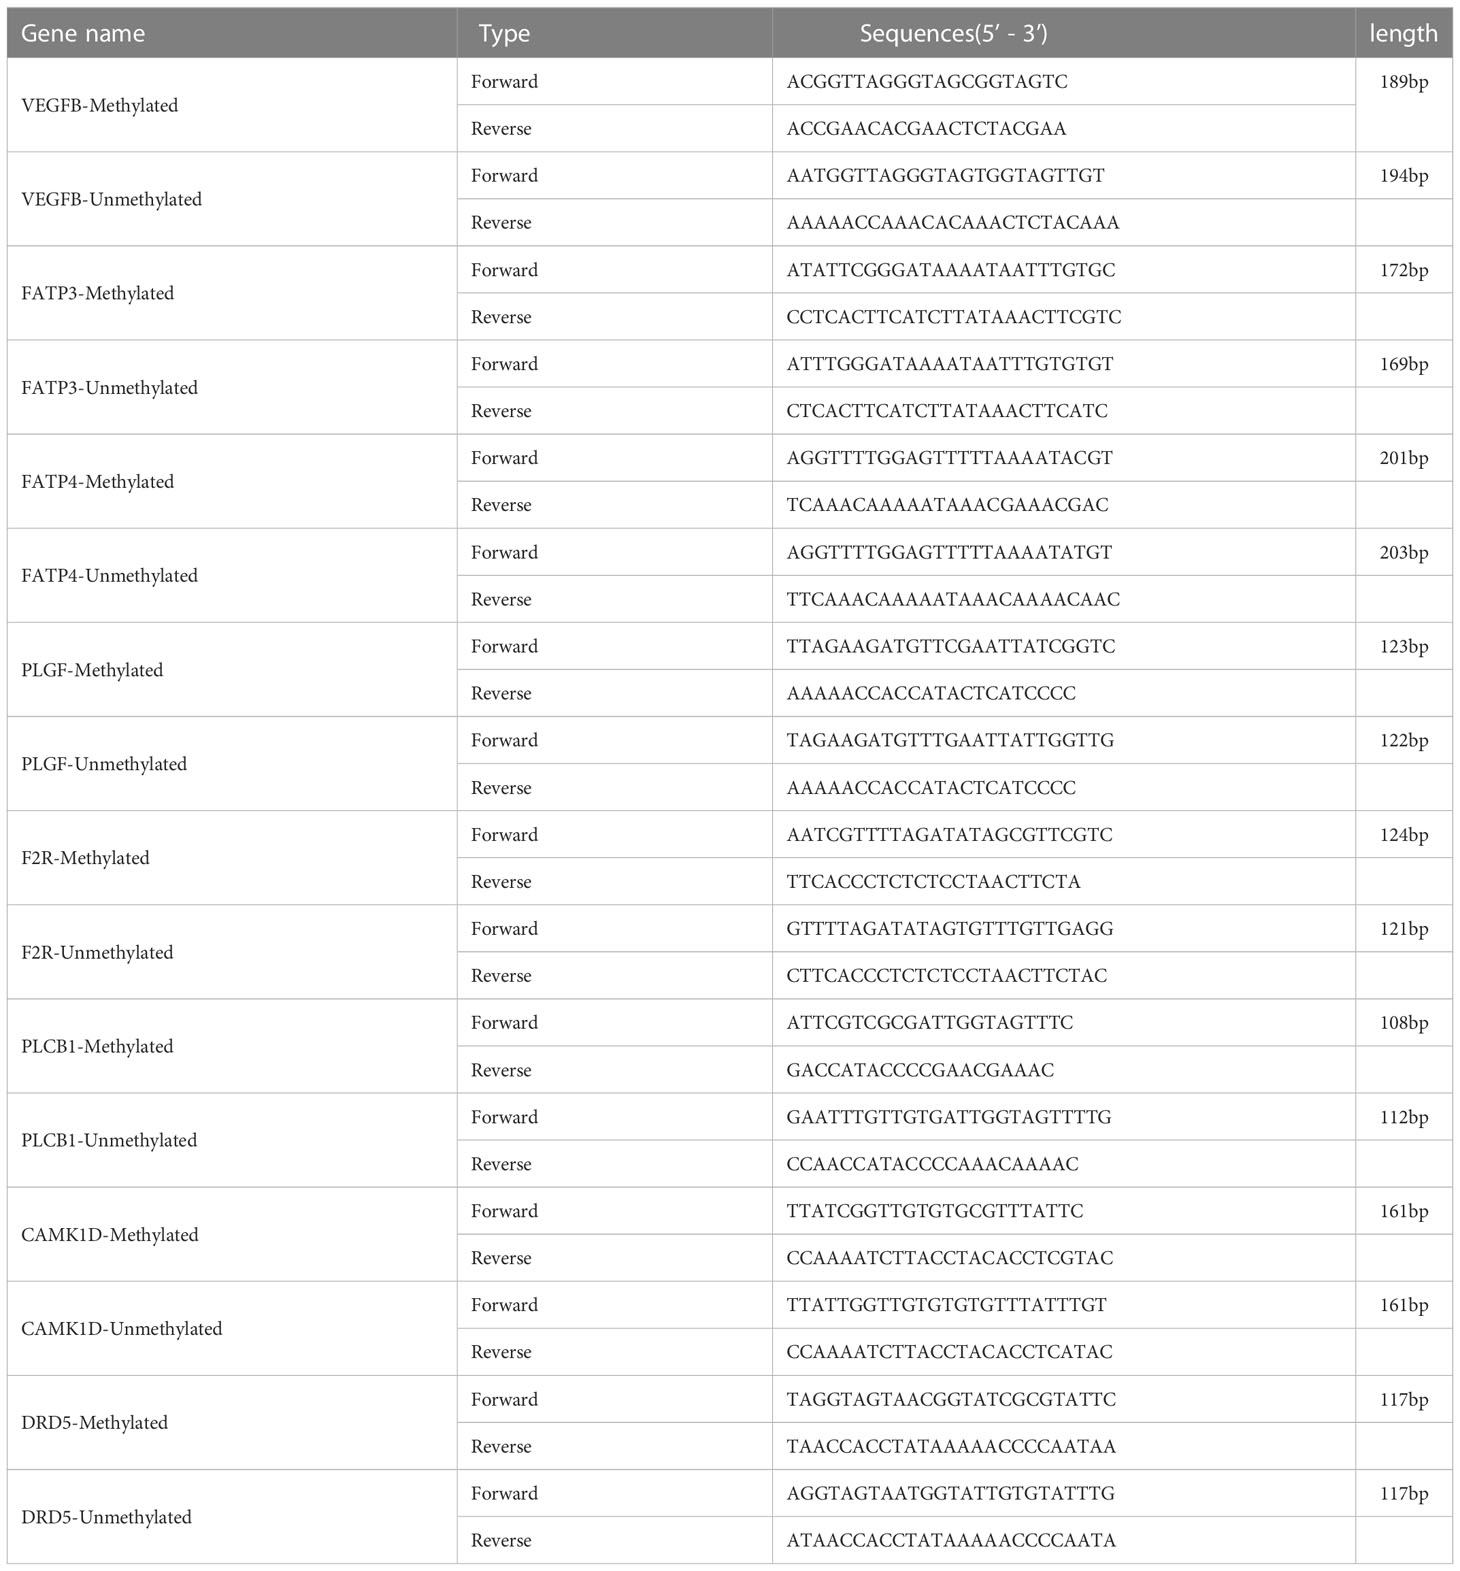
Table 1 Primers of genes for MSP.
Real-time quantitative PCR
qPCR was performed by SYBR Premix Ex Tap™ (Takara, Japan) on the LightCycler® 480 II (Roche Diagnostics Ltd., Basel, Switzerland) following the manufacturer’s instructions. GAPDH was used as the reference genes to normalize the relative mRNA expression. The primer sequences are listed in Table 2. The relative quantification analysis was calculated using the 2-△△Ct method (24). The primers of qPCR were designed using the Primer-BLAST program (http://www.ncbi.nlm.nih.gov/tools/primer-blast/) or software packages Primer Premier 5.0.
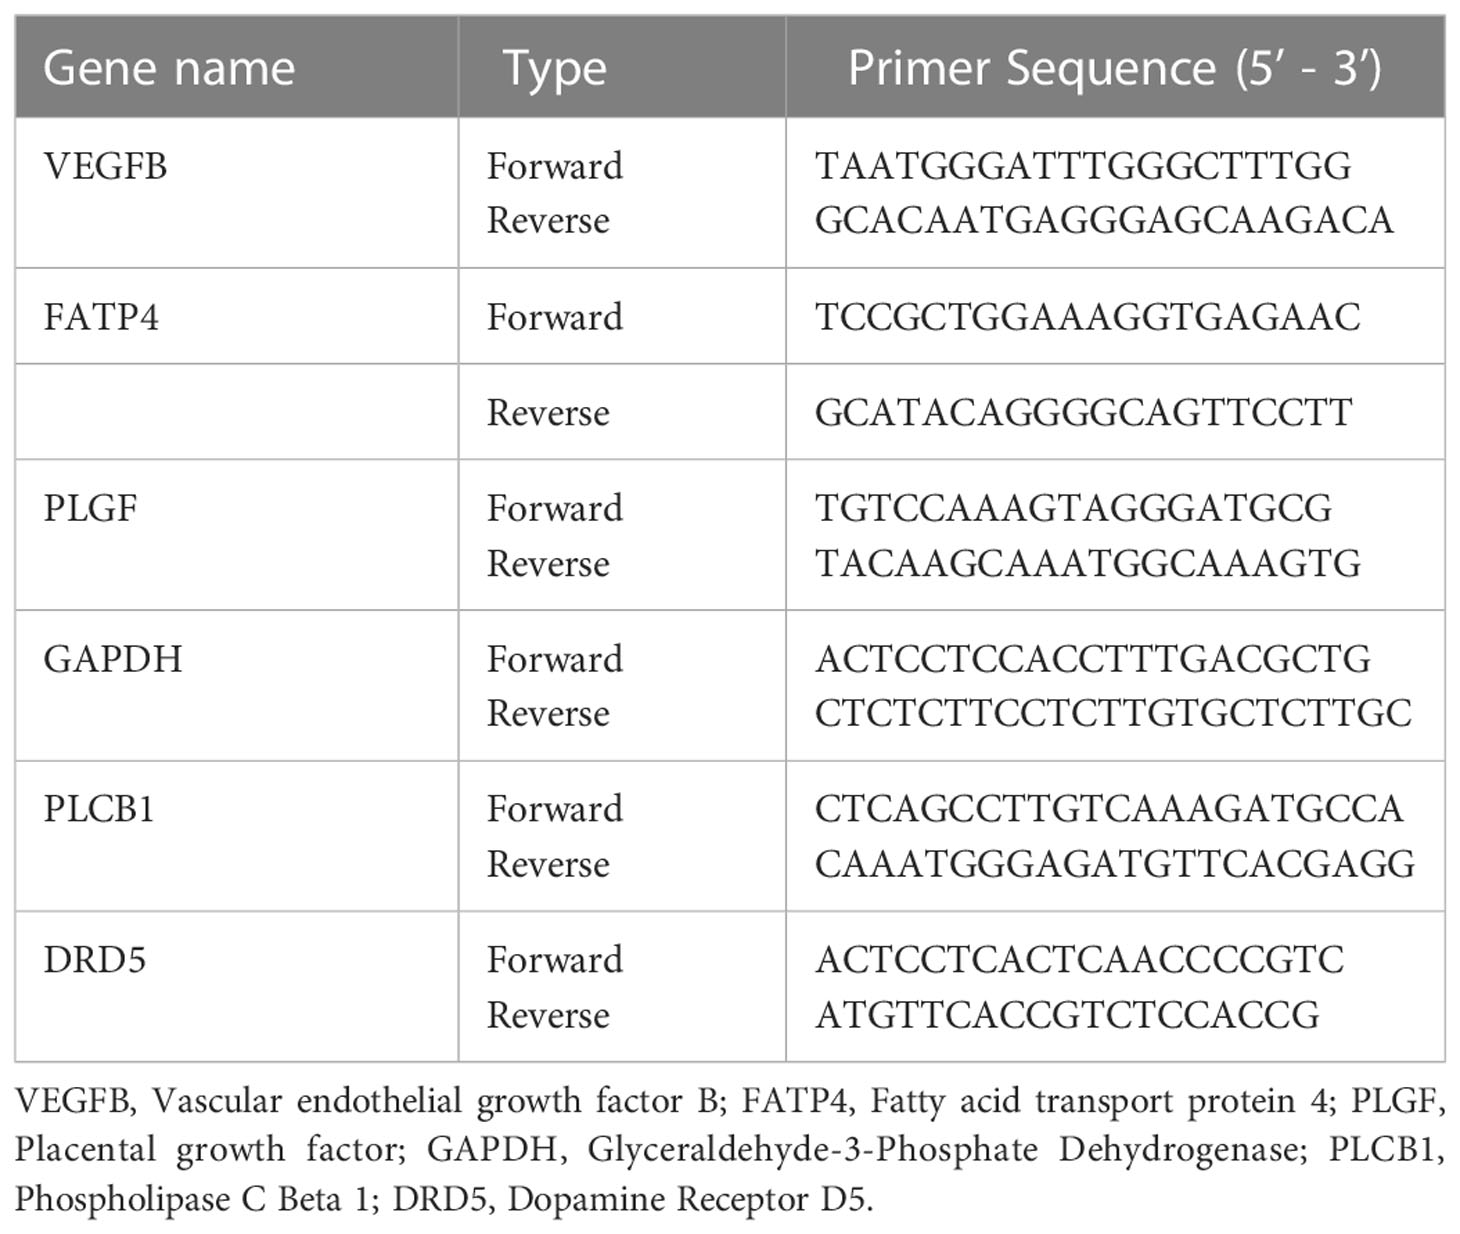
Table 2 Primers of genes for qPCR.
ELISA
The expressions of PLCB1, DRD5, PLGF, FATP4, and VEGFB in serum were analyzed by enzyme‐linked immunosorbent assay (Blue Gene, Shanghai, China). The measurement was performed following the manufacturer’s instructions. All samples were assessed in triplicate.
Statistical analysis
Statistical analysis was performed by SPSS 22.0 software and GraphPad 5. The significance was calculated by one-way analysis variance (ANOVA) or Student t-test. All experiments were performed at least three times independently. The results are presented as the mean ± standard error. Differences were statistically significant if P< 0.05.
Results
General clinical characteristics
There was no significant difference in age, gender, systolic blood pressure (SBP), and triglycerides (TG) among the three groups (P> 0.05) as Table 3 shown. Compared with NC group, waist-hip ratio (WHR), diastolic blood pressure (DBP), total cholesterol (TC), HbA1c, and fasting plasma glucose (FPG) were significant higher in CVD and DM group (P< 0.05). Meanwhile, no obvious difference was observed in those clinical parameters between DM and CVD groups (P> 0.05). Consistent with the previous findings, BMI in DM group was significantly higher than that in NC group (P< 0.05). Compared with NC group, there was an increased tendency of BMI of diabetic patients in CVD group (P> 0.05).
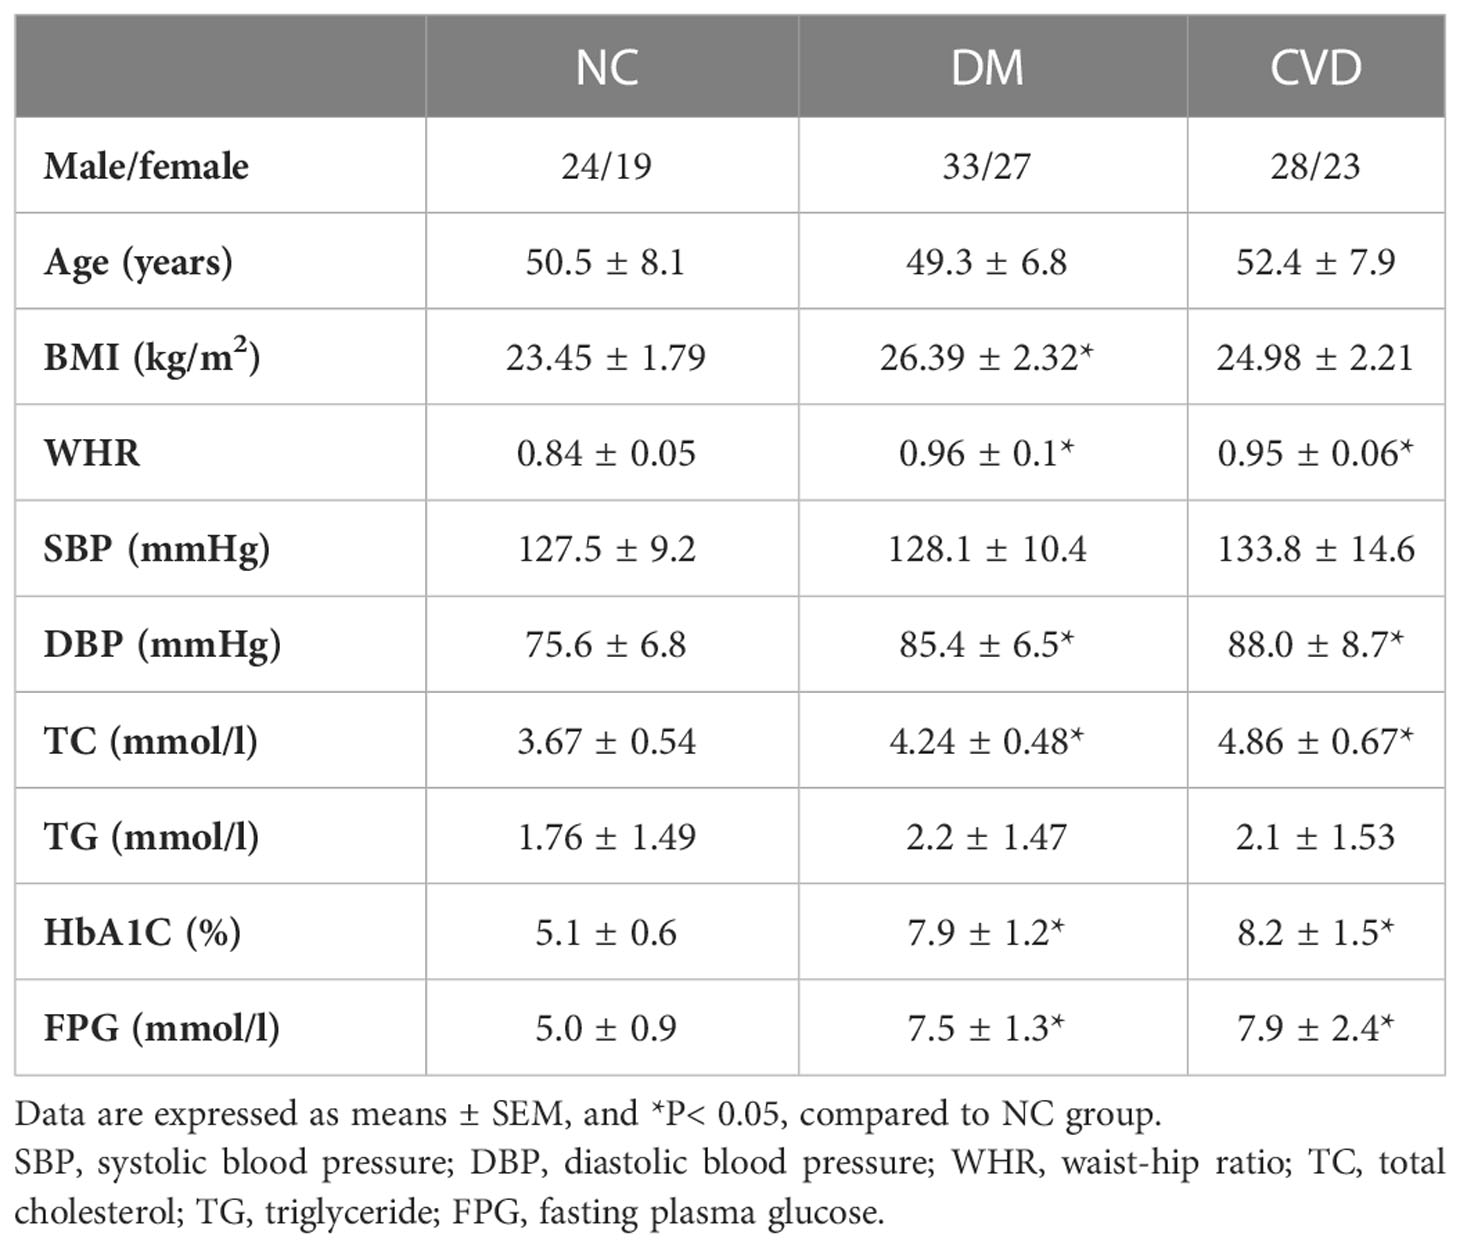
Table 3 Clinical characteristics of participants.
DNA methylation status in diabetic patients
The global cytosine methylated peaks in peripheral blood were obtained to assess the DNA methylation variations among the three groups. A total number of 57273 methylated peaks were identified. Among these peaks, 19677 (34.3%) were in NC group, and 20552 (35.9%) methylated peaks were in DM group, and the remaining 17044 (29.8%) methylated peaks were in CVD group.
As shown in Figure 1A, the CpG lands (CGIs) were grouped into three classes depending on the distance of sequence, which contains high-frequency CG sites to RefSeq genes. They are promoter islands (from about -10kb to +0.5kb around the transcription starting site), intragenic islands (from +0.5kb around the transcription start site to the transcription end site) and intergenic islands (the remainder that does not fall in either promoter or intragenic). The numbers of methylated enrichment peaks (Eps) among different groups were depicted in Figure 1B. A number of 13086, 13452, and 11461 methylated EPs were detected in NC, DM, and CVD group, respectively, in promoter CGIs, while the number of EPs in intragenic islands is 2196, 2418 and 1901 in NC, DM and CVD group respectively.
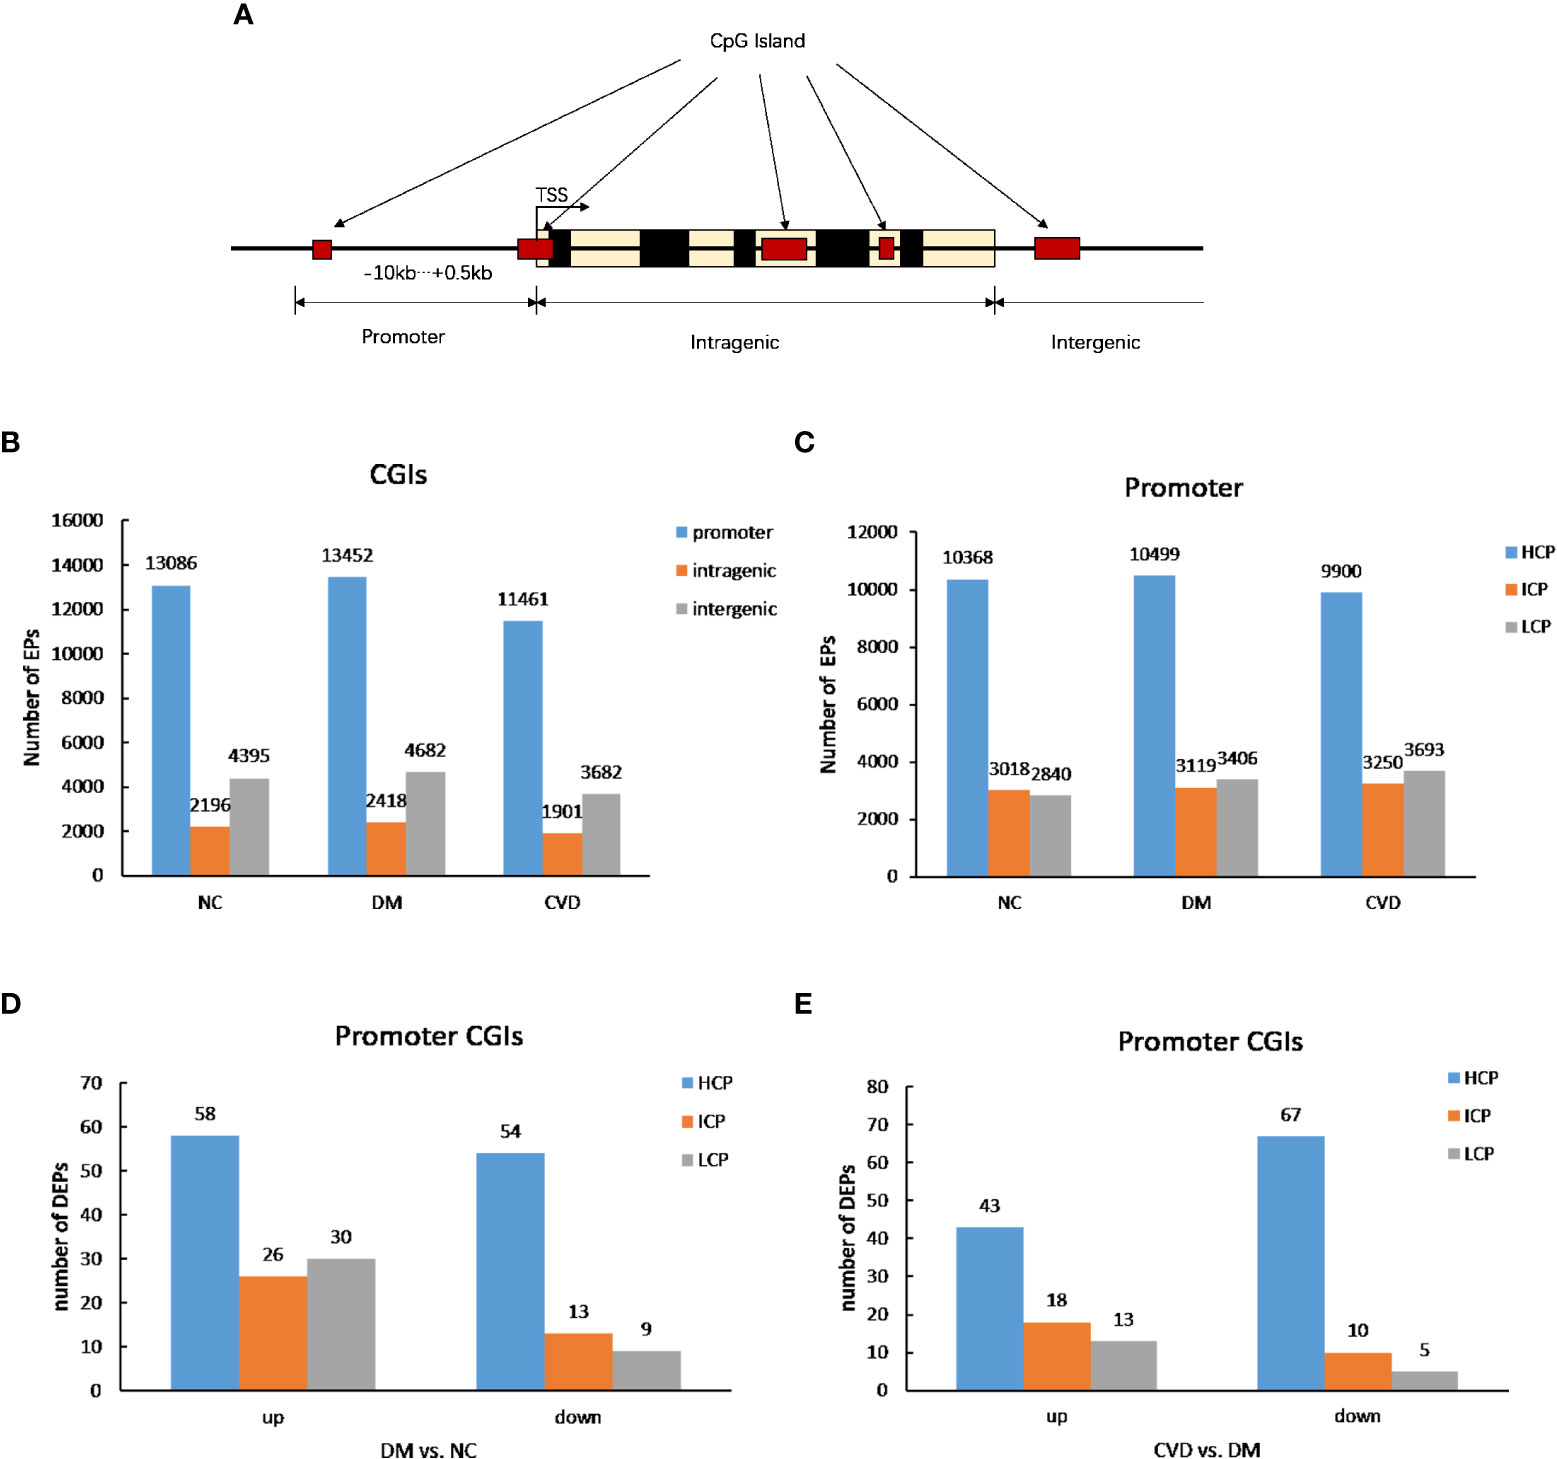
Figure 1 DNA methylation status among different groups. (A) Diagram of CpG lands (CGIs) location in gene. CGIs were grouped depending on the distance of sequence which contains high frequency CG sites to RefSeq genes. (B, C) Profiles of expression peaks in CGIs and promoter. (D) Profiles of different expression peaks between NC (n=3) and DM group (n=3). (E) Profiles of different expression peaks between CVD (n=3) and DM group (n=3).
Based on the ratio of CpG, GC contents and the length of CpG-rich region, the promoter regions were subdivided into three classes: high CpG density promoter (HCP), low CpG density promoter (LCP) and intermediate CpG density promoter (ICP). As shown in Figure 1C, compared with the number of methylated peaks in ICP and LCP types, HCP type had the highest number among the three groups. Furthermore, both DM and CVD groups have more methylated differential enrichment peaks in HCP than those in ICP and LCP, regardless of the promoters that were either up- or down-methylated (Figures 1D, E).
Differentially methylated genes among CVD, DM, and NC groups
Compared with the NC group, 179 and 251 genes were methylated in the promoter regions of DM and CVD group, respectively, whereas 54 genes overlapped between these two groups (Figure 2A). Of these genes, a total of 211 genes were hypermethylated while 166 were hypomethylated, in which 22 genes and 32 genes were overlapped between DM and CVD group, respectively (Figures 2B, C). Meanwhile, the number of methylated genes in CVD group was more than that in DM group, and each group had its special aberrant methylated genes apart from the overlapped genes. Additionally, CVD group had 149 differentially methylated genes compared to the DM, which includes 79 up-regulated genes and 70 down-regulated genes. The above results indicate that DNA methylation modification was widespread in diabetes and its cardiovascular complications. DNA methylation of specific genes might play a role in the outcome of cardiovascular diseases in diabetes.
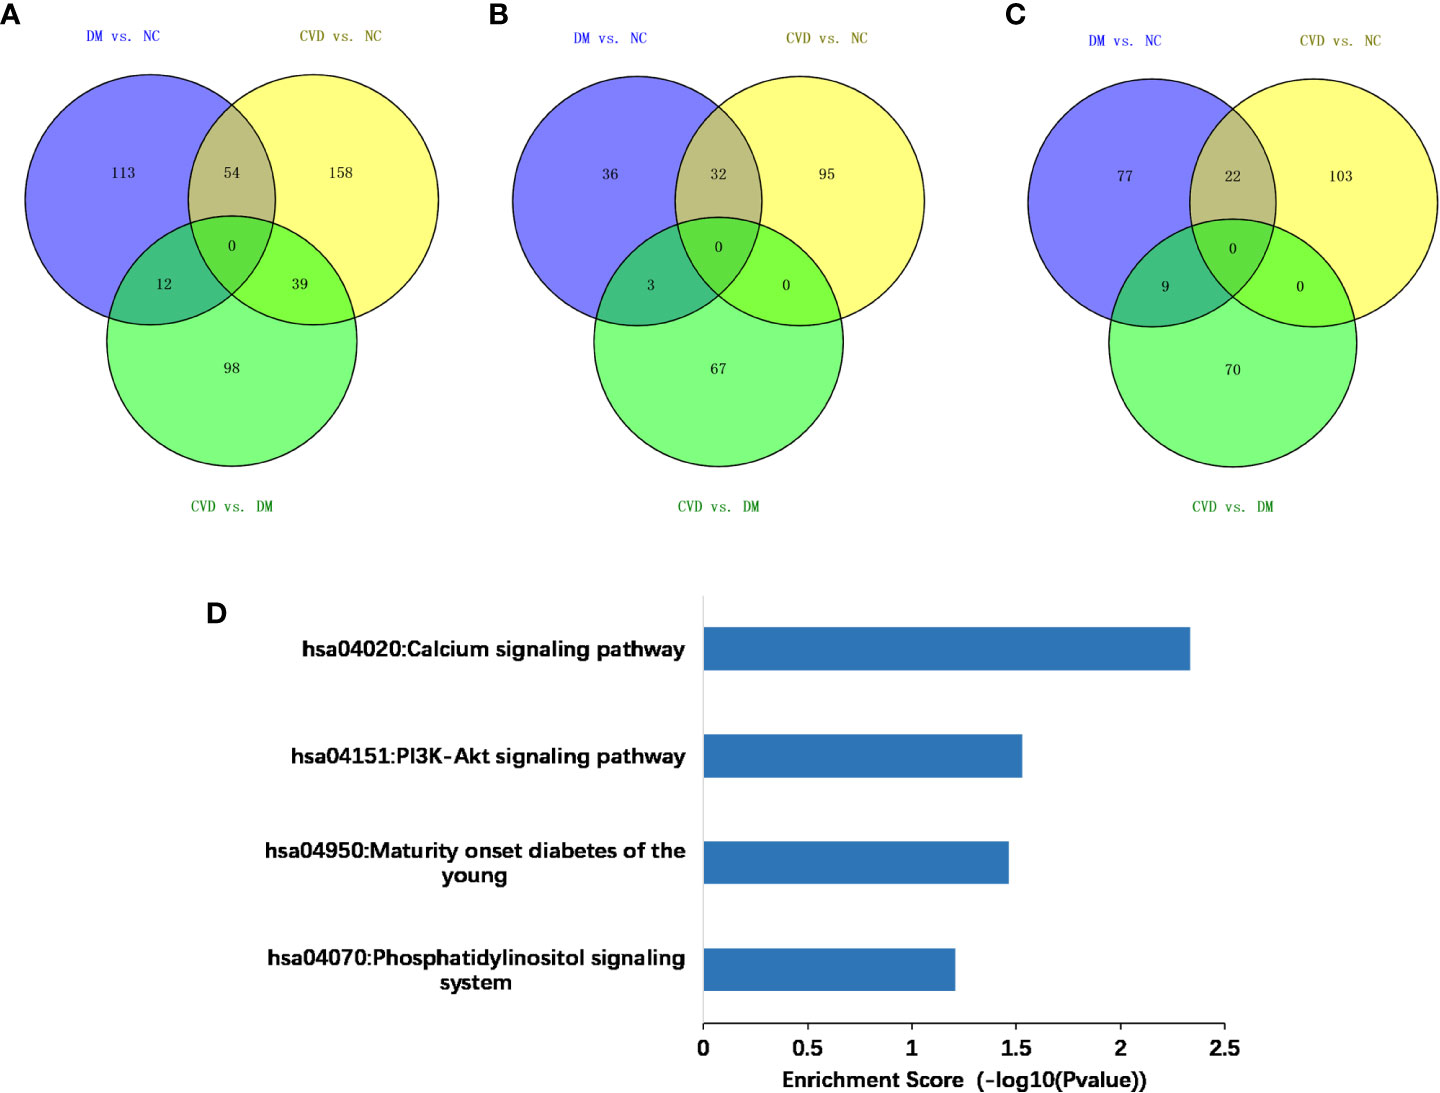
Figure 2 Methylated genes that were unique or overlapped between the DM and CVD group. (A–C) Overall different methylated genes, down-regulated genes, and up-regulated genes among three groups, respectively. Purple color represents the result of comparison between DM and NC group. Yellow color represents the result of comparison between CVD and NC group. Green color represents the result of comparison between CVD and DM group. (D) Based on DAVID database, KEGG pathway analysis of all aberrant methylated genes shows the high score pathways participating in DM and CVD. The vertical axis is the pathway category; the horizontal axis is the enrichment of pathways.
Bioinformatics analysis of differentially methylated genes
To analyze the potential role of differentially methylated genes, we performed gene ontology (GO) and pathway enrichment analysis using the DAVID online tool. The threshold was set asP< 0.05. In Figure 2D, KEGG pathway analysis showed that the calcium signaling pathway and the PI3K-Akt signaling pathway ranked the top 2 pathways according to the enrichment score, which are the critical signaling pathways in the development of DM and its macrovascular complications. GO analysis revealed the functional pathways of abnormally methylated genes in DM and CVD groups, compared with NC group (Table 4). Genes participated in the fatty acid metabolic process such as fatty acid transport protein 3 (FATP3) and fatty acid transport protein 4 (FATP4) were screened out to be down-methylated. Meanwhile, genes involved in the vascular endothelial growth factor receptor (VEGFR) signaling pathway such as vascular endothelial growth factor B (VEGFB), placental growth factor (PLGF), and coagulation factor II thrombin receptor (F2R) were found to be down-methylated.
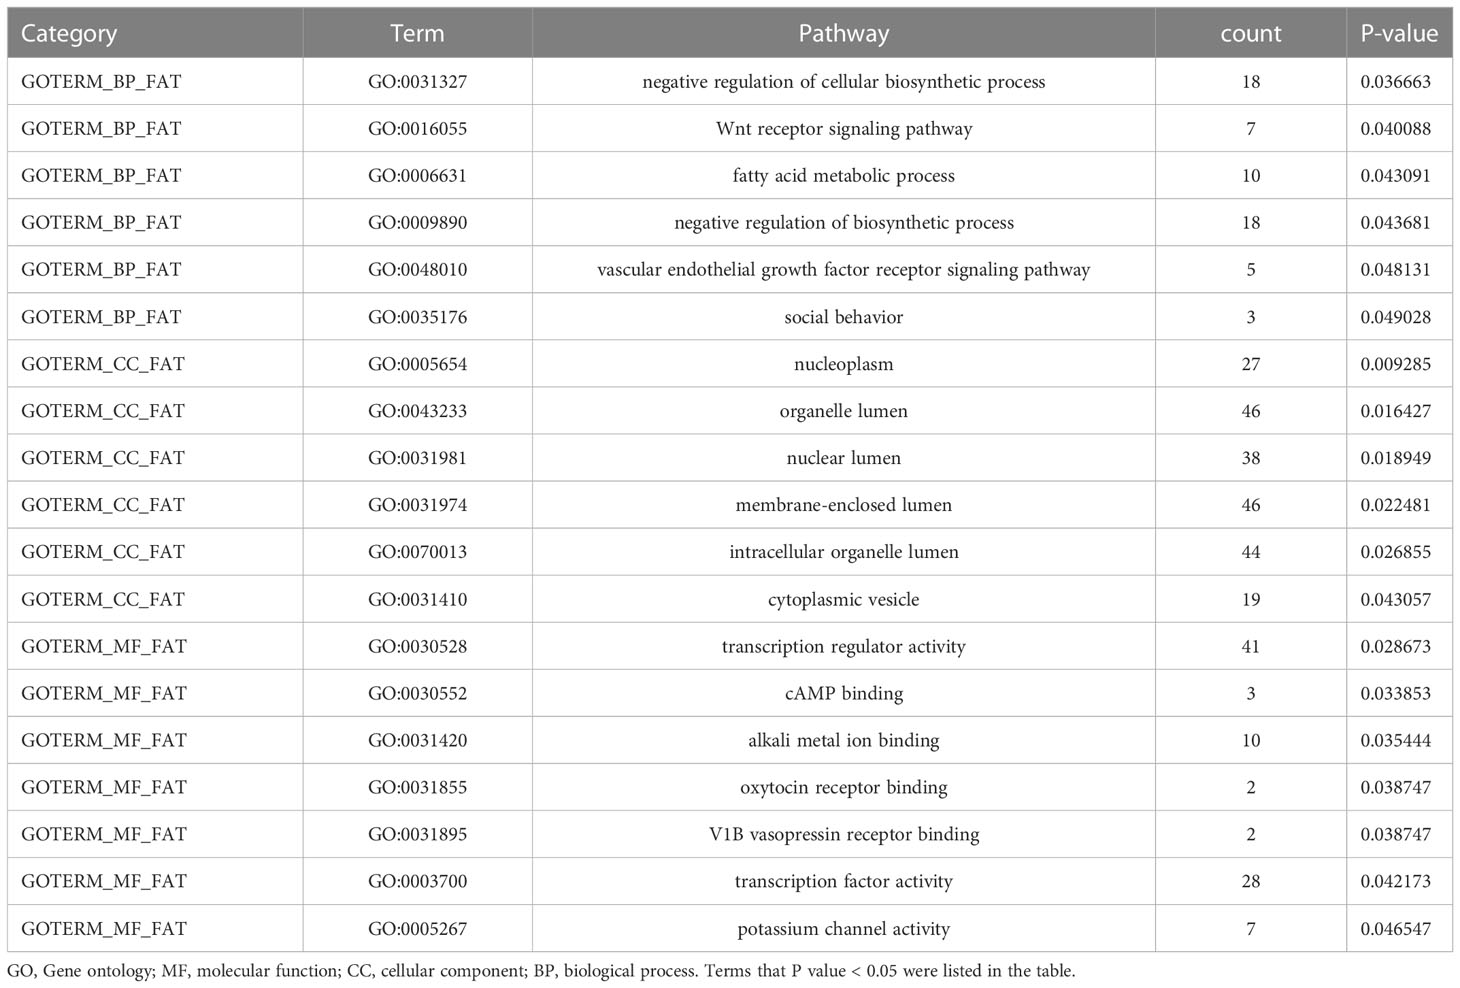
Table 4 GO analysis of abnormal methylated genes in DM and CVD compared to NC group.
Validation of MeDIP-chip data by MSP
Several studies have demonstrated the important role of calcium signaling pathway in atherosclerosis (25–27). Additionally, dysfunction of vascular endothelial function could enhance atherosclerotic plaque progression (28). Based on the results of bioinformatics analysis, we also found several significantly hypomethylated genes (PLCB1, CAMK1D, and DRD5) participated in the calcium signaling pathway, while several hypomethylated genes (VEGFB, PLGF, F2R, FATP3, and FATP4) participated in VEGFR signaling pathway. Then we performed MSP evaluation using leukocytes from peripheral blood of the subjects. In general, a good correlation between the MeDIP-chip and MSP results was observed for PLCB1, VEGFB, PLGF, and FATP4, except for DRD5. However, MSP of FATP3, CAMK1D, and F2R did not show significant differences among the three groups (Figures 3, 4). Compared with NC group, DM and CVD groups had a significantly lower DNA methylation in PLCB1, VEGFB, PLGF, and FATP4 (P< 0.05). Furthermore, the levels of DNA methylation in FATP4 and VEGFB in CVD group were significantly lower than those in DM group (P< 0.05). There was no significant difference in PLCB1 and PLGF between DM and CVD group (P> 0.05).
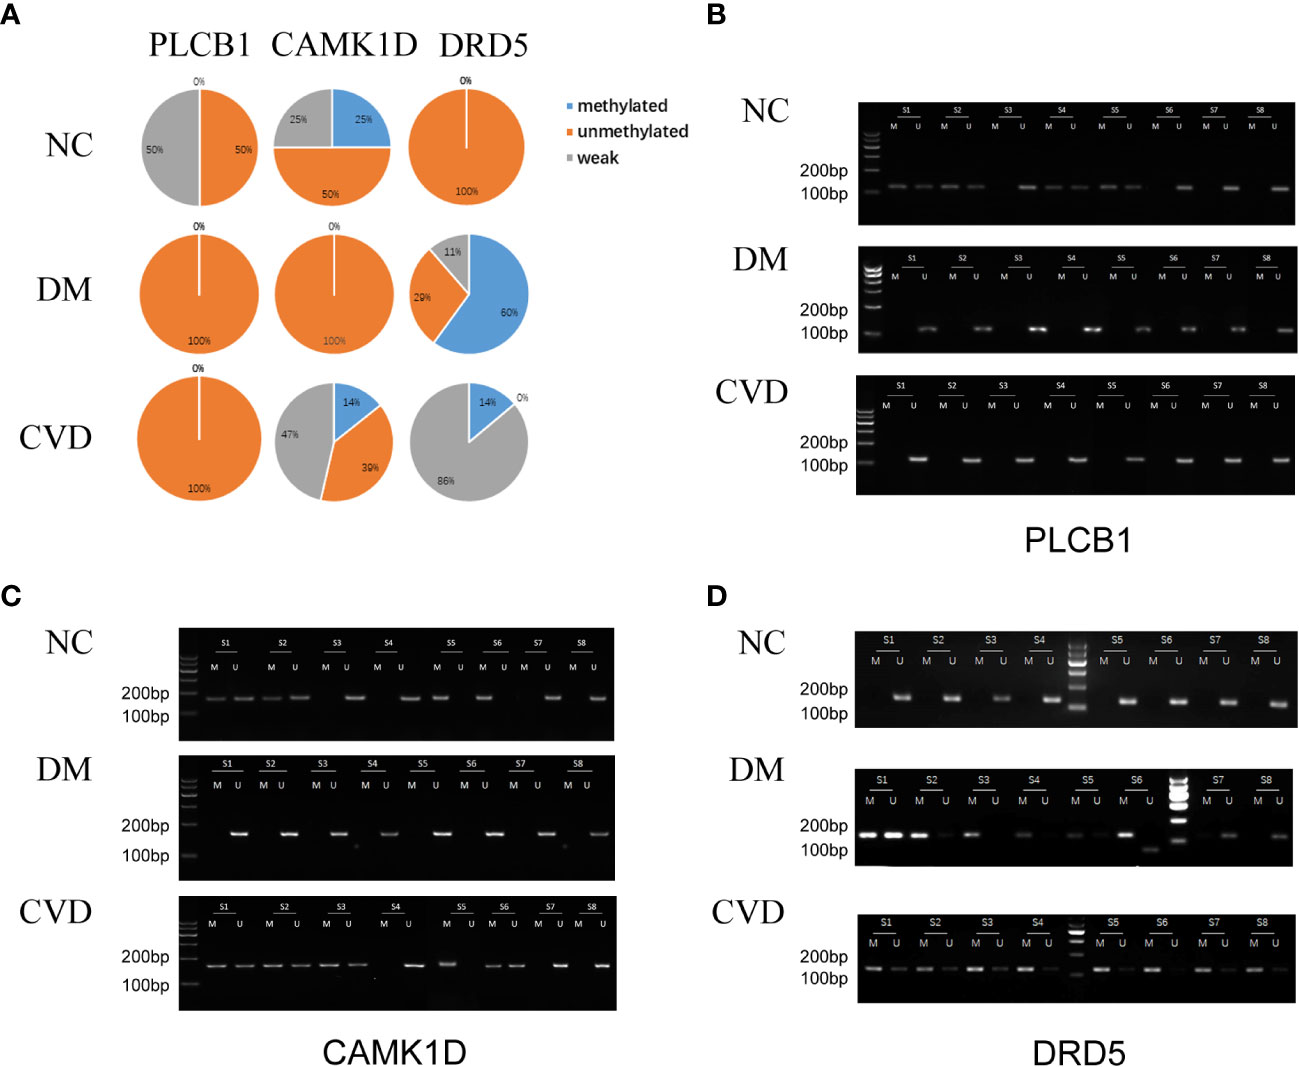
Figure 3 MSP of DNA methylation genes participating in calcium signaling pathway. (A) Pie chart shows the distribution of MSP derived from DNA methylation categories in NC (n=40), DM (n=57) and CVD groups (n=48). Weak methylated was defined by methylated band and unmethylated band coming out simultaneously in gel electrophoresis of MSP. (B–D) Results of representative MSP analysis at aberrant methylated region of PLCB1, CAMK1D and DRD5 respectively. The location of the amplicon is indicated in Table 4. M and U represent the reaction for methylated and unmethylated DNA, respectively.
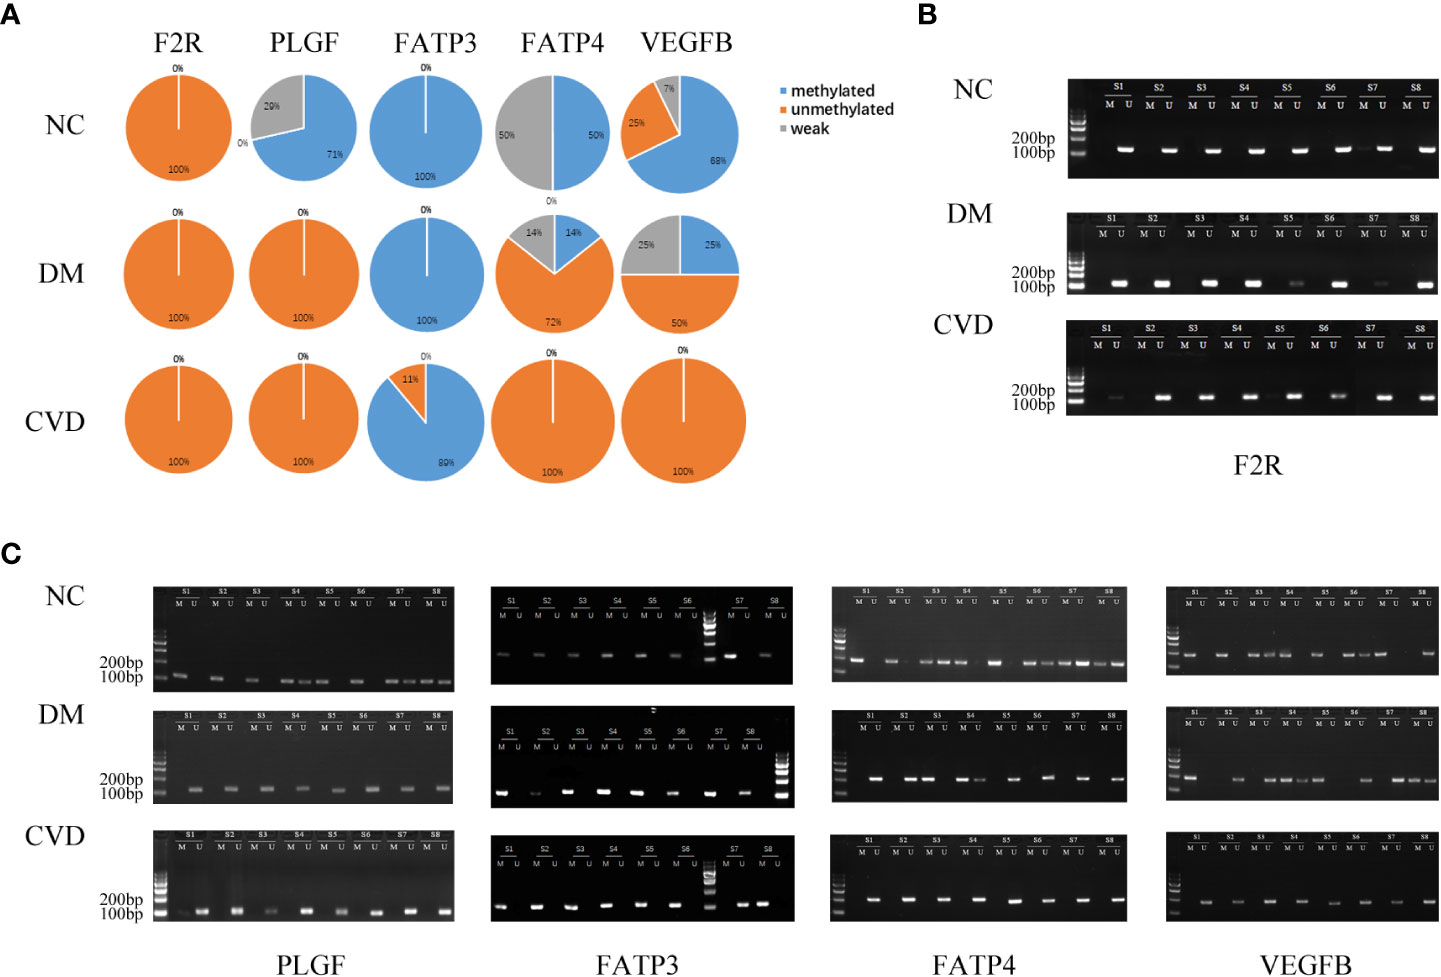
Figure 4 MSP of DNA methylation genes participating in vascular endothelial growth factor receptor signaling pathway. (A) Pie chart shows the distribution of MSP derived from DNA methylation categories in NC (n=40), DM (n=57) and CVD groups (n=48). Weak methylated was defined by methylated band and unmethylated band coming out simultaneously in gel electrophoresis of MSP. (B, C) Results of representative MSP analysis at aberrant methylated region of F2R, PLGF, FATP3, FATP4 and VEGFB. The location of amplicon is indicated in Table 4. M and U represent the reaction for methylated and unmethylated DNA, respectively.
Expressions of differential DNA methylated genes in the serum of CVD, DM, and NC groups
To further verify the differential methylated genes mentioned above, we performed qPCR to detect the mRNA expression in serum of three groups. The results showed that the levels of PLGF, PLCB1, FATP4, and VEGFB in the DM or CVD group were significantly higher than those in NC group (P < 0.05) (Figures 5A, E, G, I). Elisa results also showed the similar patterns among three groups (Figures 5A-J). A good consistency among the DNA methylation, mRNA and protein levels was observed for PLCB1, PLGF, FATP4, and VEGFB genes.
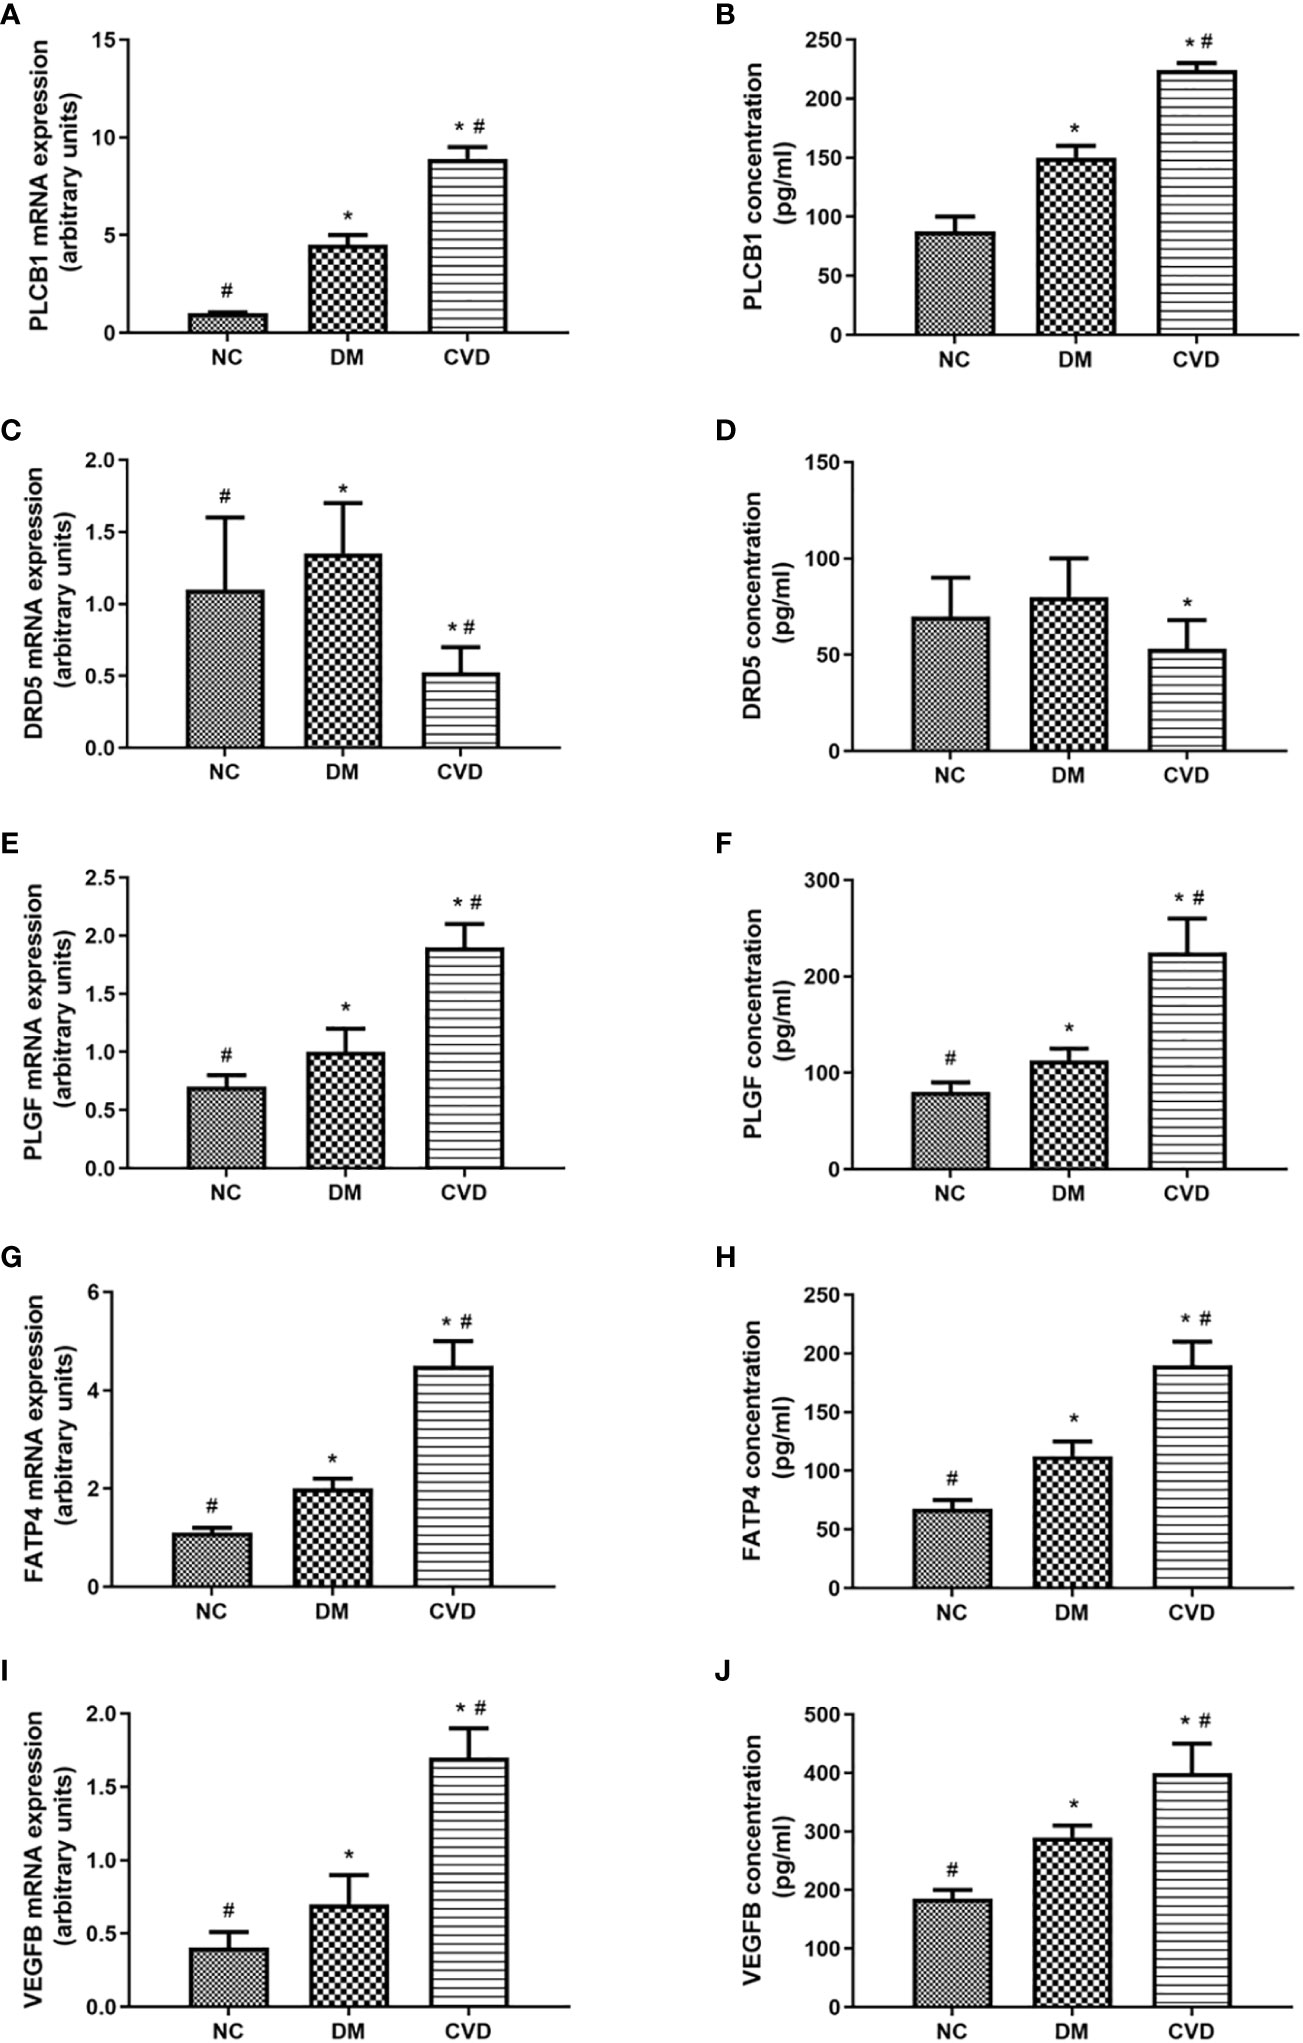
Figure 5 Expressions of differential methylated genes in serum of CVD, DM and NC groups. QPCR of PLCB1 (A), DRD5 (C), PLGF (E), FATP4 (G), VEGFB (I) in serum of NC (n=40), DM (n=57) and CVD groups (n=48) respectively. ELISA of PLCB1 (B), DRD5 (D), PLGF (F), FATP4 (H), VEGFB (J) in serum of NC (n=40), DM (n=57) and CVD groups (n=48) respectively. Data are presented as mean fold change ± SEM of 3 independent experiments. *P< 0.05, compared to NC group, #P< 0.05, compared to DM group.
Discussion
Diabetic cardiovascular complications are epidemic and pose a serious threat in modern society. Several studies explored the possible mechanisms involved in the development of diabetes and its associated cardiovascular complications (29–31). However, the precise mechanisms of macrovascular complications in diabetic patients remainto be elucidated. As a widely recognized assay, MeDIP-chip could provide comparative genome-wide DNA methylation dynamic patterns. In this study, MeDIP-chip was conducted to generate the DNA methylation profiles of leukocytes in peripheral blood. Compared to NC group, the level of DNA methylation was higher in DM group, while it was lower in CVD group. The different DNA methylation might be due to the different methylated peaks in the promoter CGIs of the DM and CVD groups. Our results indicate that the low level of DNA methylation of peripheral blood leukocytes may be a biomarker for cardiovascular diseases in diabetic patients. Similarly, Gertrud Lund et al. reported that DNA methylation polymorphisms precede histological signs of atherosclerosis in mice lacking apolipoprotein E (32). Besides, it was also identified that epigenetic modifications were associated with proliferative diabetic retinopathy by genome-wide analysis of DNA methylation in type 1 diabetes patients (33).
Since the differentially methylated regions were mostly enriched in the gene promoter (34), we analyzed the global DNA methylation patterns in the promoter regions. In this study, comparing to the methylation level of intergenic regions, it was significantly higher in the promoter region in human peripheral blood leukocytes. The methylation level of LCP and ICP was lower than that of HCP. In addition, the number of down-methylated CGI promoters was lower than that of up-methylated HCP, LCP, and ICP in DM group, while it was higher than CVD group. These results showed that cardiovascular diseases in diabetes possessed notably methylation changes in CGI promoters of the genome. Similarly, the relationship between CpG methylation pattern of the proximal insulin gene promoter and diabetes had been reported (35, 36). Taking together, we proposed that DNA methylation might play an important role in the pathophysiology of diabetes and its cardiovascular diseases.
In this study, bioinformatics analysis of MeDIP-chip results implied that several signaling pathways might participate in the development of diabetes and its cardiovascular diseases, including calcium signaling pathway and VEGFR signaling pathway. Thus, the validation of MeDIP-chip data by methylation-specific PCR was performed. Furthermore, qPCR and ELISA were conducted to detect the expression of aberrant methylated genes in participants’ serum. The results turned out that only the mRNA and protein expression changes of PLCB1, PLGF, FATP4, and VEGFB were consistent with its methylation status. It is possible that the expression of other aberrant methylated genes might be regulated independent on DNA methylation (37). However, our study indicates that the hypomethylation of VEGFB, PLGF, PLCB1, and FATP4 might upregulate the expression of proteins, respectively. And the level of the proteins might affect the function of vascular endothelial. Several studies have also shown that those gene expressions could be regulated by DNA methylation. Hypomethylated PLCB1 was related to its increased expression in patients with colorectal cancer (38). Hypomethylation of PLGF could increase its expression in lung carcinoma cell lines (39). Folic acid could downregulate the expression of VEGFB by DNA methylation in retinal microvascular endothelial cell (40).
The data above also showed that the VEGFR signaling pathway is probably a crucial target of DNA methylation in diabetes patients. Roberto Monastero et al. had demonstrated that the expression of VEGFB gene could be affected by dietary fatty acids (41). This regulation might be mediated, at least in part, by epigenetic modifications on VEGFB promoter methylation. As vascular endothelial growth factor is a key regulator of physiological angiogenesis, which is mediated by binding to its receptors (42), we assume that VEGFR signaling pathway is crucial for diabetic vascular development. The potential hypothesis was shown in Figure 6.
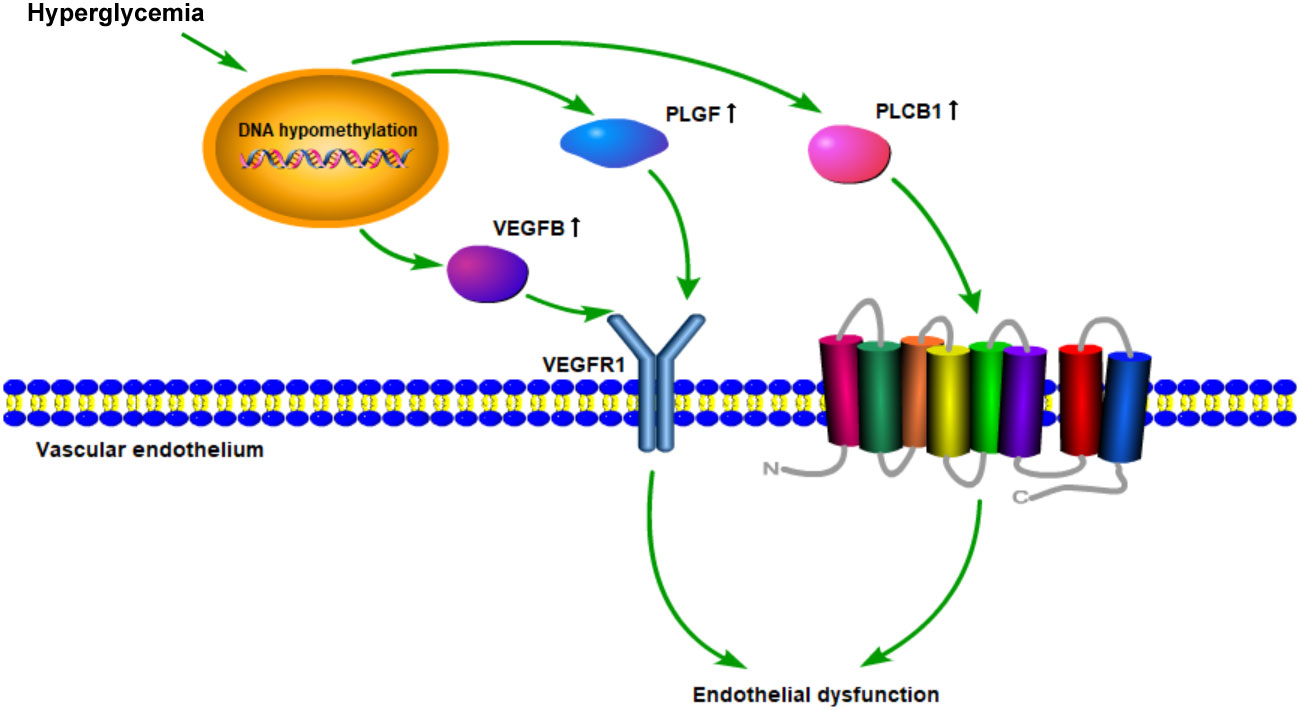
Figure 6 Schematic diagram of the mechanism hypothesis of “VEGFR signaling pathway regulated by DNA methylation in the cardiovascular diseases’ pathogenesis of diabetes”.
Endothelial dysfunction plays a critical role in initiating atherosclerosis (43, 44). It has been demonstrated that VEGFR signaling pathway mainly participates in physiological angiogenesis. Accumulating evidence indicates that intra-plaque angiogenesis promotes atherosclerosis and plaque destabilization (45). Plaque microvascularization and increased endothelial permeability are key players in the development of atherosclerosis, from the initial stages of plaque formation to the occurrence of acute cardiovascular events (46). PLGF and VEGFB could, respectively, bind to VEGFR1, then directly or indirectly inducing angiogenesis (47–49). In addition, as a member of the VEGF family, VEGFB was found to regulate the lipid transport across the vascular endothelium through FATP4 and thus determine lipid accumulation in muscle and heart (50, 51). Moreover, inhibition of VEGFB expression could prevent the progression of type 2 diabetes and restore insulin sensitivity in mice fed a high-fat diet. Our results also demonstrated that DNA methylation of VEGFB was lower in diabetes and its cardiovascular diseases groups than that in the normal group. The expression of VEGFB in peripheral blood leukocytes was correspondingly higher in DM and CVD groups. It has been observed that changes in DNA methylation patterns are associated with coronary artery disease (CAD) (52). Therefore, DNA methylation of genes in VEGFR signaling pathway might play a critical role in potentiating the process of endothelial dysfunction in diabetic cardiovascular diseases.
Conclusions
This study is the first one to reveal and compare the DNA methylation status of diabetes with or without macrovascular complications. The VEGFR signaling pathway regulated by DNA methylation might participate in the development of diabetic cardiovascular diseases. These findings also showed that the hypomethylation of VEGFB, PLGF, PLCB1, and FATP4 might be the potential biomarkers and therapeutic targets for early interventions in diabetic patients with cardiovascular diseases. The limitation of our study is that our results are obtained in blood DNA. It needs more studies to confirm genes’ function in diabetes and its cardiovascular complications model. In addition, further efforts are required to determine the cause-and-effect relationship between gene methylation and diabetic cardiovascular diseases.
Data availability statement
The datasets presented in this study can be found in online repositories. The names of the repository/repositories and accession number(s) can be found in the article/supplementary material.
Ethics statement
The studies involving human participants were reviewed and approved by the Institutional Research Ethics Committee of Union Hospital, Huazhong University of Science and Technology. The patients/participants provided their written informed consent to participate in this study.
Author contributions
YL and SH conceived the idea and drafted the manuscript. WW, YY, KQ, and YX were responsible for completing experiments. LC and TZ edited the manuscript. All authors contributed to the article and approved the submitted version.
Funding
This work was supported by National Natural Science Foundation of China Grants (grant numbers 81070648, 81471069, 81100580, and 82070830), Science and Technology Research Project of Hubei Province Public Welfare (2013BCB016) and Key R&D plan of Hubei Province (2022BCA036).
Acknowledgments
We appreciate Mohammad Ishraq Zafar (Huazhong University of Science Technology) for invaluable help in language editing.
Conflict of interest
The authors declare that the research was conducted in the absence of any commercial or financial relationships that could be construed as a potential conflict of interest.
Publisher’s note
All claims expressed in this article are solely those of the authors and do not necessarily represent those of their affiliated organizations, or those of the publisher, the editors and the reviewers. Any product that may be evaluated in this article, or claim that may be made by its manufacturer, is not guaranteed or endorsed by the publisher.
References
1. Danaei G, Finucane MM, Lu Y, Singh GM, Cowan MJ, Paciorek CJ, et al. National, regional, and global trends in fasting plasma glucose and diabetes prevalence since 1980: systematic analysis of health examination surveys and epidemiological studies with 370 country-years and 2.7 million participants. Lancet (2011) 378(9785):31–40. doi: 10.1016/S0140-6736(11)60679-X
2. Cruickshank K, Riste L, Anderson SG, Wright JS, Dunn G, Gosling RG. Aortic pulse-wave velocity and its relationship to mortality in diabetes and glucose intolerance: an integrated index of vascular function? Circulation (2002) 106(16):2085–90. doi: 10.1161/01.CIR.0000033824.02722.F7
3. Chiha M, Njeim M, Chedrawy EG. Diabetes and coronary heart disease: a risk factor for the global epidemic. Int J hypertension (2012) 2012:697240. doi: 10.1155/2012/697240
4. Htay T, Soe K, Lopez-Perez A, Doan AH, Romagosa MA, Aung K. Mortality and cardiovascular disease in type 1 and type 2 diabetes. Curr Cardiol Rep (2019) 21(6):45. doi: 10.1007/s11886-019-1133-9
5. White NH, Sun W, Cleary PA, Tamborlane WV, Danis RP, Hainsworth DP, et al. Effect of prior intensive therapy in type 1 diabetes on 10-year progression of retinopathy in the DCCT/EDIC: comparison of adults and adolescents. Diabetes (2010) 59(5):1244–53. doi: 10.2337/db09-1216
6. Nathan DM, Cleary PA, Backlund JY, Genuth SM, Lachin JM, Orchard TJ, et al. Intensive diabetes treatment and cardiovascular disease in patients with type 1 diabetes. New Engl J Med (2005) doi: 10.1056/NEJMoa052187.
7. Liao Y, Gou L, Chen L, Zhong X, Zhang D, Zhu H, et al. NADPH oxidase 4 and endothelial nitric oxide synthase contribute to endothelial dysfunction mediated by histone methylations in metabolic memory. Free Radical Biol Med (2018) 115:383–94. doi: 10.1016/j.freeradbiomed.2017.12.017
8. Zheng J, Cheng J, Zhang Q, Xiao X. Novel insights into DNA methylation and its critical implications in diabetic vascular complications. Biosci Rep (2017) 37(2):BSR20160611. doi: 10.1042/BSR20160611
9. Pasquier J, Hoarau-Vechot J, Fakhro K, Rafii A, Abi Khalil C. Epigenetics and cardiovascular disease in diabetes. Curr Diabetes Rep (2015) 15(12):108. doi: 10.1007/s11892-015-0677-3
10. Villeneuve LM, Reddy MA, Natarajan R. Epigenetics: deciphering its role in diabetes and its chronic complications. Clin Exp Pharmacol Physiol (2011) 38(7):451–9. doi: 10.1111/j.1440-1681.2011.05497.x
11. Zeng J, Chen B. Epigenetic mechanisms in the pathogenesis of diabetic retinopathy. Ophthalmol J Int d’ophtalmol Int J Ophthalmol Z fur Augenheilkunde (2014) 232(1):1–9. doi: 10.1159/000357824
12. Bansal A, Pinney SE. DNA Methylation and its role in the pathogenesis of diabetes. Pediatr Diabetes (2017) 18(3):167–77. doi: 10.1111/pedi.12521
13. Dunn J, Qiu H, Kim S, Jjingo D, Hoffman R, Kim CW, et al. Flow-dependent epigenetic DNA methylation regulates endothelial gene expression and atherosclerosis. J Clin Invest (2014) 124(7):3187–99. doi: 10.1172/JCI74792
14. Nazarenko MS, Markov AV, Lebedev IN, Freidin MB, Sleptcov AA, Koroleva IA, et al. A comparison of genome-wide DNA methylation patterns between different vascular tissues from patients with coronary heart disease. PloS One (2015) 10(4):e0122601. doi: 10.1371/journal.pone.0122601
15. Davegardh C, Broholm C, Perfilyev A, Henriksen T, Garcia-Calzon S, Peijs L, et al. Abnormal epigenetic changes during differentiation of human skeletal muscle stem cells from obese subjects. BMC Med (2017) 15(1):39. doi: 10.1186/s12916-017-0792-x
16. Chen H, Orozco LD, Wang J, Rau CD, Rubbi L, Ren S, et al. DNA Methylation indicates susceptibility to isoproterenol-induced cardiac pathology and is associated with chromatin states. Circ Res (2016) 118(5):786–97. doi: 10.1161/CIRCRESAHA.115.305298
17. Malhotra P, Soni V, Kumar A, Anbazhagan AN, Dudeja A, Saksena S, et al. Epigenetic modulation of intestinal cholesterol transporter niemann-pick C1-like 1 (NPC1L1) gene expression by DNA methylation. J Biol Chem (2014) 289(33):23132–40. doi: 10.1074/jbc.M113.546283
18. Alberti KG, Zimmet PZ. Definition, diagnosis and classification of diabetes mellitus and its complications. part 1: diagnosis and classification of diabetes mellitus provisional report of a WHO consultation. Diabetic medicine: J Br Diabetic Assoc (1998) 15(7):539–53. doi: 10.1002/(SICI)1096-9136(199807)15:7<539::AID-DIA668>3.0.CO;2-S
19. Scacheri PC, Crawford GE, Davis S. Statistics for ChIP-chip and DNase hypersensitivity experiments on NimbleGen arrays. Methods enzymol (2006) 411:270–82. doi: 10.1016/S0076-6879(06)11014-9
20. Kanehisa M, Goto S. KEGG: kyoto encyclopedia of genes and genomes. Nucleic Acids Res (2000) 28(1):27–30. doi: 10.1093/nar/28.1.27
21. Ashburner M, Ball CA, Blake JA, Botstein D, Butler H, Cherry JM, et al. Gene ontology: tool for the unification of biology The Gene Ontology Consortium. Nat Genet (2000) 25(1):25–9 doi: 10.1038/75556.
22. Huang DW, Sherman BT, Tan Q, Collins JR, Alvord WG, Roayaei J, et al. The DAVID gene functional classification tool: a novel biological module-centric algorithm to functionally analyze large gene lists. Genome Biol (2007) 8(9):R183. doi: 10.1186/gb-2007-8-9-r183
23. Derks S, Lentjes MHFM, Hellebrekers DMEI, de Bruïne AP, Herman JG, van Engeland M. Methylation-specific PCR unraveled. Cell Oncol (2004) 26(5-6):291–9. doi: 10.1155/2004/370301
24. Schmittgen TD, Livak KJ. Analyzing real-time PCR data by the comparative C(T) method. Nat Protoc (2008) 3(6):1101–8. doi: 10.1038/nprot.2008.73
25. Bootman MD, Collins TJ, Peppiatt CM, Prothero LS, MacKenzie L, De Smet P, et al. Calcium signalling–an overview. Semin Cell Dev Biol (2001) 12(1):3–10. doi: 10.1006/scdb.2000.0211
26. Mak S, Sun H, Acevedo F, Shimmin LC, Zhao L, Teng BB, et al. Differential expression of genes in the calcium-signaling pathway underlies lesion development in the LDb mouse model of atherosclerosis. Atherosclerosis (2010) 213(1):40–51. doi: 10.1016/j.atherosclerosis.2010.06.038
27. Yuan Z, Miyoshi T, Bao Y, Sheehan JP, Matsumoto AH, Shi W. Microarray analysis of gene expression in mouse aorta reveals role of the calcium signaling pathway in control of atherosclerosis susceptibility. Am J Physiol Heart Circulatory Physiol (2009) 296(5):H1336–43. doi: 10.1152/ajpheart.01095.2008
28. Celletti FL, Waugh JM, Amabile PG, Brendolan A, Hilfiker PR, Dake MD. Vascular endothelial growth factor enhances atherosclerotic plaque progression. Nat Med (2001) 7(4):425–9. doi: 10.1038/86490
29. Knowler WC, Barrett-Connor E, Fowler SE, Hamman RF, Lachin JM, Walker EA, et al. Reduction in the incidence of type 2 diabetes with lifestyle intervention or metformin. New Engl J Med (2002) 346(6):393–403.
30. Fuchsberger C, Flannick J, Teslovich TM, Mahajan A, Agarwala V, Gaulton KJ, et al. The genetic architecture of type 2 diabetes. Nature (2016) 536(7614):41–7. doi: 10.1038/nature18642
31. Ong TP, Ozanne SE. Developmental programming of type 2 diabetes: early nutrition and epigenetic mechanisms. Curr Opin Clin Nutr Metab Care (2015) 18(4):354–60. doi: 10.1097/MCO.0000000000000177
32. Lund G, Andersson L, Lauria M, Lindholm M, Fraga MF, Villar-Garea A, et al. DNA Methylation polymorphisms precede any histological sign of atherosclerosis in mice lacking apolipoprotein e. J Biol Chem (2004) 279(28):29147–54. doi: 10.1074/jbc.M403618200
33. Agardh E, Lundstig A, Perfilyev A, Volkov P, Freiburghaus T, Lindholm E, et al. Genome-wide analysis of DNA methylation in subjects with type 1 diabetes identifies epigenetic modifications associated with proliferative diabetic retinopathy. BMC Med (2015) 13:182. doi: 10.1186/s12916-015-0421-5
34. Irizarry RA, Ladd-Acosta C, Wen B, Wu Z, Montano C, Onyango P, et al. The human colon cancer methylome shows similar hypo- and hypermethylation at conserved tissue-specific CpG island shores. Nat Genet (2009) 41(2):178–86. doi: 10.1038/ng.298
35. Yang BT, Dayeh TA, Kirkpatrick CL, Taneera J, Kumar R, Groop L, et al. Insulin promoter DNA methylation correlates negatively with insulin gene expression and positively with HbA(1c) levels in human pancreatic islets. Diabetologia (2011) 54(2):360–7. doi: 10.1007/s00125-010-1967-6
36. Fradin D, Le Fur S, Mille C, Naoui N, Groves C, Zelenika D, et al. Association of the CpG methylation pattern of the proximal insulin gene promoter with type 1 diabetes. PloS One (2012) 7(5):e36278. doi: 10.1371/journal.pone.0036278
37. Reddy MA, Zhang E, Natarajan R. Epigenetic mechanisms in diabetic complications and metabolic memory. Diabetologia (2015) 58(3):443–55. doi: 10.1007/s00125-014-3462-y
38. Wang Q, Ye J, Fang D, Lv L, Wu W, Shi D, et al. Multi-omic profiling reveals associations between the gut mucosal microbiome, the metabolome, and host DNA methylation associated gene expression in patients with colorectal cancer. BMC Microbiol (2020) 20(Suppl 1):83. doi: 10.1186/s12866-020-01762-2
39. Xu L, Jain RK. Down-regulation of placenta growth factor by promoter hypermethylation in human lung and colon carcinoma. Mol Cancer res: MCR (2007) 5(9):873–80. doi: 10.1158/1541-7786.MCR-06-0141
40. Liu X, Cui H. The palliative effects of folic acid on retinal microvessels in diabetic retinopathy via regulating the metabolism of DNA methylation and hydroxymethylation. Bioengineered (2021) 12(2):10766–74. doi: 10.1080/21655979.2021.2003924
41. Monastero R, Garcia-Serrano S, Lago-Sampedro A, Rodriguez-Pacheco F, Colomo N, Morcillo S, et al. Methylation patterns of vegfb promoter are associated with gene and protein expression levels: the effects of dietary fatty acids. Eur J Nutr (2015) 56(2):715–726. doi: 10.1007/s00394-015-1115-7
42. Ferrara N, Gerber HP, LeCouter J. The biology of VEGF and its receptors. Nat Med (2003) 9(6):669–76. doi: 10.1038/nm0603-669
43. Eringa EC, Serne EH, Meijer RI, Schalkwijk CG, Houben AJ, Stehouwer CD, et al. Endothelial dysfunction in (pre)diabetes: characteristics, causative mechanisms and pathogenic role in type 2 diabetes. Rev endocr Metab Disord (2013) 14(1):39–48. doi: 10.1007/s11154-013-9239-7
44. Matsuzawa Y, Lerman A. Endothelial dysfunction and coronary artery disease: assessment, prognosis, and treatment. Coronary artery Dis (2014) 25(8):713–24. doi: 10.1097/MCA.0000000000000178
45. Virmani R, Kolodgie FD, Burke AP, Finn AV, Gold HK, Tulenko TN, et al. Atherosclerotic plaque progression and vulnerability to rupture: angiogenesis as a source of intraplaque hemorrhage. Arteriosclerosis thrombosis Vasc Biol (2005) 25(10):2054–61. doi: 10.1161/01.ATV.0000178991.71605.18
46. Sedding DG, Boyle EC, Demandt JAF, Sluimer JC, Dutzmann J, Haverich A, et al. Vasa vasorum angiogenesis: Key player in the initiation and progression of atherosclerosis and potential target for the treatment of cardiovascular disease. Front Immunol (2018) 9:706. doi: 10.3389/fimmu.2018.00706
47. Ribatti D. The discovery of the placental growth factor and its role in angiogenesis: a historical review. Angiogenesis (2008) 11(3):215–21. doi: 10.1007/s10456-008-9114-4
48. Kivela R, Bry M, Robciuc MR, Rasanen M, Taavitsainen M, Silvola JM, et al. VEGF-b-induced vascular growth leads to metabolic reprogramming and ischemia resistance in the heart. EMBO Mol Med (2014) 6(3):307–21. doi: 10.1002/emmm.201303147
49. Robciuc MR, Kivela R, Williams IM, de Boer JF, van Dijk TH, Elamaa H, et al. VEGFB/VEGFR1-induced expansion of adipose vasculature counteracts obesity and related metabolic complications. Cell Metab (2016) 23(4):712–24. doi: 10.1016/j.cmet.2016.03.004
50. Hagberg CE, Falkevall A, Wang X, Larsson E, Huusko J, Nilsson I, et al. Vascular endothelial growth factor b controls endothelial fatty acid uptake. Nature (2010) 464(7290):917–21. doi: 10.1038/nature08945
51. Hagberg CE, Mehlem A, Falkevall A, Muhl L, Fam BC, Ortsäter H, et al. Targeting VEGF-b as a novel treatment for insulin resistance and type 2 diabetes. Nature (2012) 490(7420):426–30. doi: 10.1038/nature11464
Keywords: diabetes, cardiovascular diseases, DNA methylation, methylated DNA immunoprecipitation, signaling pathway
Citation: Hu S, Chen L, Zeng T, Wang W, Yan Y, Qiu K, Xie Y and Liao Y (2023) DNA methylation profiling reveals novel pathway implicated in cardiovascular diseases of diabetes. Front. Endocrinol. 14:1108126. doi: 10.3389/fendo.2023.1108126
Received: 25 November 2022; Accepted: 02 February 2023;
Published: 15 February 2023.
Edited by:
Gaetano Santulli, Albert Einstein College of Medicine, United StatesReviewed by:
Pawan Kumar Kare, Gandhi Medical College Bhopal, IndiaOscar Lorenzo, Health Research Institute Foundation Jimenez Diaz (IIS-FJD), Spain
Copyright © 2023 Hu, Chen, Zeng, Wang, Yan, Qiu, Xie and Liao. This is an open-access article distributed under the terms of the Creative Commons Attribution License (CC BY). The use, distribution or reproduction in other forums is permitted, provided the original author(s) and the copyright owner(s) are credited and that the original publication in this journal is cited, in accordance with accepted academic practice. No use, distribution or reproduction is permitted which does not comply with these terms.
*Correspondence: Yunfei Liao, yunfeiliao2012@163.com
†Present address: Shengqing Hu, Department of Nuclear Medicine, Union Hospital, Tongji Medical College, Huazhong University of Science and Technology, Wuhan, China