 Muhanad Alhareky
 Jo Max Goodson
 Mary Tavares
 Mor-Li Hartman
- 1Department of Preventive Dental Sciences, Imam Abdulrahman Bin Faisal, College of Dentistry, Dammam, Saudi Arabia
- 2Department of Applied Oral Sciences, the Forsyth Research Institute, Cambridge, MA, United States
- 3The Forsyth Institute, Cambridge, MA, United States
Sweetened beverage consumption is particularly important in countries such as Kuwait, where the prevalence of obesity is high, and most children drink sweetened beverages daily. To assess the relationship between three most commonly consumed beverages, (soda, milk, and juice) and the incidence of obesity among Kuwaiti children at the critical age of 10-12 year, Longitudinal cohort data of 6,305 children on initial presentation in 2012 (age, 10 years) and follow-up in 2014 (age, 12 years) were obtained from the Kuwait Healthy Life Study. The servings for the three beverages (soda, juice, and milk) were calculated as servings per day groups (0, 1-2, and 3 servings/day or more). Multivariate logistic regression was performed to assess the relationship between developing obesity during 2012-2014 and soda, juice, and milk consumption. Model selection was based on clinically relevant covariates and potential confounders using stepwise model selection. Six percent children become obese between baseline and follow-up visits. High soda drinking showed significant association with developing obesity. High milk consumption (more than 3 servings a day) was also significantly associated with developing obesity. Potential confounders included in the final model were age, sex, governorates, and fitness level, of which none were significant confounders or effect modifiers for the association. Children with high soda consumption had significantly higher prevalence of obesity. High obesity prevalence was observed with high milk consumption at a lower significance level but not with high juice consumption.
1 Introduction
The effect of sugar-sweetened beverage (SSB) consumption on obesity development is an increasing healthcare concern (1). Although epidemiological data for adults reveal that sugar consumption is associated with type 2 diabetes (T2D) directly and indirectly (2), limited comparable data are available for children. Obesity and type 2 diabetes have a strong association. The risk and severity of type 2 diabetes are connected to body mass index (BMI). Obese people are seven times more likely to get diabetes than normal-weight people, whereas overweight people are three times more likely (3).
Nutrition evolution, fast socioeconomic developments, and westernization have all had a substantial impact on Kuwaiti adolescents’ lifestyle and dietary preferences during the last few decades, which has led in a significant shift in eating patterns, with fast food becoming an integral component of the Kuwaiti diet (4). Another study on Kuwaiti adolescents proposed the factors of weight gaining would be that Kuwaiti teenagers prefer high-energy snacks such as soft drinks and sugar-sweetened beverages, sweets, chocolate, potato chips, French fries, and fast food, which replace nutritious foods such as vegetables, whole grain products, and milk (5). Adolescents may gain weight if they consume unhealthy snacks instead of main meals on a regular basis.
Kuwait has one of the world’s highest percentage of adults with obesity (6, 7) and diabetes (8, 9). In 2005, a survey showed that 75.5% of Kuwaiti adults were overweight and 42.1% were obese (10), although these percentages were high, the more alarming observation was the rapid increase to 80.4% of overweight individuals and 47% of obese individuals for both sexes after 2 years (11). In 2009 a study reported, 10-14-year-old Kuwaiti children had an overall prevalence of 30.7% and 14.6% with respect to being overweight and obese (12).
In 2015, the World Health Organization (WHO) made several recommendations to reduce sugar intake, mainly because of its role in obesity and dental caries (13). Several studies have examined the relationship between SSB and obesity (14, 15). Soft drinks, in particular, have been assessed because they represent the primary source of added sugar in the diet, accounting for approximately 36% of the total added sugar consumed (16).
The dietary habits of Kuwaitis has major changed because of their lifestyle transformation, particularly after the Gulf War in 1990 (17). Honkala et al. showed that 13-year-old Kuwaiti children consume a higher proportion of soft drink consumption than children from 34 countries participating in their study (18). Approximately 75% of Kuwaiti children in that study consumed soft drinks every day (18). To our knowledge, no longitudinal studies have assessed the effect of beverage consumption of children on obesity development in the Middle East and North Africa (MENA) region (19).
With such an alarming percentage of obesity and high soft drink consumption, this longitudinal cohort study was conducted to assess the relationship between three most commonly consumed beverages, (soda, milk, and juice) and the incidence of obesity among Kuwaiti children over 2 years.
2 Methods
2.1 Subjects and study design
We obtained data of Kuwaiti children enrolled in Kuwait public schools. All participants were Kuwaiti nationals, and only 4th- and 5th -grade Kuwaiti students were included in the study. Participants were selected to represent each of the six Kuwait governorates. All children provided a signed parent/guardian informed consent in Arabic, and assent for adolescents was obtained on the day of the school visit. The first school visit (baseline) occurred in 2012, in which 8,317 students participated. In 2014, 6,316 adolescents from the original sample enrolled in the follow-up visit. Longitudinal data were collected from this second group. Data from 11 subjects were excluded owing to incomplete information, and thus, the final sample size was 6,305 subjects. Both the Dasman Diabetes Institute Ethical Review Committee in Kuwait and the Forsyth Institutional Review Board reviewed and approved the study. The study used a longitudinal observational prospective analysis. We describe further details of the study elsewhere (20–22).
2.2 Beverage scoring
A questionnaire was prepared and administered in Arabic and English via iPads. Children were asked to select what they usually ate and drank with each meal and as a snack. The list of food items was based on responses from a pilot study conducted among 95 Kuwaiti schoolgirls before launching the survey (23). The dietary preference questions included 79 food and beverage items with accompanying pictures, and food selection options were modified to reflect the regularly consumed foods in Kuwait. Interviewers queried the children regarding the food items they usually ate for breakfast, lunch, dinner, and snacks. Following the questions on food preferences, questions on portions were presented, with pictures provided to assess the difference between portion sizes, e.g., one can, two cans, and three or more cans of soda with each meal. At the end of food selection, we asked the children if they preferred diet or regular soda and if they drink flavored or unflavored milk. The beverage for breakfast, lunch, dinner, and snacks was added to give a total number of servings. By this procedure, we obtained total servings per day for each of the three commonly used beverages (soda, juice, and milk). We excluded coffee and tea owing to a minimal number of subjects consuming these beverages. We computed the servings for each of the three beverages (soda, juice, and milk) as servings per day categories (0, 1-2, and 3 servings/day or more). Those who reported 0 serving a day were considered to have no consumption of the beverage. We analyzed consumption of drinks in three categories, i.e., non-consumers (0 serving/day), moderate consumers (1-2 servings/day), and high consumers (≥ 3 servings/day).
2.3 Obesity measurements
During the two visits, both weight and height were measured. Weight (kg) and height (cm) were used to compute the body mass index (BMI) of each participant. At each visit, we categorized the participants as either obese or nonobese utilizing the WHO definition of obesity with the use of BMI Z-score obesity cutoff (24). If the participant had a Z-score higher than 2 standard deviations, they were considered obese. Children were either obese or nonobese at baseline and follow-up. Based on these two visits, participants were placed in one of four groups, i.e., became obese, remained nonobese, remained obese, and became nonobese.
2.4 Data management and statistical analysis
At both visits, the four groups based on obesity status were used to identify children who developed obesity during the study period. The children who were nonobese at baseline and became obese at follow-up were identified as the “became obese group” (Group 1). Children in this group developed obesity during the two-year monitoring period. Children who were nonobese at baseline and remained nonobese at follow-up were identified as the “remained nonobese group” (Group 2). Children who were obese at baseline and remained obese at follow-up were identified as the “remained obese group” (Group 3). Children who were obese at baseline and became nonobese at follow-up were identified as the “became nonobese group” (Group 4). To analyze the effect of age, we divided the children into two groups, i.e., above and below the median age (9.9 years) at baseline visit. Fitness level was measured using the Queens College step test (25) as the increase in heart rate (beats/minute) following a standard exercise. The chi-square test was used to determine the significance level between the children who developed obesity and the other groups combined. Binary group differences in sex, age, and fitness level, along with consumption percentages of different levels of soda, juice, and milk consumed, were tabulated.
We analyzed the association between the three beverages consumed and developing obesity within the two-year study period using univariate logistic regression. The univariate logistic regression analysis was performed to assess the crude association between each beverage and the odds of developing obesity. To identify confounders, the following variables were tested separately using logistic regression based on clinical relevance and possibility of being confounders: age, sex, governorate, blood pressure, fitness level, salivary glucose level, and salivary high-density lipoprotein cholesterol (HDLC) level. None of these variables had an odds ratio (OR) of ≥10% difference compared to the crude association OR with any of the three beverages. We added variables to the stepwise selection model keeping only significant variables at a significance level of p = 0.05. Age, governorate, and fitness level were significant, but sex was not. All other tested variables were not statistically significant and therefore were not added to the completely adjusted multivariate model. We created interaction terms for all variables and found no significant effect modification. We examined the goodness of fit for all of the three beverages using the Hosmer-Lemshow test, and all three were found to have sufficient goodness of fit. The crude and completed adjusted models are found in Table 1. The children who developed obesity (Group 1) were the group of interest. We tested these children against all the other three groups combined. Table 2 demonstrates the crude association and the fully adjusted model for Group 1 against each group separately, first against the “remained nonobese group” (Group 2) alone, followed by the “remained obese group” (Group 3) alone, and finally against the “become a non-obese group” (Group 4) alone. To test the trend between the categories for each beverage in both crude and adjusted models, we used the categorical beverage variable coded as a continuous variable. The p-value was ≤0.05 which showed a statistically significant trend between categories.
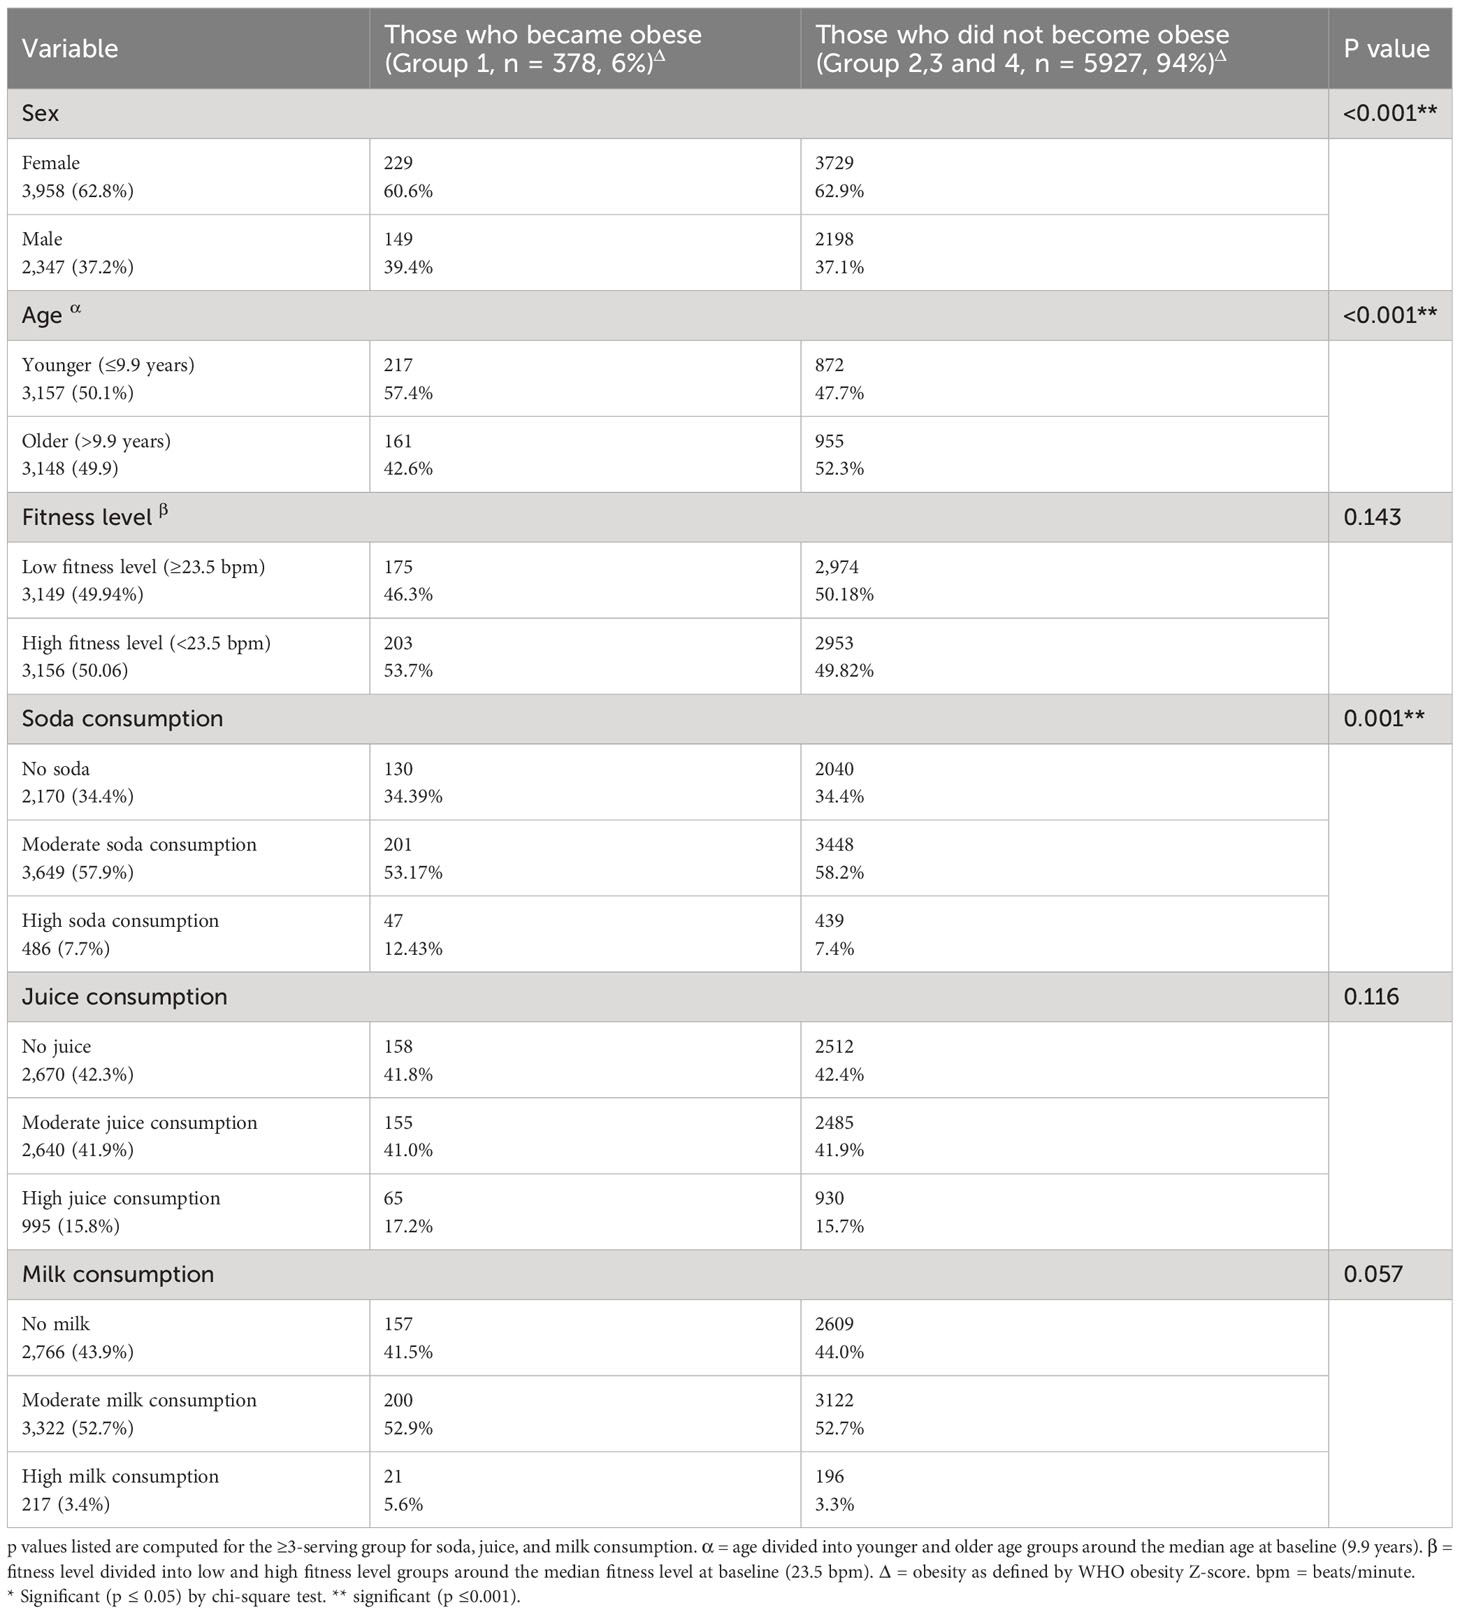
Table 1 Characteristics of Kuwaiti children by obesity change status from 2012 to 2014 using the chi-square test.
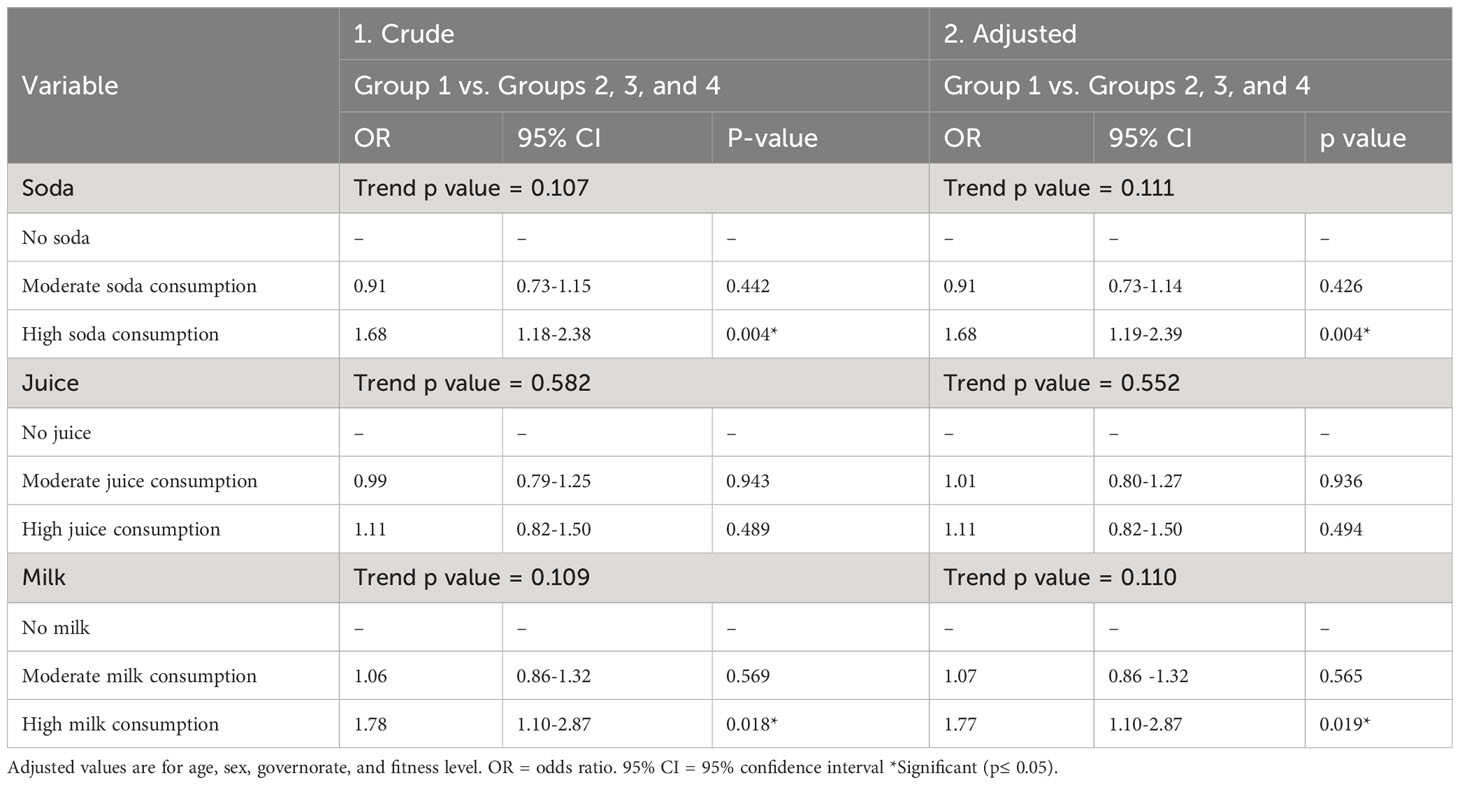
Table 2 Logistic regression model for the relationship between children who developed obesity (Group 1) and those who did not (Groups 2, 3, and 4).
A cross-sectional analysis of the baseline data was conducted using multivariate logistic regression analysis after adjusting for age, sex, governorate, and fitness level to compare it to longitudinal analysis.
3 Results
The study included 6,305 children (Figure 1). At baseline, 4,171 (66.1%) were non-obese and 2,134 (33.9%) were obese. The target population in Group 1 (n = 378, 6%) developed obesity between baseline and follow-up visits. Group 2 (n = 3,793, 60.2%) were non-obese at baseline and remained non-obese at follow-up visit. Group 3 (n = 1,827, 28.9%) were obese at baseline and remained obese at follow-up. Group 4 (n = 307, 4.9%) became non-obese at follow-up.
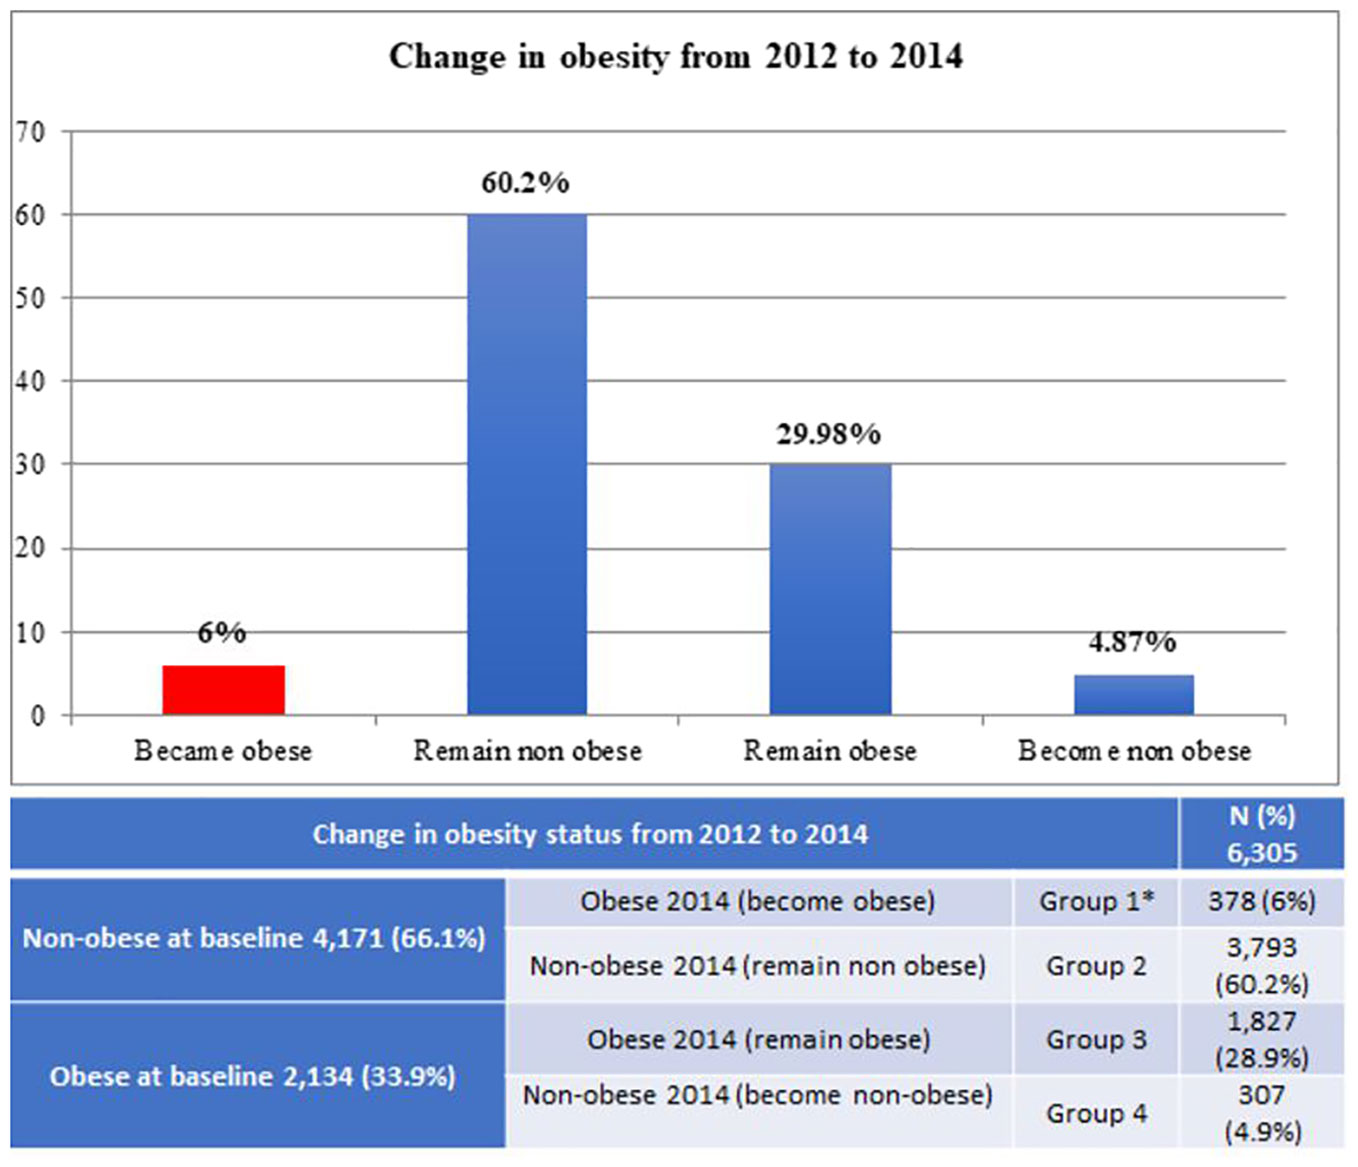
Figure 1 Change in obesity status from 2012 to 2014. Group 1 is the interest group. Children in Group 1 who developed obesity during the two-year study period. We compared the other groups with the interest group. *Interest group.
Table 1 illustrates the characteristics of participants who became obese (Group 1) and those who did not (Groups 2, 3, and 4). Girls from all age groups, and children (boys and girls) less than 9.9 years old had a higher tendency to develop obesity (p < 0.001). Fitness level did not differ significantly between those who developed obesity and those who did not (p = 0.143). We found none of the comparisons of moderate consumption (1-2 servings) of juice and milk to be significantly associated with obesity. Children who developed obesity during the study period reported the highest percentage of individuals with high consumption of soda (12.43% compared to 7.4%, p = 0.001). By this analysis, high milk consumption was also not found statistically significant with the obese. (5.6% compared to 3.3%, p = 0.057). Children consuming juice did not differ significantly in the percentage of becoming obese (17.2% compared to 15.7%, p = 0.116).
The association of the different beverages and the odds of becoming obese (Table 2) demonstrated that participants who reported to have high soda consumption had an OR of 1.68 in becoming obese compared to those who reported without soda consumption (p = 0.004). Subjects who reported high consumption of milk had odds of 1.78 times than that of becoming obese compared to those who reported without milk consumption (p = 0.018). Adjustment for potential confounders did not alter this association between obesity and soda consumption. Milk had a similar effect, as those who reported with high consumption had an OR of 1.77 in becoming obese compared to those who reported with no milk consumption at all (p = 0.019). Consumption of juice (OR = 1.11) did not significantly affect the percentage of children who became obese (p = 0.494).
A comparison of the obese group (Group 1) with each of the other three groups is shown in Table 3. By this analysis, we found that children who reported high soda consumption showed significantly higher odds of being obese than those who reported with no soda consumption for every group comparison. We found the highest odds of becoming obese in those who became obese compared to the children who became non-obese at follow-up (OR = 2.42, p = 0.005). Milk was only significant when we compared children who became obese (Group 1) to children who were nonobese at both visits (OR= 1.87, p = 0.013). We did not find that consumption of milk was significantly associated with any of the other groups. Consumption of juice was also not significantly associated with any group. None of the tests in Table 3 any significant trend.
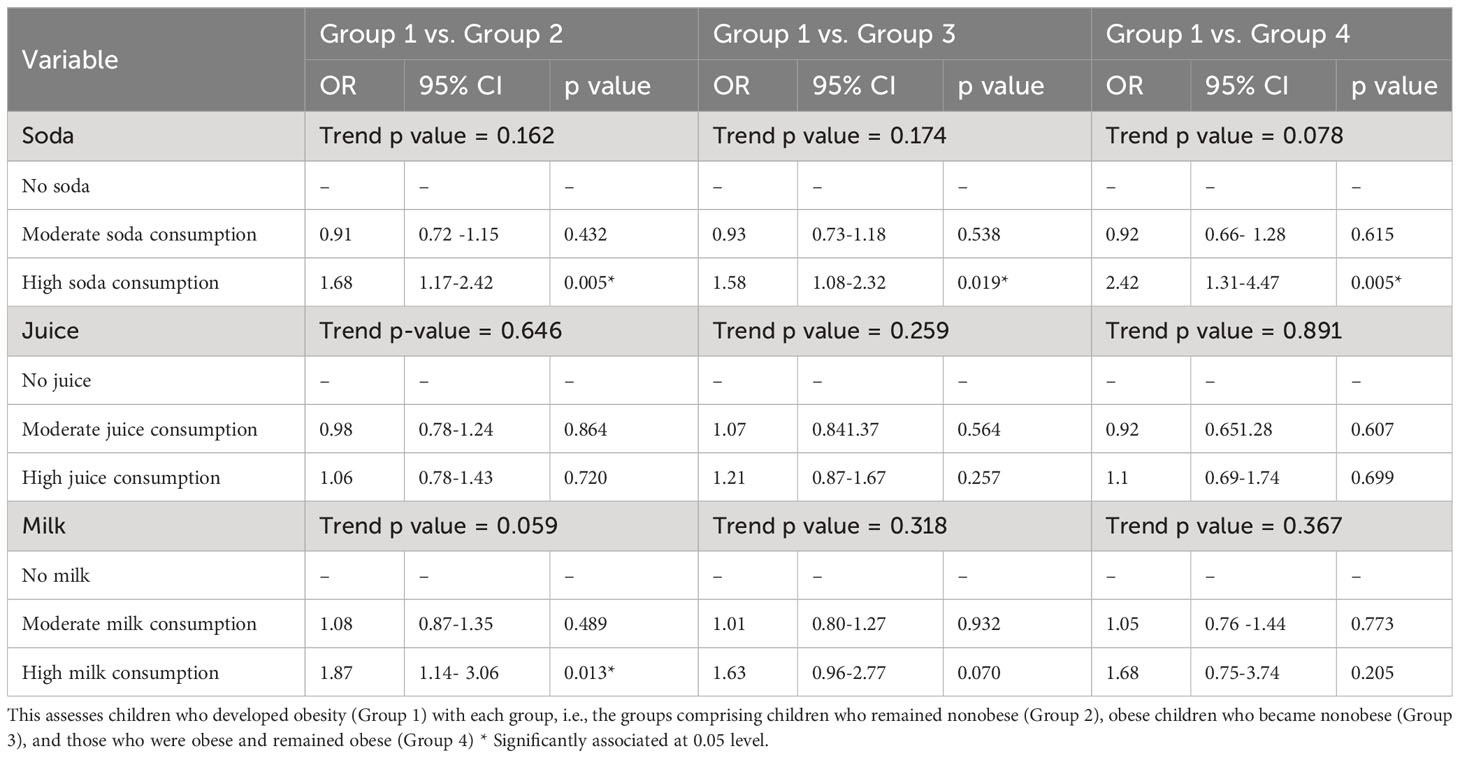
Table 3 The association between consumption of three beverages and developing obesity over a two-year period.
Figure 2 summarizes the association between high consumption of any of the three beverages and the odds of being obese, comparing Group 1 to all and each of the other three groups.
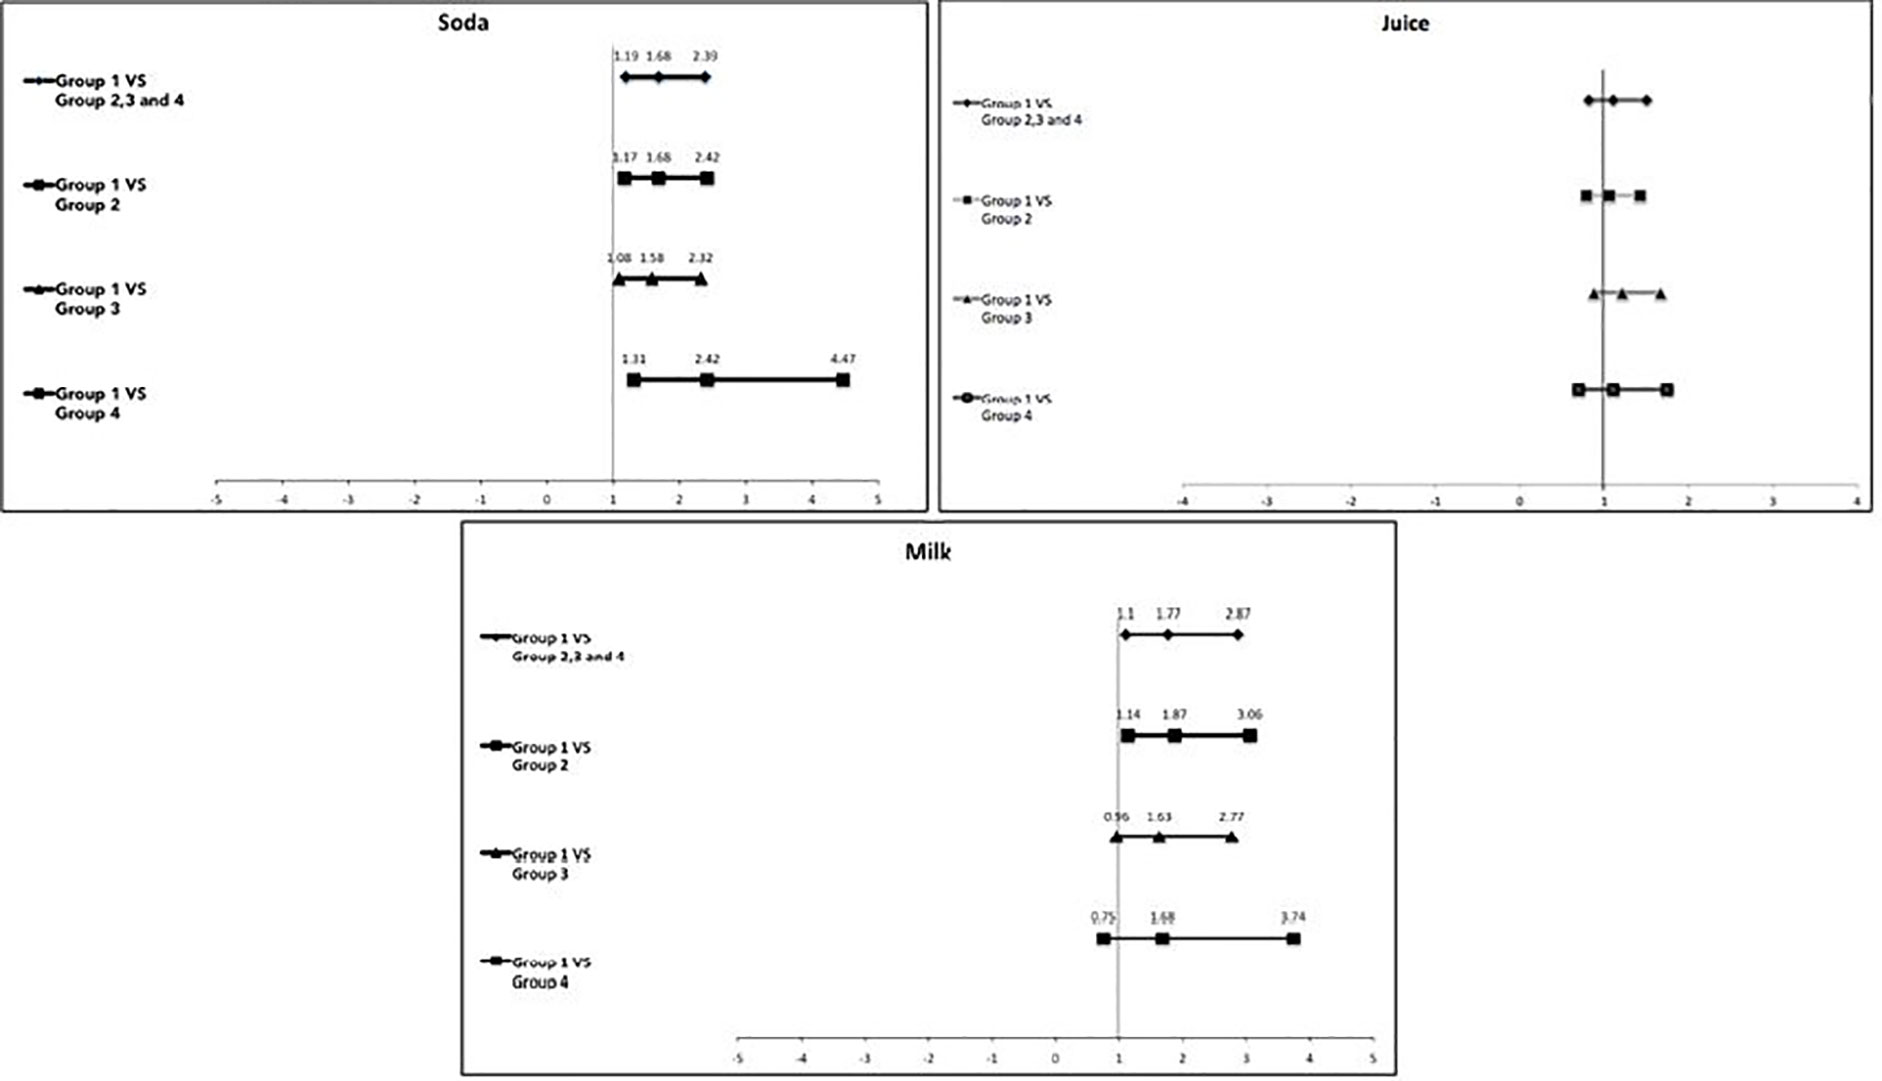
Figure 2 OR and 95% confidence intervals showing the association between high soda, juice, and milk consumption in children who developed obesity (interest group) and all the other three groups. If the bar passes through the solid vertical line, it means there is no significant association. Group 1: Became obese; Group 2: Remained nonobese; Group 3: Remain obese; Group 4: Became nonobese.
4 Discussion
Our findings suggested that soda and to a lesser extent, milk but not juice consumption led to Kuwaiti children becoming obese (Table 1). Only high beverage consumption affected obesity. This association was only evident when we assessed longitudinal data but not cross-sectional data.
As per authors knowledge, this study is the first study to be done on grade 4th and 5th of school going children under big research that looks for salivary biomarkers. Some of the effects described in this analysis were likely associated with the climate in Kuwait. Most longitudinal observational studies are in North American (14, 26–34) and in European countries (35–38). Furthermore, we believe this is the first time that this association has been investigated in one of the MENA countries that have a high prevalence of both sugary drink consumption (18) and (11) obesity. The majority of studies investigating SSB and weight gain in children showed a positive association between the two (15). SSB includes a spectrum of beverages such as sugar-added soft drinks/sodas, energy drinks, flavored juice beverages, sports drinks, coffee and tea with added caloric sweeteners, and electrolyte replacement drinks (39). Some of the studies investigated these beverages combined as one group (14, 29, 31, 35), and some separated these beverages investigating each beverage separately accounting for a different source of sugar (25, 32, 33, 35). We found segregating the beverages to be beneficial as we found juice to be not associated with developing obesity, but soda and milk were. In other studies that segregated different SSB, soda was regularly associated with weight gain more than the other beverages investigated (32, 38). Striegel-Moore et al. (32) found that high soda consumption was the most reliable predictive factor of weight gain compared to other beverages including diet and regular soda, milk, coffee/tea, fruit juice, and fruit-flavored drinks. Viner et al. (38). also showed significant weight gain in children who reported high consumption of soda. Another study on young kids (5 years to 11 years) showed that the high frequency of SSB consumption had a roughly threefold increased chance of being overweight between the ages of 5/6 and 10/11 (40). Our study had the same finding that children with high soda consumption had higher odds of becoming obese. Soda is an excellent source of phosphate in diet, and high phosphate or phosphorus intake association with obesity has been reported in other epidemiological studies (41, 42), but the mechanism is still unclear (43). In our research group, Hartman et al. (44) found in a cross-sectional investigation of 77 children that salivary phosphate was significantly elevated in obese children compared to healthy weight children. Our data suggest that the combination of phosphorus with sugar in soda may synergize in the development of obesity. However, this hypothesis will require further investigation.
In contrast, high milk consumption resulted in children having significantly higher odds in becoming obese but only when the children were compared with those who were nonobese and remained nonobese (Group 2). Our findings concerning milk do not agree with findings from several longitudinal studies on its relationship with weight (45–47). Furthermore, some studies did not find any association between milk and changes in weight (48). On the other hand, our findings were consistent with the findings by Berkey et al. (49) as they found in a longitudinal study on 12,829 US children that drinking 3 or more servings of milk was associated with weight gain. In their findings, they also found that weight gain is attributed to the added calories from the milk because the association attenuated when they adjusted for the total energy intake. Another study on the different age group of children in Kuwait published recently, sweetened beverage consumption was linked to being overweight and having a higher BMI-for-age z score, respectively (19). In our study, we were unable to adjust for the total energy intake to identify if the association between milk and weight gain would remain the same or would disappear. Similar to the suggested contribution of phosphorus in the soda, we also, may suggest as a hypothesis that the fat content in milk in combination with added sugar would have contributed to the association between weight gain and obesity. Strong recommendations to limit sugar intake for adults and children were published by WHO (11) in 2015 due to its widely documented association with obesity and dental caries. We find it valuable to investigate some other ingredients added in some beverages that make them more associated with obesity. Phosphorus in soda beverages and fat in flavored or unflavored milk drinks are two good examples of some of these additives.
Considering that juice consumption is described to be associated with obesity by many (50), it was a surprise that compared to soda and milk, fruit juice was not found to have a significant effect on obesity. However, our findings on fruit juice are in agreement with other studies investigating fruit juice and obesity, Gustavo in 2017 concluded that moderate consumption of fruit juices has a lower risk of metabolic syndrome (51).
A vast majority of studies concerning dietary intake are usually self-reported; therefore, they are subject to reporter accuracy, bias, and recall especially in children and children (52). Our study is no exception, although we believe that using pictures for selection of both the beverages and portion size may help in improving the accuracy. As bottles, cans, and cups come in different sizes, the servings computed in the survey represent a proxy for the expected consumption pattern.
The questions about beverage consumption did not discriminate between regular and diet soda, but in a follow-up question at the end of the survey, children were asked if they chose regular or diet soda, and only 283 children (4.5%) reported drinking diet soda. Hence, we decided to keep these 283 children in the sample due to their small number. Conversely, another research on preschool children to investigate the connection of beverage intake with BMI revealed that higher beverage consumption (Milk, Soda, fruit drinks and fruit juices) correlated with an increase in the children’s overall calorie intake rather than their BMI (53).
Questions regarding milk did not inquire about the type of milk consumed (whole, low fat, skim, flavored, or unflavored). However, at the end of the survey, children were asked if they drink flavored milk and 3,152 (49.9%) children responded positively. Therefore, it is important to include flavored milk (with added sugar) in the milk category.
5 Conclusions
High consumption (3 or more servings) of soda and to a lesser degree, milk but not fruit juice was significantly associated with obesity development in Kuwaiti children, thus clearly indicating that there is more to obesity than simple sugar consumption. Neither high nor moderate juice consumption was significantly associated with obesity. Only high soda or milk consumption (≥3 servings/day) was associated with increased prevalence of obesity. Consumption of moderate amounts of any of these beverages (1-2 servings/day) was not associated with significantly increased prevalence of obesity.
In our results, we were able to find significant association between high soda and high milk (49.9% were flavored milk) consumption with developing obesity in Kuwaiti children. Figure 3 is presenting that the higher consumption of sugar sweetened milk (49.9% were flavored milk) and soda may lead to the obesity.
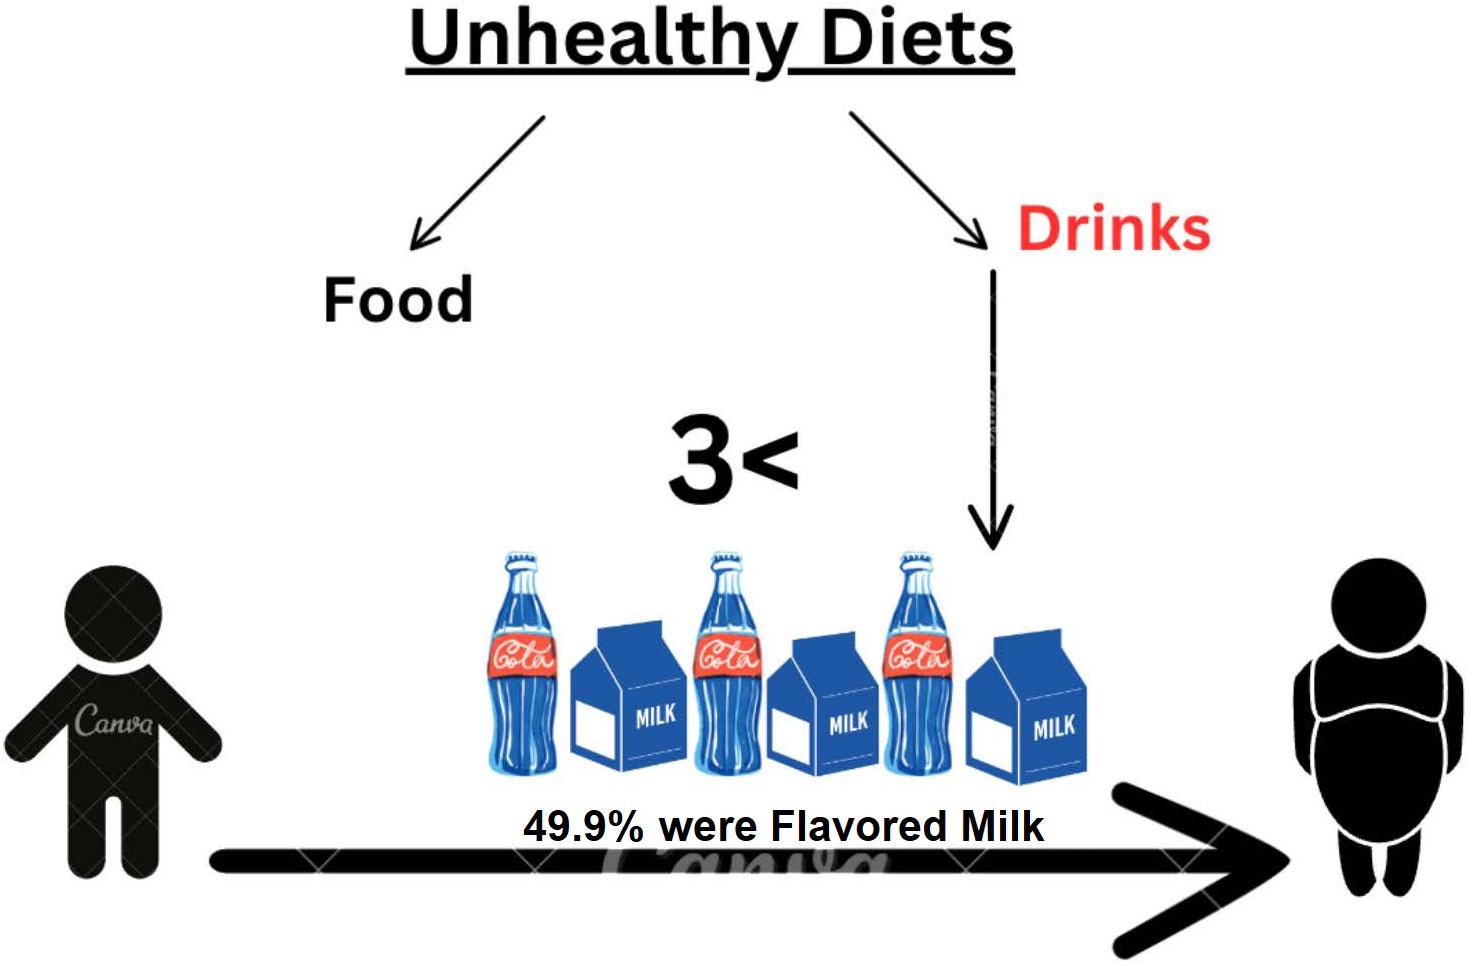
Figure 3 Representation of higher consumption.
Data availability statement
The raw data supporting the conclusions of this article will be made available by the authors, without undue reservation.
Ethics statement
The studies involving humans were approved by Both the Dasman Diabetes Institute Ethical Review Committee in Kuwait and the Forsyth Institutional Review Board reviewed and approved the study. The studies were conducted in accordance with the local legislation and institutional requirements. Written informed consent for participation in this study was provided by the participants’ legal guardians/next of kin.
Author contributions
MA, MH, and JG designed and conducted the study. MA and MT analyzed the data. MA wrote the paper with the assistance of all authors. All authors contributed to the article and approved the submitted version.
Funding
This research was funded by Dasman 10 from the Dasman Diabetes Institute, Dasman, Kuwait.
Acknowledgments
The authors wish to recognize these individuals for helping to conduct the study in Kuwait from 2011 - 2012: Dr Sarah Ahmed, Dr Sumaiah, Dr Yasmeen, Rabab Al Khajah, Massouma Saket, Laila Khaja, Laila Diab, Mariyam Sayer, Nadia, Mahmoud Bader, Amna Ahmed, Eman Adnan, Shymaa Al Fadly. We gratefully acknowledge the participation of dentists Rithna Shajahan, Safura Mohammed, Hemalatha Vasudevaraj, Enas Mahmoud Ismail and Noha Syed Musthafa; nurses Wisam Hassan, Neda Saleh Hamad, Amal Kamel Ebrahim, Abeer Abdul Hameed, Amani Ata’allah, Flavia D. Ferrao, July K. Kunjumon, Reji Thomas, Wedad Al Shamary, Hanady Salem, Asma Al Said, AbdulHameed Said, Bashaer Eid Al Enezin, Jenny Mol Kurian, Laila Hamed Habib, Kholoud Kazem Jaber, Rawan Salem, Halima Malek Hussein, Marwa Ibraheem, Priya, Deslin, Suad Ahmed Al Deyab, Zakiya Abdul Mohsen, Rasha Mohammed, Kawthar Sa’ad Jaber, Afaf Eid Tharesh, Nawal Abdullah, Shaima Syed Mohammed; field coordinators Eman Sayed Khadmi and Fatma Al Fadhli; secretary Raseena Valamvayal; drivers A. K. Jamaluddeen, V. M. Kunhammed, K. K. Basheer and O. T. Shaishad; and setup helpers P. Soopy and Shameer Porayil.
Conflict of interest
The authors declare that the research was conducted in the absence of any commercial or financial relationships that could be construed as a potential conflict of interest.
Publisher’s note
All claims expressed in this article are solely those of the authors and do not necessarily represent those of their affiliated organizations, or those of the publisher, the editors and the reviewers. Any product that may be evaluated in this article, or claim that may be made by its manufacturer, is not guaranteed or endorsed by the publisher.
References
1. Evans CEL. Sugars and health: a review of current evidence and future policy. Proc Nutr Soc (2017) 76:400–7. doi: 10.1017/S0029665116002846
2. Stanhope KL. Sugar consumption, metabolic disease, and obesity: The state of the controversy. Crit Rev Clin Lab Sci (2016) 53(1):52–67. doi: 10.3109/10408363.2015.1084990
3. Gatineau M, Hancock C, Holman N, Outhwaite H, Oldridge L, Christie A, et al. Adult obesity and type 2 diabetes. Oxford: Public Health Engl (2014), 5–14. Available at: https://assets.publishing.service.gov.uk/government/uploads/system/uploads/attachment_data/file/338934/Adult_obesity_and_type_2_diabetes_.pdf.
4. Zaghloul S, Al-Hooti SN, Al-Hamad N, Al-Zenki S, Alomirah H, Alayan I, et al. Evidence for nutrition transition in Kuwait: over-consumption of macronutrients and obesity. Public Health Nutr (2013) 16(4):596–60. doi: 10.1017/S1368980012003941
5. Zafar TA, Alkazemi D. Correlates of food intake and mealtime behaviors among Kuwaiti adolescents. Int J Adolesc Med Health (2022) 34(2):19–30. doi: 10.1515/ijamh-2021-0005
6. Walpole SC, Prieto-Merino D, Edwards P, Cleland J, Stevens G, Roberts I. The weight of nations: an estimation of adult human biomass. BMC Public Health (2012) 12:1. doi: 10.1186/1471-2458-12-439
7. Carlson T. Top 10 Fattest Countries In The World List Gazette Review. Available at: https://gazettereview.com/top-10-fattest-countries-in-world/.
8. ATLAS ID. Kuwait Seventh Edition (2015). Available at: https://www.diabetesatlas.org/upload/resources/previous/files/7/IDF%20Diabetes%20Atlas%207th.pdf.
9. IDF. Atlas, IDF Diabetes. Available at: https://diabetesatlas.org/.
10. Al-Nesf Y KM, El-Shazly MK, Makboul GM, Sadek AA, El-Sayed AM, El-Fararji A. Kuwait STEPS 2006. Kuwait: Kuwait Ministry of Health, GCC, WHO (2006).
11. Al Rashdan I, Al Nesef Y. Prevalence of overweight, obesity, and metabolicsyndrome among adult Kuwaitis: results from community-based national survey. Angiology (2010) 61:42–8. doi: 10.1177/0003319709333226
12. El-Bayoumy I, Shady I, Lotfy H. Prevalence of obesity among adolescents (10 to 14 years) in Kuwait. Asia-Pacific J Public Health (2009) 21(2):153–9. doi: 10.1177/1010539509331786
14. Ludwig DS, Peterson KE, Gortmaker SL. Relation between consumption of sugar-sweetened drinks and childhood obesity: a prospective, observational analysis. Lancet (2001) 357:505–8. doi: 10.1016/S0140-6736(00)04041-1
15. Malik VS, Pan A, Willett WC, Hu FB. Sugar-sweetened beverages and weight gain in children and adults: a systematic review and meta-analysis. Am J Clin Nutr (2013) 98:1084–102. doi: 10.3945/ajcn.113.058362
16. McGuire S. US Department of Agriculture and US Department of Health and human services, dietary guidelines for Americans, 2010. Washington, DC: US government printing office, January 2011. Adv Nutrition: Int Rev J (2011) 2:293–4. doi: 10.3945/an.111.000430
17. Al-Ansari JM, Al-Jairan LY, Gillespie GM. Dietary habits of the primary to secondary school population and implications for oral health. J Allied Health (2006) 35:75–80.
18. Honkala S, Behbehani JM, Honkala E. Daily consumption of sugary drinks and foods as a behavioural risk for health of adolescents in Kuwait. Oral Health Prev dentistry (2012) 15(2):10.
19. Alqaoud N, Al-Jawaldeh A, Al-Anazi F, Subhakaran M, Doggui R. Trend and causes of overweight and obesity among pre-school children in Kuwait. Children (2021) 8(6):524. doi: 10.3390/children8060524
20. Alqaderi H, Tavares M, Hartman M, Goodson J. Effect of sleep and salivary glucose on gingivitis in children. J Dental Res (2016) 95:1387–93. doi: 10.1177/0022034516661509
21. Goodson JM, Shi P, Mumena CH, Haq A, Razzaque MS. Dietary phosphorus burden increases cariogenesis independent of vitamin D uptake. J Steroid Biochem Mol Biol (2017) 167:33–8. doi: 10.1016/j.jsbmb.2016.10.006
22. Goodson JM, Tavares M, Wang X, Niederman R, Cugini M, Hasturk H, et al. Obesity and dental decay: inference on the role of dietary sugar. PloS One (2013) 8:74461. doi: 10.1371/journal.pone.0074461
23. Barake R, Goodson JM, Cucini M, Hasturk H, Soparkar P, Tavares M, et al. Nutrition of Kuwaiti School Girls - Unpublished work. (2012).
24. Onis Md, Onyango AW, Borghi E, Siyam A, Nishida C, Siekmann J. Development of a WHO growth reference for school-aged children and adolescents. Bull World Health Organ (2007) 85:660–7. doi: 10.2471/BLT.07.043497
25. Suriano K, Curran J, Byrne SM, Jones TW, Davis EA. Fatness, fitness, and increased cardiovascular risk in young children. J Pediatr (2010) 157:552–8. doi: 10.1016/j.jpeds.2010.04.042
26. Berkey CS, Rockett HR, Field AE, Gillman MW, Colditz GA. Sugar-added beverages and adolescent weight change. Obes Res (2004) 12:778–88. doi: 10.1038/oby.2004.94
27. Blum JW, Jacobsen DJ, Donnelly JE. Beverage consumption patterns in elementary school aged children across a two-year period. J Am Coll Nutr (2005) 24:93–8. doi: 10.1080/07315724.2005.10719449
28. Carlson JA, Crespo NC, Sallis JF, Patterson RE, Elder JP. Dietary-related and physical activity-related predictors of obesity in children: a 2-year prospective study. Childhood Obes (2012) 8:110–5. doi: 10.1089/chi.2011.0071
29. Laska MN, Murray DM, Lytle LA, Harnack LJ. Longitudinal associations between key dietary behaviors and weight gain over time: transitions through the adolescent years. Obesity (2012) 20:118–25. doi: 10.1038/oby.2011.179
30. Laurson K, Eisenmann JC, Moore S. Lack of association between television viewing, soft drinks, physical activity and body mass index in children. Acta Paediatrica (2008) 97(6):795–800. doi: 10.1111/j.1651-2227.2008.00713.x
31. Mundt CA, Baxter-Jones A, Whiting SJ, Bailey DA, Faulkner RA, Mirwald RL. Relationships of activity and sugar drink intake on fat mass development in youths. Med Sci sports Exercise (2006) 38:1245–54. doi: 10.1249/01.mss.0000227309.18902.fe
32. Newby P, Peterson KE, Berkey CS, Leppert J, Willett WC, Colditz GA. Beverage consumption is not associated with changes in weight and body mass index among low-income preschool children in North Dakota. J Am Dietetic Assoc (2004) 104:1086–94. doi: 10.1016/j.jada.2004.04.020
33. Striegel-Moore RH, Thompson D, Affenito SG, Franko DL, Obarzanek E, Barton BA, et al. Correlates of beverage intake in adolescent girls: the National Heart, Lung, and Blood Institute Growth and Health Study. J Pediatr (2006) 148:183–7. doi: 10.1016/j.jpeds.2005.11.025
34. Vanselow MS, Pereira MA, Neumark-Sztainer D, Raatz SK. Adolescent beverage habits and changes in weight over time: findings from Project EAT. Am J Clin Nutr (2009) 90:1489–95. doi: 10.3945/ajcn.2009.27573
35. Johnson L, Mander AP, Jones LR, Emmett PM, Jebb SA. Is sugar-sweetened beverage consumption associated with increased fatness in children? Nutrition (2007) 23(7):557–63. doi: 10.1016/j.nut.2007.05.005
36. Libuda L, Alexy U, Sichert-Hellert W, Stehle P, Karaolis-Danckert N, Buyken AE, et al. Pattern of beverage consumption and long-term association with body-weight status in German adolescents–results from the DONALD study. Br J Nutr (2008) 99:1370–9. doi: 10.1017/S0007114507862362
37. Olsen NJ, Andersen LB, Wedderkopp N, Kristensen PL, Heitmann BL. Intake of liquid and solid sucrose in relation to changes in body fatness over 6 years among 8-to 10-year-old children: the European Youth Heart Study. Obes facts (2012) 5:506–12. doi: 10.1159/000341631
38. Viner RM, Cole TJ. Who changes body mass between adolescence and adulthood? Factors predicting change in BMI between 16 year and 30 years in the 1970 British Birth Cohort. Int J Obes (2006) 30:1368–74. doi: 10.1038/sj.ijo.0803183
39. CDC. The CDC guide to strategies for reducing the consumption of sugar-sweetened beverages. Atlanta: CDC (2010).
40. Vinke PC, Blijleven KA, Luitjens MHHS, Corpeleijn E. Young children's sugar-sweetened beverage consumption and 5-year change in BMI: lessons learned from the timing of consumption. Nutrients (2020) 12(8):2486. doi: 10.3390/nu12082486
41. Beydoun MA, Gary TL, Caballero BH, Lawrence RS, Cheskin LJ, Wang Y. Ethnic differences in dairy and related nutrient consumption among US adults and their association with obesity, central obesity, and the metabolic syndrome. Am J Clin Nutr (2008) 87:1914–25. doi: 10.1093/ajcn/87.6.1914
42. de Carvalho Pereira D, Lima RPA, de Lima RT, Gonçalves M, de Morais LCSL, Franceschini S, et al. Association between obesity and calcium: phosphorus ratio in the habitual diets of adults in a city of Northeastern Brazil: an epidemiological study. Nutr J (2013) 12:90. doi: 10.1186/1475-2891-12-90
43. Anderson JJ. Potential health concerns of dietary phosphorus: cancer, obesity, and hypertension. Ann New York Acad Sci (2013) 1301:1–8. doi: 10.1111/nyas.12208
44. Hartman M-L, Groppo F, Ohnishi M, Goodson JM, Hasturk H, Tavares M, et al. Can salivary phosphate levels be an early biomarker to monitor the evolvement of obesity. Phosphate Vitamin D Chronic Kidney Disease. 180: Karger Publishers; (2013) 10:138–48. doi: 10.1159/000346793
45. Carruth B, Skinner J. The role of dietary calcium and other nutrients in moderating body fat in preschool children. Int J Obes (2001) 25:559. doi: 10.1038/sj.ijo.0801562
46. Pereira MA, Jacobs DR Jr., Van Horn L, Slattery ML, Kartashov AI, Ludwig DS. Dairy consumption, obesity, and the insulin resistance syndrome in young adults: the CARDIA Study. Jama (2002) 287:2081–9. doi: 10.1001/jama.287.16.2081
47. Skinner JD, Bounds W, Carruth BR, Ziegler P. Longitudinal calcium intake is negatively related to children’s body fat indexes. J Am Dietetic Assoc (2003) 103:1626–31. doi: 10.1016/j.jada.2003.09.018
48. Phillips S, Bandini L, Cyr H, Colclough-Douglas S, Naumova E, Must A. Dairy food consumption and body weight and fatness studied longitudinally over the adolescent period. Int J Obes (2003) 27:1106–13. doi: 10.1038/sj.ijo.0802370
49. Berkey CS, Rockett HR, Willett WC, Colditz GA. Milk, dairy fat, dietary calcium, and weight gain: a longitudinal study of adolescents. Arch Pediatr Adolesc Med (2005) 159:543–50. doi: 10.1001/archpedi.159.6.543
50. Sonneville KR, Long MW, Rifas-Shiman SL, Kleinman K, Gillman MW, Taveras EM. Juice and water intake in infancy and later beverage intake and adiposity: Could juice be a gateway drink? Obesity (2015) 23:170–6. doi: 10.1002/oby.20927
51. Velasquez-Melendez G, Molina M, Benseñor IM, Cardoso LO, Fonseca M, Moreira AD, et al. Sweetened soft drinks consumption is associated with metabolic syndrome: cross-sectional analysis from the Brazilian longitudinal study of adult health (ELSA-Brasil). J Am Coll Nutr (2016) 15(2):1–9. doi: 10.1080/07315724.2016.1191975
52. Livingstone M, Robson P, Wallace J. Issues in dietary intake assessment of children and adolescents. Br J Nutr (2004) 92:213–22. doi: 10.1079/BJN20041169
Keywords: adolescent obesity, beverage, weight, BMI - body mass index, SSB products
Citation: Alhareky M, Goodson JM, Tavares M and Hartman M-L (2024) Beverage consumption and obesity in Kuwaiti school children. Front. Endocrinol. 14:1174299. doi: 10.3389/fendo.2023.1174299
Received: 10 March 2023; Accepted: 17 October 2023;
Published: 11 March 2024.
Edited by:
Yuanyuan Wang, Monash University, AustraliaReviewed by:
Emmanouella Magriplis, Agricultural University of Athens, GreeceAyukafangha Etando, Eswatini Medical Christian University, Eswatini
Sergio Perez-Burillo, Public University of Navarre, Spain
Rahnuma Ahmad, Medical College for Women and Hospital, Bangladesh
Copyright © 2024 Alhareky, Goodson, Tavares and Hartman. This is an open-access article distributed under the terms of the Creative Commons Attribution License (CC BY). The use, distribution or reproduction in other forums is permitted, provided the original author(s) and the copyright owner(s) are credited and that the original publication in this journal is cited, in accordance with accepted academic practice. No use, distribution or reproduction is permitted which does not comply with these terms.
*Correspondence: Muhanad Alhareky, malhareky@iau.edu.sa; Mor-Li Hartman, Morlihartman2000@gmail.com