 Cong Li
 Song Shi
- Department of Otorhinolaryngology, Tongren Hospital, Shanghai Jiao Tong University School of Medicine, Shanghai, China
Aim: Chronic intermittent hypoxia (CIH) is a key characteristic of obstructive sleep apnea (OSA) syndrome, a chronic respiratory disorder. The mechanisms of CIH-induced metabolic disturbance and histopathological damage remain unclear.
Methods: CIH-induced rats underwent daily 8-h CIH, characterized by oxygen levels decreasing from 21% to 8.5% over 4 min, remaining for 2 min, and quickly returning to 21% for 1 min. The control rats received a continuous 21% oxygen supply. The levels of hypersensitive C reactive protein (h-CRP), tumor necrosis factor-α (TNF-α), interleukin 6 (IL-6), interleukin 8 (IL-8), and nuclear factor kappa-B (NF-κB) were measured by ELISA. Histological analysis of the soft palates was conducted using HE staining. The microbial profiling of fecal samples was carried out by Accu16STM assay. Untargeted metabolomics of serum and soft palate tissue samples were analyzed by UPLC-MS. The protein expression of cAMP-related pathways in the soft palate was determined by Western blot.
Results: After 28 h of CIH induction, a significant increase in pro-inflammatory cytokines was observed in the serum, along with mucosal layer thickening and soft palate tissue hypertrophy. CIH induction altered the diversity and composition of fecal microbiota, specifically reducing beneficial bacteria while increasing harmful bacteria/opportunistic pathogens. Notably, CIH induction led to a significant enrichment of genera such as Dorea, Oscillibacter, Enteractinococcus, Paenibacillus, Globicatella, and Flaviflexus genera. Meanwhile, Additionally, CIH induction had a notable impact on 108 serum marker metabolites. These marker metabolites, primarily involving amino acids, organic acids, and a limited number of flavonoids or sterols, were associated with protein transport, digestion and absorption, amino acid synthesis and metabolism, as well as cancer development. Furthermore, these differential serum metabolites significantly affected 175 differential metabolites in soft palate tissue, mainly related to cancer development, signaling pathways, amino acid metabolism, nucleotide precursor or intermediate metabolism, respiratory processes, and disease. Importantly, CIH induction could significantly affect the expression of the cAMP pathway in soft palate tissue.
Conclusions: Our findings suggest that targeting differential metabolites in serum and soft palate tissue may represent a new approach to clinical intervention and treatment of OSA simulated by the CIH.
1 Introduction
Obstructive sleep apnea (OSA) is a chronic respiratory disorder that affects up to 50% of the population, depending on the country, and is prevalent among nearly one billion adults aged 30 to 69 (1). It is characterized by recurrent upper airway obstruction and reduced or even stopped airflow during sleep, and this reduced airflow may lead to intermittent hypoxia and sleep disturbance (2, 3). Current studies have shown that chronic intermittent hypoxia (CIH) is the most critical pathological feature of OSA, which will lead to repeated hypoxia-reperfusion in tissues and organs, cause inflammation and oxidative stress, and eventually induce organ tissue damage (4). Long-term OSA is closely related to the occurrence and development of Alzheimer’s disease (5), coronary atherosclerotic heart disease (6), metabolic disease (7), and cognitive dysfunction (8). Given the OSA-induced damage to various organs and tissues, early diagnosis and intervention are crucial for preventing the further development of OSA. At present, overnight polysomnography is still the gold standard for clinical diagnosis of OSA (9), but due to its high price, long waiting time, discomfort, and induced sleep disturbance, it is still difficult to clinically use it for extensive screening and early diagnosis for OSA patients. In addition to the screening and diagnosis for OSA, the most effective clinical treatment for OSA patients is continuous positive airway pressure (CPAP) (10). Although continuous CPAP therapy for several months can significantly improve their cognitive impairment, the impaired cognitive function has not yet been fully recovered (11). Therefore, finding easy-detected biomarkers with high sensitivity and specificity and key targets for CIH induction is crucial for the prevention and treatment of OSA.
The human gut microbiota is a sophisticated community of microorganisms, and establishing a mutually beneficial relationship with them is crucial for maintaining human health (12). Gut microbiota dysbiosis is widely recognized as a crucial contributor to the pathogenesis of OSA-related diseases. OSA can perturb the gut microbiome and lead to dysbiosis. Specifically, OSA-induced apnea and hypopnea trigger an elevated abundance of anaerobic and facultative anaerobic bacteria and a reduced abundance of obligate aerobic bacteria in the gut microbiota (13). In addition, a causal relationship between gut microbiota and OSA-induced hypertension has been demonstrated by Durgan et al., with an increase in the abundance of the lactate-producing family Coriobacteriaceae and a decrease in the butyrate-producing genus Eubacterium (14). Similarly, Ko et al. reported that patients with OSA-hypopnea syndrome exhibit gut microbiota dysbiosis characterized by a decrease in short-chain fatty acid (SCFA)-producing bacteria and an increase in pathogenic bacteria, with the Ruminococcus enterotype posing the highest risk for OSA patients (15). Long-term OSA can disrupt the diversity and stability of the gut microbiota, leading to a decrease in the abundance of commensal bacteria and an increase in opportunistic pathogens. This process can trigger intestinal inflammation and oxidative stress, ultimately culminating in OSA-associated systemic hypertension, coronary artery disease, obesity, and diabetes mellitus (16). Therefore, modulation of the gut microbiota represents a promising strategy for OSA treatment. Despite the demonstration of dysbiosis in OSA hosts, the underlying mechanisms by which OSA induces changes in the gut microbiota remain incompletely understood.
Metabolomics, a subfield of omics, involves the comprehensive identification and quantification of small-molecule metabolites (with molecular weight <1500 Da) and is widely recognized for its high sensitivity, resolution, and throughput (17). Untargeted metabolomics has proven particularly useful in providing a global overview of endogenous metabolic fluctuations triggered by diseases. Consequently, it has been extensively employed in the identification of metabolite biomarkers for OSA diagnosis and prognosis. For instance, Engeli et al. (18) reported significantly higher levels of endocannabinoids in the plasma of OSA patients compared to obese individuals without OSA. Among these endocannabinoids, anandamide exhibited greater effects on blood pressure in OSA patients than obesity, insulin resistance, and inflammation, thereby serving as a potential marker for cardiovascular event risk prediction in OSA patients. Similarly, Ezzedini et al. (19) demonstrated that children with OSA had lower levels of palmitoleic acid and oleic acid but higher levels of stearic acid in tonsil tissue relative to children with chronic tonsillitis. Moreover, they identified a positive correlation between the content of oleic acid in tonsil tissue and body mass index, snoring, and tonsil hypertrophy. These findings provide a compelling rationale for implementing further metabolomic analyses to identify OSA-related biomarkers.
In this study, CIH induction was used to simulate OSA in rats, and the typical characteristics of rats after CIH induction were analyzed. Feces were collected from rats to analyze their gut microbial composition, followed by serum and soft palate tissue metabolic profiles associated with CIH. Key KEGG-enriched pathways in tissue metabolic profiles were selected for further expression validation to explore possible mechanisms of CIH-simulated OSA.
Compared with previous related research reports, the microbiome profiling of CIH-simulated OSA rats was analyzed innovatively using absolute quantitative analysis technology. Furthermore, an integrated metabolomic analysis of both serum and soft palate tissue revealed typical differential metabolites that could reflect the characteristics of OSA, and the cyclic adenosine monophosphate (cAMP) pathway might be a key target for differences in soft palate histopathology.
2 Materials and methods
2.1 Animal treatments
All experimental procedures were conducted in strict accordance with the Institutional Animal Use and Care Committee guidelines of the Second Military Medical University (approval number 2022-010). Six-week-old male Sprague-Dawley rats (170 ± 2 g) were randomly assigned to two groups, each consisting of 5 rats, and housed in polycarbonate cages. Rats were provided with standard food and water and maintained on a 12-h light/dark cycle. The CIH group rats were exposed to intermittent hypoxia using plastic cages equipped with intermittent hypoxia devices for 8 h per day, with CIH being performed during the 12-h light cycle to align with the animals’ sleep cycle. CIH rats were subjected to CIH for 28 consecutive days in 8-h daily cycles from 9:00 a.m. to 5:00 p.m. During each cycle, the internal oxygen concentration was reduced from 21% to 8.5% over 4 min and maintained at this level for 2 min. The oxygen concentration was then rapidly restored to 21% for 2 min and maintained at this level for 1 min. Animals in the control group were housed in the same chamber but were provided with a constant flow of 21% oxygen. At the end of the experimental period, blood samples were collected from the rats via orbital bleeding, and the rats were subsequently euthanized. The soft palate tissues were swiftly harvested on ice, rinsed with deionized water, and dried using filter paper. These tissues were then promptly stored at -80°C. Simultaneously, sterile collection of rat colon feces was carried out and stored at -80°C.
2.2 Biochemical parameters
Partial blood samples from the rats were collected into blood collection tubes. Within 30 min, the samples were centrifuged at 4°C and 3000 rpm for 15 min. The obtained rat serum samples (300 μL) were stored at -80°C. Commercially available assay kits (Thermo Fisher Scientific, Waltham, MA, USA) were used to measure the levels of various biomarkers in the serum, including hypersensitive C reactive protein (h-CRP), tumor necrosis factor-α (TNF-α), interleukin 6 (IL-6), interleukin 8 (IL-8), and nuclear factor kappa-B (NF-κB). Briefly, 50 μL of diluted samples (diluted 5 times) were added to antibody-coated microplates, followed by the addition of 100 μL of enzyme-labeling reagents. The plates were then incubated at 37°C for 60 min. After washing, chromogenic substrates were added, and the plates were incubated at 37°C in the dark for 15 min. The reaction was terminated, and the absorbance values for each well were determined.
2.3 Histology analysis
Soft palate tissues from both groups of rats underwent a series of processing steps. They were dehydrated, fixed with formalin, and later embedded in paraffin. Following this, the paraffin-embedded tissues were cut into sections after drying at 60°C for 30-60 min. These tissue sections were then subjected to transparent using xylene for 15 min, followed by treatment with various ethanol concentrations. Subsequently, Hematoxylin and Eosin (H&E) staining to assess the histological alterations in the soft palate mucosa and muscles was conducted.
2.4 Microbiome profiling for absolute quantification of 16S rRNA amplicon sequencing
The Accu16STM (Accurate 16S absolute quantification sequencing) assay was performed by Genesky Biotechnologies Inc. (Shanghai, China). Briefly, genomic DNA was extracted from cecal contents using the FastDNA SPIN Kit (MP Biomedicals, San-ta Ana, CA) according to the manufacturer’s instructions. The integrity, concentration, and purity of the genomic DNA were assessed using agarose gel electrophoresis, Nanodrop 2000 (ThermoFisher Scientific, Waltham, MA, USA), and Qubit3.0 Spectro-photometer (ThermoFisher Scientific, Waltham, MA, USA), respectively. To enable absolute quantification, spike-ins with conserved regions similar to natural 16S rRNA genes but with variable regions replaced by random sequences (~40% GC content) were artificially synthesized. A mixture of spike-ins with known gradient copy numbers was added to the sample DNA. The V3-V4 hypervariable regions of the 16S rRNA gene and spike-ins were amplified using primers 341F (5-CCTACGGGNGGCWGCAG-3) and 805R (5-GACTACHVGGGTATCTAATCC-3), respectively. Subsequently, the amplified products were sequenced using the Illumina NovaSeq 6000 sequencer (San Diego, CA, USA).5.4.2 Illumina read data processing and analysis.
The raw read sequences were processed using QIIME2. The cutadapt plugin was used to trim adaptor and primer sequences. Quality control and identification of amplicon sequence variants (ASVs) were performed using the DADA2 plugin. Taxonomic assignments of ASV representative sequences were conducted with a confidence threshold of 0.8 using a pre-trained Naive Bayes classifier trained on the RDP (version 11.5). Next, the spike-in sequences were identified, and reads were counted. A standard curve was generated for each sample, correlating read counts with spike-in copy numbers. The absolute copy number of each ASV in each sample was calculated based on the read counts of the corresponding ASV. Since the spike-in sequence was not part of the sample’s native microbiota, it was removed in subsequent analyses to focus on the analysis of the sample’s microbiota.
2.5 Untargeted metabolomics
Serum and soft palate tissue samples were analyzed using a Thermo Q Exactive mass spectrometer coupled with a Thermo Vanquish UPLC system (Thermo Fisher Scientific, Waltham, MA, USA). Chromatographic separation was performed on an ACQUITY UPLC® HSS T3 column (2.1 mm × 150 mm, 1.8 μm; Waters, Milford, MA, USA) at a temperature of 40°C. For positive-ion mode elution, a mobile phase consisting of 0.1% formic acid in acetonitrile (C) and 0.1% formic acid in water (D) was used at a flow rate of 0.25 mL/min. In negative-ion mode, the mobile phase consisted of acetonitrile (A) and 5 mM ammonium formate in water (B) at the same flow rate. The gradient elution program was as follows: (1) for positive mode: 0-1 min, 2% C; 1-9 min, 2%-50% C; 9-12 min, 50%-98% C; 12-13.5 min, 98% C; 13.5-14 min, 98%-2% C; 14-20 min, 2% C; (2) for negative mode: 0-1 min, 2% A; 1-9 min, 2%-50% A; 9-12 min, 50%-98% A; 12-13.5 min, 98% A; 13.5-14 min, 98%-2% A; 14-17 min, 2% A.
The mass spectrometry analysis was performed using a high-resolution Thermo Q Exactive mass spectrometer. The primary full scan was conducted at a resolution of 70000, scanning the range of m/z 81-1000. High-energy collision dissociation (HCD) with a collision voltage of 30% was used for secondary fragmentation. The secondary resolution was set to 17500, and the top 10 samples were selected for collection. Dynamic exclusion was implemented to avoid redundant information. Electrospray ionization (ESI) in both positive-ion and negative-ion modes was used, with a spray voltage of 3.50 kV for the positive mode and 2.50 kV for the negative mode. Sheath gas and auxiliary gas were employed to aid the ionization process, and the capillary temperature was set to 325°C.
2.6 Western blotting assay
Western blotting analysis was carried out as reported previously by our lab (20). Briefly, after the total protein of soft palate tissues was extracted and separated, the samples were transferred onto a polyvinylidene fluoride (PVDF) membrane. Following washing, the membrane was incubated overnight at 4°C with primary antibodies against cAMP (1:1000, Abcam, ab76238), protein kinase A (PKA) (1:1000, Abcam, ab75991), cAMP-regulated guanine nucleotide exchange factor II (Epac2) (1:1000, Abcam, ab193665), rat sarcoma protein (Ras) (1:1000, Abcam, ab52939), c-Jun N-terminal kinase 1/2 (JNK1/2) (1:1000, Abcam, ab4821), Annexiv V (1:500, Abcam, ab14196), GAPDH (1:1000, Abcam, ab8245), and Tubulin (1:1000, Abcam, ab44928). After washing, the membrane was incubated with a horseradish peroxidase (HRP)-conjugated secondary antibody for 30 min at room temperature, followed by color development using a mixed solution. The image analyzer quantitative system was used to quantitatively determine the intensity of the target and reference proteins.
2.7 Statistical analysis
The statistical data were presented as the mean ± standard deviation. Group comparisons were performed by Student’s t-test, and p < 0.05 was applied for statistical significance. In sequencing data, inter-group microbial diversity indices in colon fecal samples were assessed using the Wilcoxon rank-sum test (p < 0.05 for significance). The Bonferroni method to correct p values for multiple hypothesis testing was applied to evaluate whether there were significant differences in species diversity between groups. Wilcoxon rank-sum tests were employed to compare the bacterial abundances at the phylum and genus levels between the two groups, with p < 0.05 as the threshold for significant differences. Pearson correlation analysis was used to calculate Pearson correlation coefficients between species, and species with p < 0.05 were selected to construct a network of dominant species associations. Non-parametric Kruskal-Wallis rank-sum tests were utilized to screen for species with significantly different relative abundances between different groups. Subsequently, paired Wilcoxon rank-sum tests were conducted for inter-subgroup differential analysis. Lastly, linear discriminant analysis (LDA) was used to evaluate the effect values of significantly different species (|LDA| > 2, p < 0.05). Differences in KEGG abundance between the two groups were compared using Wilcoxon analysis (p < 0.05 for significance). *, p < 0.05; **, p < 0.01; ***, p < 0.001; ****, p < 0.0001; ns, not significant.
3 Results
3.1 Effect of CIH induction on serum pro-inflammatory cytokines and soft palate tissue
It has been reported that long-term CIH can promote a sharp increase in the levels of pro-inflammatory cytokines, resulting in a systemic inflammatory state (21). Serum biochemical analysis showed that the levels of typical pro-inflammatory cytokines were significantly increased in the serum of rats exposed to CIH for 28 days, including h-CRP, TNF-α, IL -6, IL-8, and NF-κB (Figures 1A–E). Additionally, CIH induction contributed to the increased thickness of the soft palate mucosa with enlarged (yellow dotted box) and irregularly arranged squamous epithelial cells and loose connective tissue architecture (yellow arrow) (Figure 1F). Simultaneously, the significantly hyperplastic and hypertrophic soft palate glands infiltrated extensively into the muscles, resulting in the destruction and atrophy of the oropharyngeal muscles (yellow arrow) (Figure 1G). Our results showed that CIH induction could significantly induce the body’s inflammatory response, stimulate soft palate mucosal thickening and soft palate gland hyperplasia, and affect the expansion of the upper airway.
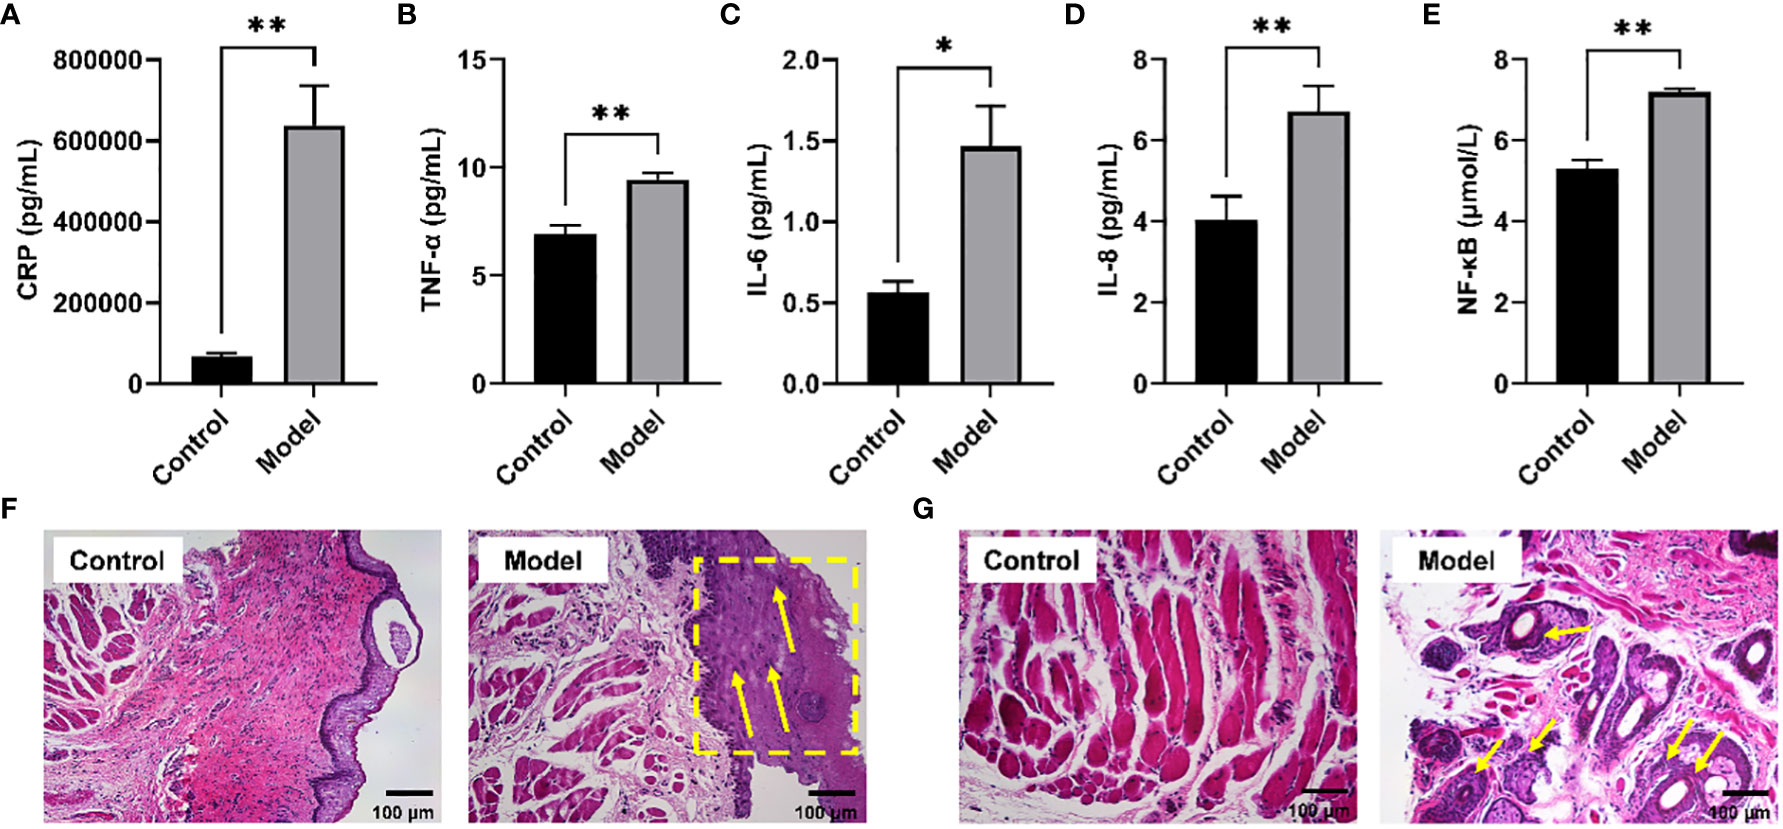
Figure 1 CIH induction increased typical pro-inflammatory mediators in serum and disrupted the morphological structure of the soft palate tissue. (A) CRP. (B) TNF-α. (C) IL-6. (D) IL-8. (E) NF-κB. (F, G) Histological analysis of mucosa and connective tissue. CIH, chronic intermittent hypoxia. The asterisk represents a significant difference between the two groups. *, p <0.05; **, p < 0.01.
3.2 Effect of CIH induction on gut microbial diversity and bacterial composition
Clinical studies have confirmed the presence of intestinal microbiota imbalance in OSA patients (22), and dysbacteriosis is considered to be a causative factor in the development of various complications associated with OSA (23). Given these reports, the gut microbial diversity and bacterial composition of CIH-induced rats were analyzed. The Accu16STM bacteria absolute quantitative high-throughput sequencing method was utilized to sequence the microbiota in fecal samples of rats, because this could reflect the real number of each microorganism in the sample and the real difference between the samples in the group (24). As shown in Figures 2A–D, Chao1, and ACE indexes, reflecting the community richness, were significantly increased in the CIH-induced group (Model group). Moreover, Shannon and Simpson indexes, reflecting the community diversity, were noticeably increased and decreased, respectively, in the Model group. This result revealed that CIH induced a significant difference in the α-diversity of gut microbiota. The Venn diagram (Figure 2E) showed 643 mutual OTUs in the Model and Control groups, and 656 and 631 peculiar OTUs in the two groups, respectively. The Partial least squares discrimination analysis (PLS-DA) analysis, which reflects β-diversity (Figure 2F), demonstrated a clear differentiation in the gut microbial community between the Model and Control groups, indicating a complete separation.
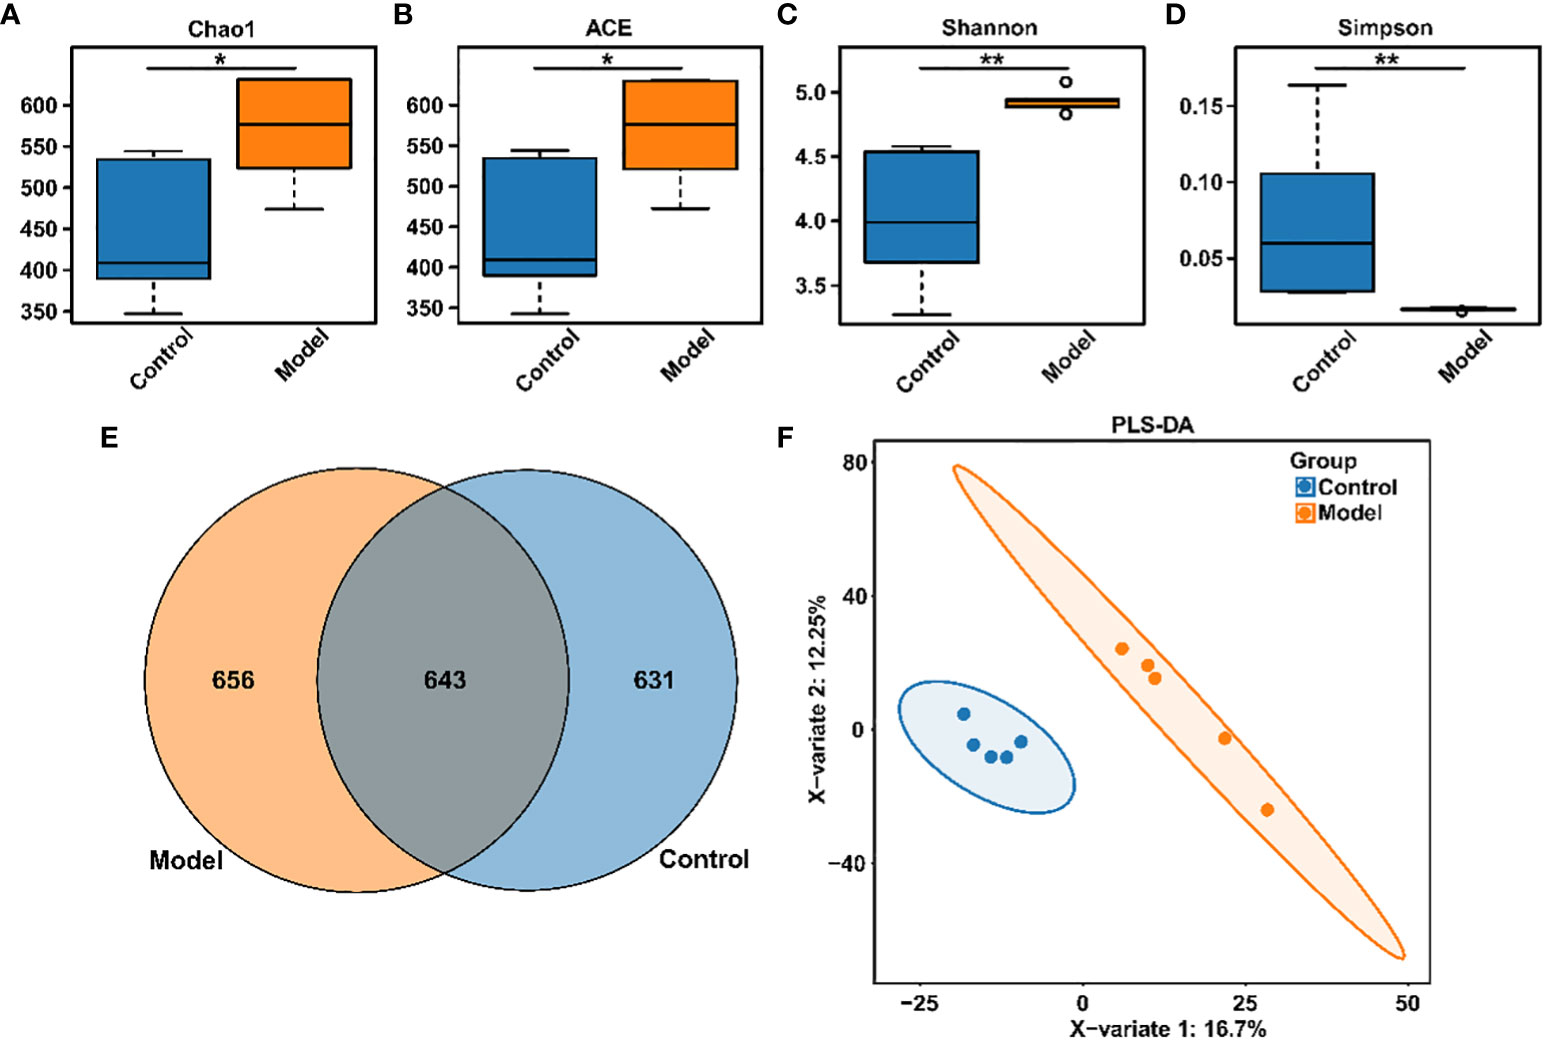
Figure 2 CIH induction altered gut microbiota diversity in rats. (A) Chao1 index. (B) ACE index. (C) Shannon index. (D) Simpson index. (E) Venn diagram. (F) PLS-DA diagram. The asterisk represents a significant difference between the two groups. *, p <0.05; **, p < 0.01.
The distribution of rat fecal microbiota was determined at both the phylum and genus levels to evaluate the potential impact of CIH induction on the gut microbiota. The results obtained from the preliminary composition analysis are presented in Figure 3. As could be seen from Figure 3A, Firmicutes and Bacteroidetes were the dominant bacteria at the phylum level, contributing to 49.47% and 34.92% of the total microbiota in the Model group, and 53.39% and 42.77% of total microbiota in the Control group, respectively. Additionally, a significant difference was observed in the Firmicutes/Bacteroidetes (F/B) ratio between the Model and Control groups. Further analysis showed that the absolute abundance of Actinobacteria and Proteobacteria of the Model group was greatly higher than that of the Control group. Interestingly, Verrucomicrobia was only observed in the Model group. At the genus level, the composition of rat fecal microbiota greater than 1% is shown in Figure 3B. The top ten fecal genera were Bacteroides, Lactobacillus, Parabacteroides, Oscillibacter, Romboutsia, Alloprevotella, Akkermansia, Blautia, Clostridium_IV, Prevotella, and their absolute abundance accounted for over 60%. However, significant differences were observed in the absolute abundance of microbial genera between the Model and Control groups, as depicted in Figure 3C. Specifically, CIH induction remarkably decreased the absolute abundance of Bacteroides, Lactobacillus, and Prevotella, and significantly increased the absolute abundance of Parabacteroides, Oscillibacter, Romboutsia, Alloprevotella, Akkermansia, and Clostridium_IV. Spearman correlation analysis based on the absolute abundance revealed the presence of antagonistic or synergistic effects among various microbial genera in rats from both the Model and Control groups, as illustrated in Figure 3D. In addition to top genera, linear discriminant analysis (LDA) revealed that the intestinal microbiota of rats in the model group specifically and significantly enriched Dorea, Oscillibacter, Enteractinococcus, Paenibacillus, Globicatella, and Flaviflexus genera (Figure 4A).
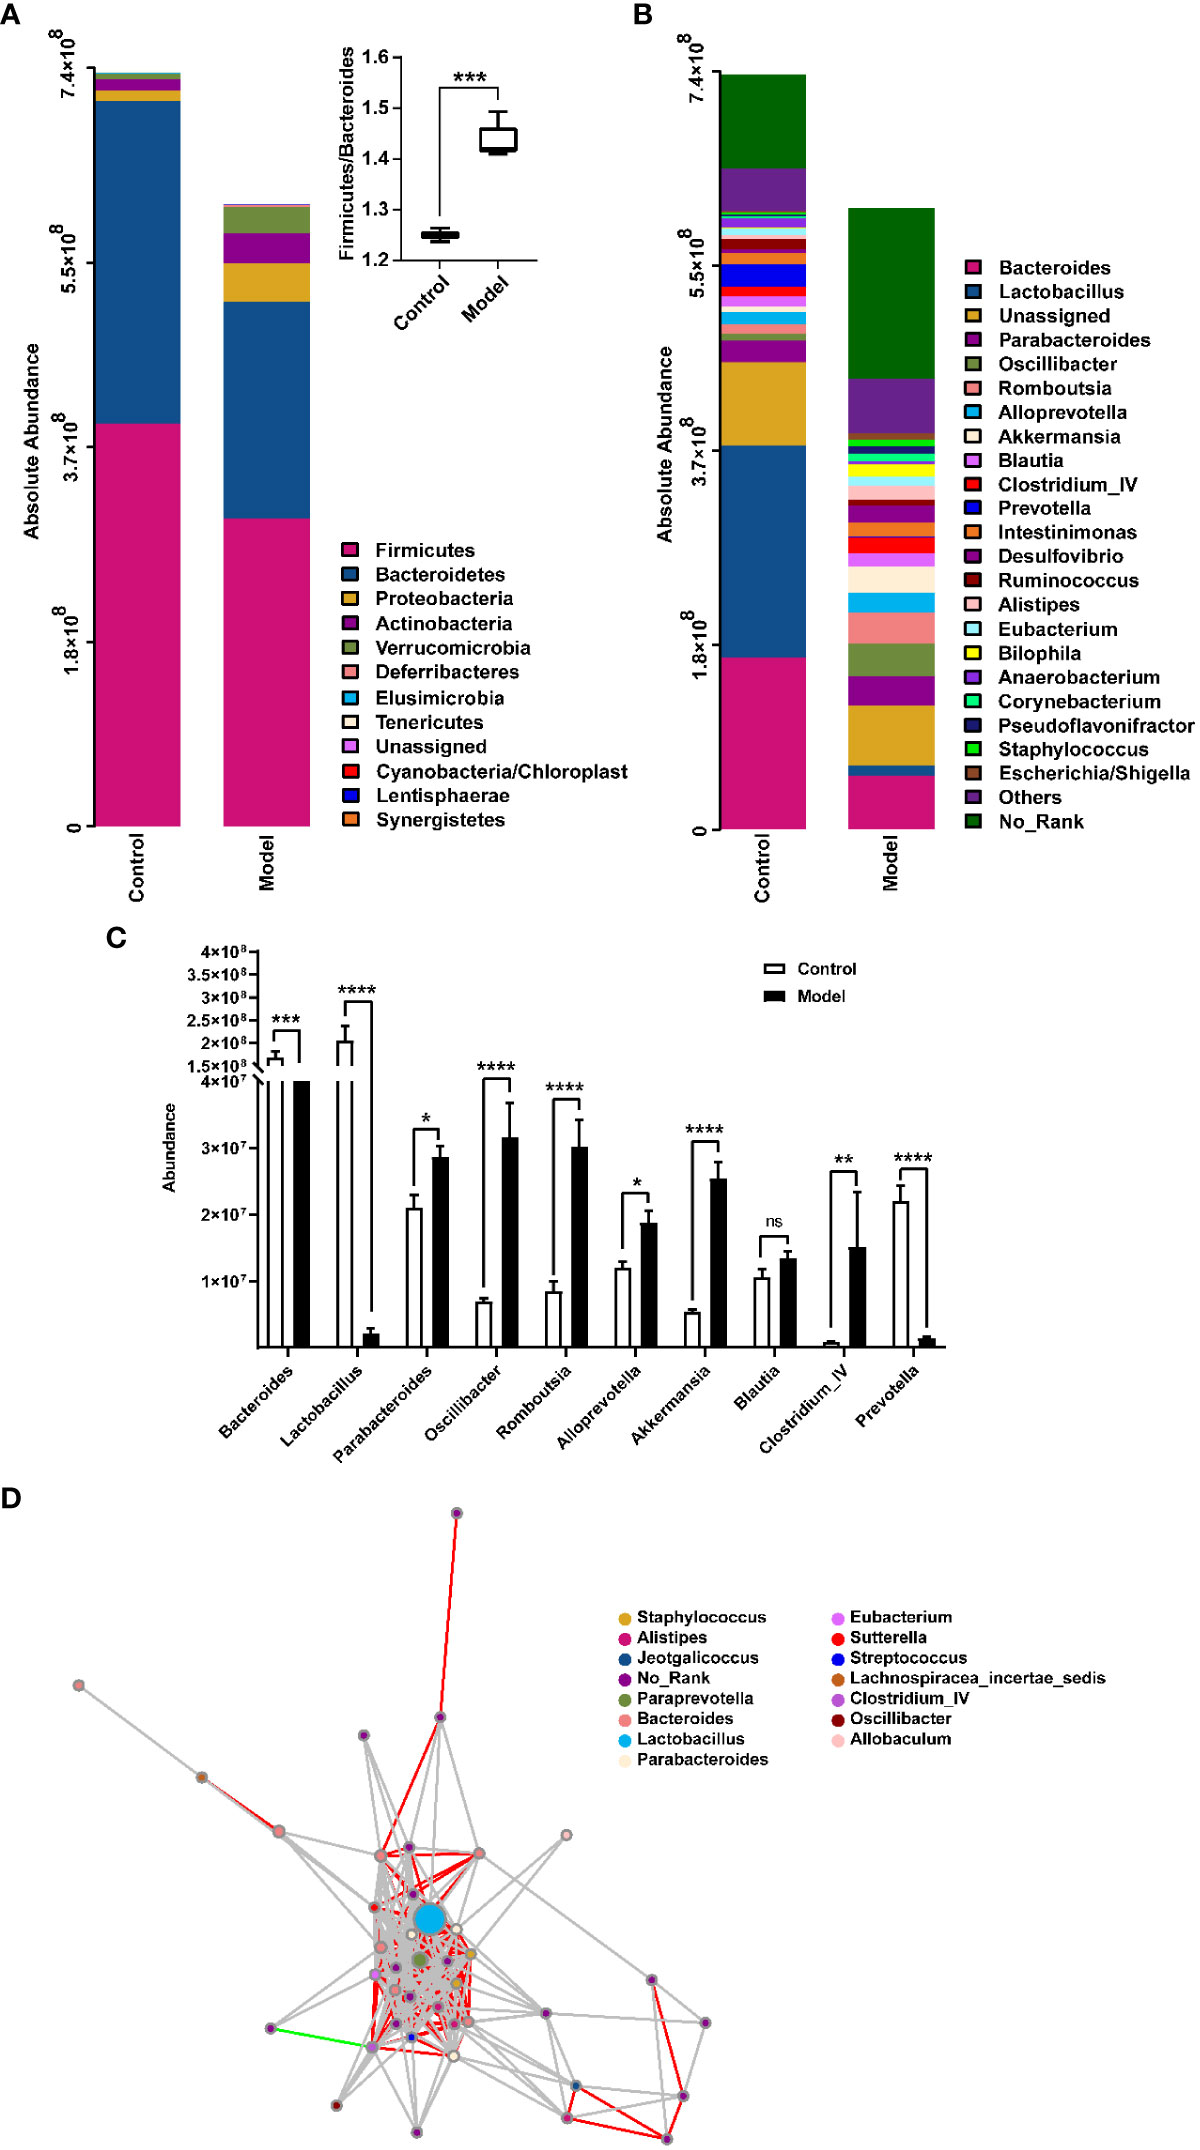
Figure 3 Histograms showing the relative distribution of gut microbiota in rat fecal samples were analyzed at the phylum (A) and genus (B) levels, indicating that CIH induction resulted in significant alterations in the composition and distribution of gut microbiota. (C) Quantitative abundance analysis of top 10 genera in rat fecal gut microbes. (D) A microbial interaction network diagram at the genus level was constructed based on Spearman correlation analysis. Each dot represents a species, and the size of the dot reflects its abundance. Different colors represent different species. Strong positive correlations (rho ≥ 0.6) are represented by red lines, strong negative correlations (rho ≤ -0.6) are represented by green lines, and weak correlations (|rho| < 0.6) are represented by gray lines. Color-coded annotations are based on the genus level. CIH, chronic intermittent hypoxia. The asterisk represents a significant difference between the two groups. *, p < 0.05; **, p < 0.01; ***, p < 0.001; ****, p < 0.0001. ns, not significant.
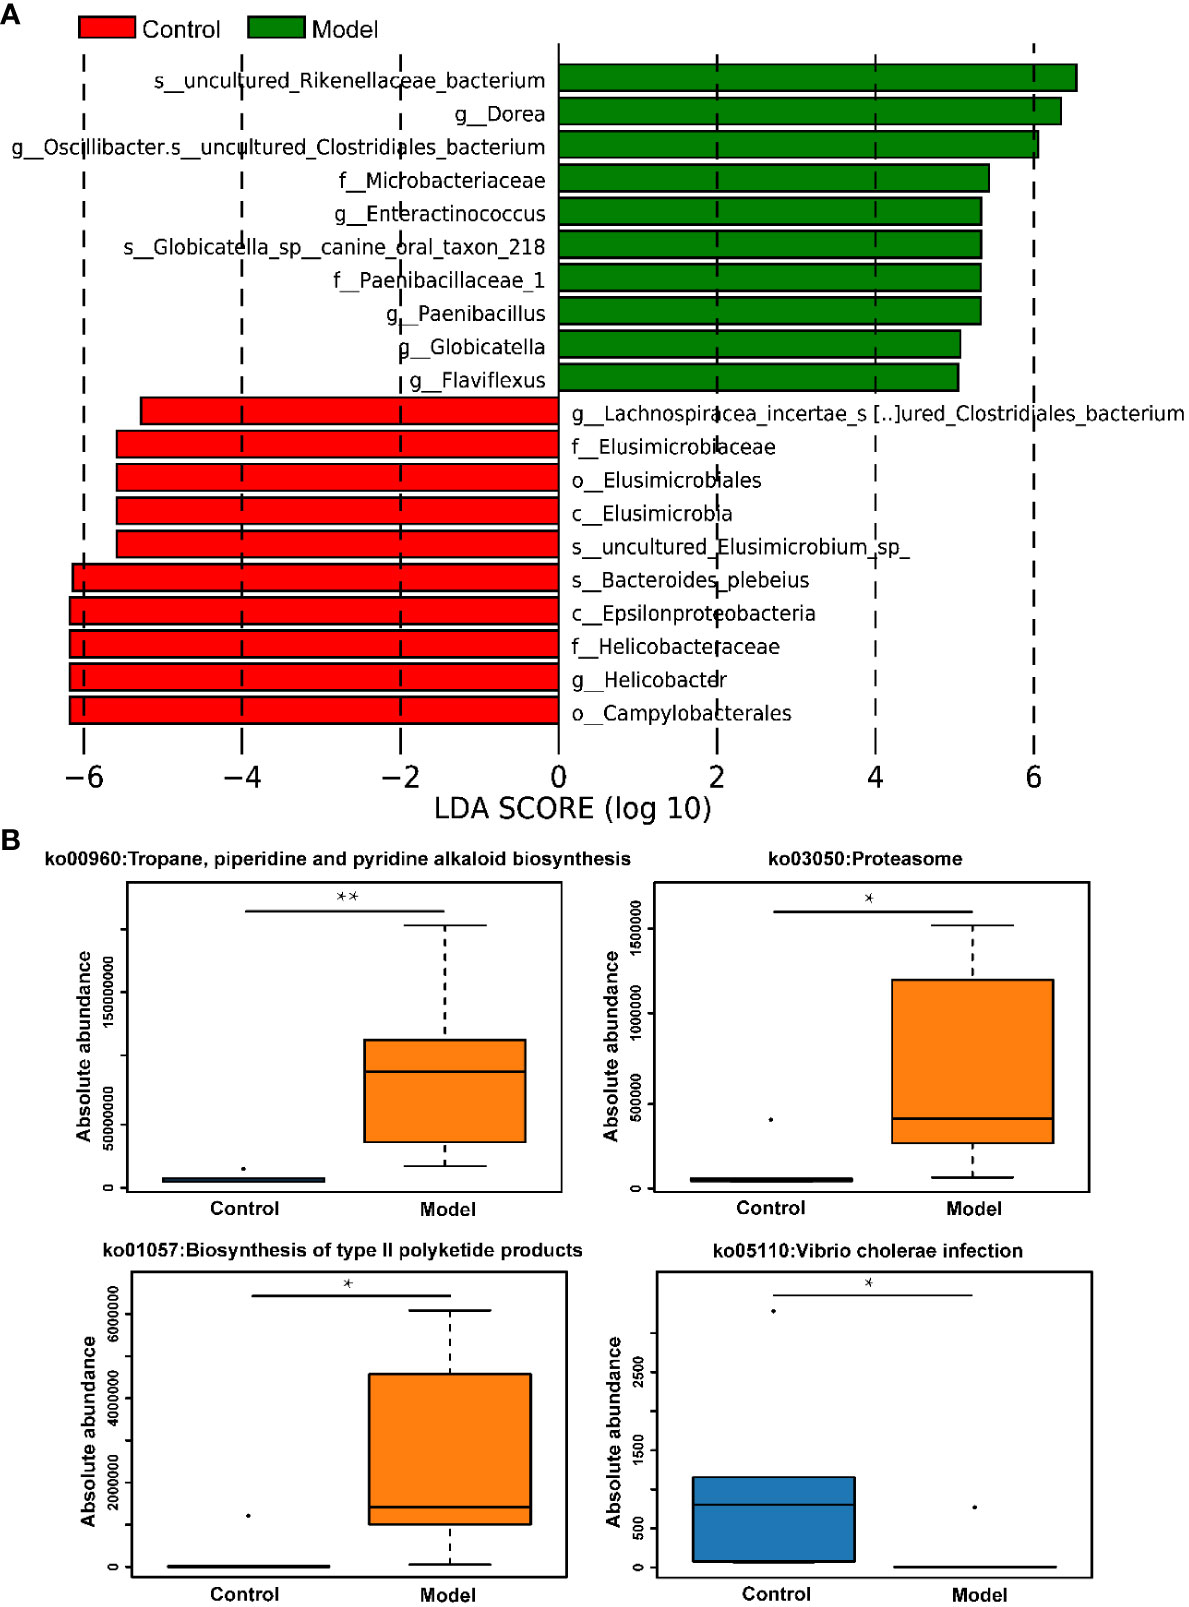
Figure 4 CIH induction specifically enriched certain gut microbes and regulated metabolic pathways of gut microbiota. (A) LDA discriminant histogram of the top 10 bacteria with the greatest diversity in enrichment. Bars of different colors represent different species with an LDA score (log10) greater than 4 in different groups and significantly high abundance in this group, and the length of the bar represents the value of the LDA score. (B) KEGG pathway enrichment analysis. The asterisk represents a significant difference between the two groups. *, p <0.05; **, p < 0.01.
In addition to assessing changes in the absolute abundance of microorganisms in rat feces, the effects of CIH induction on KEGG pathways involved in the metabolism of microorganisms were also assessed. It was apparent from Figure 4B that CIH induction significantly activated metabolic pathways involving microbes including the tropane, piperidine and pyridine alkaloid biosynthesis, proteasome, and biosynthesis of type II polyketide products. Additionally, CIH induction significantly inhibited the pathway of vibrio cholerae infection.
3.3 Effect of CIH induction on metabolic profiles in serum and soft palate tissue
To explore the effect of CIH induction on rat serum metabolic profiles, UHPLC-MS-based global analysis of untargeted metabolomics was performed in positive and negative ionization modes. The total ion chromatograms of the samples were well overlaid (Supplementary Figure S1), indicating favorable reproducibility of the LC-MS analysis. PLS-DA can maximize group differences and facilitate the search for differential metabolites. The clustering characteristics between the Model and Control groups were characterized by PLS-DA, and there was a clear separation between the two groups in both positive and negative ionization modes (Figures 5A, B), which indicated that CIH induction perturbed the metabolism of rats. The permutation test was employed to verify the effectiveness of the PLS-DA model. Figures 5C, D showed that the values of all Q2 points (blue) and R2 points (green) from left to right were lower than the value of the original blue Q2 point and green R2 point on the far right in both positive ion and negative ion modes, proving a reliable and not overfitting model. In this study, potential perturbed biomarkers in rat serum after CIH induction were screened based on variable importance for the projection (VIP) values (VIP>1) and significance discriminant p-values (p<0.05). Figure 6A; Supplementary Table S1 showed that there were significant differences in 108 metabolites in rat serum after CIH perturbation, which were considered potential biomarkers and could be mainly classified as amino acids, organic acids, and a few flavonoids or sterols. A significant decrease in 65 metabolites was observed in the Model group compared to the Control group while a significant increase in 43 metabolites was observed. Among the significantly decreased metabolites, the top 10 substances with the most significant difference (Figure 6B) were thymidylate (dTMP), 5,7-dihydroxyflavone, mitragynine, prostaglandin E2, 6-hydroxydaidzein, baicalein, formononetin, (5-L-Glutamyl) -L-glutamate, L-aspartic acid, and 5-methoxyindoleacetate. Among the significantly elevated metabolites, the top 10 most significantly different metabolites (Figure 6B) were 5’-O-beta-D-glucosylpyridoxine, deoxycytidine, 1-palmitoyl-dihydroxyacetone-phosphate, cortisol, beta-glycerophosphoric acid, secoisolariciresinol, 5-Methyl-2-furancarboxaldehyde, phenylacetylglycine, phenylacetylglutamine, and dolichotheline. According to the significantly changed serum metabolites after CIH induction, 12 metabolic pathways with an impact value greater than 0.15 were observed to be significantly affected, including protein digestion and absorption, ABC transporters, pathways in cancer, histidine metabolism+B5:O5, tryptophan metabolism, beta-alanine metabolism, phenylalanine, tyrosine and tryptophan biosynthesis, aminoacyl-tRNA biosynthesis, alcoholism, phenylalanine metabolism, prolactin signaling pathway, and prostate cancer (Figure 6C; Supplementary Table S2). In addition, these metabolites were found to be significantly associated with the abundance changes of Helicobacter, Psychrobacter, Bacteroides, Prevotella, Lactobacillus, and other genera (Figure 6D). Taken together, CIH induction might affect these metabolites and their metabolic pathways in serum by regulating the gut microbiota structure.
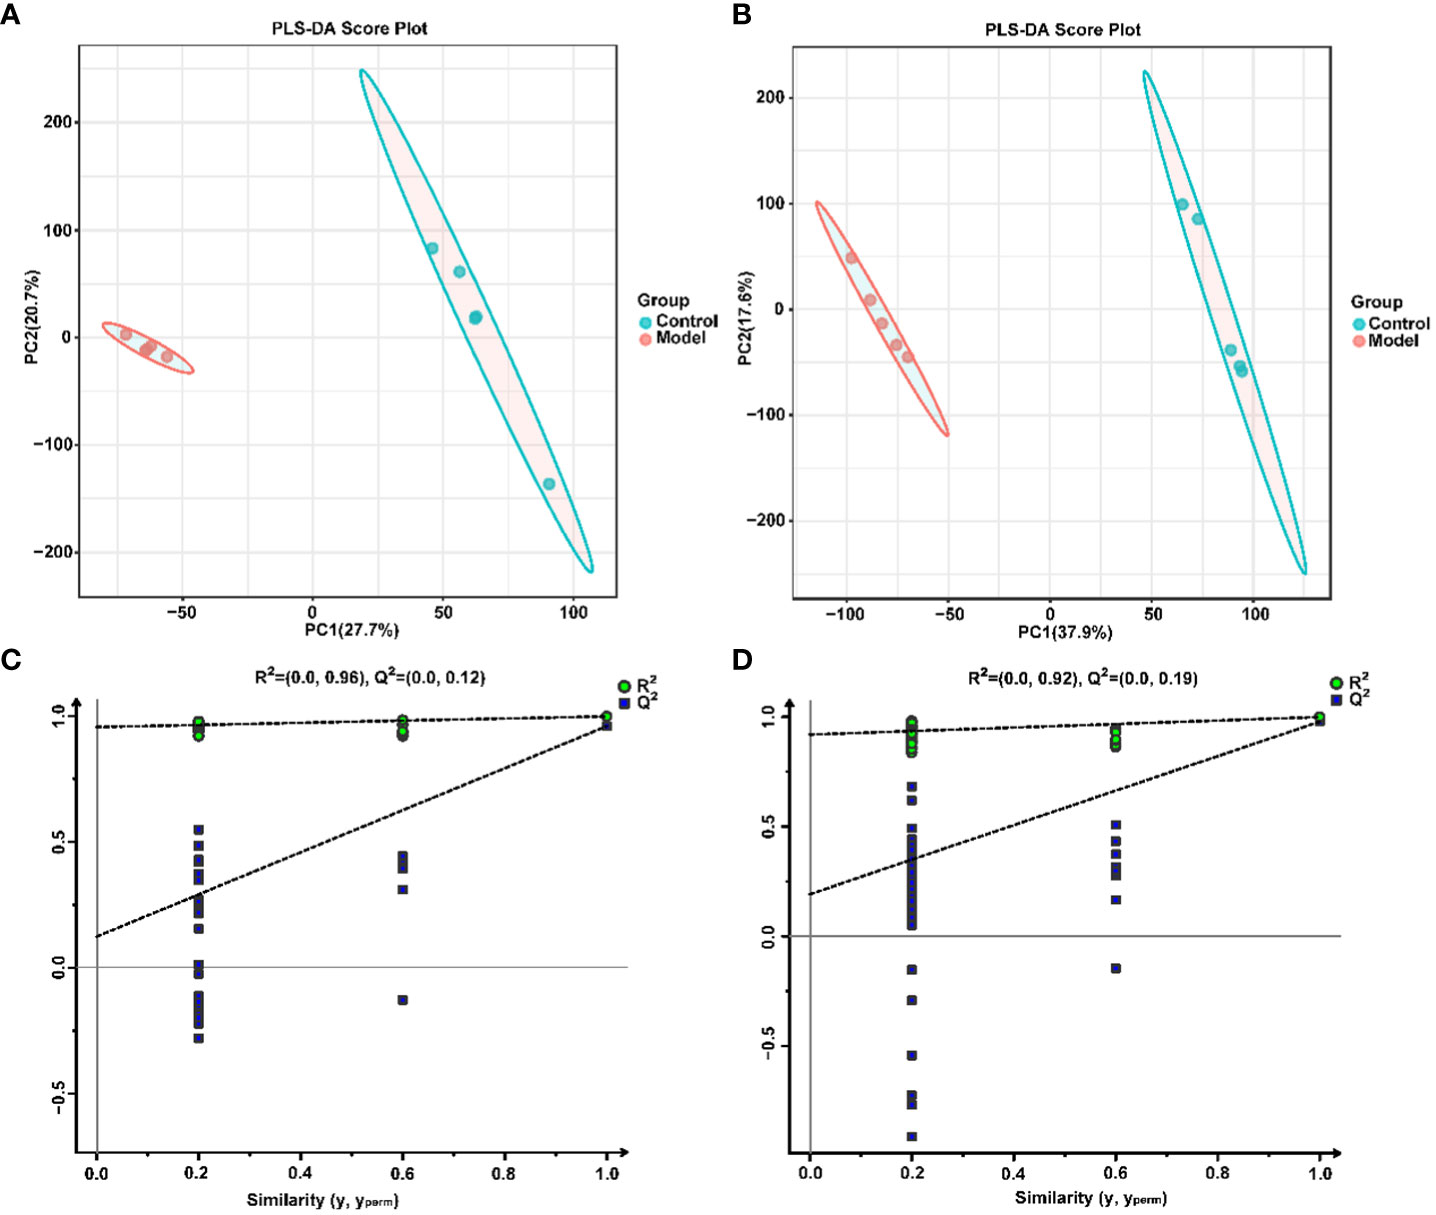
Figure 5 Multivariate statistical analysis of serum metabolites. PLS-DA score plot in positive (A) and negative (B) ion modes. Permutation tests of the PLS-DA model with 200 cycles in positive (C) and negative (D) ion modes.
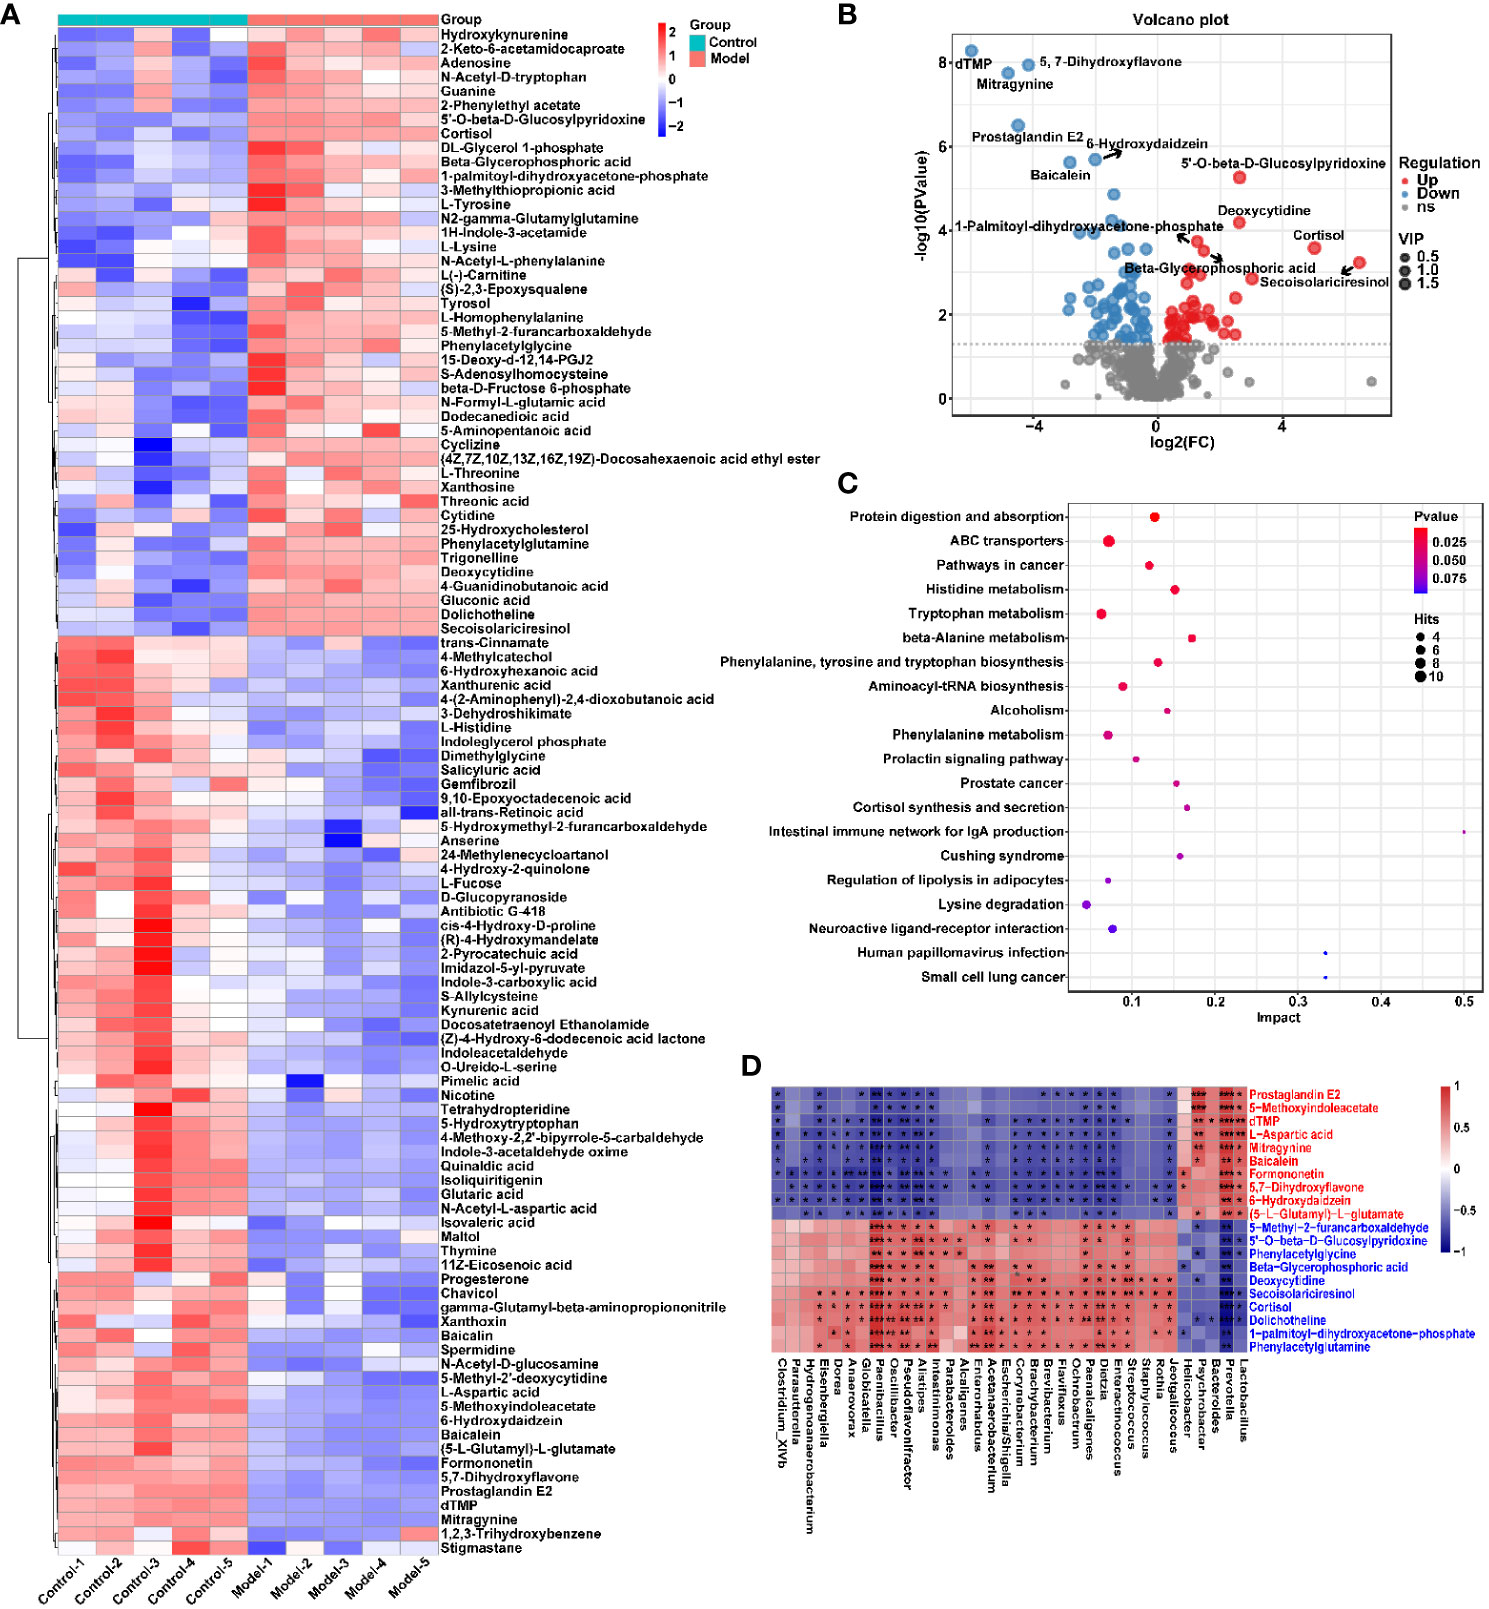
Figure 6 CIH induction significantly affected the serum metabolic profile of rats. (A) Cluster analysis heat map of CIH-induced differential metabolites. (B) Volcano plot of differential metabolites in serum. In the graph, each data point represents a metabolite. The x-axis represents the logarithmic value of Log2 of the quantitative difference of a specific metabolite, while the y-axis represents the logarithmic value of -log10 of the p-value. By default, the top 6 metabolites with the smallest p-values are displayed. (C) Bubble plot of influencing factors of metabolic pathways. In the graph, each data point represents a metabolic pathway. The x-axis represents the impact value enriched in different metabolic pathways, while the y-axis represents the enriched pathway. Dots on the graph indicate the number of corresponding metabolic molecules associated with each pathway. Colors are related to p-values. (D) Correlation heatmap between the top 10 up-regulated/down-regulated metabolites and the gut microbiota. The asterisk represents a significant difference between the two groups. *, p < 0.05; **, p < 0.01; ***, p < 0.001.
Similarly, the effect of CIH induction on the metabolic profile of soft palate tissue was analyzed. The total ion chromatograms of samples based on positive and negative ionization modes were well overlapped (Supplementary Figure S2), whereas PLS-DA characterization analysis showed that both groups were separated in positive/negative ionization modes (Figures 7A, B). In addition, the permutation test of the PLS-DA model (Figures 7C, D) showed the reliability of the model. Next, 175 potential differential metabolites, such as NADH, nicotinamide ribotide, and D-xylitol, were screened out in rat soft palate tissues after CIH induction according to VIP>1 and p<0.05 (Figure 8A; Supplementary Table S3). Compared with the Control group, 147 metabolites were significantly decreased and 28 metabolites were significantly increased in the model group. Among the significantly reduced metabolites, the top 10 metabolites with the most significant differences (Figure 8B) were 3-methylthiopropionic acid, 4-guanidinobutanoic acid, niacinamide, (R)-4-hydroxymandelate, 2-phenylacetamide, hippuric acid, IMP, salicyluric acid, tauropine, and xanthylic acid. Among the significantly elevated metabolites, the top 10 metabolites with the most significant differences (Figure 8B) were NADH, nicotinamide ribotide, D-xylitol, N(omega)-nitro-L-arginine methyl ester, 5-KETE, N6 -acetyl-L-lysine, chenodeoxycholic acid, riboflavin, deoxycytidine, and aspartame. In addition, these metabolites were found to be significantly correlated with the top 10 signature metabolites in serum (Figure 9). According to the significant changes in rat soft palate metabolites after CIH induction, 15 metabolic pathways with an impact value greater than 0.10 were observed to be significantly affected, including central carbon metabolism in cancer, cAMP signaling pathway, phenylalanine metabolism, prolactin signaling pathway, neuroactive ligand-receptor interaction, pyrimidine metabolism, pyruvate metabolism, synaptic vesicle cycle, beta-alanine metabolism, taste transduction, ABC transporters, glucagon signaling pathway, lysine degradation, oxidative phosphorylation, and cocaine addiction (Figure 8C; Supplementary Table S4). Furthermore, these metabolites were found to be significantly associated with the abundance changes of Elusimerbium, Helicobacter, Victivallis, Paenibacillus, Dorea genera, etc. (Figure 8D). Taken together, CIH induction might affect these metabolites and their metabolic pathways in soft palate tissues, and these changes might be related to alterations in the structure of the gut microbiota.
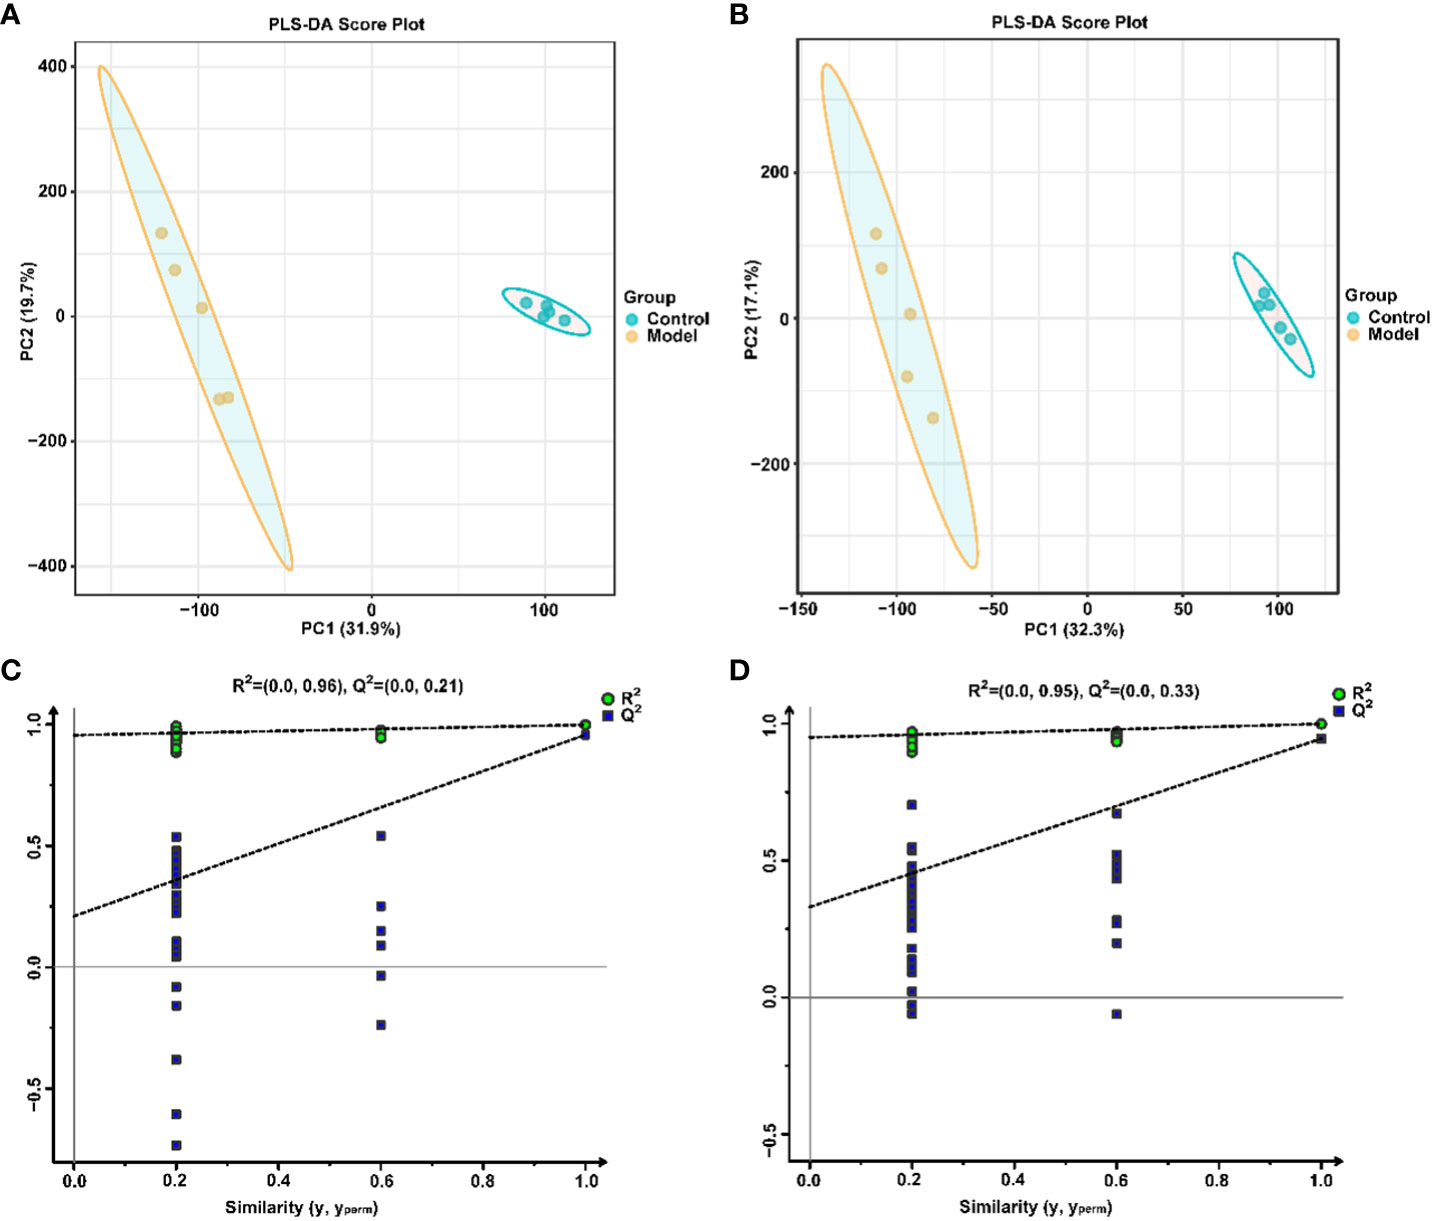
Figure 7 Multivariate statistical analysis of soft palate tissue metabolites. PLS-DAscore plot in positive (A) and negative (B) ion modes. Permutation tests of the PLS-DA model with 200 cycles in positive (C) and negative (D) ion modes.
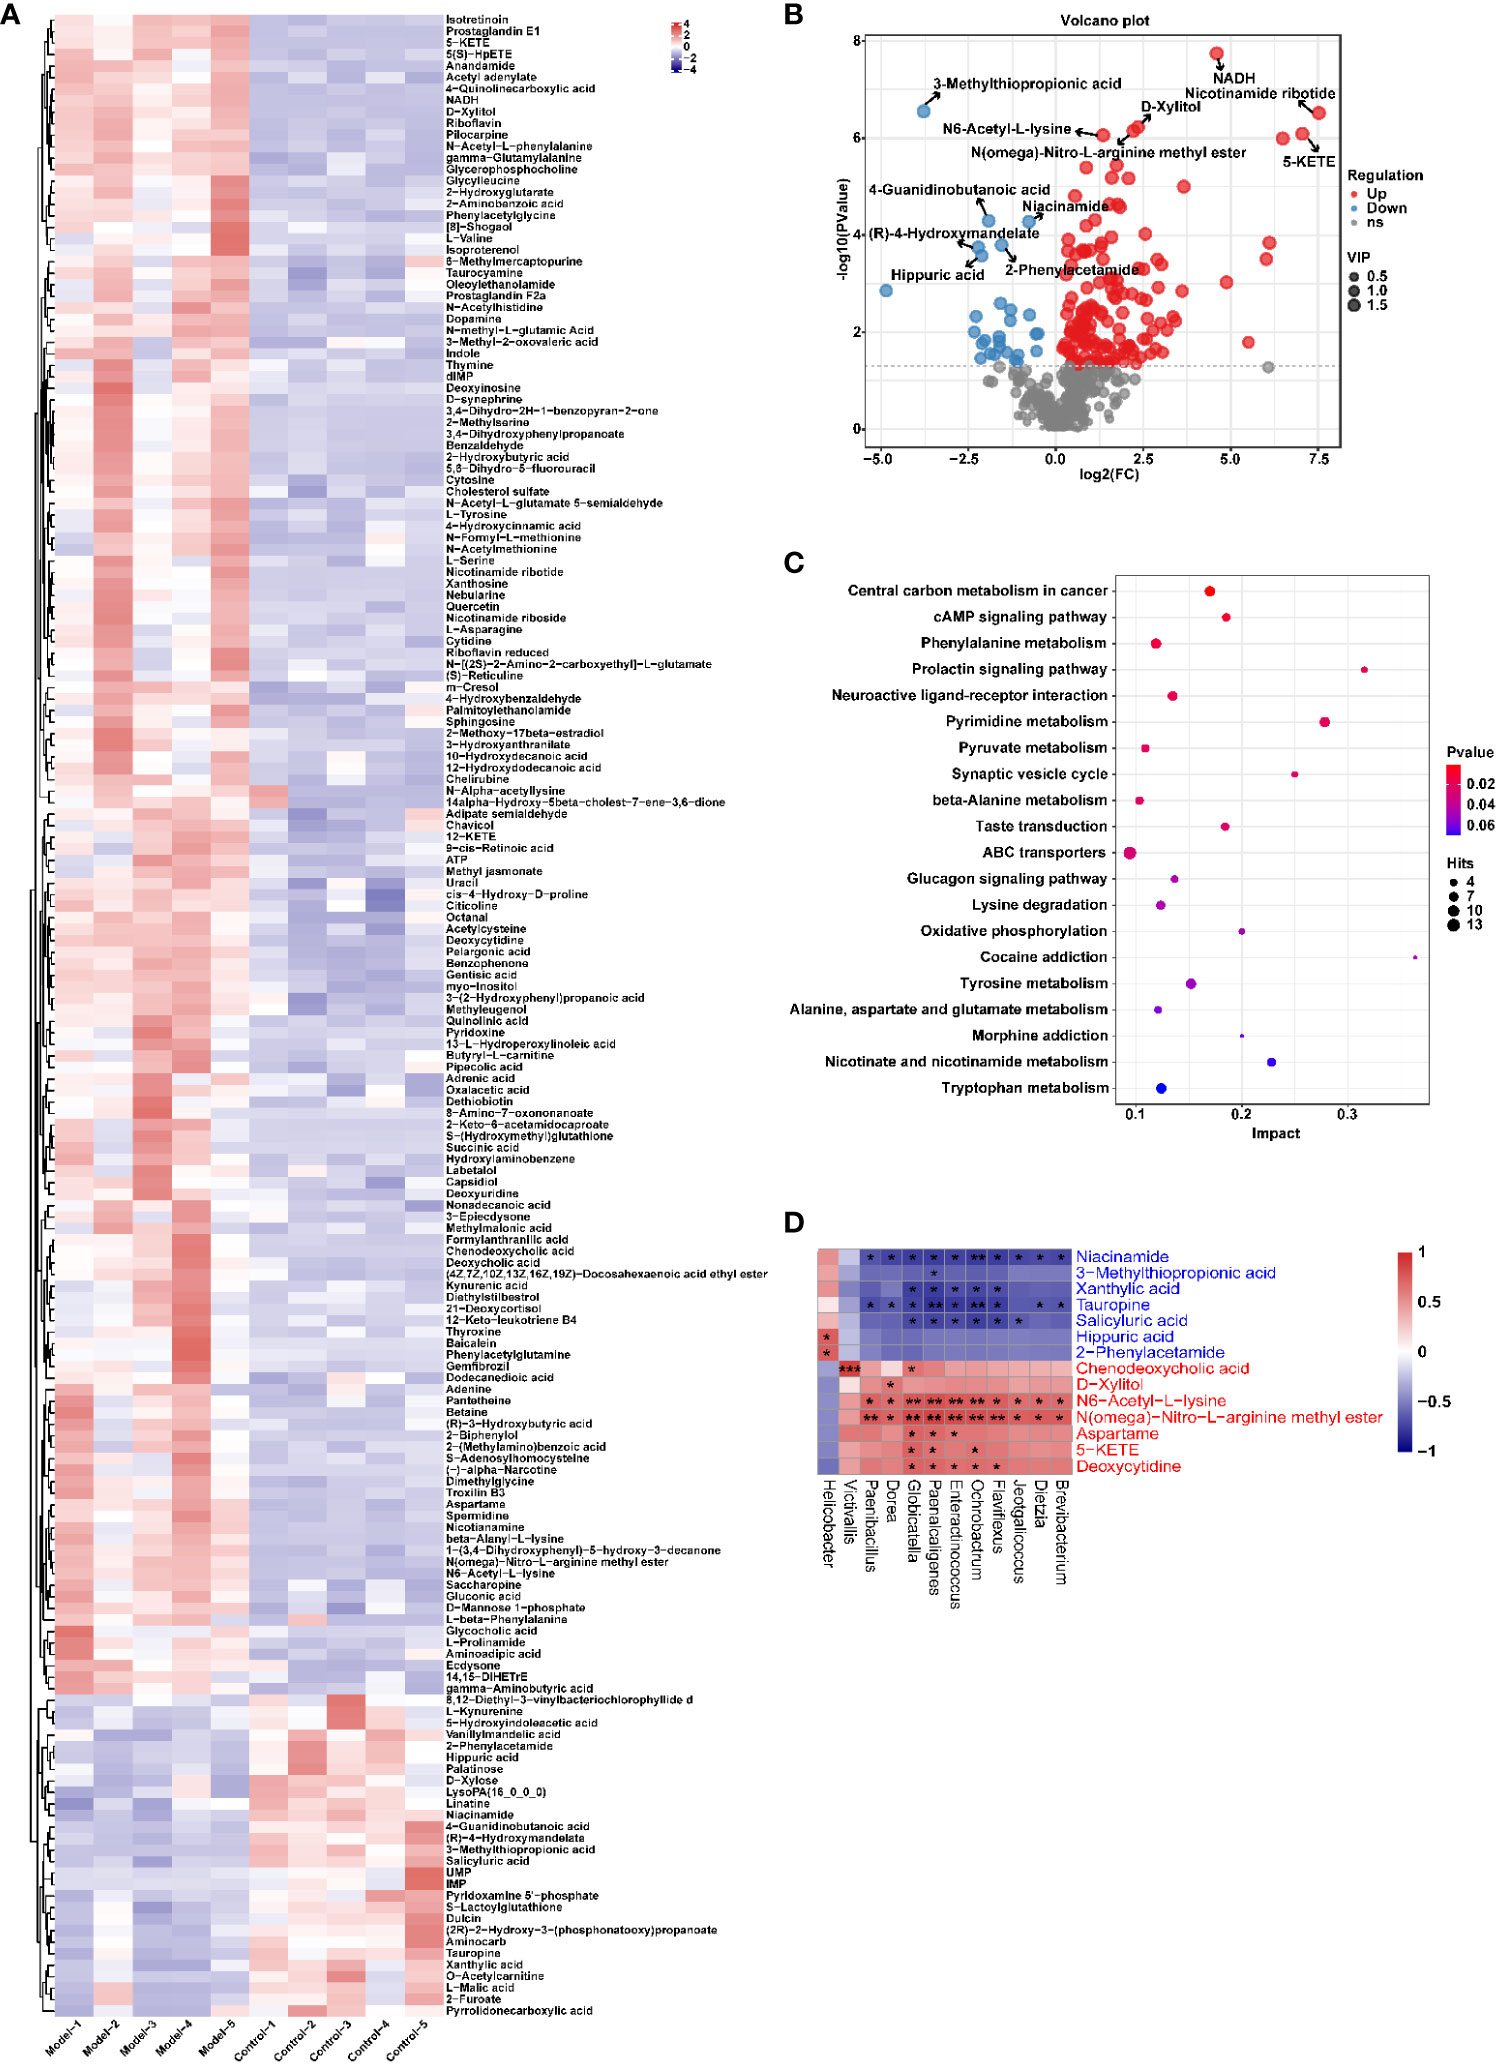
Figure 8 CIH induction significantly affected the metabolic profile of the rat soft palate tissues. (A) Cluster analysis heat map of CIH-induced differential metabolites. (B) Volcano plot of differential metabolites in serum. In the plot, each data point represents a metabolite, with the x-axis showing the logarithmic value of the log2 fold change of a specific metabolite, and the y-axis showing the logarithmic value of the negative logarithm (base 10) of the p-value. Up-regulated differentially expressed metabolites are represented by red dots, down-regulated metabolites are represented by blue dots, and metabolites that are detected but do not meet the filtering parameters are represented by gray dots. By default, the plot displays the top 6 metabolites with the smallest p-values. (C) Bubble plot of influencing factors of metabolic pathways. In the plot, each data point represents a metabolic pathway, with the x-axis representing the impact value enriched in different metabolic pathways and the y-axis representing the enriched pathway. The dots on the plot indicate the number of corresponding metabolic molecules present in each pathway. Colors are related to p-values. (D) Correlation heatmap between the top 10 up-regulated/down-regulated metabolites and the gut microbiota. The asterisk represents a significant difference between the two groups. *, p <0.05; **, p < 0.01; ***, p < 0.001.
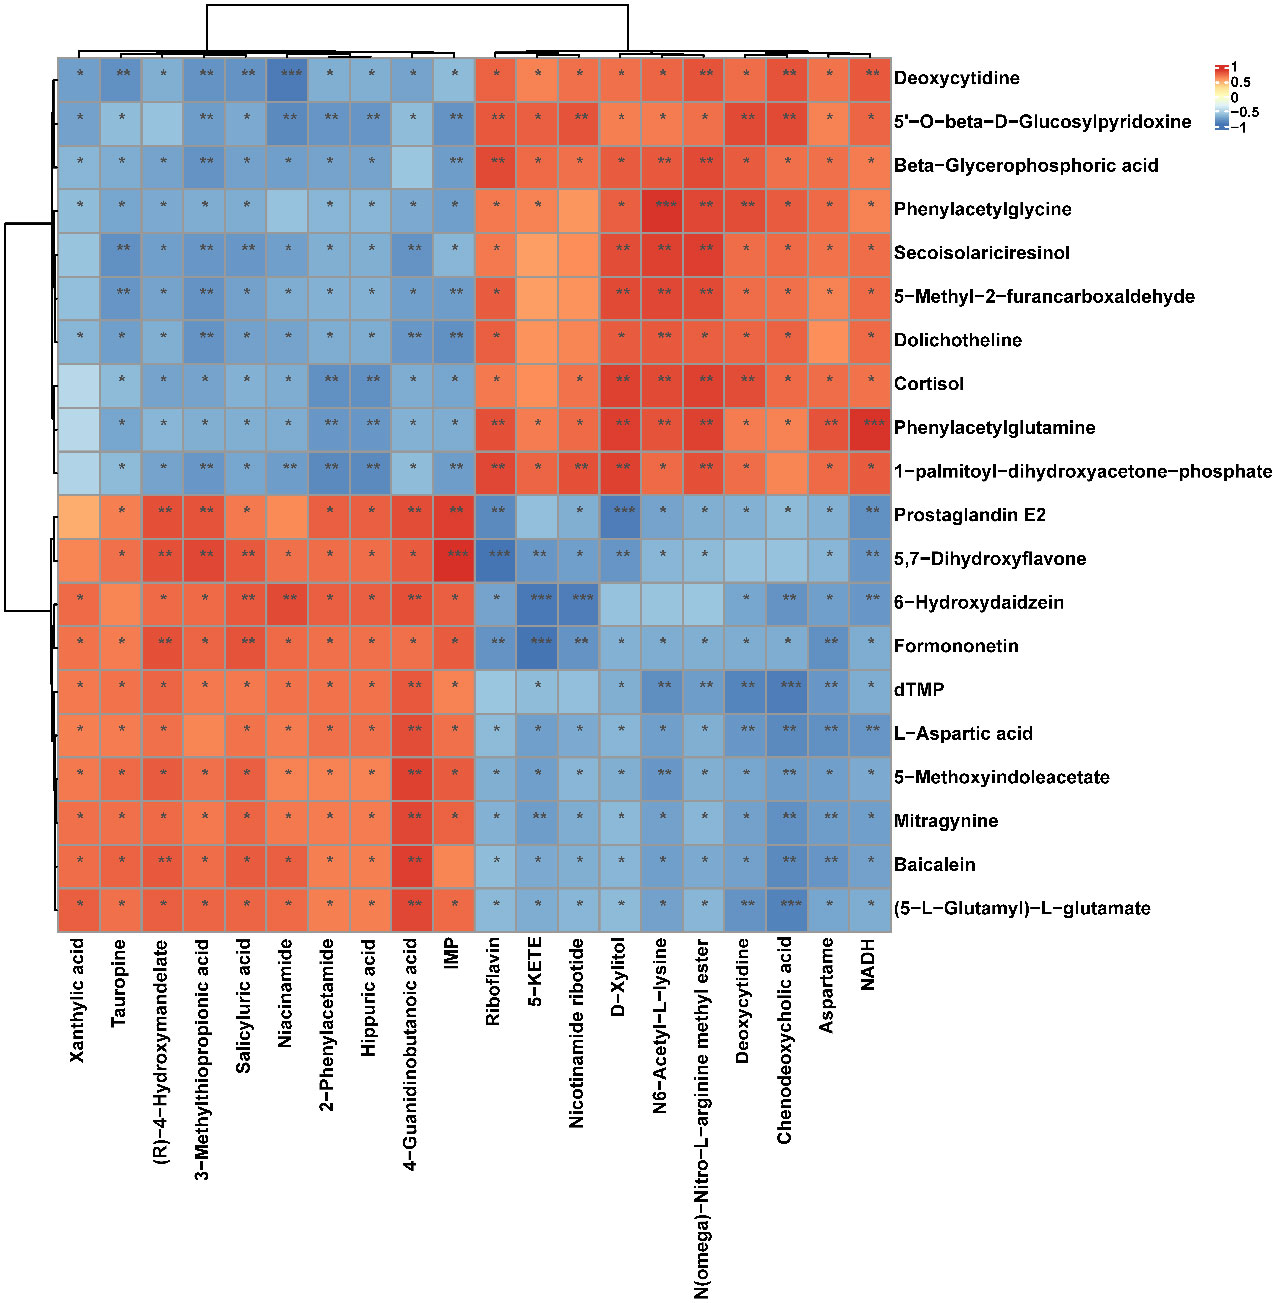
Figure 9 Correlation heatmap between the top 10 up-regulated/down-regulated metabolites in serum and the top 10 up-regulated/down-regulated metabolites in soft palate tissue. The asterisk represents a significant difference between the two groups. *, p <0.05; **, p < 0.01; ***, p < 0.001.
3.4 Effect of CIH induction on the cAMP-related pathway in soft palate tissue
To further verify the role of the cAMP pathway in CIH-simulated OSA (Supplementary Figure S3), the expression levels of key proteins in the cAMP pathway in soft palate tissue were analyzed. As shown in Figure 10, CIH induction triggered a significant decrease in the protein expression of cAMP, PKA, Epac2, Ras, and JNK1/2. Meanwhile, the protein expression of annexin V was also markedly up-regulated by CIH induction. This result was consistent with the KEGG pathway enrichment analysis in the metabolomics assay of soft palate tissue, which further validated the protruding role of the cAMP pathway in CIH-simulated OSA.
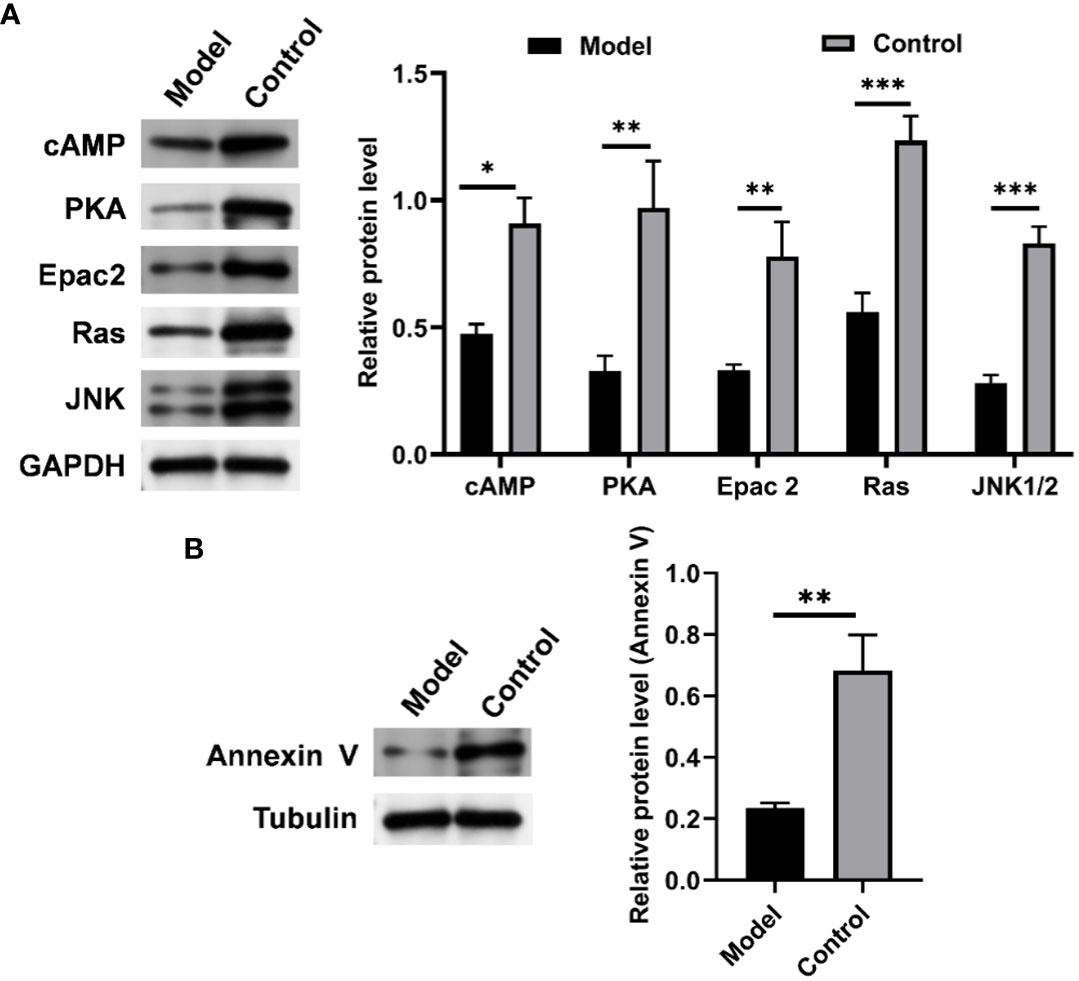
Figure 10 CIH induction significantly down-regulated the expression of cAMP-related pathways in soft palate tissue. (A) Relative protein expression of cAMP, PKA, Epac2, Ras, and JNK. (B) Relative protein expression of Annexin V. The asterisk represents a significant difference between the two groups. *, p <0.05; **, p < 0.01; ***, p < 0.001.
4 Discussion
OSA is characterized by recurring episodes during sleep where the upper airway narrows or collapses, leading to decreased ventilation or apnea. Apnea and hypopnea lead to desaturation of blood oxygen, increased carbon dioxide in the blood, and subsequent interruption of wakefulness and sleep due to repeated activation of the central nervous system. Therefore, CIH is considered a key mechanism of endothelial dysfunction and increased cardiovascular disease risk in patients with OSA. Patients with OSA are at relatively high risk of developing cardiovascular diseases such as ischemic heart disease, heart failure, cardiac arrhythmias, stroke, and transient ischemic attack (25). OSA has become a serious public health issue due to its high prevalence, lack of access to diagnostic procedures, and association with social, occupational, and cardiovascular risk complications (26). Exploring the molecular mechanism of the occurrence and development of OSA and identifying early diagnostic indicators are extremely important for the clinical intervention and treatment of OSA.
In this study, a rat model simulating the process of OSA simulated by CIH was successfully established to explore the underlying mechanism of OSA pathogenesis under chronic hypoxic conditions. CIH stimulates the overproduction of reactive oxygen species (ROS), which is key to its pro-inflammatory response (21). Secondary to ROS expression, the levels of some pro-inflammatory cytokines increase, producing a systemic inflammatory state. Nocturnal hypoxia has been reported to lead to higher concentrations of h-CRP (27), while several other studies have shown that the levels of h-CRP, IL-6, and IL-8 in OSA patients were significantly increased (28, 29). Indeed, systemic inflammation is one of the main underlying pathological mechanisms linking OSA to cardiovascular disease. As expected, we found that CIH induction significantly elevated the levels of several canonical pro-inflammatory cytokines. Consistently, we also found thickening of the soft palate mucosal layer, muscle atrophy consistent with glandular hyperplasia, and soft palate connective tissue loosening in a CIH-induced rat model. Clinical studies have revealed that the inflammatory cascade had a marked effect on the vascular region, which could activate the sympathetic nervous system and produce endothelial dysfunction (30, 31). Although muscular changes are considered an adaptive compensation for snoring in OSA patients (32), atrophy of this musculature remains ineffective against pharyngeal collapse. The velopharyngeal muscle plays a crucial role in regulating the upper airway, and understanding its pathological changes can help ameliorate the development of OSA and its complications. Possible explanations for the changes in muscles exposed to CIH are systemic inflammation-induced neuronal damage of the soft palate or endothelial cell dysfunction.
CIH-mediated intestinal dysbiosis has been implicated in the pathophysiology of OSA and related diseases. Evidence of intestinal microbial dysbiosis has been observed in animal models of OSA (33, 34). However, most related studies have focused solely on the relative abundance of gut microbiota, which has limited capacity to reveal the complex interactions between microbes and host health. To fully investigate host-microbe interactions, it is essential to turn relative quantification into absolute quantification (35). In our current study, we utilized the Accu16STM bacterial absolute quantitative high-throughput sequencing method to comprehensively reflect the potential impact of bacterial community changes on the host. Our results showed that CIH induction significantly increased the overall number and diversity of the gut microbiota, consistent with previous reports (36). At the phylum level, CIH induction increased the F/B ratio, a marker of gut dysbiosis, which had been associated with disease states (23). Moreover, CIH induction specifically promoted the colonization of Verrucomicrobia in the gut. Currently, few functional studies have been conducted on Verrucomicrobia, further research is needed to elucidate its specific role in the gut. Significant differences in the abundance of microbiota were observed at the phylum and genus levels in response to CIH exposure. It is worth noting that in an ecosystem, not all species hold the same importance, and the dominance of microorganisms within the gut micro-ecosystem can greatly affect the gut microenvironment (12). Among the top 10 microbial genera that accounted for over 1% of abundance, the abundance of Bacteroides, Lactobacillus, and Prevotella was significantly reduced, while the abundance of Parabacteroides, Oscillibacter, Romboutsia, Alloprevotella, Akkermansia, and Clostridium_IV was significantly increased. These findings indicate a relative increase in obligate anaerobes and a substantial decrease in beneficial bacteria following intermittent hypoxic exposure. The reduction in intestinal oxygen levels under intermittent hypoxia confers an ecological selective advantage on obligate anaerobes, making them more competitive and able to overgrow. In contrast, facultative anaerobes and even aerobic bacteria are at a disadvantage. The Bacteroides genus, which primarily inhabits the colon, plays a crucial role in carbohydrate and fiber fermentation, producing short-chain fatty acids (SCFAs) such as butyrate, acetate, and propionate (37). SCFAs are essential in maintaining human health by providing the primary source of nutrition and energy for colon cells, protecting the intestinal mucosal barrier, reducing inflammation in the host, and enhancing intestinal peristalsis (38). Interestingly, SCFAs also have direct anti-inflammatory effects on the gut, contribute to mucin synthesis, reduce bacterial translocation, maintain gut integrity, and reduce gut inflammation (39). Lactobacillus genus, a beneficial gut bacterium, can improve gut health and show anti-inflammatory, anti-diabetic, and anti-obesity effects (40). New evidence suggests that Lactobacillus may also help improve sleep and reduce the effects of sleep deprivation (41). Prevotella can effectively decompose dietary fiber and plant polysaccharides in the gut, producing SCFAs with potential benefits in maintaining host glucose homeostasis and regulating host metabolism (41). Parabacteroides have been reported to be closely related to body inflammation, endotoxin production, increased risk of death, and antibiotic resistance (42). Oscillibacter, Romboutsia, and Clostridium IV were found in obese-prone insulin-resistant mice and were absent in their obese-resistant hosts (43, 44). Alloprevotella was significantly enriched in the gut of colitis mice (45), and Akkermansia was recognized as a conditional therapeutic bacteria associated with hyperglycemia (46). Rodent studies have shown that sleep fragmentation leads to increased food intake, visceral adiposity, inflammation, and insulin resistance, while chronic sleep deprivation results in altered energy metabolism (47, 48). In response to these changes, the gut microbiota involved in these metabolic regulations responds positively. Specifically, Dorea, Enteractinococcus, Paenibacillus, Globicatella, and Flaviflexus genera were found to be enriched in the gut of rats chronically exposed to intermittent hypoxia, and these genera were previously reported to be associated with sleep fragmentation related to sleep disorders (41, 49, 50). Furthermore, CIH induction significantly enhanced the functions of tropane, piperidine, and pyridine alkaloid biosynthesis, proteasome, and biosynthesis of type II polyketide products of gut microbiota. Tropane, piperidine, and pyridine alkaloid biosynthesis were reported to be related to cytotoxicity (51). As for tropane, piperidine and pyridine alkaloid biosynthesis, more reports are needed to further clarify their effects on host health. Collectively, CIH induction resulted in a decrease in beneficial bacteria producing SCFAs in the gut, an increase in harmful bacteria associated with inflammation, and an enrichment of microbiota associated with sleep disturbance/sleep fragmentation.
Recently, there has been an interest in investigating changes in the serum metabolome of patients with OSA. Changes in the gut microbiota composition due to CIH may result in altered serum metabolomes. Our results showed that a majority of the serum differential metabolites that are affected by CIH are amino acids, organic acids, and a few flavonoids or sterols. Amino acids and organic acids are important components of the serum metabolome and are responsible for various essential functions in the body, such as energy regulation, redox balance, biosynthesis, and normal metabolism (52, 53). Since it was difficult to list all 108 differential metabolites in serum, the top 10 significantly decreased and the top 10 significantly increased metabolites compared with Control were listed and analyzed. The levels of these characteristic metabolites were found to be significantly altered in response to changes in the composition and structure of the gut microbiota, and their effects on bioprocesses primarily focused on inflammation, oxidative stress, depression, cancer, and cardiovascular disease, which were all involved in the development of OSA pathophysiology (21, 54). For example, thymidylate (dTMP) and deoxycytidine are involved in DNA synthesis, and an imbalance in their levels may lead to excessive production of ROS, further inducing cell apoptosis (55). Deoxyribonucleosides have been used as biomarkers of oxidative stress, and their levels were found to be higher in patients with severe OSA (54). Some of the significantly altered metabolites, such as 5,7-dihydroxyflavone, mitragynine, prostaglandin E2, 6-hydroxydaidzein, baicalein, formononetin, (5-L-Glutamyl)-L-glutamate, and L-aspartic acid, have been reported to exhibit favorable anti-inflammatory, antioxidant, and antidepressant activity, which can prevent the release of pro-inflammatory mediators and oxidative stress products, playing a crucial role in the regulation of nutrient metabolism, oxidative defense, and immune function (56–65). Other metabolites, such as 5-methoxyindoleacetate, cortisol, beta-glycerophosphoric acid, phenylacetylglycine, phenylacetylglutamine, and dolichotheline, have been associated with ischemic stroke, stress, osteogenic differentiation, cardiovascular disease, and amino acid synthesis or metabolism (66–70). However, the specific functions of some of the remaining metabolites could not be presented due to limited reports, and more studies were needed to reveal their potential regulatory effects. Through KEGG enrichment analysis, the top 10 pathways enriched by these differential metabolites were mainly related to protein transport, digestion and absorption, amino acid synthesis and metabolism, and cancer development. SCFAs are essential for colon function and body health, and they are produced during protein digestion and absorption (71). Amino acids play a key role in various fundamental functions in the human body and are closely related to OSA, and the gut microbiota plays a crucial role in intestinal protein/amino acid metabolism (72). Cancer development involves abnormal cell proliferation, which drives the uncontrolled metabolic demands of cells (73). Therefore, these findings suggest that serum differential metabolites involved in processes such as inflammation, oxidative stress, depression, cancer, and cardiovascular disease may act as clinical class-differentiated biomarkers of OSA.
Further analysis revealed that the changes in serum metabolites had an impact on the metabolism in soft palate tissue, which played a significant role in pathological development. Among the top 10 metabolites that were significantly reduced in the Model group, 4-guanidinobutanoic acid is a key metabolite found in the urine of rats exposed to carcinogenic heterocyclic arylamines, and its levels were significantly decreased in urine after exposure to such carcinogens (74). Niacinamide is known to contribute to cellular energy metabolism and defense system, and it exhibits excellent anti-oxidation, anti-cancer, and anti-aging effects (75). Hippuric acid is a metabolite that can distinguish between physical fitness and frailty, and low levels of plasma hippuric acid might be a potential marker of a frail state (76). Inosine monophosphate (IMP) serves as an intracellular precursor of adenosine monophosphate and guanosine monophosphate and plays a central role in intracellular purine metabolism. Studies have shown that IMP inhibits the production of tumor necrosis factor (TNF)-α and increases the production of IL-10 in endotoxemic mice (77). Salicylic acid has been found to possess strong antibacterial and antibiofilm properties. Tauropine is a mitochondrial matrix buffer that plays an indirect antioxidant role by stabilizing mitochondrial oxidation (78). Xanthylic acid is an intermediate product generated by the catabolism of guanine and adenosine triphosphate in muscle tissue, and the intracellular content of xanthine is correlated with cell activity (79). Moreover, its concentration levels in urine and plasma were indicators of certain pathological states such as cerebral ischemia (80). Additionally, 3-methylthiopropionic acid, (R)-4-hydroxymandelate, and 2-phenylacetamide were first reported to be significantly reduced in soft palate tissue following CIH induction, indicating their potential as targets for OSA intervention. Among the top 10 significantly increased metabolites, NADH, an important redox factor responsible for transferring electrons from the TCA cycle to the ETC to generate ATP, accumulates under hypoxic conditions where respiration is impaired and can damage cells leading to their death (81). Nicotinamide ribotide, a precursor of NAD+, reduces exercise performance in rats by altering redox homeostasis and causing cells to enter a suboptimal state (82). N(omega)-nitro-L-arginine methyl ester is a NO synthase inhibitor that significantly increases blood pressure, promoting the development of inflammation and fibrosis in organs/tissues (83). 5-keto eicosatetraenoic acid (5-KETE) is a chemotactic factor that attracts inflammatory cells to aggravate inflammation (84). N6-acetyl-L-lysine is a signature metabolite in the plasma of obese COVID-19 patients that regulates the metabolic enzyme activity of glucose and fatty acids (85). Chenodeoxycholic acid is identified as a novel biomarker of coronary artery calcification in nondiabetic hemodialysis patients, but its involvement in brown fat metabolism suggests a need for more research to clarify its function (86, 87). Deoxycytidine is a product of DNA oxidation, and its levels reflect the degree of DNA degradation. D-xylitol, aspartame, and riboflavin are exogenous metabolites that may originate from components or additives in rat diets.
KEGG analysis identified fifteen differentially enriched pathways, mainly involved in cancer development, signaling pathways, amino acid metabolism, nucleotide precursor or intermediate metabolism, respiratory process, and disease. CIH-induced changes in signaling pathways and amino acid metabolism disorders involved abnormal respiratory processes and abnormal proliferation of soft palate glands and thickening of the mucosal layer, accompanied by the formation of inflammation (21, 54, 72, 73). Participation of specific products also aggravated the pathological development of soft palate tissue, such as significantly higher urinary 8-Hydroxy-2-deoxyguanosine excretion observed in patients with severe OSA (88). Interestingly, a significant enrichment of the cAMP pathway was observed, providing interesting ideas for the treatment of OSA. Overall, our findings suggest that CIH induction significantly affects the production of metabolites involved in cancer development, signaling pathways, and amino acid metabolism, and these differential metabolites might serve as potential targets for intervention or treatment of OSA.
cAMP is the first identified second messenger, which has a fundamental role in the cellular response to many extracellular stimuli. Multiple studies have demonstrated that the cAMP-mediated signaling pathway plays a significant role in the development and progression of various complications induced by CIH (89, 90). For example, Li et al. found that salidroside could alleviate the overproduction of ROS and endothelial barrier damage in CIH-induced atherosclerosis mice by activating the cAMP pathway (90). In addition, Pan et al. indicated that inhibition of phosphodiesterase 4B could attenuate CIH-induced pulmonary hypertension by regulating cAMP signaling (89). Similar to these reports, our results showed that CIH-induced dysregulation of the gut microbiota and alteration of the metabolic profile might be associated with the downregulation of the cAMP pathway expression in rat soft palate tissue. Accumulating literature has shown that activation of the cAMP pathway positively regulates mitochondrial biogenesis (91), which is further involved in the regulation of endothelial/myocyte homeostasis (92). Our results showed that the downregulation of the cAMP pathway was accompanied by inhibition of annexin V expression. Previous studies have shown that annexin V as a sensory nerve marker contributed to the collapse of the upper airway soft palate innervated by supporting muscles (20). Therefore, our result suggested that CIH induction might partly suppress the expression of annexin V by inhibiting the expression of the cAMP pathway, thereby promoting the collapse of the upper airway soft palate. However, the cascade pathways closely related to cAMP and their interaction mechanism with annexin V should also be investigated in the future.
5 Conclusion
In summary, this study demonstrates that CIH induction leads to inflammation and histopathological injury in the body, particularly in the soft palate. Moreover, CIH induction influenced the composition and structure of the gut microbiota, and it also significantly altered the metabolic profiles in both serum and soft palate tissue. Furthermore, targeting the cAMP pathway may hold promise for interventions or treatments for OSA. However, the current study did not directly establish a connection between the gut microbiota and the serum and tissue metabolomes. Subsequent experiments involving fecal transplantation in germ-free or gnotobiotic mice are required to confirm this link.
Data availability statement
The original contributions presented in the study are publicly available. This data can be found here: 10.6084/m9.figshare.23587119 and 10.6084/m9.figshare.23587164 (figshare).
Ethics statement
The animal study was approved by Institutional Animal Use and Care Committee guidelines of the Second Military Medical University. The study was conducted in accordance with the local legislation and institutional requirements.
Author contributions
CL: Conceptualization, methodology, software, writing—original draft preparation, and writing—review and editing. SS: supervision, project administration, and funding acquisition. All authors have read and agreed to the published version of the manuscript.
Funding
The author(s) declare financial support was received for the research, authorship, and/or publication of this article. This research was funded by the Shanghai Changning District “Quality and Balance” project, grant number CNYZ02.
Conflict of interest
The authors declare that the research was conducted in the absence of any commercial or financial relationships that could be construed as a potential conflict of interest.
Publisher’s note
All claims expressed in this article are solely those of the authors and do not necessarily represent those of their affiliated organizations, or those of the publisher, the editors and the reviewers. Any product that may be evaluated in this article, or claim that may be made by its manufacturer, is not guaranteed or endorsed by the publisher.
Supplementary material
The Supplementary Material for this article can be found online at: https://www.frontiersin.org/articles/10.3389/fendo.2023.1224396/full#supplementary-material
References
1. Benjafield AV, Ayas NT, Eastwood PR, Heinzer R, Ip MSM, Morrell MJ, et al. Estimation of the global prevalence and burden of obstructive sleep apnoea: A literature-based analysis. Lancet Respir Med (2019) 7:687–98. doi: 10.1016/S2213-2600(19)30198-5
2. Jordan AS, Mcsharry DG, Malhotra A. Adult obstructive sleep apnoea. Lancet (2014) 383:736–47. doi: 10.1016/S0140-6736(13)60734-5
3. Drager LF, Togeiro SM, Polotsky VY, Lorenzi-Filho G. Obstructive sleep apnea: A cardiometabolic risk in obesity and the metabolic syndrome. J Am Coll Cardiol (2013) 62:569–76. doi: 10.1016/j.jacc.2013.05.045
4. Wang X, Guan L, Wu C, Zhao Y, Zhao G. Continuous positive airway pressure may improve hypertension in patients with obstructive sleep apnea-hypopnea syndrome by inhibiting inflammation and oxidative stress. Arch Med Sci (2023) 19:237–41. doi: 10.5114/aoms/156490
5. Andrade AG, Bubu OM, Varga AW, Osorio RS. The relationship between obstructive sleep apnea and alzheimer's disease. J Alzheimers Dis (2018) 64:S255–s270. doi: 10.3233/JAD-179936
6. Fang G, Song D, Ye X, Mao SZ, Liu G, Liu SF. Chronic intermittent hypoxia exposure induces atherosclerosis in apoe knockout mice: Role of nf-κb p50. Am J Pathol (2012) 181:1530–9. doi: 10.1016/j.ajpath.2012.07.024
7. Light M, Mccowen K, Malhotra A, Mesarwi OA. Sleep apnea, metabolic disease, and the cutting edge of therapy. Metabolism (2018) 84:94–8. doi: 10.1016/j.metabol.2017.09.004
8. Peng DC, Dai XJ, Gong HH, Li HJ, Nie X, Zhang W. Altered intrinsic regional brain activity in male patients with severe obstructive sleep apnea: A resting-state functional magnetic resonance imaging study. Neuropsychiatr Dis Treat (2014) 10:1819–26. doi: 10.2147/ndt.s67805
9. Hamilton GS, Gupta R, Vizcarra D, Insalaco G, Escobar F, Kadotani H. Endorsement of: "Clinical practice guideline for diagnostic testing for adult obstructive sleep apnea: An american academy of sleep medicine clinical practice guideline" by the world sleep society. Sleep Med (2021) 79:152–4. doi: 10.1016/j.sleep.2020.12.044
10. Liu X, Ma Y, Ouyang R, Zeng Z, Zhan Z, Lu H, et al. The relationship between inflammation and neurocognitive dysfunction in obstructive sleep apnea syndrome. J Neuroinflamm (2020) 17:229. doi: 10.1186/s12974-020-01905-2
11. Can M, Uygur F, Tanrıverdi H, Acıkgoz B, Alper B, Guven B. Effect of continuous positive airway pressure (cpap) therapy on il-23 in patients with obstructive sleep apnea. Immunol Res (2016) 64:1179–84. doi: 10.1007/s12026-016-8869-8
12. Zhu J, Wu M, Zhou H, Cheng L, Wei X, Wang Y. Liubao brick tea activates the pi3k-akt signaling pathway to lower blood glucose, metabolic disorders and insulin resistance via altering the intestinal flora. Food Res Int (2021) 148:110594. doi: 10.1016/j.foodres.2021.110594
13. Albenberg L, Esipova TV, Judge CP, Bittinger K, Chen J, Laughlin A, et al. Correlation between intraluminal oxygen gradient and radial partitioning of intestinal microbiota. Gastroenterology (2014) 147:1055–63. doi: 10.1053/j.gastro.2014.07.020
14. Durgan DJ, Ganesh BP, Cope JL, Ajami NJ, Phillips SC, Petrosino JF, et al. Role of the gut microbiome in obstructive sleep apnea-induced hypertension. Hypertension (2016) 67:469–74. doi: 10.1161/HYPERTENSIONAHA.115.06672
15. Ko CY, Liu QQ, Su HZ, Zhang HP, Fan JM, Yang JH, et al. Gut microbiota in obstructive sleep apnea-hypopnea syndrome: Disease-related dysbiosis and metabolic comorbidities. Clin Sci (Lond) (2019) 133:905–17. doi: 10.1042/CS20180891
16. Badran M, Mashaqi S, Gozal D. The gut microbiome as a target for adjuvant therapy in obstructive sleep apnea. Expert Opin Ther Targets (2020) 24:1263–82. doi: 10.1080/14728222.2020.1841749
17. Beger RD, Dunn W, Schmidt MA, Gross SS, Kirwan JA, Cascante M, et al. Metabolomics enables precision medicine: "A white paper, community perspective". Metabolomics (2016) 12:149. doi: 10.1007/s11306-016-1094-6
18. Engeli S, Blüher M, Jumpertz R, Wiesner T, Wirtz H, Bosse-Henck A, et al. Circulating anandamide and blood pressure in patients with obstructive sleep apnea. J Hypertens (2012) 30:2345–51. doi: 10.1097/HJH.0b013e3283591595
19. Ezzedini R, Darabi M, Ghasemi B, Darabi M, Fayezi S, Jabbari Moghaddam Y, et al. Tissue fatty acid composition in obstructive sleep apnea and recurrent tonsillitis. Int J Pediatr Otorhinolaryngol (2013) 77:1008–12. doi: 10.1016/j.ijporl.2013.03.033
20. Li C, Zhang Y, Chen Y, Su T, Zhao Y, Shi S. Cell-autonomous autophagy protects against chronic intermittent hypoxia induced sensory nerves and endothelial dysfunction of the soft palate. Med Sci Monit (2020) 26:920878. doi: 10.12659/MSM.920878
21. Labarca G, Gower J, Lamperti L, Dreyse J, Jorquera J. Chronic intermittent hypoxia in obstructive sleep apnea: A narrative review from pathophysiological pathways to a precision clinical approach. Sleep Breath (2020) 24:751–60. doi: 10.1007/s11325-019-01967-4
22. Ko C-Y, Liu Q-Q, Su H-Z, Zhang H-P, Fan J-M, Yang J-H, et al. Gut microbiota in obstructive sleep apnea–hypopnea syndrome: Disease-related dysbiosis and metabolic comorbidities. Clin Sci (2019) 133:905–17. doi: 10.1042/CS20180891
23. Durgan DJ. Obstructive sleep apnea-induced hypertension: Role of the gut microbiota. Curr Hypertens Rep (2017) 19:35. doi: 10.1007/s11906-017-0732-3
24. Props R, Kerckhof F-M, Rubbens P, De Vrieze J, Hernandez Sanabria E, Waegeman W, et al. Absolute quantification of microbial taxon abundances. ISME J (2017) 11:584–7. doi: 10.1038/ismej.2016.117
25. Yamauchi M, Kimura H. Oxidative stress in obstructive sleep apnea: Putative pathways to the cardiovascular complications. Antioxid Redox Sign (2008) 10:755–68. doi: 10.1089/ars.2007.1946
26. Jun JC, Polotsky VY. Obstructive sleep apnoea and susceptibility to cardiovascular disease: A blessing or curse of old age? Respirology (2020) 25:242–3. doi: 10.1111/resp.13679
27. Yilmaz Avci A, Avci S, Lakadamyali H, Can U. Hypoxia and inflammation indicate significant differences in the severity of obstructive sleep apnea within similar apnea-hypopnea index groups. Sleep Breath (2017) 21:703–11. doi: 10.1007/s11325-017-1486-5
28. Ning Y, Zhang T-S, Wen W-W, Li K, Yang Y-X, Qin Y-W, et al. Effects of continuous positive airway pressure on cardiovascular biomarkers in patients with obstructive sleep apnea: A meta-analysis of randomized controlled trials. Sleep Breath (2019) 23:77–86. doi: 10.1007/s11325-018-1662-2
29. Lu D, Abulimiti A, Wu T, Abudureyim A, Li N. Pulmonary surfactant-associated proteins and inflammatory factors in obstructive sleep apnea. Sleep Breath (2018) 22:99–107. doi: 10.1007/s11325-017-1536-z
30. Eugenio V, Jose MM, Santiago JC, Carlos SO, Ricardo G, Marta M-O, et al. Upper airway and systemic inflammation in obstructive sleep apnoea. Eur Respir J (2016) 48:1108. doi: 10.1183/13993003.00234-2016
31. Ochijewicz D, Rdzanek A, Przybyłowski T, Rubinsztajn R, Budnik M, Pędzich E, et al. Influence of apnea hypopnea index and the degree of airflow limitation on endothelial function in patients undergoing diagnostic coronary angiography. Biology (2022) 11(3):457. doi: 10.3390/biology11030457
32. Patel JA, Ray BJ, Fernandez-Salvador C, Gouveia C, Zaghi S, Camacho M. Neuromuscular function of the soft palate and uvula in snoring and obstructive sleep apnea: A systematic review. Am J Otolaryng (2018) 39:327–37. doi: 10.1016/j.amjoto.2018.03.006
33. Moreno-Indias I, Torres M, Sanchez-Alcoholado L, Cardona F, Almendros I, Gozal D, et al. Normoxic recovery mimicking treatment of sleep apnea does not reverse intermittent hypoxia-induced bacterial dysbiosis and low-grade endotoxemia in mice. Sleep (2016) 39:1891–7. doi: 10.5665/sleep.6176
34. Durgan DJ, Ganesh BP, Cope JL, Ajami NJ, Phillips SC, Petrosino JF, et al. Role of the gut microbiome in obstructive sleep apnea–induced hypertension. Hypertension (2016) 67:469–74. doi: 10.1161/HYPERTENSIONAHA.115.06672
35. Vandeputte D, Kathagen G, D’hoe K, Vieira-Silva S, Valles-Colomer M, Sabino J, et al. Quantitative microbiome profiling links gut community variation to microbial load. Nature (2017) 551:507–11. doi: 10.1038/nature24460
36. Isabel M-I, Marta T, Josep MM, Lidia S-A, Fernando C, Francisco JT, et al. Intermittent hypoxia alters gut microbiota diversity in a mouse model of sleep apnoea. Eur Respir J (2015) 45:1055. doi: 10.1183/09031936.00184314
37. Zafar H, Saier MH. Gut bacteroides species in health and disease. Gut Microbes (2021) 13:1848158. doi: 10.1080/19490976.2020.1848158
38. Zhao L, Zhang F, Ding X, Wu G, Lam YY, Wang X, et al. Gut bacteria selectively promoted by dietary fibers alleviate type 2 diabetes. Science (2018) 359:1151–6. doi: 10.1126/science.aao5774
39. Sanz Y, Moya-Pérez A. Microbiota, inflammation and obesity. In: Lyte M, Cryan JF, editors. Microbial endocrinology: The microbiota-gut-brain axis in health and disease. New York, NY: Springer New York (2014). p. 291–317.
40. Ye X, Tang X, Li F, Zhu J, Wu M, Wei X, et al. Green and oolong tea extracts with different phytochemical compositions prevent hypertension and modulate the intestinal flora in a high-salt diet fed wistar rats. Front Nutr (2022) 9:892801. doi: 10.3389/fnut.2022.892801
41. Sen P, Molinero-Perez A, O’riordan KJ, Mccafferty CP, O’halloran KD, Cryan JF. Microbiota and sleep: Awakening the gut feeling. Trends Mol Med (2021) 27:935–45. doi: 10.1016/j.molmed.2021.07.004
42. Agudelo-Ochoa GM, Valdés-Duque BE, Giraldo-Giraldo NA, Jaillier-Ramírez AM, Giraldo-Villa A, Acevedo-Castaño I, et al. Gut microbiota profiles in critically ill patients, potential biomarkers and risk variables for sepsis. Gut Microbes (2020) 12:1707610. doi: 10.1080/19490976.2019.1707610
43. Chakraborti CK. New-found link between microbiota and obesity. World J Gastrointest Pathophysiol (2015) 6:110–9. doi: 10.4291/wjgp.v6.i4.110
44. Wang Y, Ablimit N, Zhang Y, Li J, Wang X, Liu J, et al. Novel β-mannanase/glp-1 fusion peptide high effectively ameliorates obesity in a mouse model by modifying balance of gut microbiota. Int J Biol Macromol (2021) 191:753–63. doi: 10.1016/j.ijbiomac.2021.09.150
45. Zhong Y-B, Kang Z-P, Wang M-X, Long J, Wang H-Y, Huang J-Q, et al. Curcumin ameliorated dextran sulfate sodium-induced colitis via regulating the homeostasis of dcs and treg and improving the composition of the gut microbiota. J Funct Foods (2021) 86:104716. doi: 10.1016/j.jff.2021.104716
46. Ma Q, Li Y, Li P, Wang M, Wang J, Tang Z, et al. Research progress in the relationship between type 2 diabetes mellitus and intestinal flora. BioMed Pharmacother (2019) 117:109138. doi: 10.1016/j.biopha.2019.109138
47. Poroyko VA, Carreras A, Khalyfa A, Khalyfa AA, Leone V, Peris E, et al. Chronic sleep disruption alters gut microbiota, induces systemic and adipose tissue inflammation and insulin resistance in mice. Sci Rep (2016) 6:35405. doi: 10.1038/srep35405
48. Ma W, Song J, Wang H, Shi F, Zhou N, Jiang J, et al. Chronic paradoxical sleep deprivation-induced depressionlike behavior, energy metabolism and microbial changes in rats. Life Sci (2019) 225:88–97. doi: 10.1016/j.lfs.2019.04.006
49. Zhang Q, Yun Y, An H, Zhao W, Ma T, Wang Z, et al. Gut microbiome composition associated with major depressive disorder and sleep quality. Front Psychiatry (2021) 12:645045. doi: 10.3389/fpsyt.2021.645045
50. Farré N, Farré R, Gozal D. Sleep apnea morbidity: A consequence of microbial-immune cross-talk? Chest (2018) 154:754–9. doi: 10.1016/j.chest.2018.03.001
51. Merschjohann K, Sporer F, Steverding D, Wink M. In vitro effect of alkaloids on bloodstream forms of trypanosoma brucei and t. Congolense. Planta Med (2001) 67:623–7. doi: 10.1055/s-2001-17351
52. Xu F, Li Q, Wang S, Bai J, Dong M, Xiao G, et al. Lactobacillus casei jy300-8 generated by 12c6+ beams mutagenesis inhibits tumor progression by modulating the gut microbiota in mice. J Funct Foods (2021) 87:104779. doi: 10.1016/j.jff.2021.104779
53. Seashore MR. "Chapter 53 - organic acid disorders," In: Rosenberg RN, Pascual JM, editors, fifth. Rosenberg's molecular and genetic basis of neurological and psychiatric disease. Boston: Academic Press (2015). p. 601–6.
54. Stanek A, Brożyna-Tkaczyk K, Myśliński W. Oxidative stress markers among obstructive sleep apnea patients. Oxid Med Cell Longev (2021) 2021:9681595. doi: 10.1155/2021/9681595
55. Kim D-H, Kim J-S, Mok C-S, Chang E-H, Choi J, Lim J, et al. Dtmp imbalance through thymidylate 5′-phosphohydrolase activity induces apoptosis in triple-negative breast cancers. Sci Rep (2022) 12:20027. doi: 10.1038/s41598-022-24706-4
56. Nishina A, Shimizu K, Koketsu M, Ninomiya M, Sato D, Suzuki T, et al. 5,7-dihydroxyflavone analogues may regulate lipopolysaccharide-induced inflammatory responses by suppressing iκBα-linked akt and erk5 phosphorylation in raw 264.7 macrophages. Evid-Based Compl Alt (2017) 2017:7898973. doi: 10.1155/2017/7898973
57. Li X-W, Wang X-M, Li S, Yang J-R. Effects of chrysin (5,7-dihydroxyflavone) on vascular remodeling in hypoxia-induced pulmonary hypertension in rats. Chin Med (2015) 10:4. doi: 10.1186/s13020-015-0032-2
58. Lee MJ, Ramanathan S, Mansor SM, Yeong KY, Tan SC. Method validation in quantitative analysis of phase i and phase ii metabolites of mitragynine in human urine using liquid chromatography-tandem mass spectrometry. Anal Biochem (2018) 543:146–61. doi: 10.1016/j.ab.2017.12.021
59. Hata AN, Breyer RM. Pharmacology and signaling of prostaglandin receptors: Multiple roles in inflammation and immune modulation. Pharmacol Therapeut (2004) 103:147–66. doi: 10.1016/j.pharmthera.2004.06.003
60. Mueller M, Hobiger S, Jungbauer A. Red clover extract: A source for substances that activate peroxisome proliferator-activated receptor alpha and ameliorate the cytokine secretion profile of lipopolysaccharide-stimulated macrophages. Menopause (2010) 17:379–87. doi: 10.1097/gme.0b013e3181c94617
61. Jie Z, Xiujian W, Jin L. Pharmacological mechanism and apoptosis effect of baicalein in protecting myocardial ischemia reperfusion injury in rats. Pak J Pharm Sci (2019) 32:407–12.
62. El-Bakoush A, Olajide OA. Formononetin inhibits neuroinflammation and increases estrogen receptor beta (erβ) protein expression in bv2 microglia. Int Immunopharmacol (2018) 61:325–37. doi: 10.1016/j.intimp.2018.06.016
63. Wu G. Amino acids: Metabolism, functions, and nutrition. Amino Acids (2009) 37:1–17. doi: 10.1007/s00726-009-0269-0
64. Chen S, Guo F, Liu X, Xi J, Xue M, Guo Y, et al. Roles of the rhoa-rock signaling pathway in the endothelial h2s production and vasodilation in rat cerebral arteries. ACS Omega (2022) 7:18498–508. doi: 10.1021/acsomega.2c00996
65. Pisarenko OI, Shul’zhenko VS, Studneva IM. Efficiency of cardioplegic solutions containing l-arginine and l-aspartic acid. B-Exp Biol Med+ (2006) 141:410–3. doi: 10.1007/s10517-006-0185-1
66. Wang R, Shi L, Liu S, Liu Z, Song F, Sun Z, et al. Mass spectrometry-based urinary metabolomics for the investigation on the mechanism of action of eleutherococcus senticosus (rupr. & maxim.) maxim. Leaves against ischemic stroke in rats. J Ethnopharmacol (2019) 241:111969. doi: 10.1016/j.jep.2019.111969
67. Sugaya N, Izawa S, Ogawa N, Shirotsuki K, Nomura S. Association between hair cortisol and diurnal basal cortisol levels: A 30-day validation study. Psychoneuroendocrinology (2020) 116:104650. doi: 10.1016/j.psyneuen.2020.104650
68. Langenbach F, Handschel J. Effects of dexamethasone, ascorbic acid and β-glycerophosphate on the osteogenic differentiation of stem cells in vitro. Stem Cell Res Ther (2013) 4:117. doi: 10.1186/scrt328
69. Nemet I, Saha PP, Gupta N, Zhu W, Romano KA, Skye SM, et al. A cardiovascular disease-linked gut microbial metabolite acts via adrenergic receptors. Cell (2020) 180:862–877.e822. doi: 10.1016/j.cell.2020.02.016
70. Santos AP, Moreno PRH. Alkaloids derived from histidine: Imidazole (pilocarpine, pilosine). In: Ramawat KG, Mérillon J-M, editors. Natural products: Phytochemistry, botany and metabolism of alkaloids, phenolics and terpenes. Berlin, Heidelberg: Springer Berlin Heidelberg (2013). p. 861–82.
71. Xie L, Xu C, Fan Y, Li Y, Wang Y, Zhang X, et al. Effect of fecal microbiota transplantation in patients with slow transit constipation and the relative mechanisms based on the protein digestion and absorption pathway. J Transl Med (2021) 19:490. doi: 10.1186/s12967-021-03152-2
72. Zhang W, Zhang Y, Li Y, Ma D, Zhang H, Kwok L-Y. Lacticaseibacillus rhamnosus probio-m9-driven mouse mammary tumor-inhibitory effect is accompanied by modulation of host gut microbiota, immunity, and serum metabolome. Nutrients (2023) 15(1):5. doi: 10.3390/nu15010005
73. Wolpaw AJ, Dang CV. Exploiting metabolic vulnerabilities of cancer with precision and accuracy. Trends Cell Biol (2018) 28:201–12. doi: 10.1016/j.tcb.2017.11.006
74. Zhu L, Jia W, Wan X, Zhuang P, Ma G, Jiao J, et al. Advancing metabolic networks and mapping updated urinary metabolic fingerprints after exposure to typical carcinogenic heterocyclic aromatic amines. Environ pollut (2023) 319:120936. doi: 10.1016/j.envpol.2022.120936
75. Boo YC. Mechanistic basis and clinical evidence for the applications of nicotinamide (niacinamide) to control skin aging and pigmentation. Antioxidants (2021) 10(8):1315. doi: 10.3390/antiox10081315
76. Brunelli L, Davin A, Sestito G, Mimmi MC, De Simone G, Balducci C, et al. Plasmatic hippuric acid as a hallmark of frailty in an italian cohort: The mediation effect of fruit–vegetable intake. Journals Gerontology: Ser A (2021) 76:2081–9. doi: 10.1093/gerona/glab244
77. Lovászi M, Németh ZH, Gause WC, Beesley J, Pacher P, Haskó G. Inosine monophosphate and inosine differentially regulate endotoxemia and bacterial sepsis. FASEB J (2021) 35:e21935. doi: 10.1096/fj.202100862R
78. Hansen SH, Andersen ML, Birkedal H, Cornett C, Wibrand F. The important role of taurine in oxidative metabolism. In: Oja SS, Saransaari P, editors. Taurine 6. Springer US (2006). p. 129–35.
79. Cui J-W, Hou T-J, Wang Q, Gao G-G, Bi S, Zhou K-C, et al. An enzyme assisted electrochemical detection system of purine intracellular utilizing mwcnts-il modified glassy carbon electrode. Electrochim Acta (2015) 180:360–5. doi: 10.1016/j.electacta.2015.08.138
80. Rezaeinasab M, Benvidi A, Gharaghani S, Abbasi S, Zare HR. Electrochemical investigation of the inhibition effect of carvacrol on xanthine oxidase activity merging with theoretical studies. Process Biochem (2019) 83:86–95. doi: 10.1016/j.procbio.2019.03.014
81. Maynard AG, Kanarek N. Nadh ties one-carbon metabolism to cellular respiration. Cell Metab (2020) 31:660–2. doi: 10.1016/j.cmet.2020.03.012
82. Kourtzidis IA, Stoupas AT, Gioris IS, Veskoukis AS, Margaritelis NV, Tsantarliotou M, et al. The nad+ precursor nicotinamide riboside decreases exercise performance in rats. J Int Soc Sport Nutr (2016) 13:32. doi: 10.1186/s12970-016-0143-x
83. Sato I, Yamamoto S, Kakimoto M, Fujii M, Honma K, Kumazaki S, et al. Suppression of nitric oxide synthase aggravates non-alcoholic steatohepatitis and atherosclerosis in shrsp5/dmcr rat via acceleration of abnormal lipid metabolism. Pharmacol Rep (2022) 74:669–83. doi: 10.1007/s43440-022-00380-1
84. Esser J, Gehrmann U, D'alexandri FL, Hidalgo-Estévez AM, Wheelock CE, Scheynius A, et al. Exosomes from human macrophages and dendritic cells contain enzymes for leukotriene biosynthesis and promote granulocyte migration. J Allergy Clin Immun (2010) 126:1032–1040.e1034. doi: 10.1016/j.jaci.2010.06.039
85. Jalaleddine N, Hachim M, Al-Hroub H, Saheb Sharif-Askari N, Senok A, Elmoselhi A, et al. N6-acetyl-l-lysine and p-cresol as key metabolites in the pathogenesis of covid-19 in obese patients. Front Immunol (2022) 13:827603. doi: 10.3389/fimmu.2022.827603
86. Chen W, Fitzpatrick J, Sozio SM, Jaar BG, Estrella MM, Riascos-Bernal DF, et al. Identification of novel biomarkers and pathways for coronary artery calcification in nondiabetic patients on hemodialysis using metabolomic profiling. Kidney (2021) 360:2. doi: 10.34067/KID.0004422020
87. Broeders EPM, Nascimento EBM, Havekes B, Brans B, Roumans KHM, Tailleux A, et al. The bile acid chenodeoxycholic acid increases human brown adipose tissue activity. Cell Metab (2015) 22:418–26. doi: 10.1016/j.cmet.2015.07.002
88. Yamauchi M, Nakano H, Maekawa J, Okamoto Y, Ohnishi Y, Suzuki T, et al. Oxidative stress in obstructive sleep apnea. Chest (2005) 127:1674–9. doi: 10.1378/chest.127.5.1674
89. Pan Z, Wu X, Zhang X, Hu K. Phosphodiesterase 4b activation exacerbates pulmonary hypertension induced by intermittent hypoxia by regulating mitochondrial injury and camp/pka/p-creb/pgc-1α signaling. BioMed Pharmacother (2023) 158:114095. doi: 10.1016/j.biopha.2022.114095
90. Li L, Yang Y, Zhang H, Du Y, Jiao X, Yu H, et al. Salidroside ameliorated intermittent hypoxia-aggravated endothelial barrier disruption and atherosclerosis via the camp/pka/rhoa signaling pathway. Front Pharmacol (2021) 12:723922. doi: 10.3389/fphar.2021.723922
91. Dejean L, Beauvoit B, Bunoust O, Guérin B, Rigoulet M. Activation of ras cascade increases the mitochondrial enzyme content of respiratory competent yeast. Biochem Bioph Res Co (2002) 293:1383–8. doi: 10.1016/S0006-291X(02)00391-1
Keywords: obstructive sleep apnea, chronic intermittent hypoxia, gut microbiota, metabolomics, cAMP pathway
Citation: Li C and Shi S (2024) Gut microbiota and metabolic profiles in chronic intermittent hypoxia-induced rats: disease-associated dysbiosis and metabolic disturbances. Front. Endocrinol. 14:1224396. doi: 10.3389/fendo.2023.1224396
Received: 17 May 2023; Accepted: 27 December 2023;
Published: 12 January 2024.
Edited by:
Ma. Cecilia Opazo, Universidad de las Américas, ChileReviewed by:
Valentina Caputi, University College Cork, IrelandAmélia M. Sarmento, Fernando Pessoa University, Portugal
Copyright © 2024 Li and Shi. This is an open-access article distributed under the terms of the Creative Commons Attribution License (CC BY). The use, distribution or reproduction in other forums is permitted, provided the original author(s) and the copyright owner(s) are credited and that the original publication in this journal is cited, in accordance with accepted academic practice. No use, distribution or reproduction is permitted which does not comply with these terms.
*Correspondence: Song Shi, SS3517@shtrhospital.com