 Suijian Wang
 Kui Wang2†
 Xiaohong Chen
- 1Department of Endocrinology, The First Affiliated Hospital, School of Medicine, Shantou University, Shantou, China
- 2Department of Gastroenterology, Ruijin Hospital, School of Medicine, Shanghai Jiao Tong University, Shanghai, China
Background: Previous studies have suggested a potential association between Autoimmune thyroid disease Thyroid nodules and Sleep Traits, but the evidence is limited and controversial, and the exact causal relationship remains uncertain.
Objective: Therefore, we employed a MR analysis to investigate the causal relationship between Autoimmune thyroid disease, Thyroid nodules and Sleep Traits.
Methods: To explore the interplay between Autoimmune thyroid disease Thyroid nodules and Sleep Traits, we employed MR studies utilizing summary statistics derived from GWAS in individuals of European ancestry. To ensure robustness, multiple techniques were employed to assess the stability of the causal effect, including random-effect inverse variance weighted, weighted median, MR-Egger regression, and MR-PRESSO. Heterogeneity was evaluated using Cochran’s Q value. Additionally, we investigated the presence of horizontal pleiotropy through MR-Egger regression and MR-PRESSO.
Results: The IVW method indicates a significant causal relationship between “Getting up” and autoimmune hypothyroidism, as revealed by the IVW method (OR: 0.59, 95% CI: 0.45 to 0.78, P-value = 1.99e-4). Additionally, there might be a potential correlation between sleep duration and autoimmune hypothyroidism (OR: 0.76, 95% CI: 0.60 to 0.79, P-value = 0.024). Moreover, the observed potential positive link between daytime nap and thyroid nodules (OR: 1.66, 95% CI: 1.07 to 2.58, P-value = 0.023) is subject to caution, as subsequent MR PRESSO testing reveals the presence of horizontal pleiotropy, raising concerns about the reliability of the findings. The findings suggested a potential inverse association between Autoimmune hypothyroidism and Getting up (OR: 0.99, 95% CI: 0.98 to 1.00, P-value = 6.66e-3).As the results of MR-Egger method(OR: 1.00, 95% CI: 0.98 to 1.02, P-value = 0.742) exhibited an opposing trend to that observed with the IVW method and the results did not reach significance after P-value correction.
Conclusion: The results of our study reveal a notable cause-and-effect relationship between Getting up and Autoimmune hypothyroidism, indicating its potential role as a protective factor against this condition. However, no causal connection was observed between sleep traits and Graves’ disease or Thyroid nodules
1 Introduction
Sleep plays a crucial role in maintaining human health, impacting various vital physiological functions (1, 2). The regulation of sleep is intricate and subject to precise physiological control (3). Virtually all cells of the body possess an intrinsic circadian clock that spans approximately 24 hours, operating autonomously (4). This circadian system plays a crucial role in tightly regulating physiological functions and endocrine rhythms (4, 5). A wealth of evidence concurs that chronic circadian disruption, arising from either shift work or crossing time zones frequently, yields lasting repercussions on human health, heightening the risk of mental disorders, type 2 diabetes mellitus, cardiovascular disease, and mortality (6–10). The disruption of the endocrine system’s circadian regulation represents a crucial mechanism through which these adverse outcomes associated with circadian disturbances are mediated (11–13).
Autoimmune thyroid disease(AITD) serves as the leading cause of acquired thyroid dysfunction, exhibiting two distinct clinical presentations known as hyperthyroidism (Graves’ disease) and hypothyroidism (Hashimoto’s thyroiditis) (14). Hashimoto’s thyroiditis is characterized by the presence of autoantibodies targeting thyroid peroxidase and thyroglobulin (15). In contrast, Graves’ disease is associated with the detection of autoantibodies against the TSH receptor (15). Twin studies have provided an estimation indicating that genetic factors contribute to 70%–80% of the susceptibility to autoimmune thyroid disease (16, 17). Multiple susceptibility genes, along with epigenetic and environmental influences, collectively contribute to the development of both conditions (18, 19).
Previous observational studies have proposed that a shorter sleep duration may serve as an independent risk factor for subclinical hypothyroidism and thyroid nodules (14, 20). Conversely, other research suggests that subclinical hypothyroidism may be the underlying cause of reduced sleep duration (21). However, it is important to acknowledge that these findings are subject to the potential confounding effect inherent in observational studies, which may introduce reverse causation. Limited research has been conducted on the relationship between sleep characteristics and hyperthyroidism, but it is widely accepted within the current literature that the heightened neural excitability resulting from thyrotoxicosis, a consequence of hyperthyroidism, is the primary cause of insomnia in individuals with this condition (15). Nonetheless, further investigation is necessary to determine whether hyperthyroidism itself is genuinely associated with sleep disturbances. To date, no studies have provided additional evidence in this particular aspect, and providing a definitive answer to this question through clinical research poses significant difficulties.
The association between sleep characteristics and AITD, as either an inherent correlation or a potential risk factor, is still a subject of debate. In order to address this issue, we undertook a bidirectional Mendelian randomization (MR) study, utilizing genetic variants identified from genome-wide association studies (GWAS) as instrumental variables (IVs) for environmental exposure (22). This unique methodology allows for causal inference between exposure and outcome, enabling us to elucidate the causal link between AITD and sleep traits.
2 Materials and methods
2.1 Study design and the assumption of MR
In order to investigate the potential association between Graves disease, Autoimmune hypothyroidism, and six sleep traits (Daytime nap, Getting up, Sleep duration, Daytime sleepiness, Short sleep, Long sleep, and Insomnia), we employed a two-sample MR design. Our primary objective was to assess the overall effects and determine the link between these conditions and sleep characteristics. To gain further insights into the bidirectional impact of Graves disease and autoimmune hypothyroidism on sleep traits, we performed reverse MR analysis, as depicted in Figure 1. It is important to note that our MR analysis relied on several key assumptions: (i) the single nucleotide polymorphisms (SNPs) selected as IVs were derived from GWAS and exhibited significant associations with the aforementioned exposures; (ii) the IVs were not influenced by any potential confounding factors; (iii) the IVs manifested a direct influence solely on the risk of outcomes through the investigated exposures (23).
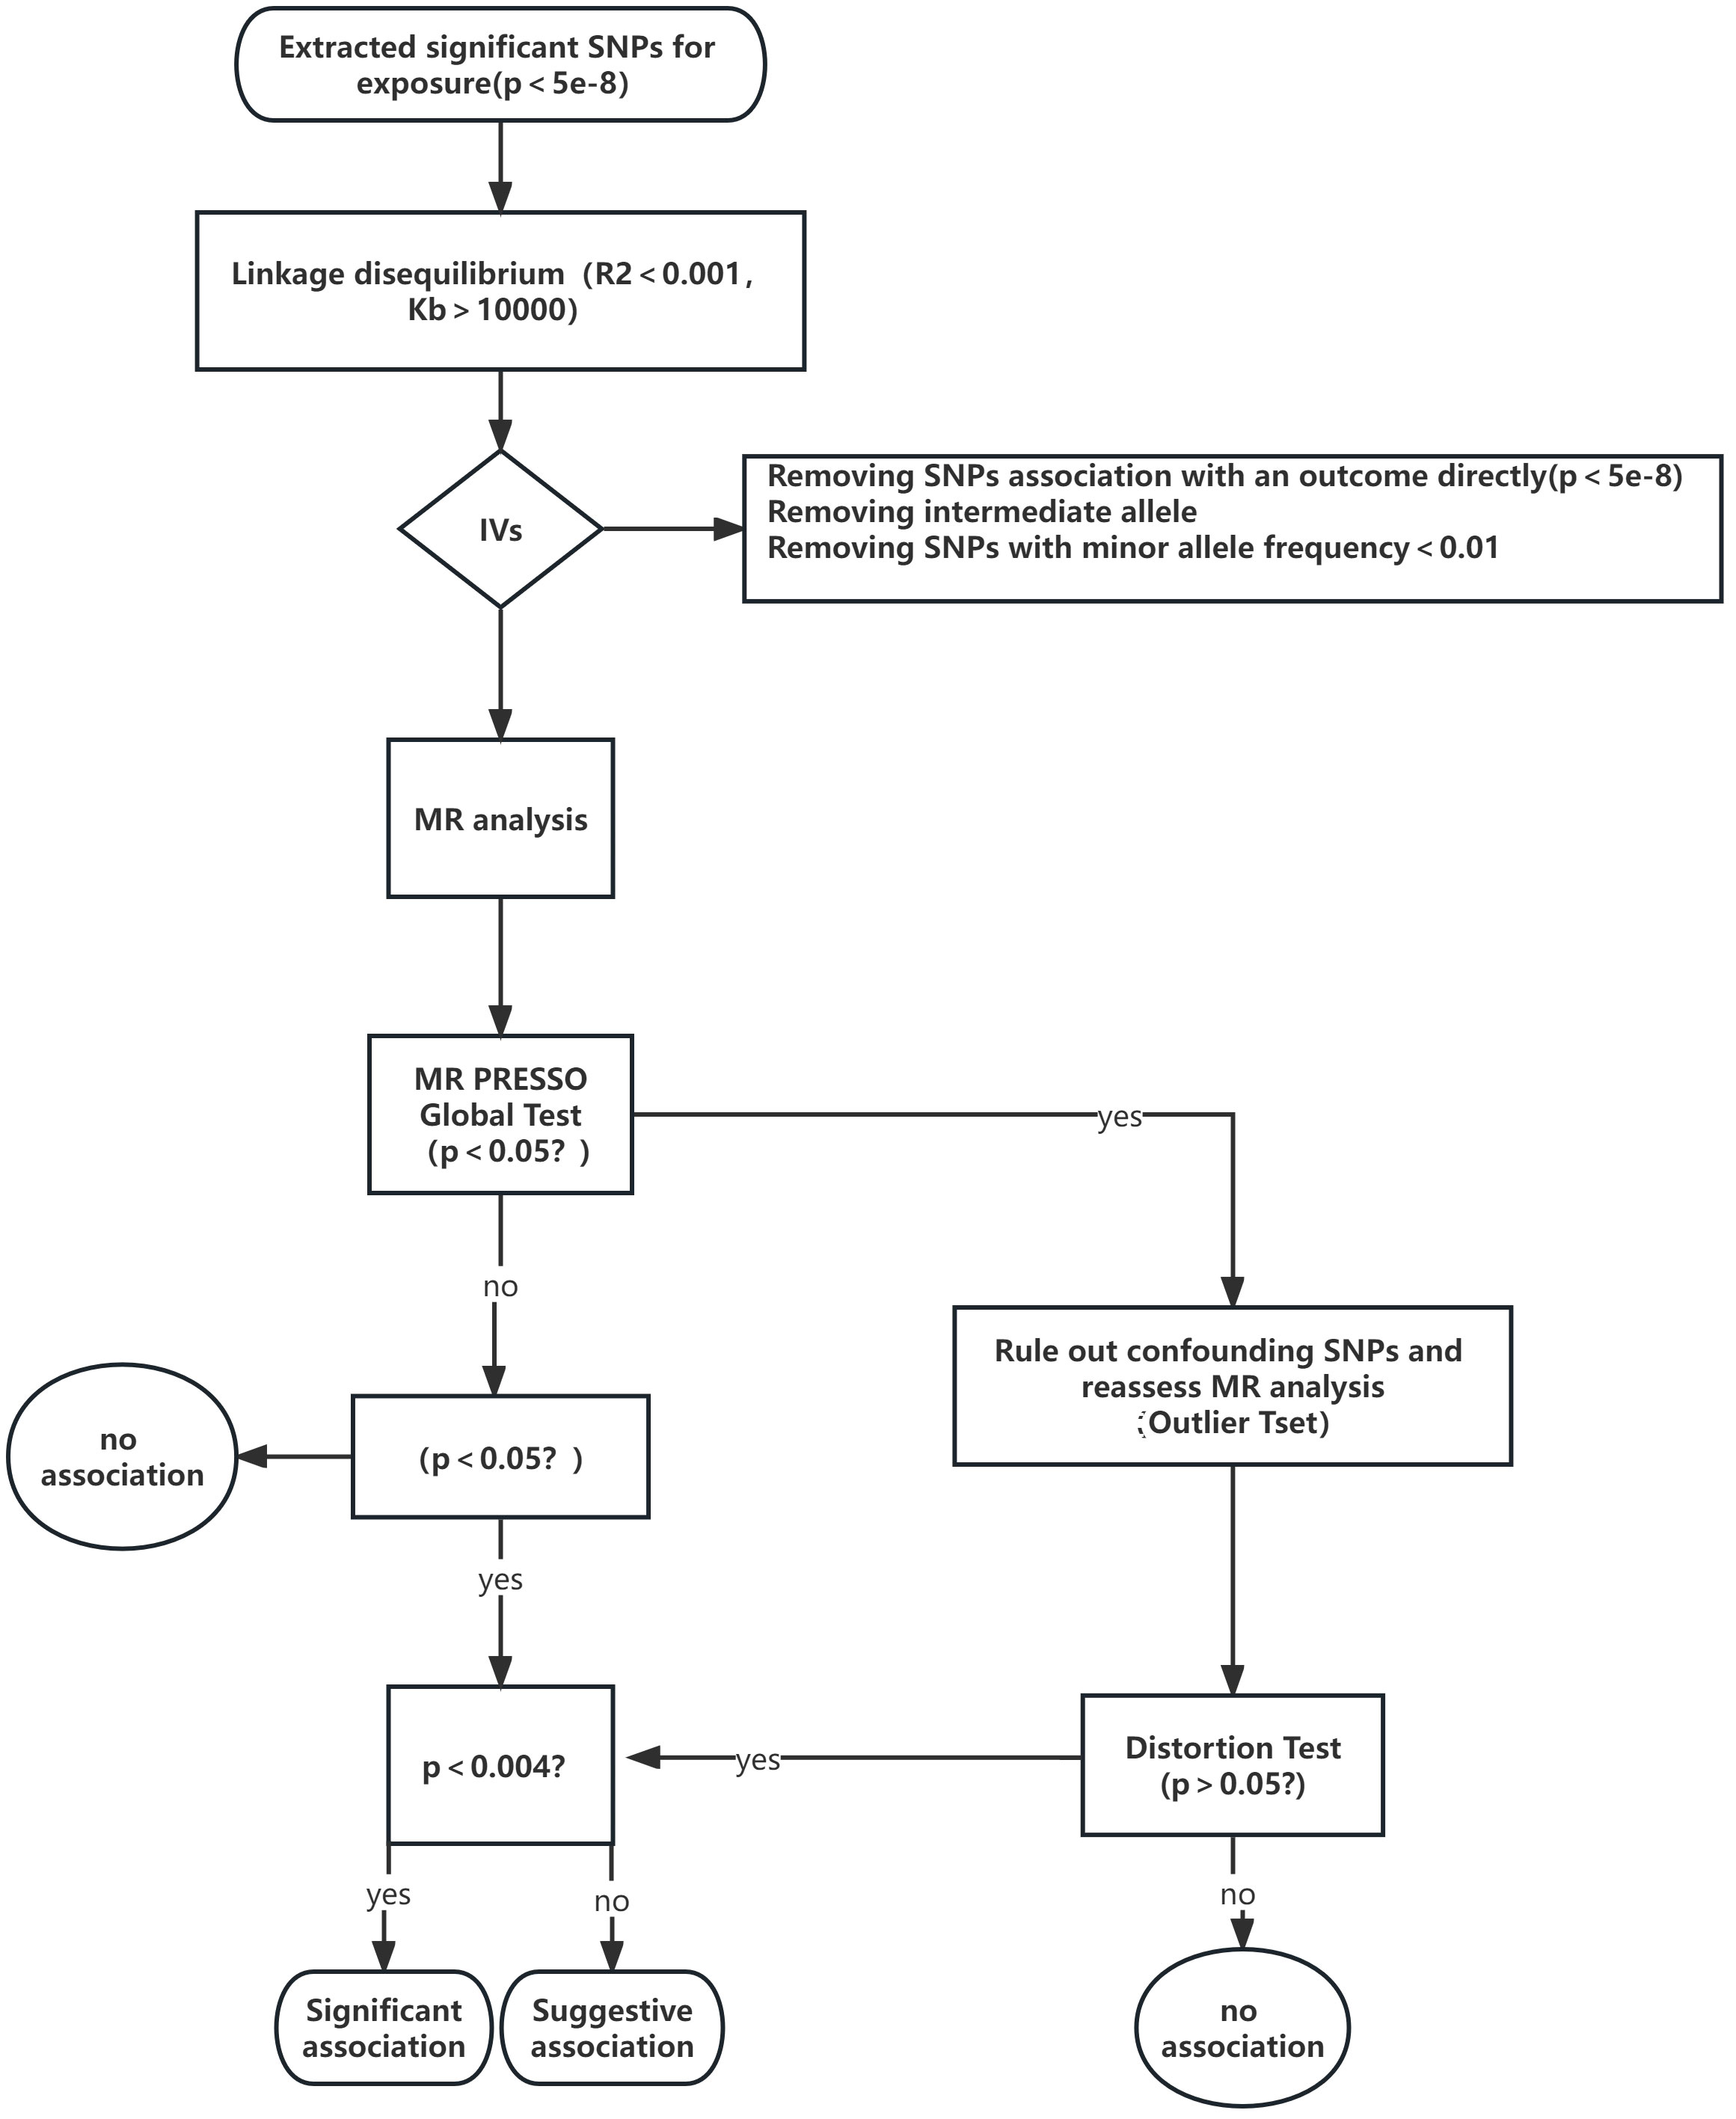
Figure 1 A flow chart outlining the study design and the steps involved in MR analysis.
2.2 Data sources
Daytime nap Hassan S Dashti et al. conducted a genome-wide association analysis on self-reported daytime napping using data from the UK Biobank, which consisted of 452,633 individuals. The assessment of daytime napping in the UK Biobank involved the utilization of a questionnaire, whereby participants were asked to provide information regarding their napping habits. This variable was treated as a frequency measure and categorized into three response options: never/rarely, usually, and always. Within the cohort of UK Biobank participants with European ancestry (N = 452,633), it was found that 38.2% and 5.3% of individuals reported occasional and consistent napping, respectively (24).
Getting up in the Morning Samuel E. Jones et al. employed a genome-wide association analysis to investigate the relationship between self-reported chronotype and genetic variations (25). The analysis included 11,977,111 imputed variants in 449,734 individuals of European ancestry from the UK Biobank. The determination of an individual’s innate preference for morning or night activities was ascertained within the study. Out of the total surveyed population, which included 135,447 participants who completed at least one survey, it was observed that 75.5% of individuals were categorized as either morning or night persons based on their responses. Participants who provided neutral responses (N=32,842) or conflicting answers (N=309) were excluded from the analysis (26). To enhance the statistical power, they also performed a meta-analysis, merging the summary statistics from a separate GWAS focused on self-reported morningness.This secondary analysis encompassed 11,947,421 variants in 248,098 individuals of European ancestry from the 23andMe research cohort (26, 27).
Sleep duration Hassan S Dashti et al. performed analyses of self-reported measures of sleep (28). Self-reported measures analyzed included (a) the number of hours spent sleeping over a 24-h period (including naps); (b) insomnia; (c) chronotype—where “definitely a ‘morning’’ person”, “more a ‘morning’’ than ‘evening’’ person”, “more an ‘evening’’ than a ‘morning’’ person”, “definitely an ‘evening’’ person” and “do not know”, were coded as 2, 1, −1, -2 and 0, respectively, in our continuous variable (29).
Within the cohort of UK Biobank participants with European ancestry (N = 446,118), the average self-reported habitual sleep duration was 7.2 hours per day, with a standard deviation of 1.1. Subsequent analyses were conducted separately for individuals with short sleep duration (<7 hours; N = 106,192 cases) and long sleep duration (≥9 hours; n = 34,184 cases), relative to those with a reference sleep duration of 7-8 hours (N = 305,742 controls). These analyses revealed the identification of 27 loci associated with short sleep duration and 8 loci associated with long sleep duration. Importantly, 13 of these loci were found to be independent from the previously reported 78 loci associated with sleep duration (28).
Daytime sleepiness
A total of 452,071 individuals with European genetic ancestry from the UK Biobank dataset participated in this study (30). These individuals were asked to provide self-reported data on the frequency of daytime sleepiness, specifically relating to instances where they unintentionally dozed off or fell asleep during the day (e.g., while working, reading, or driving). Response categories included “never” (N = 347,285), “sometimes” (N = 92,794), “often” (N = 11,963), and “all of the time” (N = 29). Furthermore, the analysis revealed that the severity of daytime sleepiness exhibited a positive association with older age, female sex, higher body mass index (BMI), various behavioral, social, and environmental factors, as well as the presence of chronic diseases (29).
Insomnia Jacqueline M. Lane et al. conducted a comprehensive investigation wherein they successfully identified 57 loci associated with self-reported insomnia symptoms within the UK Biobank population (N = 453,379),participants were asked to self-report their experience of insomnia symptoms by responding to the question, “Do you have trouble falling asleep at night or do you wake up in the middle of the night?”. Analysis of this sample revealed that 29% of individuals reported experiencing frequent insomnia symptoms (“usually”). Interestingly, a higher prevalence of these symptoms was observed among women (32% vs. 24%), as well as in older participants, shift workers, and those with shorter self-reported sleep duration (31).
The FinnGen Biobank, consisting of individuals with European ancestry, has provided valuable data for a GWAS pertaining to ATID (32). The GWAS dataset included 4,462 cases and 320,703 controls for Graves’ disease (diagnosed with ICD-10 code E05.0), comprising 3,726 female patients and 736 male patients. Additionally, the dataset for autoimmune hypothyroidism included 40,926 cases and 274,069 controls (diagnosed with ICD-10 code E06.3), consisting of 32,732 female patients and 8,194 male patients. With regards to thyroid nodules, a total of 9485 cases and 367792 controls were included in the dataset, classified under the diagnostic code ICD-10 E04.1. Out of these, there were 7899 female patients and 1586 male patients. The complete information is in Table 1.
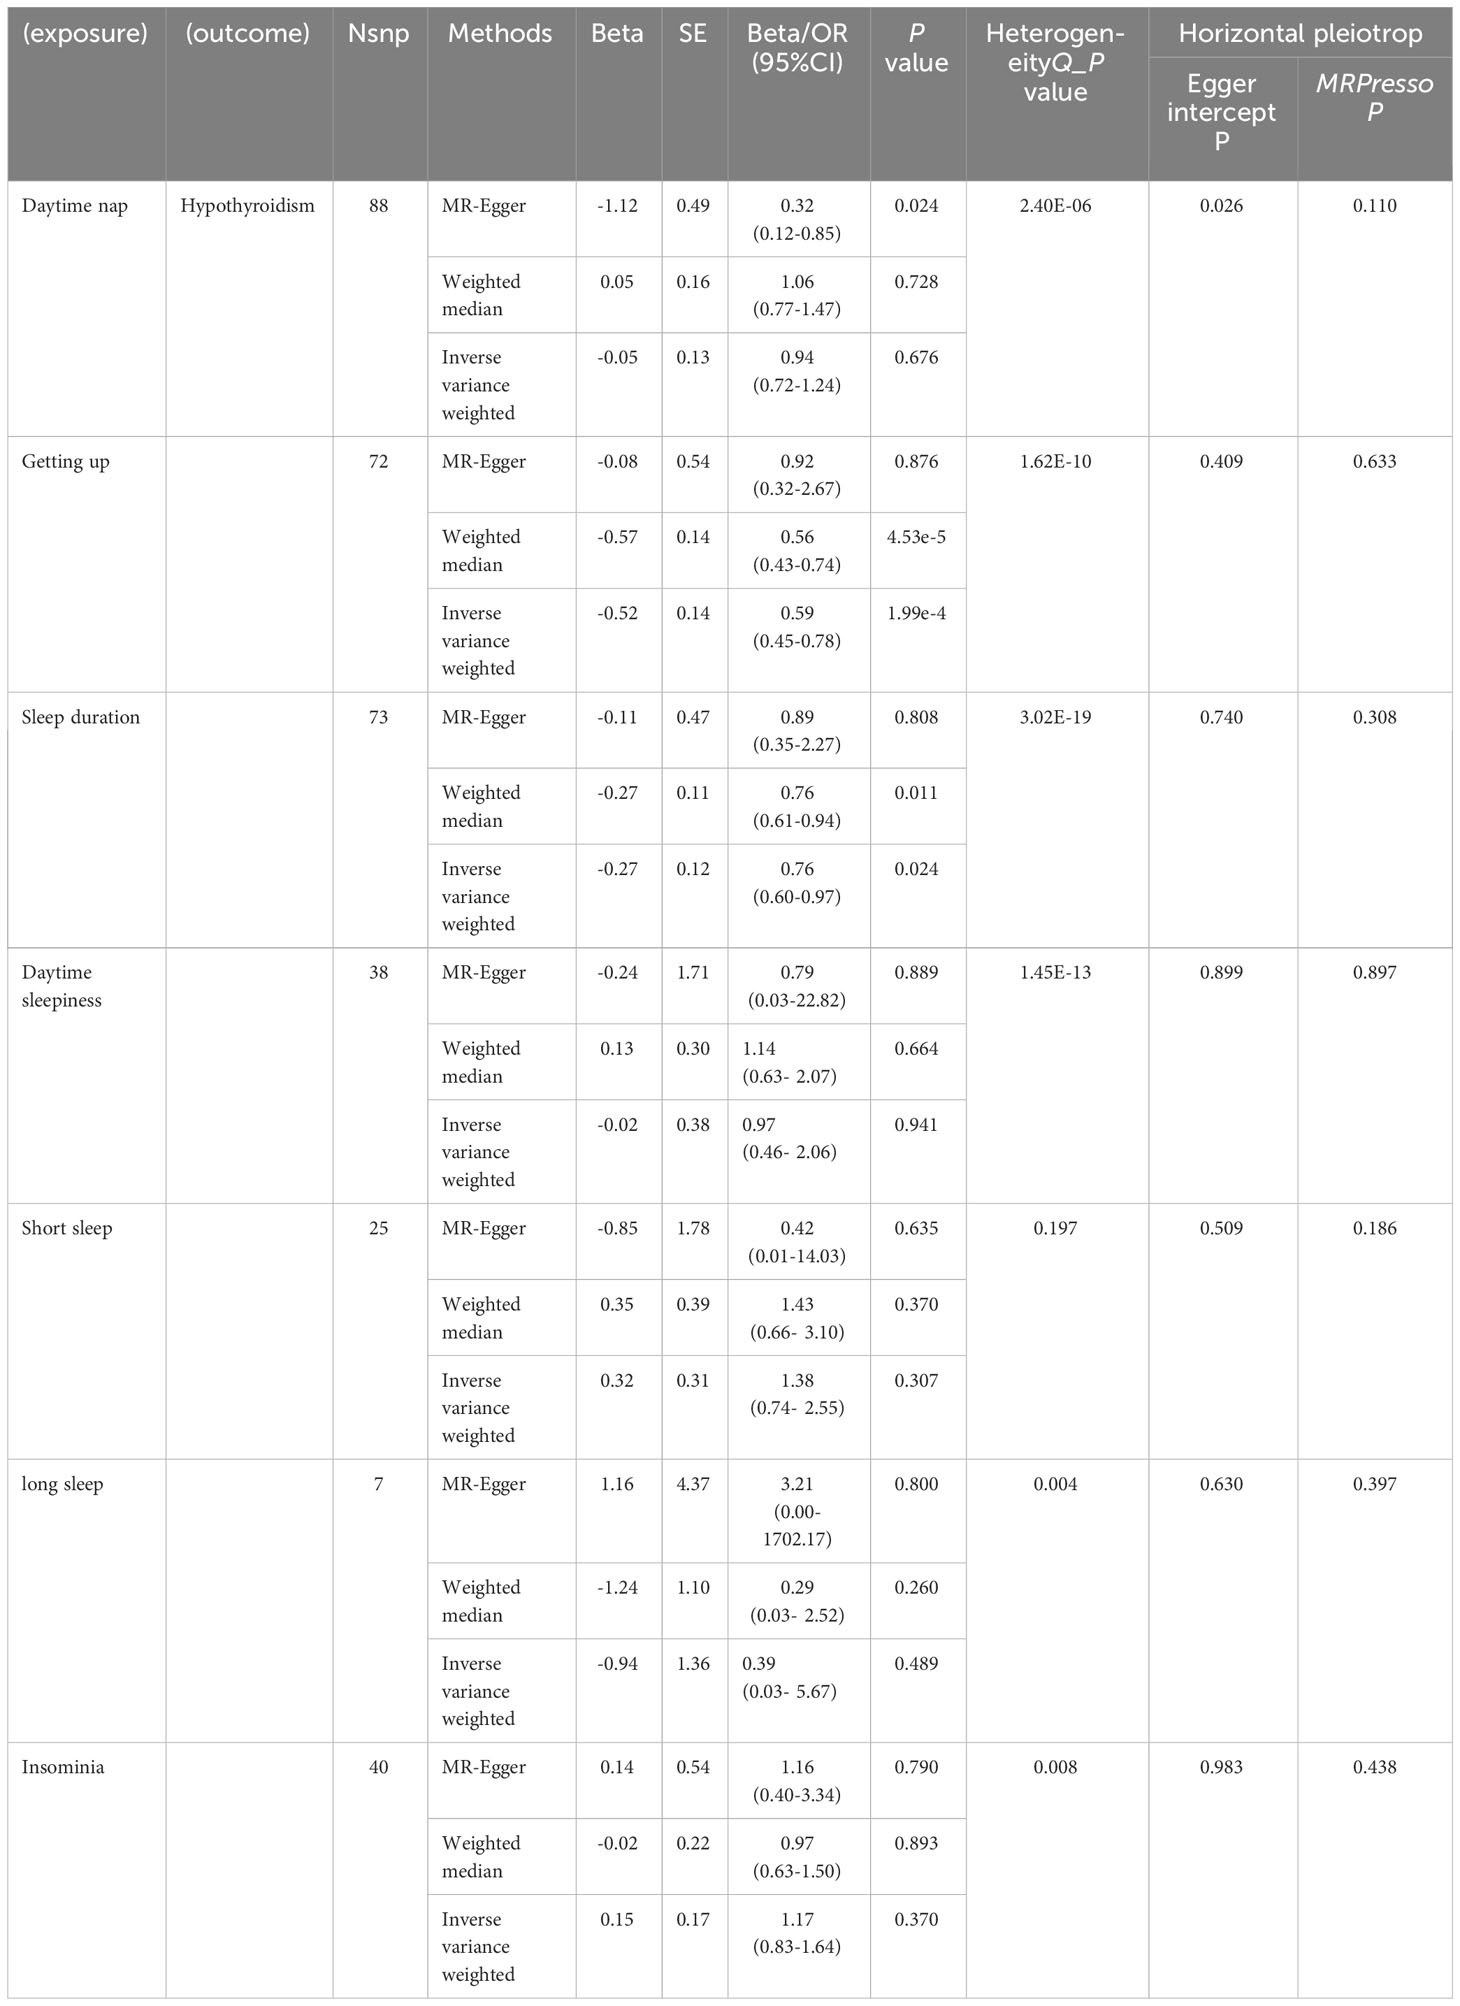
Table 1 Forward MR of the correlation between sleep and hypothyroidism.
2.3 Selection of genetic instrumental variables
To satisfy the assumption of a strong correlation between the exposure and single nucleotide polymorphisms (SNPs), we adopted a rigorous genome-wide significance threshold of P-value (P-value<5x10⁻⁸) when selecting instrumental variables (IVs). Moreover, to achieve dataset harmonization, we systematically removed variants displaying potential linkage disequilibrium (r2 = 0.001, 10,000 kb). Subsequent steps involved standardizing the effect estimates for both the exposure and outcome variants, along with the removal of any potential SNPs harboring incompatible alleles or palindromic SNP (33).We utilized the PhenoScanner database (http://www.phenoscanner.medschl.cam.ac.uk/phenoscanner) to investigate the selected instrumental variables associated with other phenotypes that could potentially influence the outcome. when considering Graves’ disease and Autoimmune hypothyroidism as the exposures, we excluded several SNPs (rs568999, rs2160232, rs9271500, rs10995256) that were associated with anxiety and inflammatory bowel disease, as previous studies have suggested a link between anxiety, inflammatory bowel disease, and sleep disorders (34–37). To assess the strength of genetically determined IVs and avoid any bias towards weak IVs, we used F statistics (beta2/se2) (38) and ensured that F>10 in line with the first MR assumption (39, 40).
2.4 Mendelian randomization analyses
The primary analysis employed the inverse-variance weighted (IVW) method using a random-effects model, taking into consideration the variation among SNPs (41). To validate the findings of the primary analysis, several sensitivity analyses were conducted. Moreover, we employed the weighted median (WM) method, which necessitates allocating over 50% of the weight to valid IVs, to estimate the causal effects (42). Additionally, we evaluated possible horizontal pleiotropy using MR-Egger intercepts (42, 43). To capture and resolve any potential horizontal pleiotropic outliers, we implemented the MR-PRESSO framework and adjusted the IVW estimate by eliminating outliers (44). Furthermore, we conducted a leave-one-out analysis to investigate whether the effect estimates were impacted by any singular outlier variant. The analyses were conducted using the R software (version 4.2.3) Two-Sample MR package. To account for multiple testing, we implemented a Bonferroni-corrected threshold of P-value < 0.0023 (P < 0.05/7/3). P-values ranging from 0.0023 to 0.05 were considered indicative of suggestive associations. The MR analysis procedure is visually presented in Figure 1 through a flowchart, outlining each step in a sequential manner.
3 Result
3.1 Forward MR analysis
3.1.1 Sleep traits and autoimmune hypothyroidism
After the process of data screening, we extracted a total of 88 SNPs as IVs from Daytime nap, 72 SNPs from Getting up, 73 SNPs from Sleep duration, 38 SNPs from Daytime sleepiness, 25 SNPs from Short sleep, 7 SNPs from long sleep, and 40 SNPs from Insomnia when considering Autoimmune hypothyroidism as the outcome (Supplementary Tables 1, 2). Upon evaluating the influence of 72 SNPs from Getting up on Autoimmune hypothyroidism, a consistent assessment revealed a significant negative correlation between Getting up and Autoimmune hypothyroidism (OR: 0.59, 95% CI: 0.45 to 0.78, P-value = 1.99e-4, Table 2). This consistent direction of effect persisted when utilizing both the MR-Egger (OR: 0.92, 95% CI: 0.32 to 2.67, P-value = 0.876, Table 2) and Weighted Median methods (OR: 0.56, 95% CI: 0.43 to 0.74, P-value = 4.53e-5, Table 2). Subsequent tests indicated the presence of heterogeneity (Q-P-value = 1.62E-10, Table 2), prompting the adoption of a random-effects model for estimating the magnitude of the MR effect. The MR Egger intercept (Egger intercept P-value = 0.409,Table 2) confirmed the absence of horizontal pleiotropy. Upon conducting further MR PRESSO testing, three outlier SNPs were identified, and their exclusion resulted in consistent findings with the original results (Distortion Test P-value = 0.633, Table 2). Similarly, when investigating the impact of 73 SNPs on sleep duration in relation to Autoimmune hypothyroidism, a negative correlation was found (OR: 0.76, 95% CI: 0.60 to 0.79, P-value = 0.024, Table 2). This consistent relationship persisted when utilizing both the MR-Egger(OR: 0.89, 95% CI: 0.35 to 2.27, P-value = 0.808, Table 2) and Weighted Median methodologies(OR: 0.76, 95% CI: 0.61 to 0.94, P-value = 0.011, Table 2). Subsequent analyses indicated the presence of heterogeneity (Q-P-value = 3.02E-19,Table 2), prompting the utilization of a random-effects model to estimate the magnitude of the MR effect. The MR Egger intercept (Egger intercept P-value = 0.740, Table 2) confirmed the absence of horizontal pleiotropy. Further application of MR PRESSO analysis revealed the presence of six atypical SNPs. However, after their removal, the obtained results remained unchanged compared to the initial findings(Distortion Test P-value = 0.308, Table 2). However, after Bonferroni correction, the results were not statistically significant. Additionally, no significant associations were observed between Daytime nap (OR: 0.94, 95% CI: 0.72 to 1.24,P-value = 0.676, Supplementary Table 2, Table 1), Daytime sleepiness (OR: 0.97, 95% CI: 0.46 to 2.06, P-value = 0.941, Supplementary Table 2, Table 1), Short sleep (OR: 1.38, 95% CI: 0.74 to 2.52, P-value = 0.307, Supplementary Table 2, Table 1), Long sleep (OR: 0.39, 95% CI: 0.03 to 5.67, P-value = 0.489, Supplementary Table 2, Table 1), and Insomnia (OR: 1.17, 95% CI: 0.83 to 1.64, P-value = 0.370, Supplementary Table 2, Table 1) and Autoimmune hypothyroidism.
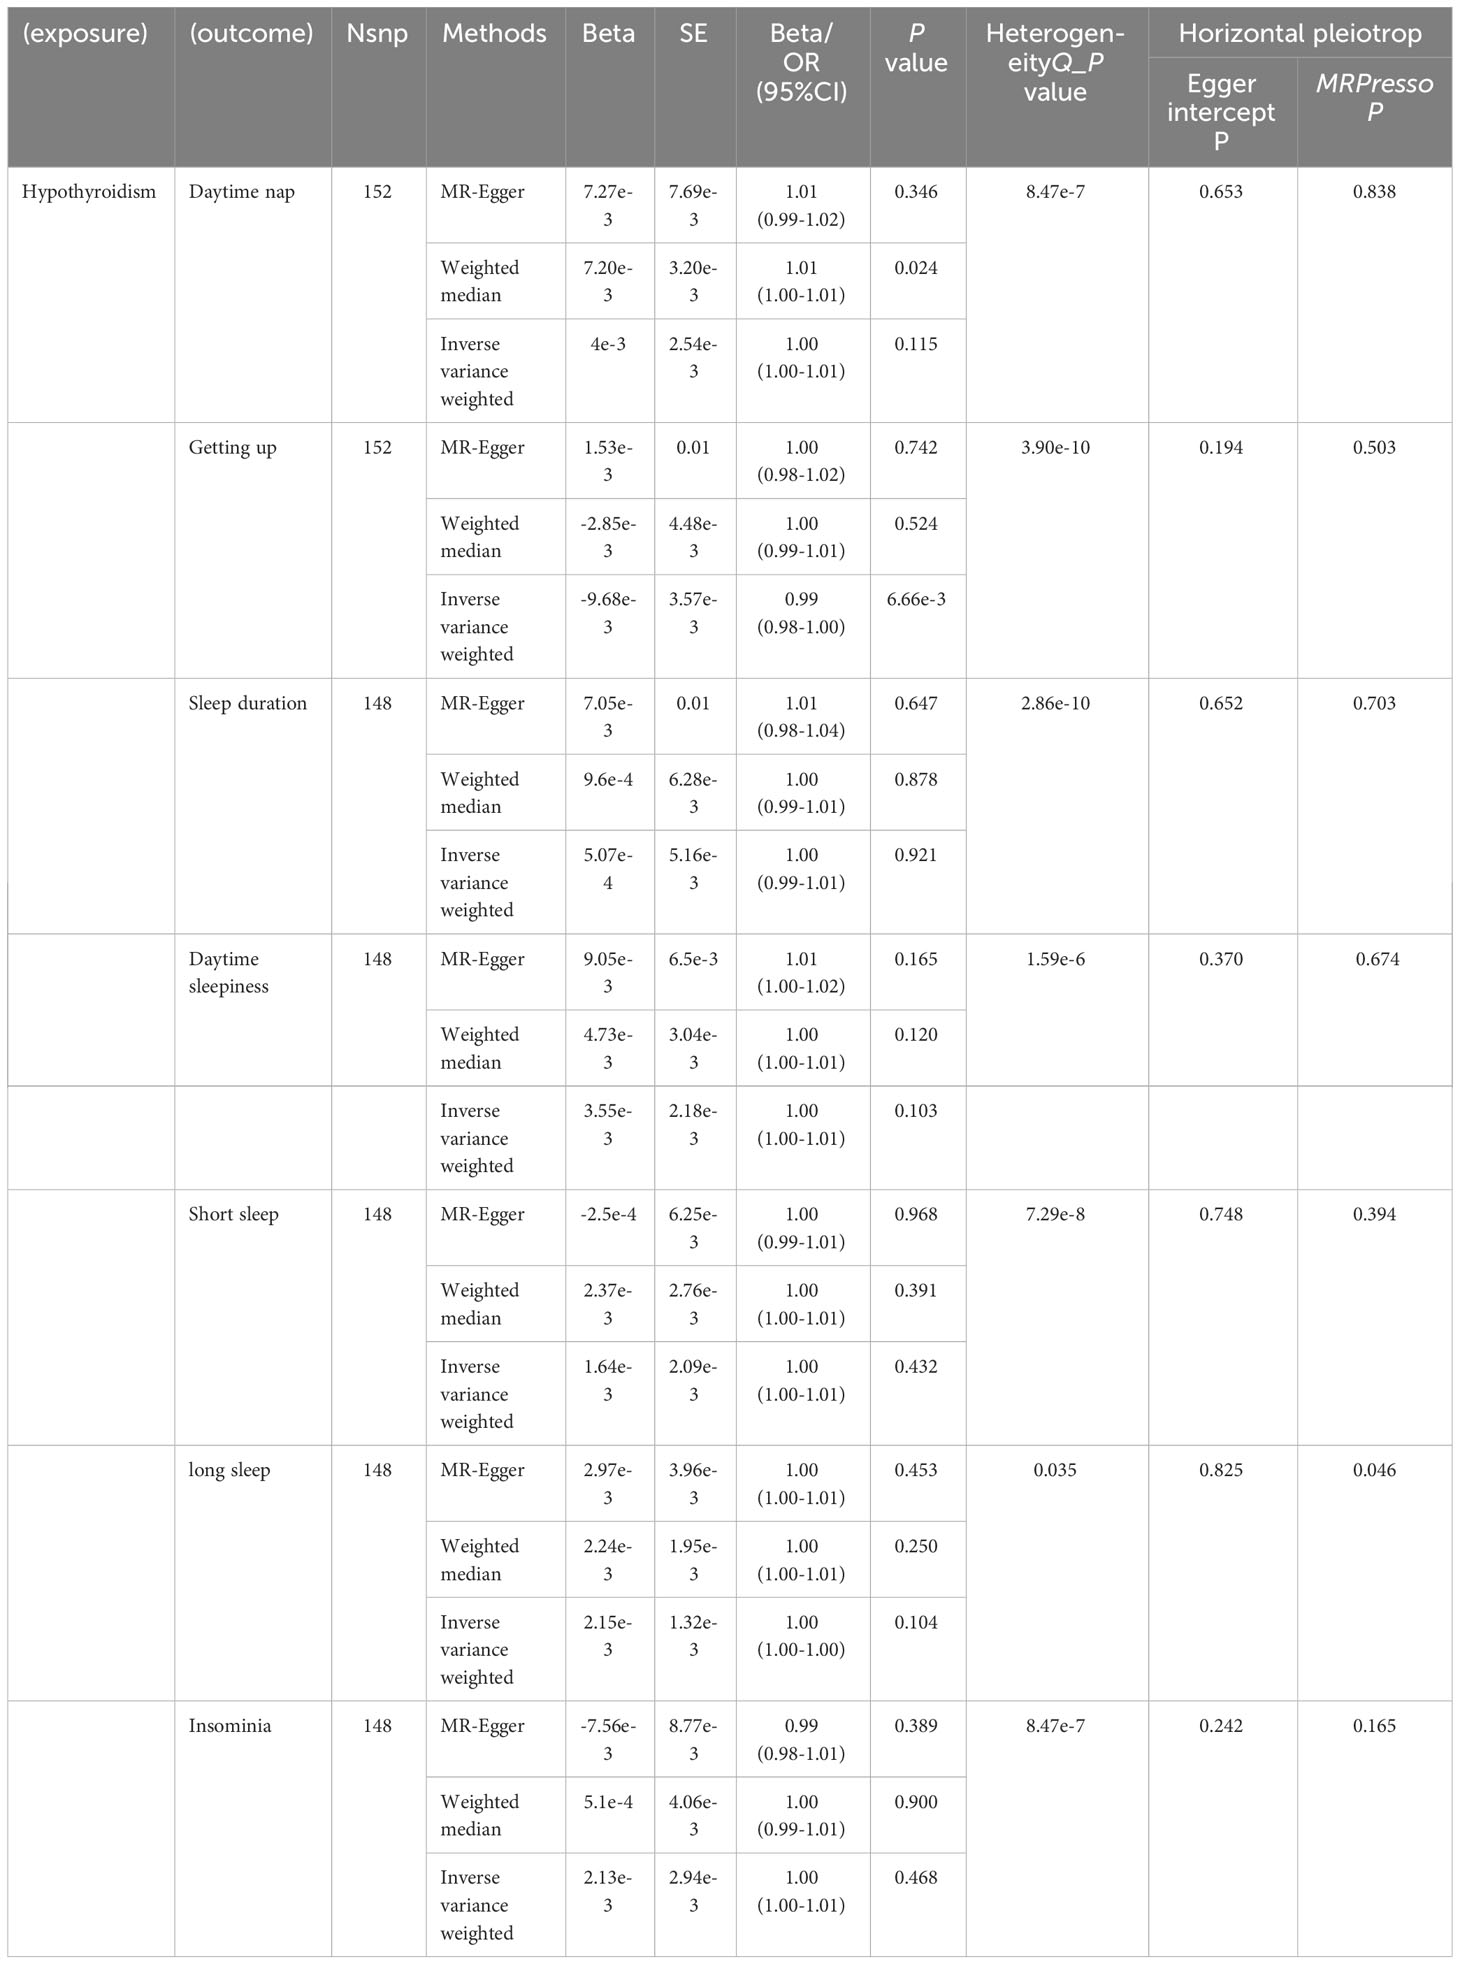
Table 2 Reverse MR of the correlation between sleep and hypothyroidism.
3.1.2 Sleep traits and Graves’ disease
Following data screening procedures, a comprehensive selection of IVs was obtained. Specifically, we identified 87 SNPs from Daytime nap, 72 SNPs from Getting up, 73 SNPs from Sleep duration, 38 SNPs from Daytime sleepiness, 25 SNPs from Short sleep, 7 SNPs from long sleep, and 40 SNPs from Insomnia for the evaluation of Graves’ disease as the primary outcome(Supplementary Tables 1, 2). In the positive MR analysis, no significant causal relationship was found between Daytime nap (OR: 1.32, 95% CI: 0.65 to 2.67, P-value = 0.441, Supplementary Table 2, Table 3), Getting up (OR: 0.69, 95% CI: 0.39 to 1.23, P-value = 0.205, Supplementary Table 2), Sleep duration (OR: 0.79, 95% CI: 0.50 to 1.26, P-value = 0.323, Supplementary Table 2, Table 3), Daytime sleepiness (OR: 0.83, 95% CI: 0.15 to 4.74, P = 0.834, Supplementary Table 2, Table 3), Short sleep (OR: 2.61, 95% CI: 0.04 to 159.44, P-value = 0.647, Supplementary Table 2, Table 3), Long sleep (OR: 0.08, 95% CI: 0.00 to 2.71e6, P-value = 0.932, Supplementary Table 2, Table 3), and Insomnia (OR: 1.96, 95% CI: 0.94 to 4.08, P-value = 0.073, Supplementary Table 2, Table 3) with Graves’ disease.

Table 3 Forward MR of the correlation between sleep and graves.
3.1.3 Sleep traits and thyroid nodules
After conducting rigorous data screening, we successfully identified a wide range of IVs for our analysis. These encompassed 87 SNPs from Daytime nap, 72 SNPs from Getting up, 73 SNPs from Sleep duration, 38 SNPs from Daytime sleepiness, 25 SNPs from Short sleep, 7 SNPs from long sleep, and 40 SNPs from Insomnia. The results revealed a potential positive correlation between Daytime nap and thyroid nodules (OR: 1.66, 95% CI: 1.07 to 2.58, P-value = 0.023, Supplementary Table 2, Table 4). However, subsequent MR PRESSO analysis(Distortion Test P-value = 0.023,Table 2) indicated the presence of horizontal pleiotropy, and after correction, the p-value became non-significant. Therefore, these findings are considered unreliable. No significant causal relationship was found between Getting up (OR: 0.84, 95% CI: 0.56 to 1.26, P-value = 0.404, Supplementary Table 2, Table 4), Sleep duration (OR: 1.31, 95% CI: 0.88 to 1.94, P-value = 0.178,Supplementary Table 2, Table 4), Daytime sleepiness (OR: 2.14, 95% CI: 0.84 to 5.48, P-value = 0.110, Supplementary Table 2, Table 4), Short sleep (OR: 1.52, 95% CI: 0.53 to 4.39, P-value = 0.724, Supplementary Table 2, Table 4), Long sleep (OR: 1.20, 95% CI: 0.07 to 21.90, P-value = 0.900, Supplementary Table 2, Table 4), and Insomnia (OR: 1.02, 95% CI: 0.48 to 2.16, P-value = 0.964, Supplementary Table 2, Table 4) in relation to thyroid nodules.
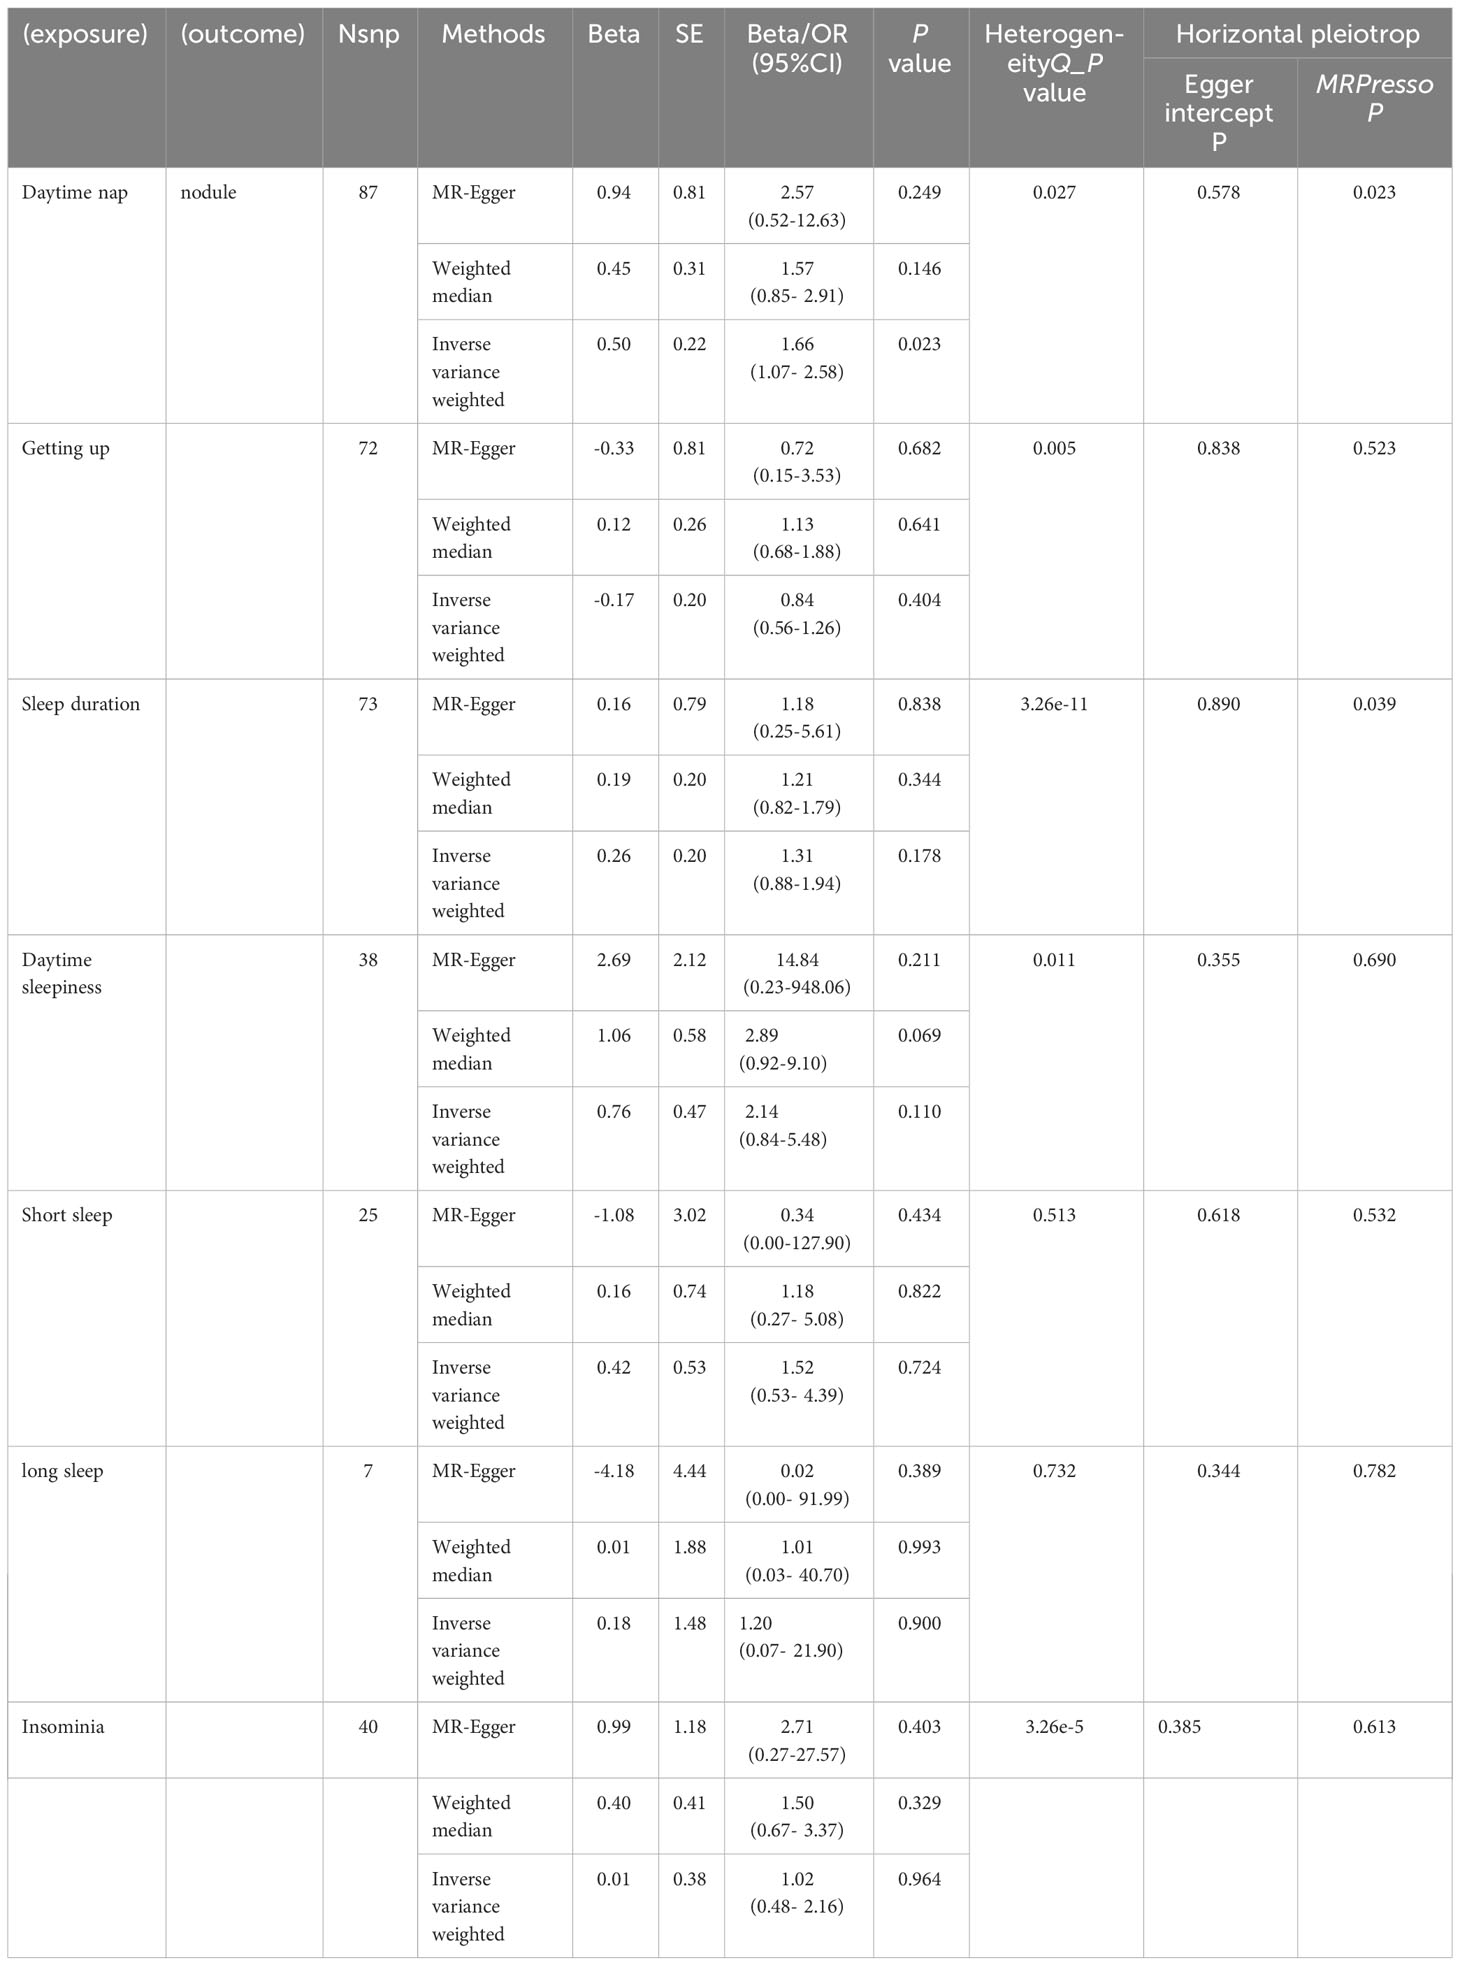
Table 4 Forward MR of the correlation between sleep and nodule.
3.2 Reverse MR analysis
3.2.1 Autoimmune hypothyroidism and sleep traits
When considering autoimmune hypothyroidism as the exposure in reverse MR analysis, 152 SNPs were chosen as IVs.The findings suggested a potential inverse association between Autoimmune hypothyroidism and Getting up (OR: 0.99, 95% CI: 0.98 to 1.00, P-value = 6.66e-3, Table 2). Additional assessments revealed heterogeneity(Q-P-value = 3.90e-10) but did not identify horizontal pleiotropy(Distortion Test P-value = 0.503, Table 2). As the results of MR-Egger method(OR: 1.00, 95% CI: 0.98 to 1.02, P-value = 0.742, Table 2) exhibited an opposing trend to that observed with the IVW method, it is therefore deemed unreliable. After adjusting for P-values, the results were not statistically significant. There were no significant associations observed between autoimmune hypothyroidism and Daytime nap (OR: 0.99, 95% CI: 1.00 to 1.01, P-value = 0.115, Supplementary Table 2, Table 2), Sleep duration (OR: 0.99, 95% CI: 0.98 to 1.01, P-value = 0.921, Supplementary Table 2, Table 2), Daytime sleepiness (OR: 1.00, 95% CI: 1.00 to 1.01, P-value = 0.103, Supplementary Table 2, Table 2), Short sleep (OR: 1.00, 95% CI: 1.00 to 1.01, P-value = 0.432, Supplementary Table 2, Table 2), Long sleep (OR: 1.00, 95% CI: 1.00 to 1.00, P-value = 0.104, Supplementary Table 2, Table 2), or Insomnia (OR: 1.00, 95% CI: 1.00 to 1.01, P-value = 0.468, Supplementary Table 2, Table 2).
3.2.2 Graves’ disease and sleep traits
In the context of reverse MR analysis, utilizing graves disease as the exposure, a total of 24 SNPs were selected as IVs. However, no significant associations were found between Graves’ disease and Daytime nap (OR: 1.00, 95% CI: 0.99 to 1.01, P-value = 0.962, Supplementary Table 2, Table 5), Getting up (OR: 0.99, 95% CI: 0.98 to 1.00, P-value = 0.944, Supplementary Table 2, Table 5), Sleep duration (OR: 0.99, 95% CI: 0.99 to 1.00, P-value = 0.221, Supplementary Table 2, Table 5), Daytime sleepiness (OR: 1.00, 95% CI: 1.00 to 1.00, P-value = 0.881, Supplementary Table 2, Table 5), Short sleep (OR: 1.00, 95% CI: 1.00 to 1.00, P-value = 0.310, Supplementary Table 2, Table 5), Long sleep (OR: 1.00, 95% CI: 1.00 to 1.00, P-value = 0.863, Supplementary Table 2, Table 5), or Insomnia (OR: 1.00, 95% CI: 1.00 to 1.01, P-value = 0.118, Supplementary Table 2, Table 5).
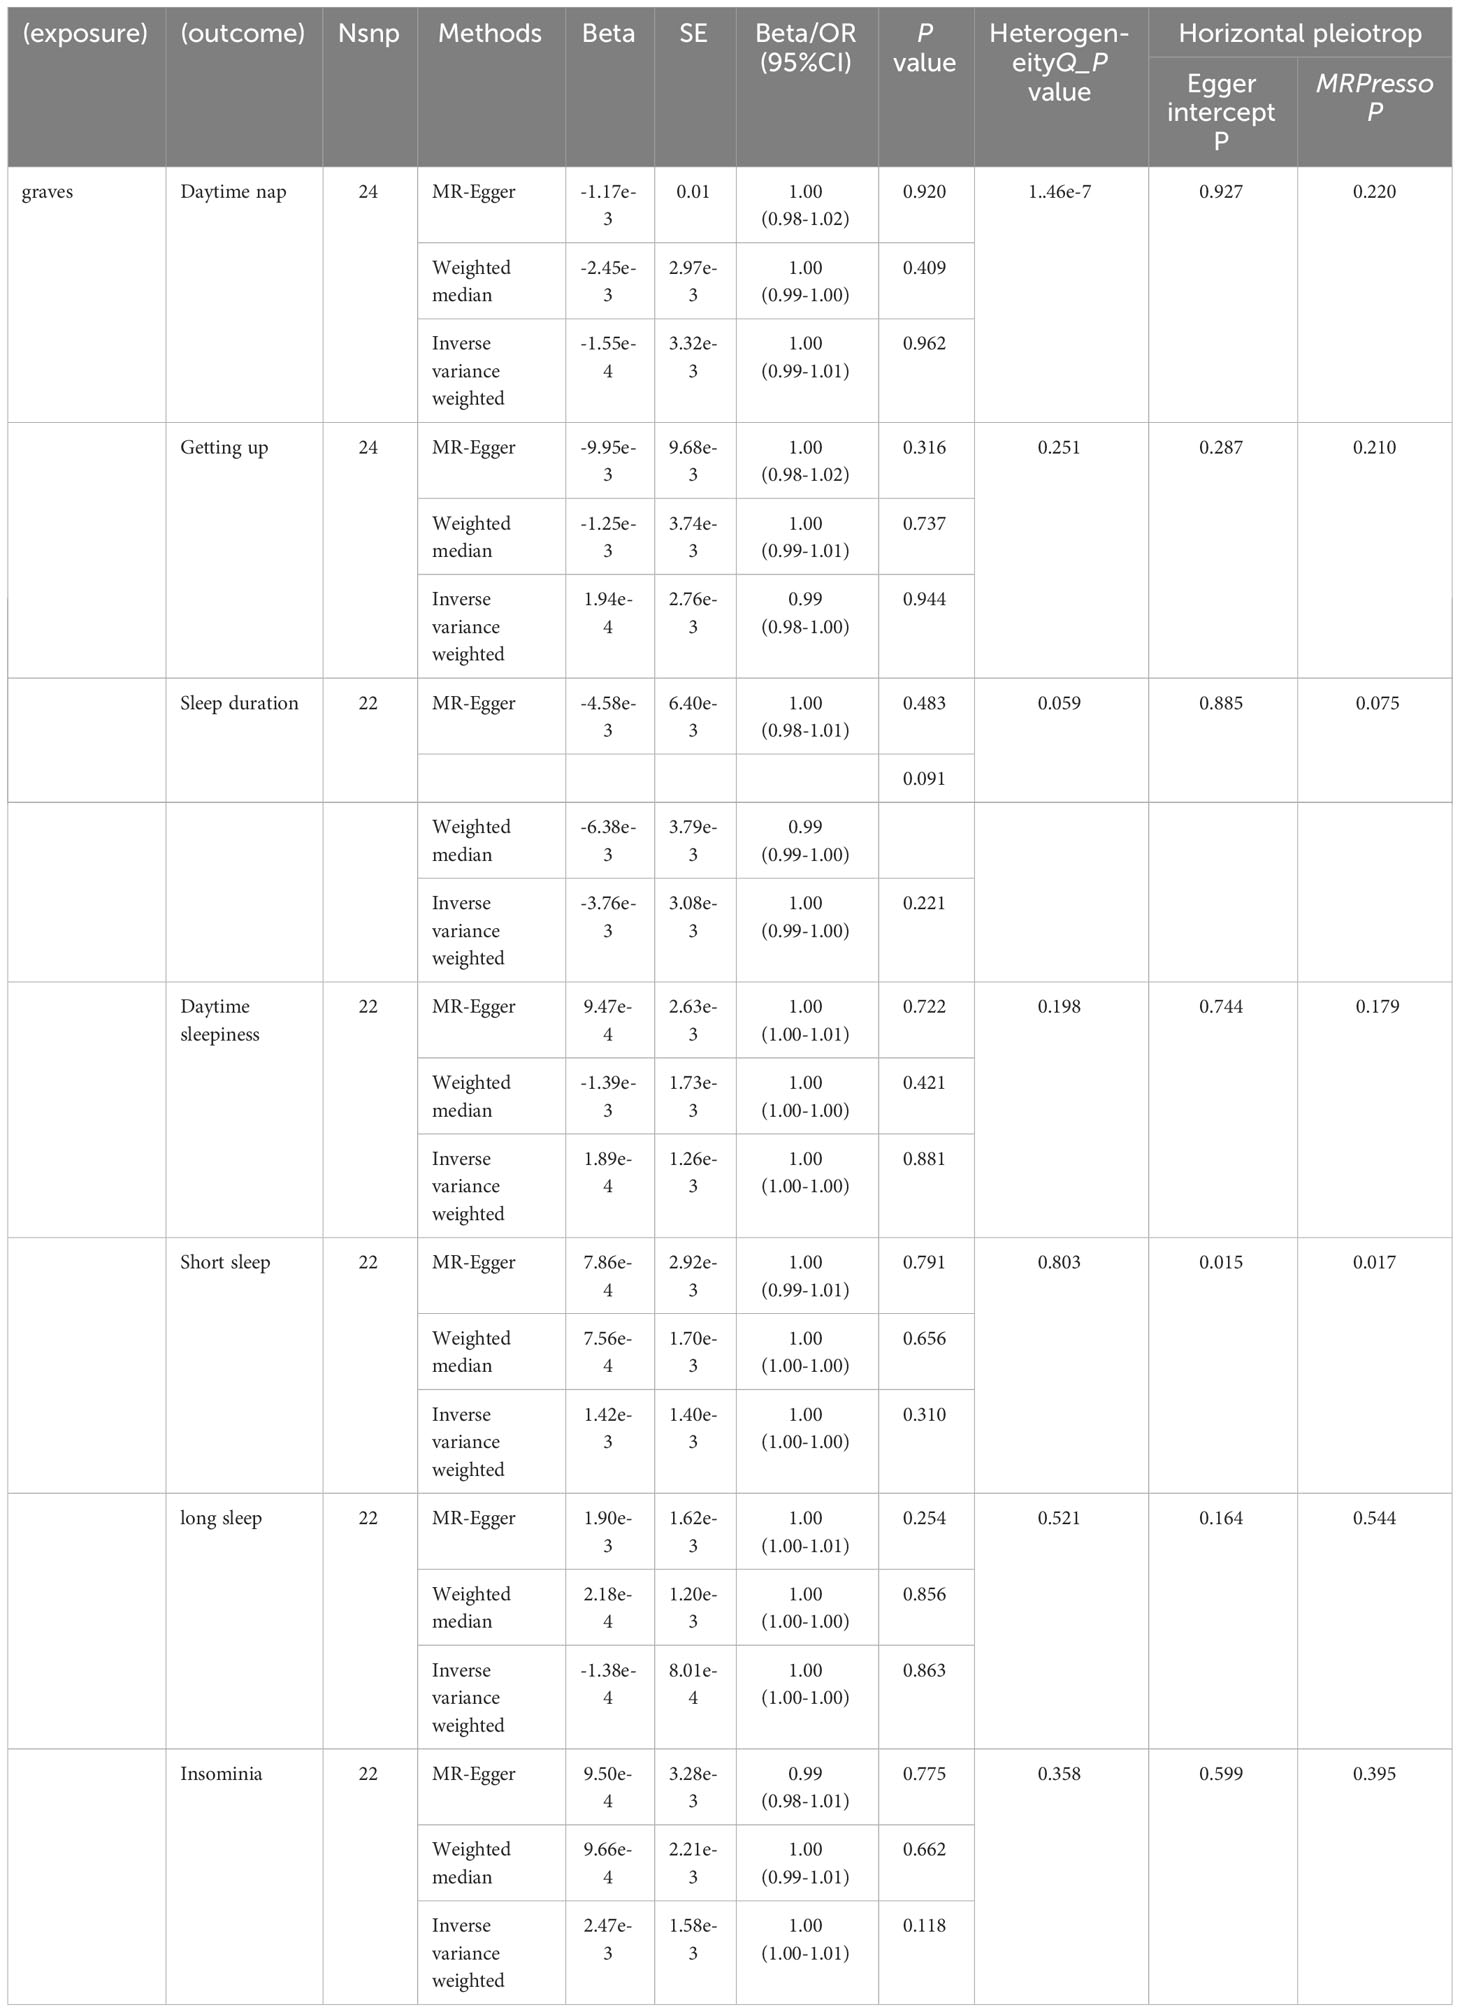
Table 5 Reverse MR of the correlation between sleep and graves.
3.2.3 Thyroid nodules and sleep traits
By employing reverse MR analysis, incorporating Thyroid nodules as the focal exposure factor, a total of 48 SNP markers were selected as IVs. Nevertheless, no statistically significant associations were observed between Thyroid nodules and various sleep-related outcomes, including Daytime nap (OR: 1.00, 95% CI: 0.99 to 1.00, P-value = 0.078, Supplementary Table 2, Table 6), Getting up (OR: 0.99, 95% CI: 0.98 to 1.00, P-value = 0.456, Supplementary Table 2, Table 6), Sleep duration (OR: 1.00, 95% CI: 0.99 to 1.00, P-value = 0.120, Supplementary Table 2, Table 6Table 6), Daytime sleepiness (OR: 1.00, 95% CI: 1.00 to 1.00, P-value = 0.695, Supplementary Table 2, Table 6), Short sleep (OR: 1.00, 95% CI: 1.00 to 1.00, P-value = 0.452, Supplementary Table 2, Table 6), Long sleep (OR: 1.00, 95% CI: 1.00 to 1.00, P-value = 0.644, Supplementary Table 2, Table 6), or Insomnia (OR: 1.00, 95% CI: 1.00 to 1.01, P-value = 0.375, Supplementary Table 2, Table 6). Figure 2 shows the forest plot of positive results related to MR analysis.
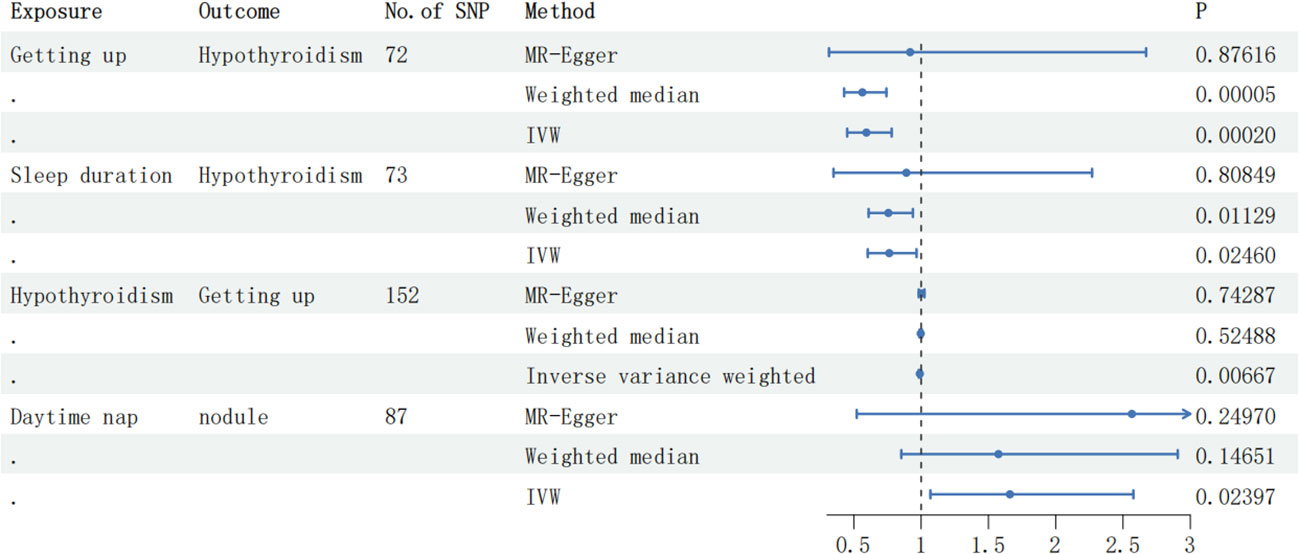
Figure 2 The forest plot displaying the correlation results in the MR analysis. SNP, single-nucleotide polymorphism; IVW, inverse variance weighted.
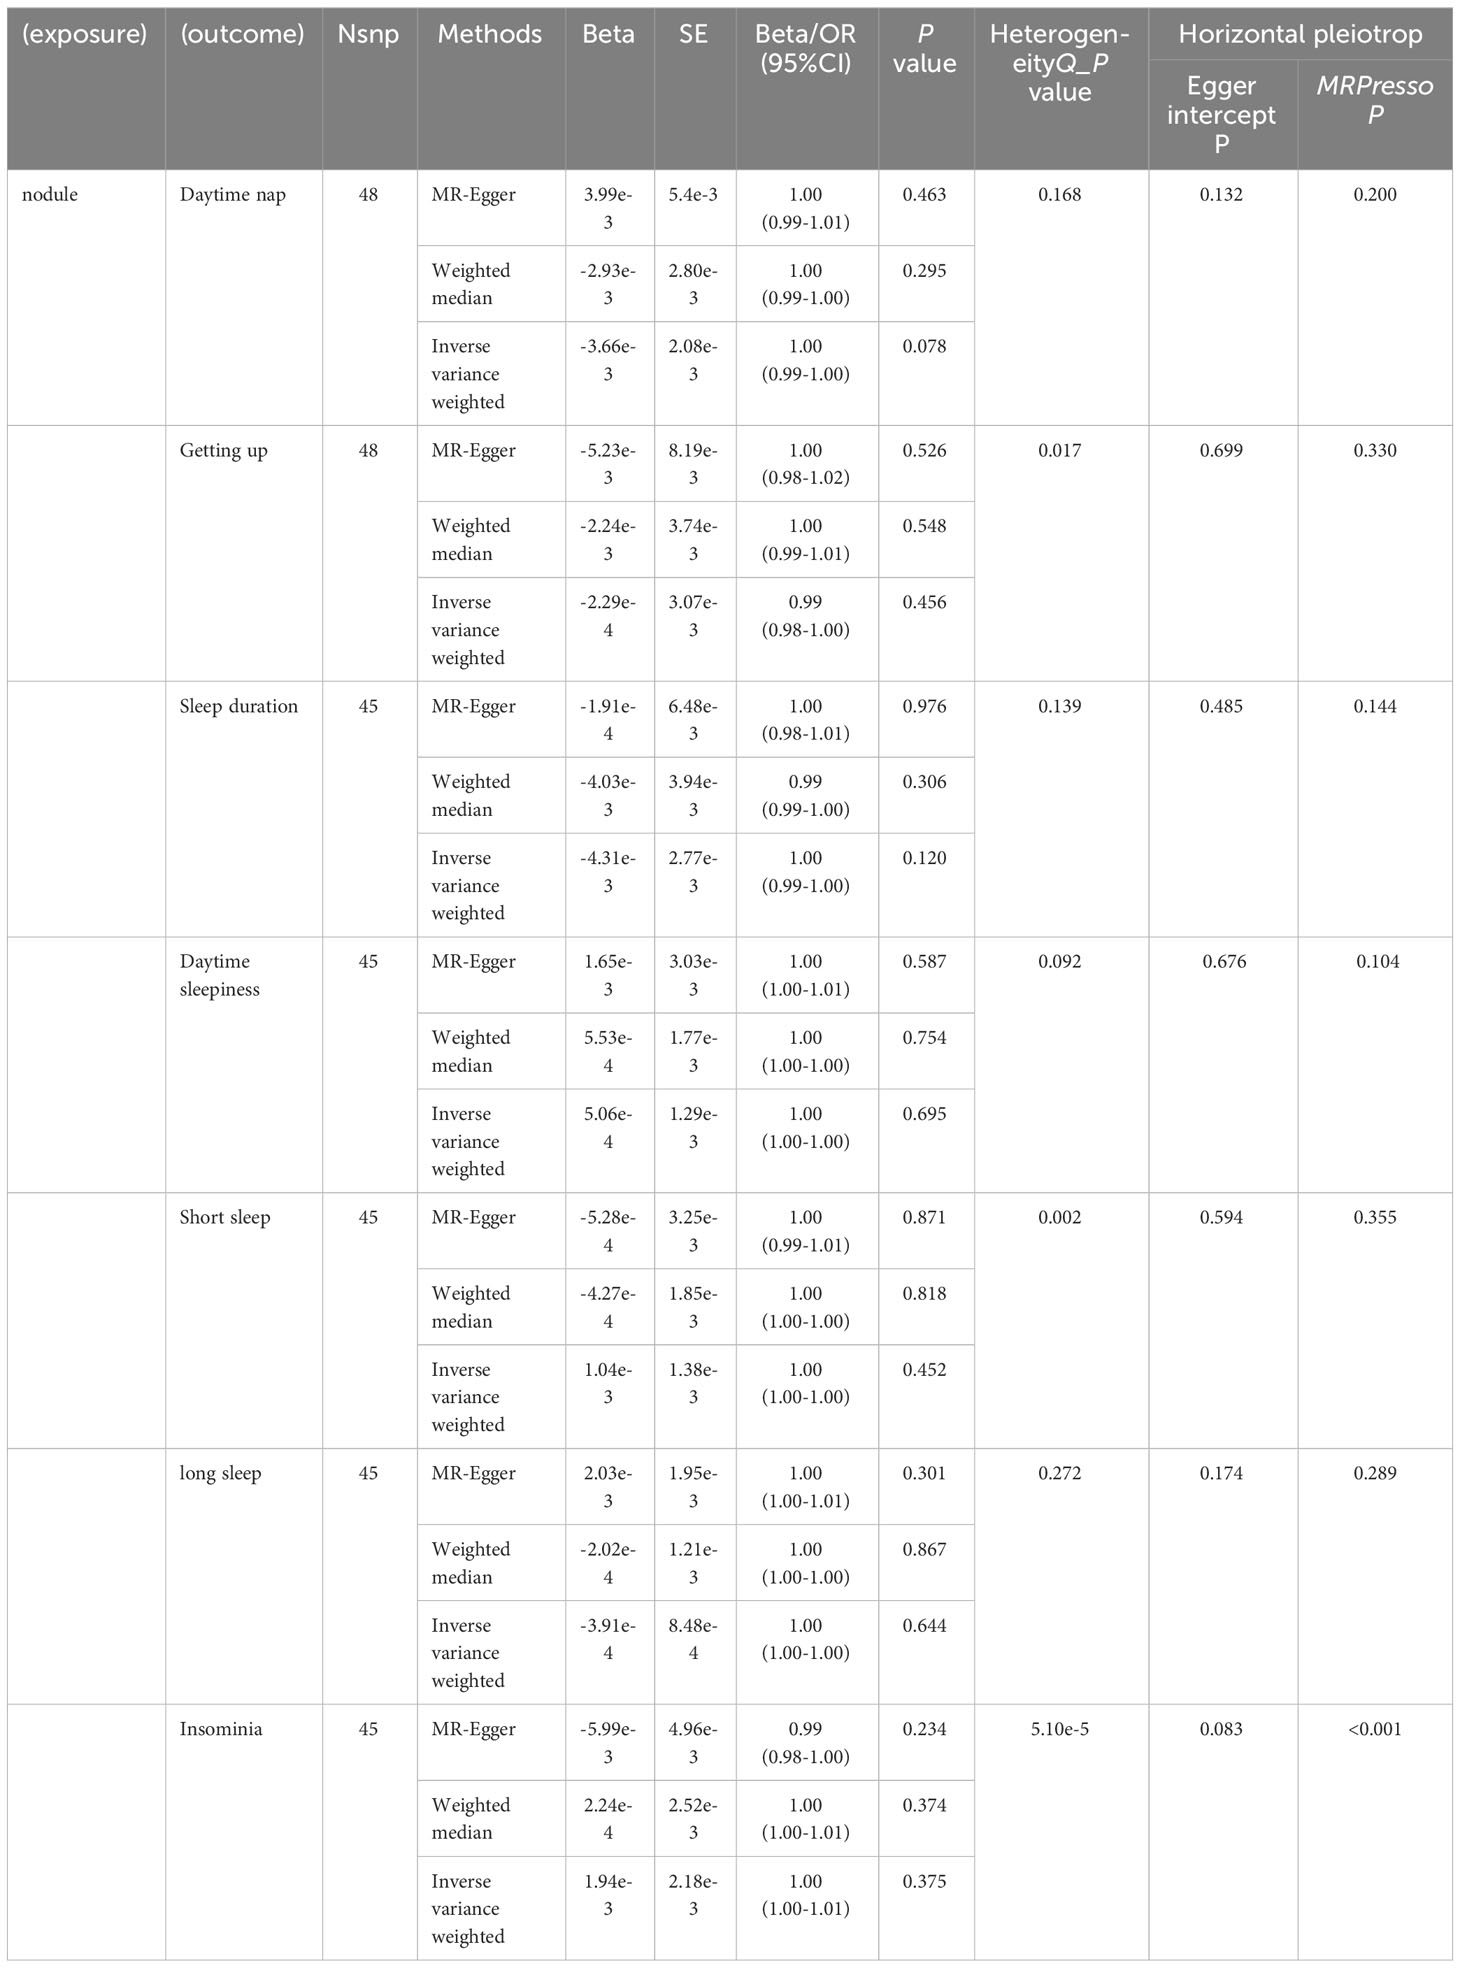
Table 6 Reverse MR of the correlation between sleep and nodule.
3.3 F-statistics and Visualization of MR
The calculation of F-statistics for each valid IV revealed that none of them fell below 10, affirming their appropriateness for analysis (Supplementary Table 1). Figure 3 incorporates a range of graphical representations, namely forest plots, funnel plots, leave-one-out plots, and scatter plots, effectively illustrating the MR Effect. The scatter plot depicted in Figure 3 which displays a negative correlation trend between Autoimmune hypothyroidism and Getting up. Furthermore, the symmetrical funnel plots indicate result stability, while the forest plots enable examination of the effects associated with each SNP. Lastly, the leave-one-out analysis validates the significance of the obtained results.
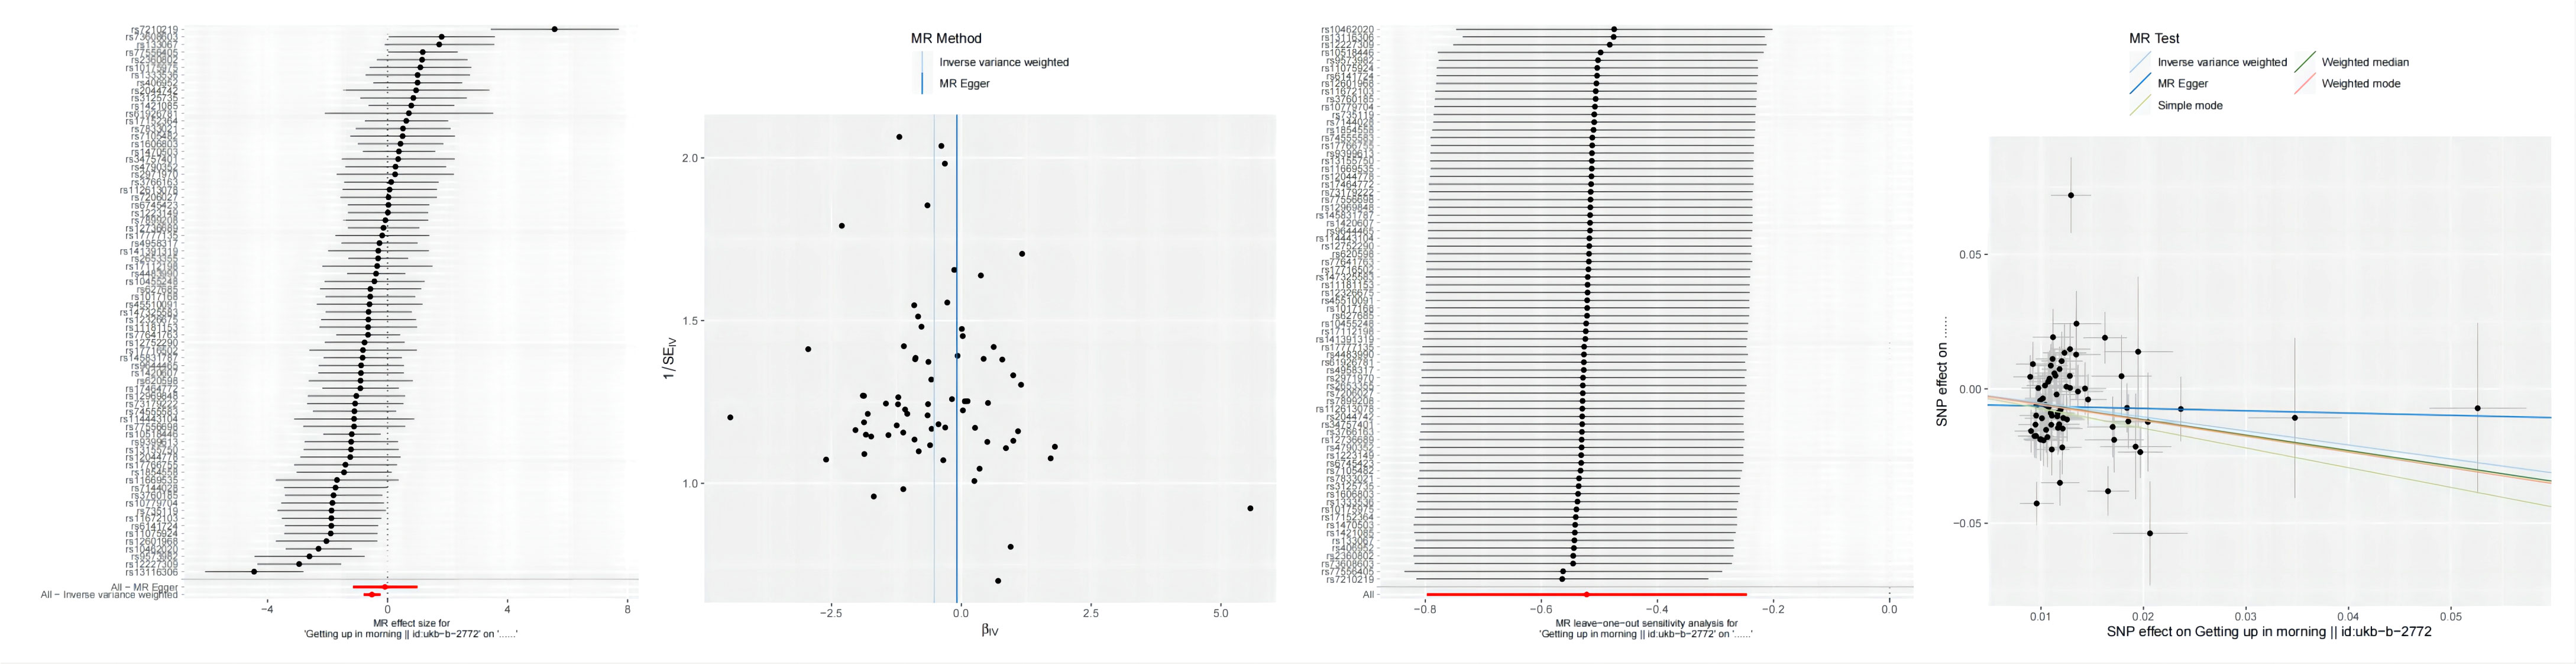
Figure 3 From left to right includes forest plots, funnel plots,leave-one-out plots and scatter plots, showcasing the MR Effect., the MR Effect of Getting up on Autoimmune hypothyroidism;.
4 Discussion
Within the scope of this dual-directional MR analysis research, we explored the connections between seven distinct sleep characteristics (Daytime nap, Getting up, Sleep duration, Daytime sleepiness, Short sleep, Long sleep, and Insomnia) and Graves’ disease, Autoimmune hypothyroidism and Thyroid nodules. The outcomes of our investigation demonstrated a significant inverse relationship between Getting up and hypothyroidism, indicating that Getting up may function as a protective factor against hypothyroidism. However, the potential correlation between sleep duration and hypothyroidism did not reach statistical significance following P-value adjustment. Furthermore, no interrelationships were identified between Graves disease, thyroid nodules, and sleep characteristics.
There exists a dual association between sleep and the hypothalamic-pituitary-thyroid (HPT) axis (Figure 4), wherein these interconnected homeostatic mechanisms mutually depend on each other to ensure efficient physiological performance. Notably, the characteristics and duration of sleep play a crucial role in modulating the circadian pattern of TSH and thyroid hormone secretion (45). The anatomical foundation for the diurnal variations in TRH synthesis and secretion is formed by the neural connections originating from the suprachiasmatic nucleus (SCN) and terminating at thyrotropin-releasing hormone (TRH) neurons in the paraventricular nucleus (46–48). Consequently, these neural projections play a pivotal role in regulating rhythmic TSH secretion from the pars distalis.There is additional evidence indicating that sleep exerts an influence on thyroid hormone secretion, resulting in a reduction of the circadian rhythm amplitude for TSH and subsequent levels of thyroid hormones (49). Another study indicated that post-sleep restriction recovery sleep exhibited a more substantial TSH suppression compared to regular sleep, thereby illustrating the unique impact of sleep on TSH secretion (50). The relationship between TH and the sleep-wake cycle remains unclear; however, there is evidence of the influence of circadian TH levels on sleep, where elevated TH levels are associated with shortened sleep duration. It is suggested that the elevation of T4 resulting from sleep deprivation serves as an adaptive physiological response to promote wakefulness (51).
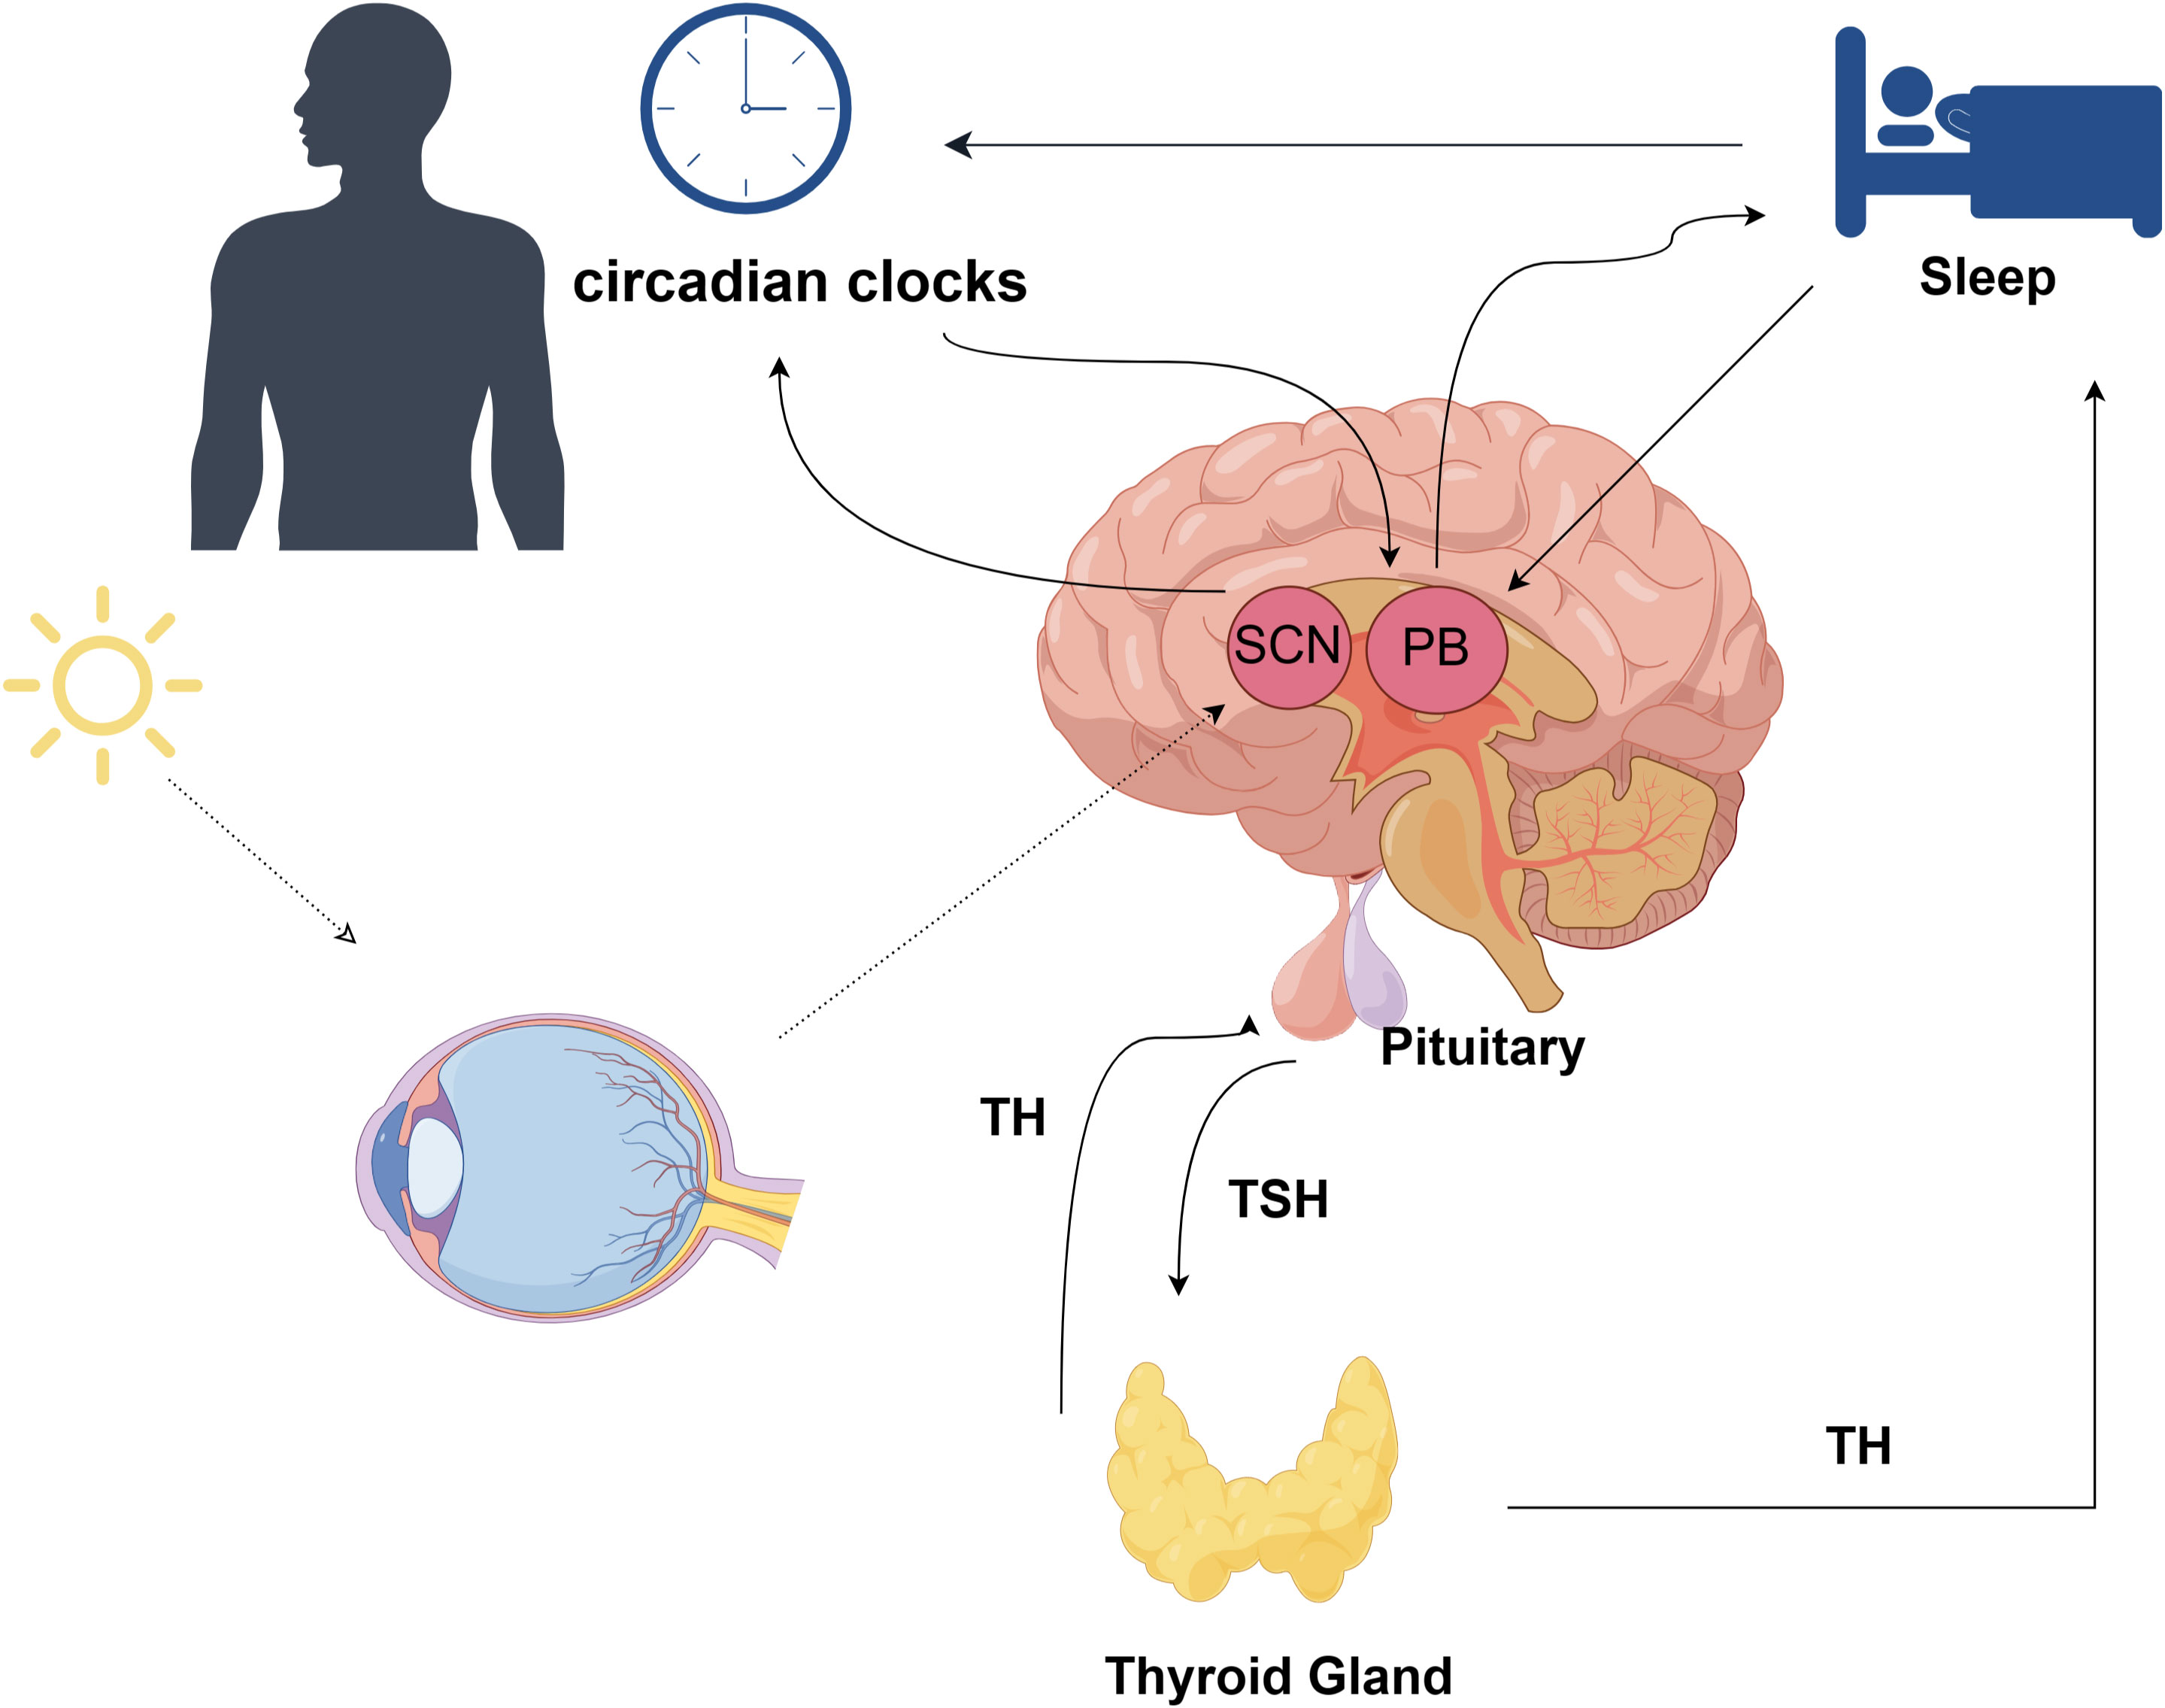
Figure 4 The association between sleep and the hypothalamic-pituitary-thyroid (HPT) axis; TH, thyroid hormone; TSH, thyroid stimulating hormone; SCN, Suprachiasmatic Nucleus; PB, Pineal Body;.
Previous observational studies have suggested a potential association between hypothyroidism and sleep, indicating a possible correlation. A population-based study conducted in China proposed that subclinical hypothyroidism serves as a risk factor for poor sleep quality (21). Furthermore, results from another retrospective study conducted at a single center revealed a higher occurrence of early chronotypes among women diagnosed with hypothyroidism within the study’s cohort (52). Limited evidence exists regarding the association between sleep and hypothyroidism, and our study presents, for the first time, a novel causal relationship between Getting up and Autoimmune hypothyroidism. We propose that Getting up may serve as a protective factor against Autoimmune hypothyroidism, providing new evidence from a genetic variation perspective. Sleep disturbance is a characteristic feature and frequently reported symptom among individuals diagnosed with hyperthyroidism, attributable to elevated thyroid hormone production or thyrotoxicosis resulting from the release of excessive TH levels during a destructive or inflammatory process affecting the thyroid gland (53, 54). Earlier investigations into individuals with clinical hyperthyroidism revealed an increase in sleep latency, accompanied by a reduction in total sleep time and SWS (54). Additionally, a separate study by Kronfol et al. confirmed a decrease in sleep efficiency, duration, and SWS (55). The results of a retrospective observational study yielded opposing results, suggesting that there were no discernible variations in subjective measures of sleep between individuals diagnosed with overt hyperthyroidism and euthyroid controls (56). Our study findings did not establish any discernible connection between Graves’ disease itself and sleep, leading us to conclude that there is no direct causal relationship between the two. Instead, it is plausible that the observed manifestations of increased sympathetic nervous system activity, such as heightened neural excitability resulting from thyrotoxicosis, may mediate their association. Analysis of data from a community-based population study indicated that individuals with shorter periods of sleep at night were more likely to exhibit thyroid nodules (57). These findings have prompted speculation about potential disruptions in the circadian gene expression patterns within the thyroid gland (58). Notably, alterations in circadian rhythm genes, particularly elevated expressions of CLOCK and BMAL1, along with decreased expression of CRY2, were predominantly observed in malignant nodules (59). The results of our study did not establish a causal link between thyroid nodules and sleep traits, highlighting the importance of conducting further exploratory investigations to gain deeper insights into this relationship.
Our study boasted several notable strengths that contribute to its validity. Firstly, it was the first of its kind to investigate the causal association between sleep traits and AITD as well as thyroid nodules using bidirectional two-sample Mendelian randomization. Notably, the use of distinct databases for the exposure and outcome datasets helped mitigate concerns regarding potential sample overlap. Moreover, we employed IVs consisting of SNPs with strong associations (P<5e-8) and high intensity (F-statistics > 10), ensuring greater comparability between the exposure and outcome groups. This approach lends greater credibility to our findings. Furthermore, we conducted an extensive sensitivity analysis to assess the robustness of our conclusions. However, it is important to acknowledge the limitations of our research. Firstly, As not all genetic variants and traits adhere to Mendel’s second law, wherein genes act independently and randomly, the utilization of genes as IVs in studies may be susceptible to bias arising from weak instruments, population stratification, and developmental compensation. Further validation using larger GWAS data is warranted. Furthermore, our study did not stratify the AITD patient population by gender, which may introduce heterogeneity due to variations in health status, age, or gender. Additionally, it is important to acknowledge that our study primarily included individuals of European descent, which limits the generalizability of our findings to a global population. Thirdly, the data on sleep characteristics were obtained through questionnaire surveys, making it difficult to avoid subjective biases and inevitable misclassification. Moreover, despite implementing measures to identify and eliminate outlier variants, we cannot exclude the possibility that horizontal pleiotropy influenced our results.
5 Conclusion
To summarize, the results of our study reveal a notable cause-and-effect relationship between Getting up and Autoimmune hypothyroidism, indicating its potential role as a protective factor against this condition. However, no causal connection was observed between sleep traits and Graves’ disease or Thyroid nodules. The genetic variation approach employed in our research offers fresh evidence that complements the conclusions drawn from previous observational studies. Further verification through larger-scale GWAS investigations is necessary.
Data availability statement
The original contributions presented in the study are included in the article/Supplementary Table Material. Further inquiries can be directed to the corresponding author.
Author contributions
SW: Conceptualization, Data curation, Formal analysis, Methodology, Project administration, Software, Visualization, Writing – original draft, Writing – review & editing. KW: Data curation, Formal analysis, Methodology, Project administration, Software, Supervision, Writing – review & editing. SL: Funding acquisition, Project administration, Resources, Supervision, Validation, Writing – review & editing. XC: Conceptualization, Methodology, Software, Supervision, Validation, Writing – review & editing.
Funding
The author(s) declare financial support was received for the research, authorship, and/or publication of this article. This work was supported by the Guangdong Provincial Science and Technology Special Funds (Project No. 20211231071-33) and the Clinical Research Enhancement Program (Project No. 2014110108).
Conflict of interest
The authors declare that the research was conducted in the absence of any commercial or financial relationships that could be construed as a potential conflict of interest.
Publisher’s note
All claims expressed in this article are solely those of the authors and do not necessarily represent those of their affiliated organizations, or those of the publisher, the editors and the reviewers. Any product that may be evaluated in this article, or claim that may be made by its manufacturer, is not guaranteed or endorsed by the publisher.
Supplementary material
The Supplementary Material for this article can be found online at: https://www.frontiersin.org/articles/10.3389/fendo.2023.1325538/full#supplementary-material
References
1. Steiger A. Sleep and endocrinology. J Intern Med (2003) 254(1):13–22. doi: 10.1046/j.1365-2796.2003.01175.x
2. Mackiewicz M, Naidoo N, Zimmerman JE, Pack AI. Molecular Mechanisms of Sleep and Wakefulness. In: Pfaff DW, Kieffer BL, editors. Molecular and Biophysical Mechanisms of Arousal, Alertness, and Attention. Annals of the New York Academy of Sciences. Malden: Wiley-Blackwell (2008). p. 335–49.
3. Depner CM, Stothard ER, Wright KP. Metabolic consequences of sleep and circadian disorders. Curr Diabetes Rep (2014) 14(7):9. doi: 10.1007/s11892-014-0507-z
4. Patke A, Young MW, Axelrod S. Molecular mechanisms and physiological importance of circadian rhythms. Nat Rev Mol Cell Biol (2020) 21(2):67–84. doi: 10.1038/s41580-019-0179-2
5. Matenchuk BA, Mandhane PJ, Kozyrskyj AL. Sleep, circadian rhythm, and gut microbiota. Sleep Med Rev (2020) 53:23. doi: 10.1016/j.smrv.2020.101340
6. Kwok CS, Kontopantelis E, Kuligowski G, Gray M, Muhyaldeen A, Gale CP, et al. Self-reported sleep duration and quality and cardiovascular disease and mortality: A dose-response meta-analysis. J Am Heart Assoc (2018) 7(15):26. doi: 10.1161/jaha.118.008552
7. Javaheri S, Redline S. Insomnia and risk of cardiovascular disease. Chest (2017) 152(2):435–44. doi: 10.1016/j.chest.2017.01.026
8. Baglioni C, Nanovska S, Regen W, Spiegelhalder K, Feige B, Nissen C, et al. Sleep and mental disorders: A meta-analysis of polysomnographic research. Psychol Bull (2016) 142(9):969–90. doi: 10.1037/bul0000053
9. Freeman D, Sheaves B, Waite F, Harvey AG, Harrison PJ. Sleep disturbance and psychiatric disorders. Lancet Psychiatry (2020) 7(7):628–37. doi: 10.1016/S2215-0366(20)30136-X
10. Wang CS, Bangdiwala SI, Rangarajan S, Lear SA, AlHabib KF, Mohan V, et al. Association of estimated sleep duration and naps with mortality and cardiovascular events: A study of 116 632 people from 21 countries. Eur Heart J (2019) 40(20):1620–9. doi: 10.1093/eurheartj/ehy695
11. Potter GDM, Skene DJ, Arendt J, Cade JE, Grant PJ, Hardie LJ. Circadian rhythm and sleep disruption: causes, metabolic consequences, and countermeasures. Endocrine Rev (2016) 37(6):584–608. doi: 10.1210/er.2016-1083
12. Gamble KL, Berry R, Frank SJ, Young ME. Circadian clock control of endocrine factors. Nat Rev Endocrinol (2014) 10(8):466–75. doi: 10.1038/nrendo.2014.78
13. Medic G, Wille M, Hemels MEH. Short- and long-term health consequences of sleep disruption. Nat Sci Sleep (2017) 9:151–61. doi: 10.2147/nss.S134864
14. Vargas-Uricoechea H. Molecular mechanisms in autoimmune thyroid disease. Cells (2023) 12(6):37. doi: 10.3390/cells12060918
15. Smith TJ, Hegedüs L. Graves' Disease. N Engl J Med (2016) 375(16):1552–65. doi: 10.1056/NEJMra1510030
16. Brix TH, Hegedüs L. Twin studies as a model for exploring the aetiology of autoimmune thyroid disease. Clin Endocrinol (2012) 76(4):457–64. doi: 10.1111/j.1365-2265.2011.04318.x
17. Hansen PS, Brix TH, Iachine I, Kyvik KO, Hegedüs L. The relative importance of genetic and environmental effects for the early stages of thyroid autoimmunity: A study of healthy danish twins. Eur J Endocrinol (2006) 154(1):29–38. doi: 10.1530/eje.1.02060
18. Eschler DC, Hasham A, Tomer Y. Cutting edge: the etiology of autoimmune thyroid diseases. Clin Rev Allergy Immunol (2011) 41(2):190–7. doi: 10.1007/s12016-010-8245-8
19. Guarneri F, Benvenga S. Environmental factors and genetic background that interact to cause autoimmune thyroid disease. Curr Opin endocrinol diabetes Obes (2007) 14(5):398–409. doi: 10.1097/MED.0b013e3282ef1c48
20. Kim W, Lee J, Ha J, Jo K, Lim DJ, Lee JM, et al. Association between sleep duration and subclinical thyroid dysfunction based on nationally representative data. J Clin Med (2019) 8(11):2010. doi: 10.3390/jcm8112010
21. Song L, Lei J, Jiang K, Lei Y, Tang Y, Zhu J, et al. The association between subclinical hypothyroidism and sleep quality: A population-based study. Risk Manage healthcare Policy (2019) 12:369–74. doi: 10.2147/rmhp.S234552
22. Lawlor DA, Harbord RM, Sterne JA, Timpson N, Davey Smith G. Mendelian randomization: using genes as instruments for making causal inferences in epidemiology. Stat Med (2008) 27(8):1133–63. doi: 10.1002/sim.3034
23. Sun BB, Maranville JC, Peters JE, Stacey D, Staley JR, Blackshaw J, et al. Genomic atlas of the human plasma proteome. Nature (2018) 558(7708):73. doi: 10.1038/s41586-018-0175-2
24. Dashti HS, Daghlas I, Lane JM, Huang Y, Udler MS, Wang H, et al. Genetic determinants of daytime napping and effects on cardiometabolic health. Nat Commun (2021) 12(1):900. doi: 10.1038/s41467-020-20585-3
25. Jones SE, Lane JM, Wood AR, van Hees VT, Tyrrell J, Beaumont RN, et al. Genome-wide association analyses of chronotype in 697,828 individuals provides insights into circadian rhythms. Nat Commun (2019) 10(1):343. doi: 10.1038/s41467-018-08259-7
26. Hu Y, Shmygelska A, Tran D, Eriksson N, Tung JY, Hinds DA. Gwas of 89,283 individuals identifies genetic variants associated with self-reporting of being a morning person. Nat Commun (2016) 7:10448. doi: 10.1038/ncomms10448
27. Jones SE, Tyrrell J, Wood AR, Beaumont RN, Ruth KS, Tuke MA, et al. Genome-wide association analyses in 128,266 individuals identifies new morningness and sleep duration loci. PloS Genet (2016) 12(8):e1006125. doi: 10.1371/journal.pgen.1006125
28. Jones SE, van Hees VT, Mazzotti DR, Marques-Vidal P, Sabia S, van der Spek A, et al. Genetic studies of accelerometer-based sleep measures yield new insights into human sleep behaviour. Nat Commun (2019) 10(1):1585. doi: 10.1038/s41467-019-09576-1
29. Sudlow C, Gallacher J, Allen N, Beral V, Burton P, Danesh J, et al. Uk biobank: an open access resource for identifying the causes of a wide range of complex diseases of middle and old age. PloS Med (2015) 12(3):e1001779. doi: 10.1371/journal.pmed.1001779
30. Wang H, Lane JM, Jones SE, Dashti HS, Ollila HM, Wood AR, et al. Genome-wide association analysis of self-reported daytime sleepiness identifies 42 loci that suggest biological subtypes. Nat Commun (2019) 10(1):3503. doi: 10.1038/s41467-019-11456-7
31. Lane JM, Jones SE, Dashti HS, Wood AR, Aragam KG, van Hees VT, et al. Biological and clinical insights from genetics of insomnia symptoms. Nat Genet (2019) 51(3):387–93. doi: 10.1038/s41588-019-0361-7
32. Kurki MI, Karjalainen J, Palta P, Sipilä TP, Kristiansson K, Donner KM, et al. Finngen provides genetic insights from a well-phenotyped isolated population. Nature (2023) 613(7944):508–18. doi: 10.1038/s41586-022-05473-8
33. Hemani G, Zhengn J, Elsworth B, Wade KH, Haberland V, Baird D, et al. The mr-base platform supports systematic causal inference across the human phenome. eLife (2018) 7:29. doi: 10.7554/eLife.34408
34. Qazi T, Farraye FA. Sleep and inflammatory bowel disease: an important bi-directional relationship. Inflammatory bowel Dis (2019) 25(5):843–52. doi: 10.1093/ibd/izy334
35. Ballesio A, Zagaria A, Baccini F, Micheli F, Di Nardo G, Lombardo C. A meta-analysis on sleep quality in inflammatory bowel disease. Sleep Med Rev (2021) 60:101518. doi: 10.1016/j.smrv.2021.101518
36. Yuan S, Sun Y, Tan X, Geng J, Sun J, Chen X, et al. Sleep duration and daytime napping in relation to incident inflammatory bowel disease: A prospective cohort study. Alimentary Pharmacol Ther (2023) 57(5):475–85. doi: 10.1111/apt.17285
37. Chellappa SL, Aeschbach D. Sleep and anxiety: from mechanisms to interventions. Sleep Med Rev (2022) 61:101583. doi: 10.1016/j.smrv.2021.101583
38. Paternoster L, Standl M, Waage J, Baurecht H, Hotze M, Strachan DP, et al. Multi-ancestry genome-wide association study of 21,000 cases and 95,000 controls identifies new risk loci for atopic dermatitis. Nat Genet (2015) 47(12):1449–56. doi: 10.1038/ng.3424
39. Pierce BL, Burgess S. Efficient design for mendelian randomization studies: subsample and 2-sample instrumental variable estimators. Am J Epidemiol (2013) 178(7):1177–84. doi: 10.1093/aje/kwt084
40. Davey Smith G, Hemani G. Mendelian randomization: genetic anchors for causal inference in epidemiological studies. Hum Mol Genet (2014) 23:R89–98. doi: 10.1093/hmg/ddu328
41. Bowden J, Smith GD, Burgess S. Mendelian randomization with invalid instruments: effect estimation and bias detection through egger regression. Int J Epidemiol (2015) 44(2):512–25. doi: 10.1093/ije/dyv080
42. Burgess S, Bowden J, Fall T, Ingelsson E, Thompson SG. Sensitivity analyses for robust causal inference from mendelian randomization analyses with multiple genetic variants. Epidemiology (2017) 28(1):30–42. doi: 10.1097/ede.0000000000000559
43. Bowden J, Del Greco MF, Minelli C, Smith GD, Sheehan N, Thompson J. A framework for the investigation of pleiotropy in two-sample summary data mendelian randomization. Stat Med (2017) 36(11):1783–802. doi: 10.1002/sim.7221
44. Verbanck M, Chen CY, Neale B, Do R. Detection of widespread horizontal pleiotropy in causal relationships inferred from mendelian randomization between complex traits and diseases. Nat Genet (2018) 50(5):693. doi: 10.1038/s41588-018-0099-7
45. Shekhar S, Hall JE, Klubo-Gwiezdzinska J. The hypothalamic pituitary thyroid axis and sleep. Curr Opin endocrine Metab Res (2021) 17:8–14. doi: 10.1016/j.coemr.2020.10.002
46. Ueda HR, Chen W, Adachi A, Wakamatsu H, Hayashi S, Takasugi T, et al. A transcription factor response element for gene expression during circadian night. Nature (2002) 418(6897):534–9. doi: 10.1038/nature00906
47. Covarrubias L, Redondo JL, Vargas MA, Uribe RM, Méndez M, Joseph-Bravo P, et al. In vitro trh release from hypothalamus slices varies during the diurnal cycle. Neurochemical Res (1994) 19(7):845–50. doi: 10.1007/bf00967454
48. Kalsbeek A, Fliers E, Franke AN, Wortel J, Buijs RM. Functional connections between the suprachiasmatic nucleus and the thyroid gland as revealed by lesioning and viral tracing techniques in the rat. Endocrinology (2000) 141(10):3832–41. doi: 10.1210/endo.141.10.7709
49. Romijn JA, Adriaanse R, Brabant G, Prank K, Endert E, Wiersinga WM. Pulsatile secretion of thyrotropin during fasting: A decrease of thyrotropin pulse amplitude. J Clin Endocrinol Metab (1990) 70(6):1631–6. doi: 10.1210/jcem-70-6-1631
50. Brabant G, Prank K, Ranft U, Schuermeyer T, Wagner TO, Hauser H, et al. Physiological regulation of circadian and pulsatile thyrotropin secretion in normal man and woman. J Clin Endocrinol Metab (1990) 70(2):403–9. doi: 10.1210/jcem-70-2-403
51. Pereira JC Jr., Andersen ML. The role of thyroid hormone in sleep deprivation. Med Hypotheses (2014) 82(3):350–5. doi: 10.1016/j.mehy.2014.01.003
52. Arosemena MA, Ramos AR, Marcus EN, Slota KA, Cheung J, Castillo PR. Primary hypothyroidism and chronotypes in adult women. BMC Res Notes (2022) 15(1):52. doi: 10.1186/s13104-022-05934-3
53. Kraemer S, Danker-Hopfe H, Pilhatsch M, Bes F, Bauer M. Effects of supraphysiological doses of levothyroxine on sleep in healthy subjects: A prospective polysomnography study. J Thyroid Res (2011) 2011:420580. doi: 10.4061/2011/420580
54. Passouant P, Passouant-Fontaine T, Cadilhac J. [the influence of hyperthyroidism on sleep. Clin Exp Study]. Rev neurologique (1966) 115(3):353–66.
55. Kronfol Z, Greden JF, Condon M, Feinberg M, Carroll BJ. Application of biological markers in depression secondary to thyrotoxicosis. Am J Psychiatry (1982) 139(10):1319–22. doi: 10.1176/ajp.139.10.1319
56. Grabe HJ, Völzke H, Lüdemann J, Wolff B, Schwahn C, John U, et al. Mental and physical complaints in thyroid disorders in the general population. Acta psychiatrica Scandinavica (2005) 112(4):286–93. doi: 10.1111/j.1600-0447.2005.00586.x
57. Yan Y, Wang X, Wu H, Chen C, Li X, Yang R, et al. Short night-time sleep duration is associated with thyroid nodules: A community-based survey from guangzhou, China. Postgraduate Med (2023) 135(3):290–5. doi: 10.1080/00325481.2022.2139485
58. Mannic T, Meyer P, Triponez F, Pusztaszeri M, Le Martelot G, Mariani O, et al. Circadian clock characteristics are altered in human thyroid Malignant nodules. J Clin Endocrinol Metab (2013) 98(11):4446–56. doi: 10.1210/jc.2013-2568
Keywords: thyroid nodules, Graves’ disease, hypothyroidism, Mendelian randomization, GWAS
Citation: Wang S, Wang K, Chen X and Lin S (2024) The relationship between autoimmune thyroid disease, thyroid nodules and sleep traits: a Mendelian randomization study. Front. Endocrinol. 14:1325538. doi: 10.3389/fendo.2023.1325538
Received: 21 October 2023; Accepted: 19 December 2023;
Published: 18 March 2024.
Edited by:
Silvia Martina Ferrari, University of Pisa, ItalyReviewed by:
Gang Wei, Shanghai Jiao Tong University, ChinaDrozdstoy Stoyanov Stoyanov, Plovdiv Medical University, Bulgaria
Copyright © 2024 Wang, Wang, Chen and Lin. This is an open-access article distributed under the terms of the Creative Commons Attribution License (CC BY). The use, distribution or reproduction in other forums is permitted, provided the original author(s) and the copyright owner(s) are credited and that the original publication in this journal is cited, in accordance with accepted academic practice. No use, distribution or reproduction is permitted which does not comply with these terms.
*Correspondence: Shaoda Lin, Shaoda.2023@outlook.com
†These authors have contributed equally to this work