 Jianling Song
 Ping Wang2
 Hong Li
- 1Department of Nephrology, The Second Affiliated Hospital, Jiangxi Medical College, Nanchang University, Nanchang, Jiangxi, China
- 2Department of Gynecology and Obstetrics, Yongfeng People’s Hospital, Jian, Jiangxi, China
- 3Department of Medical Records, The Second Affiliated Hospital, Jiangxi Medical College, Nanchang University, Nanchang, Jiangxi, China
Objective: The current controversy surrounding the association between fasting blood glucose (FBG) and albuminuria necessitates further investigation. Hence, the primary objective of this study was to examine the relationship between FBG and urinary albumin-to-creatinine ratio (UACR).
Methods: A cohort of complete data from National Health and Nutrition Examination Survey (NHANES) participants (1999-2020) was analyzed. Linear regression analyses and a generalized additive model explored the association between FBG and UACR. Furthermore, the stability of this relationship across different populations was assessed.
Results: The study involved a total of 20,264 participants who were identified as U.S. citizens. By employing linear regression analysis, a statistically significant relationship was observed between elevated FBG levels and an increase in UACR (P<0.0001). Additionally, using a generalized additive model analysis, a U-shaped correlation between FBG and UACR was identified. Further examination using threshold effect analysis indicated a turning point for FBG at 5.44 mmol/L. A noteworthy finding in multiple populations is the consistent U-shaped association between FBG and UACR, except for individuals with serum uric acid levels ≥420 μmol/L and those who refrain from alcohol consumption.
Conclusion: The general U.S. population has a U-shaped nonlinear relationship between FBG and UACR.
1 Introduction
Microalbuminuria indicates the initial stages of glomerular disease and poses a risk for the progression of macroalbuminuria (1, 2). Numerous studies have demonstrated a correlation between substantial albuminuria, an elevated likelihood of developing end-stage renal disease, and an increased mortality rate due to coronary heart disease (3–6). It has been well-established that maintaining blood pressure within optimal ranges effectively reduces albuminuria (7, 8). Furthermore, empirical evidence supports the efficacy of glucose-lowering medications, such as empagliflozin and sitagliptin, in ameliorating albuminuria (8–10).
The relationship between fasting blood glucose (FBG) and albuminuria has generated conflicting findings in the literature. Previous studies have suggested that poor glycemic control is a risk factor for microalbuminuria, which contributes to macroalbuminuria development (11, 12). For instance, Yimthiang et al. observed a 5-fold increase in the odds of developing albuminuria when blood glucose levels exceeded 180 mg/dL (13). However, a separate study conducted among South Asian patients with type 2 diabetes did not find a significant association between a decrease in FBG and a decrease in albuminuria (14). The study by Lei B. et al. (15) did not provide conclusive evidence regarding the potential benefit of reducing blood glucose levels on the development of albuminuria. Furthermore, there is ongoing debate regarding the effectiveness of intensive glycemic therapy in improving albuminuria. However, a separate study indicated that intensive blood glucose therapy was associated with a decreased risk of both microalbuminuria and macroalbuminuria (16). However, it should be emphasized that intensive glycemic control did not yield a statistically significant decrease in the advancement of clinical albuminuria. Furthermore, the longitudinal treatment effect of both conventional and intensive glycemic therapy did not demonstrate statistical significance compared to the rate of clinical albuminuria progression (17). It is worth noting that the significant challenge posed by intensive glycemic therapy includes the risk of hypoglycemia (18), weight gain, and an increased prevalence of metabolic syndrome (19). Hence, given the inconclusive correlation between blood glucose and albuminuria and the uncertainty surrounding the efficacy of intensive glucose treatment in ameliorating albuminuria, it becomes imperative to ascertain a precise glucose threshold. This study sought to examine the association between FBG levels and albuminuria to establish a definitive blood glucose threshold, thereby furnishing valuable insights to bolster clinical glucose control therapy.
2 Methods
2.1 Study population
NHANES, which stands for National Health and Nutrition Examination Survey, is a nationally representative survey conducted by the Centers for Disease Control and Prevention (CDC) in the U.S. The survey utilizes a complex sampling design to ensure that the participants are representative of the entire U.S. population in terms of age, gender, race, ethnicity, income, and education levels.
The Institutional Review Board (IRB) of the National Center for Health Statistics (NCHS) has approved the study methods of NHANES for health statistics. The study methods include collecting data about the participants’ health and nutritional status through interviews, physical examinations, and laboratory tests. This data is used to monitor the prevalence of various diseases and health conditions in the U.S. population, as well as to identify risk factors and trends over time.
To participate in NHANES, volunteers are selected randomly and invited to participate. They are provided with detailed information about the survey and are asked to provide written informed consent before participating (20). The privacy and confidentiality of the participants are strictly protected throughout the survey process. Volunteers who participate in NHANES are contributing to a better understanding of the health and nutritional status of the U.S. population, which can inform public health policies and interventions.
This study focused on a group of U.S. citizens who participated in the NHANES between 1999 and 2020. The survey included 116,876 participants. To ensure the accuracy of our findings, incomplete data were excluded from our analysis. Specifically, participants who had incomplete data on the independent variable FBG (56,406 individuals), the dependent variable urinary albumin-to-creatinine ratio (UACR) (24,930 individuals), and the covariates [including hemoglobin A1c (HbA1C), poverty income ratio (PIR), serum uric acid (SUA), triglyceride (TG), low-density lipoprotein (LDL), body mass index (BMI), education level, history of tobacco and alcohol use, history of prior illness(including hypertension, diabetes and CVD), and history of taking prescription medications] were excluded from our study, amounting to a total of 15,276 individuals. A total of 20,264 individuals were ultimately incorporated into the study. Please refer to Figure 1 for a detailed breakdown of the exclusions.
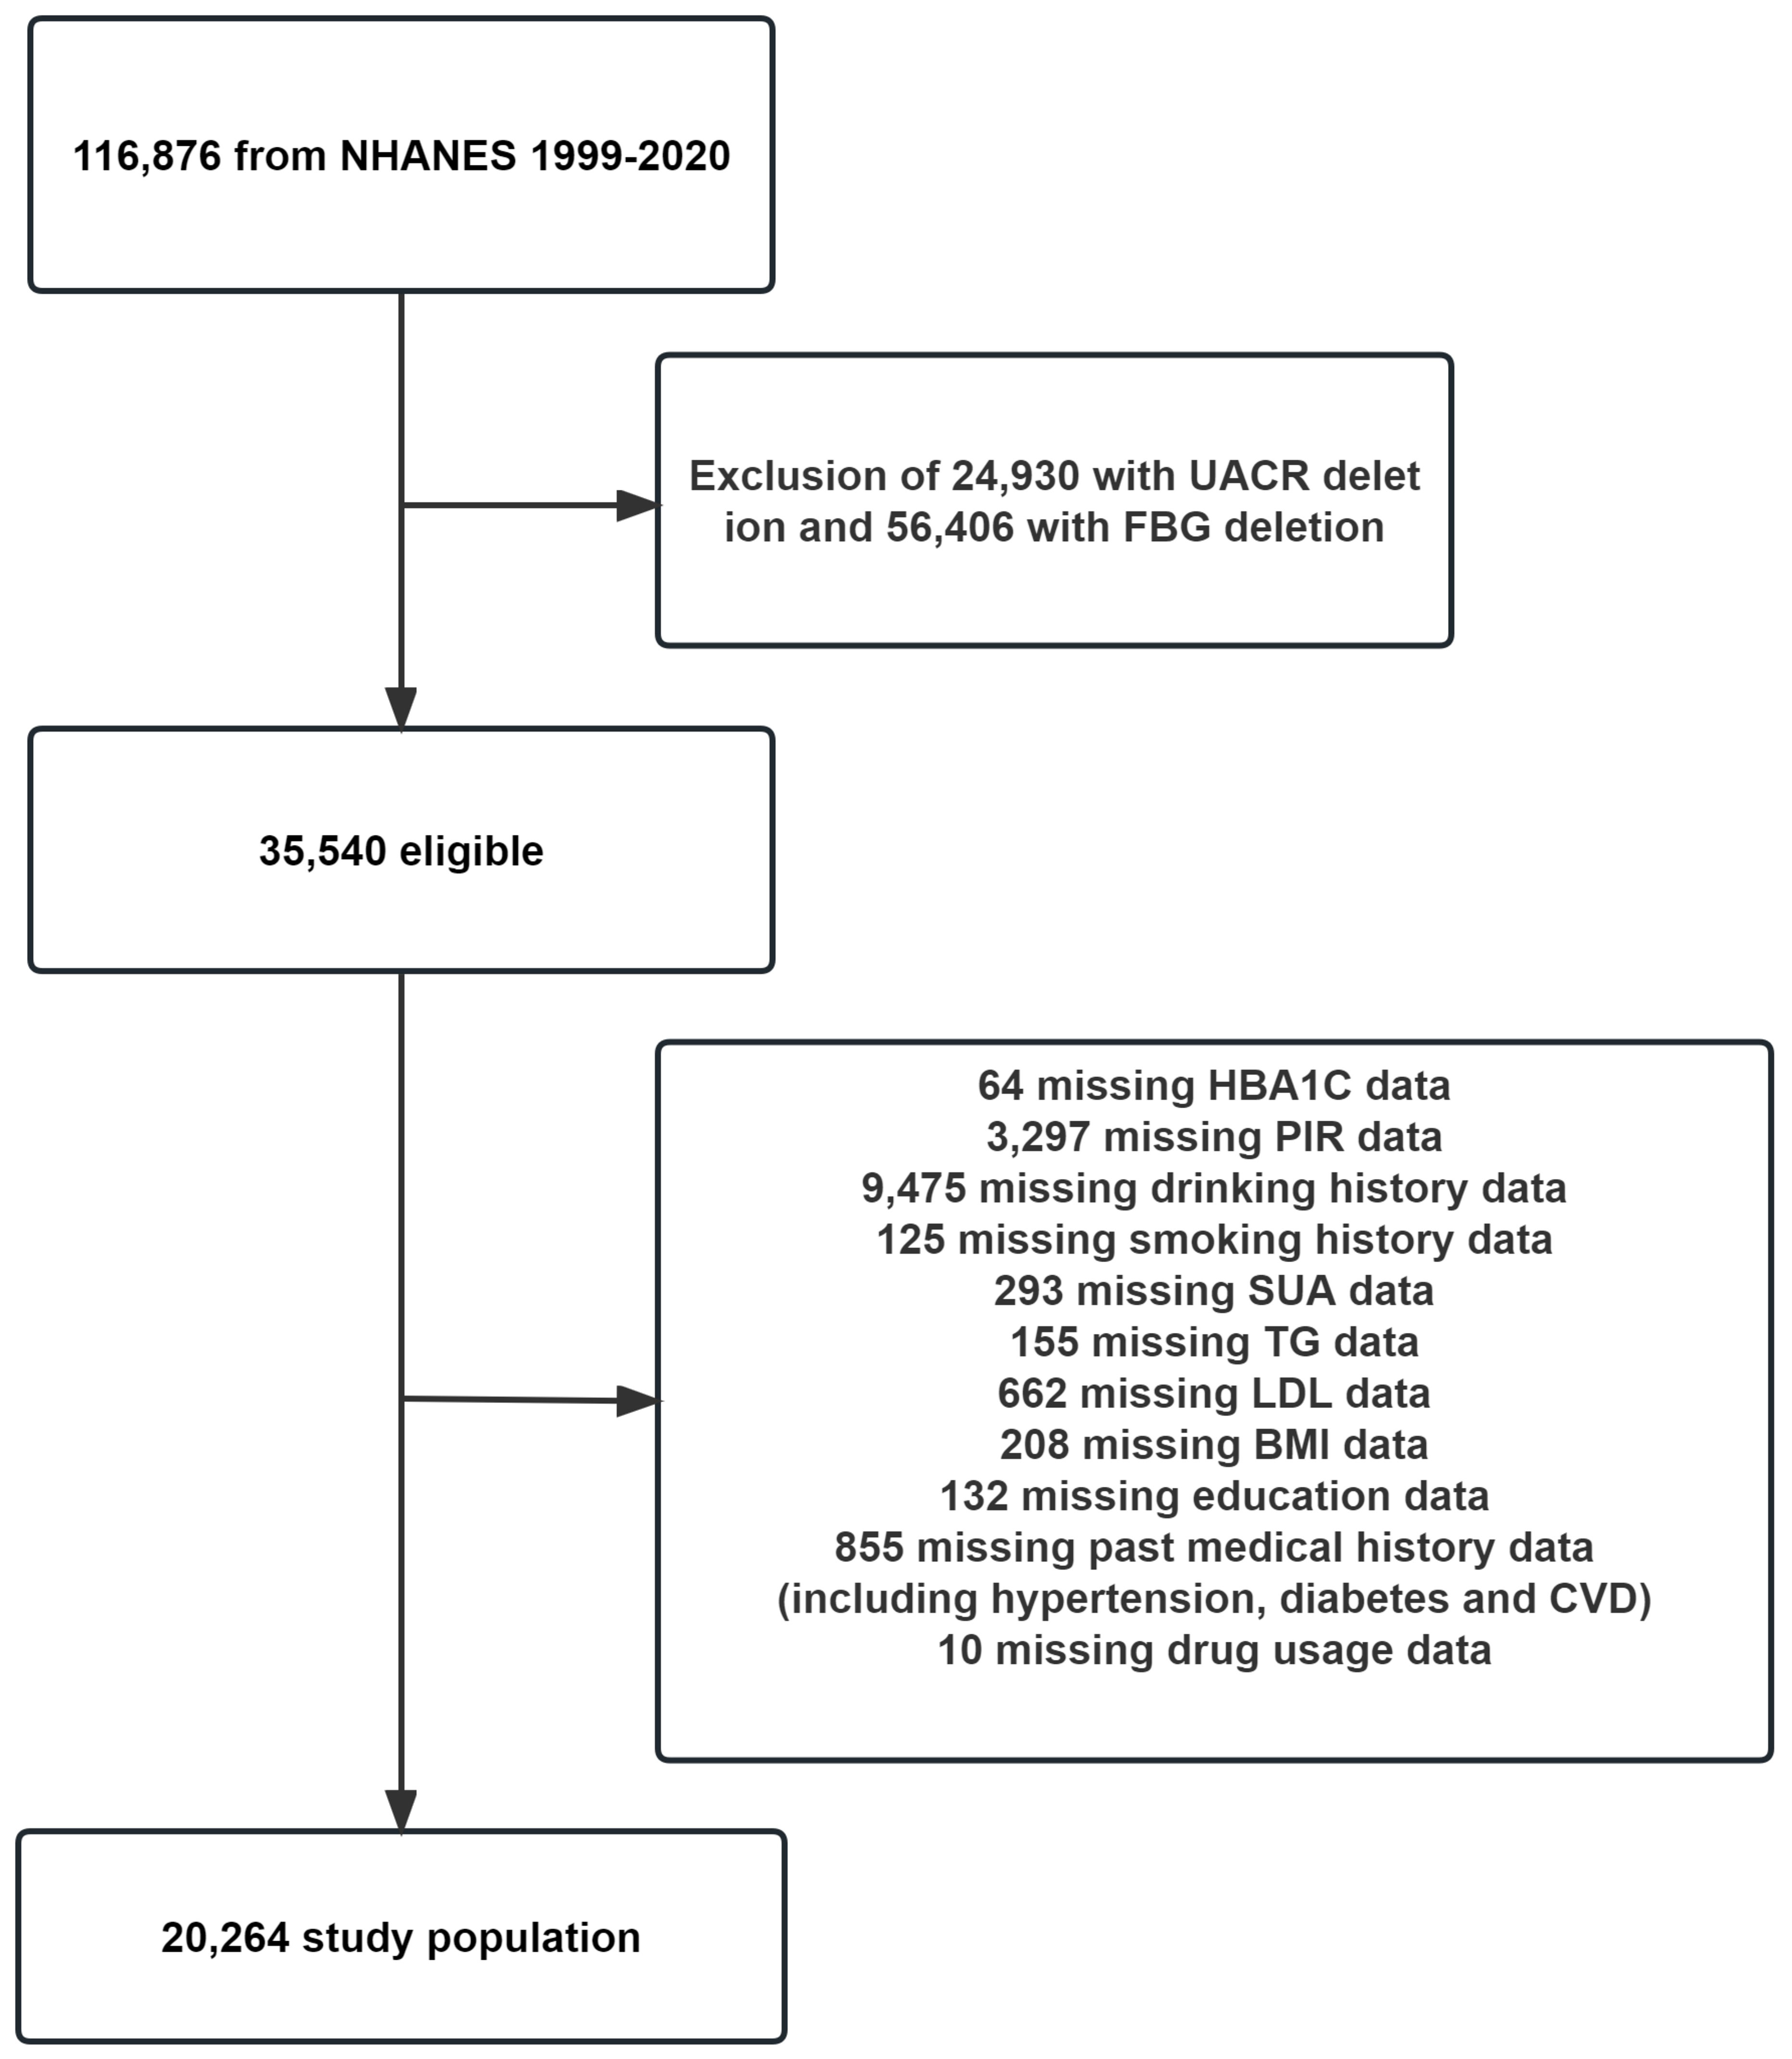
Figure 1 Flowchart for inclusion of study participants. PIR, poverty income ratio; FBG, fasting blood glucose; HbA1C, hemoglobin A1c; SUA, serum uric acid; TG, triglyceride; TC, total cholesterol; LDL, low-density lipoprotein; UACR, urinary albumin-to-creatinine ratio; BMI, body mass index; CVD, cardiovascular disease.
2.2 Outcome measurements
The primary indicator of the outcome for this study was the UACR. To determine albumin levels, urine samples were subjected to solid-phase fluorescence immunoassay, while urinary creatinine levels were analyzed using the enzymatic creatinase technique on Roche/Hitachi Modular P chemistry analyzer. The use of these methods ensured accurate and precise measurements of albumin and creatinine levels in the urine samples.
2.3 FBG and covariate acquisition
The NHANES dataset provides information on participant demographics such as gender, age, race, education level, and PIR, which were collected through questionnaires. The dataset also includes participants’ hematological indicators, including FBG, HbA1C, TG, total cholesterol (TC), LDL, high-density lipoprotein (HDL), creatinine (Cr), blood urea nitrogen (BUN), and SUA, which were directly obtained from the database. Estimated glomerular filtration rate (eGFR) was calculated using the CKD Epidemiology Collaboration (CKD-EPI) equation (21). BMI was calculated based on height and weight measurements (weight/height squared).
Information on alcohol and tobacco usage was collected through questionnaires as well. Participants were asked about their drinking history in the past 12 months and were defined as non-drinkers if they answered “Never”. Otherwise, they were considered drinkers. Similarly, smoking history was obtained by asking participants if they currently smoke cigarettes. Those who answered “yes” were defined as smokers, while those who answered “no” were considered non-smokers.
The participants’ past medical history was gathered through questionnaires and physical examination. Hypertension was diagnosed by asking if they had high blood pressure or were taking medication for it, or by measuring their blood pressure three times (systolic ≥ 140 mmHg or diastolic ≥ 90 mmHg). Diagnosis of diabetes was obtained by questionnaire (self-reporting that they had diabetes or were currently taking medication for glycemic control), FBG ≥7 mmol/L, or HbA1C ≥6.5%. Cardiovascular disease (CVD) is defined as an affirmative answer to the question: Has a doctor or other health professional ever told you that you have congestive heart failure/coronary heart disease/angina/heart attack/stroke? Chronic kidney disease (CKD) was diagnosed as eGFR <60ml/min/1.73m2 or UACR ≥30mg/g (22, 23). It is imperative to note that the data concerning participants’ use of prescription medication was obtained solely through participants’ self-reports.
2.4 Statistical analysis
Continuous variables in this study did not conform to normal distribution and are expressed as median (Q1-Q3). Categorical variables are expressed as percentages. Linear regression models were constructed to assess the linear relationship between FBG and UACR. We used three models to assess the magnitude of the independent effect of FBG on UACR. Next, we analyzed the nonlinear relationship between FBG and UACR using a generalized summation model. Again, we used three models, where the first model was not adjusted for any variables. Model I was adjusted for sex, age, race, PIR, and education level, while model II was further adjusted for Cr, SUA, BUN, TG, HDL, LDL, eGFR, BMI, smoking, drinking, diabetes, hypertension, CVD, glucose-lowering therapy, antihypertension therapy, and hypolipemic therapy. We selected the adjusted covariates based on regression coefficients greater than 10% for UACR or p-values less than 0.1 for the regression coefficients of covariates with FBG. Finally, we investigated whether a stable non-linear relationship existed between FBG and UACR by dividing participants into subgroups based on different cut-points.
3 Results
3.1 Baseline characteristics of study participants by UACR grouping
This study encompassed a cohort of 20,264 U.S. citizens actively engaged in the NHANES from 1999 to 2020. The mean age of the participants included in this analysis was 50.00 (35.00-64.00) years. The gender distribution was approximately equal, with a notable representation of Mexican American individuals. Moreover, a substantial proportion of the participants possessed college or higher educational qualifications. Subsequently, we classified the participants above into three distinct categories based on the Kidney Disease: Improving Global Outcomes (KDIGO) guideline recommendations for the stratification of UACR: <30 mg/g, 30-300 mg/g, and >300 mg/g (23). As indicated in Table 1, <30 mg/g, 30-300 mg/g, and >300 mg/g had participant counts of 17,803, 2,063, and 399, respectively. Our analysis revealed that individuals in the >300mg/g group exhibited lower PIR and eGFR levels, as well as higher levels of FBG, HbA1C, Cr, BUN, TG, LDL, UACR, and BMI in comparison to the <30mg/g and 30-300mg/g groups. Furthermore, participants in the >300mg/g group demonstrated a higher prevalence of smoking, hypertension, diabetes, and CVD, along with a more significant proportion of individuals taking prescription medications.
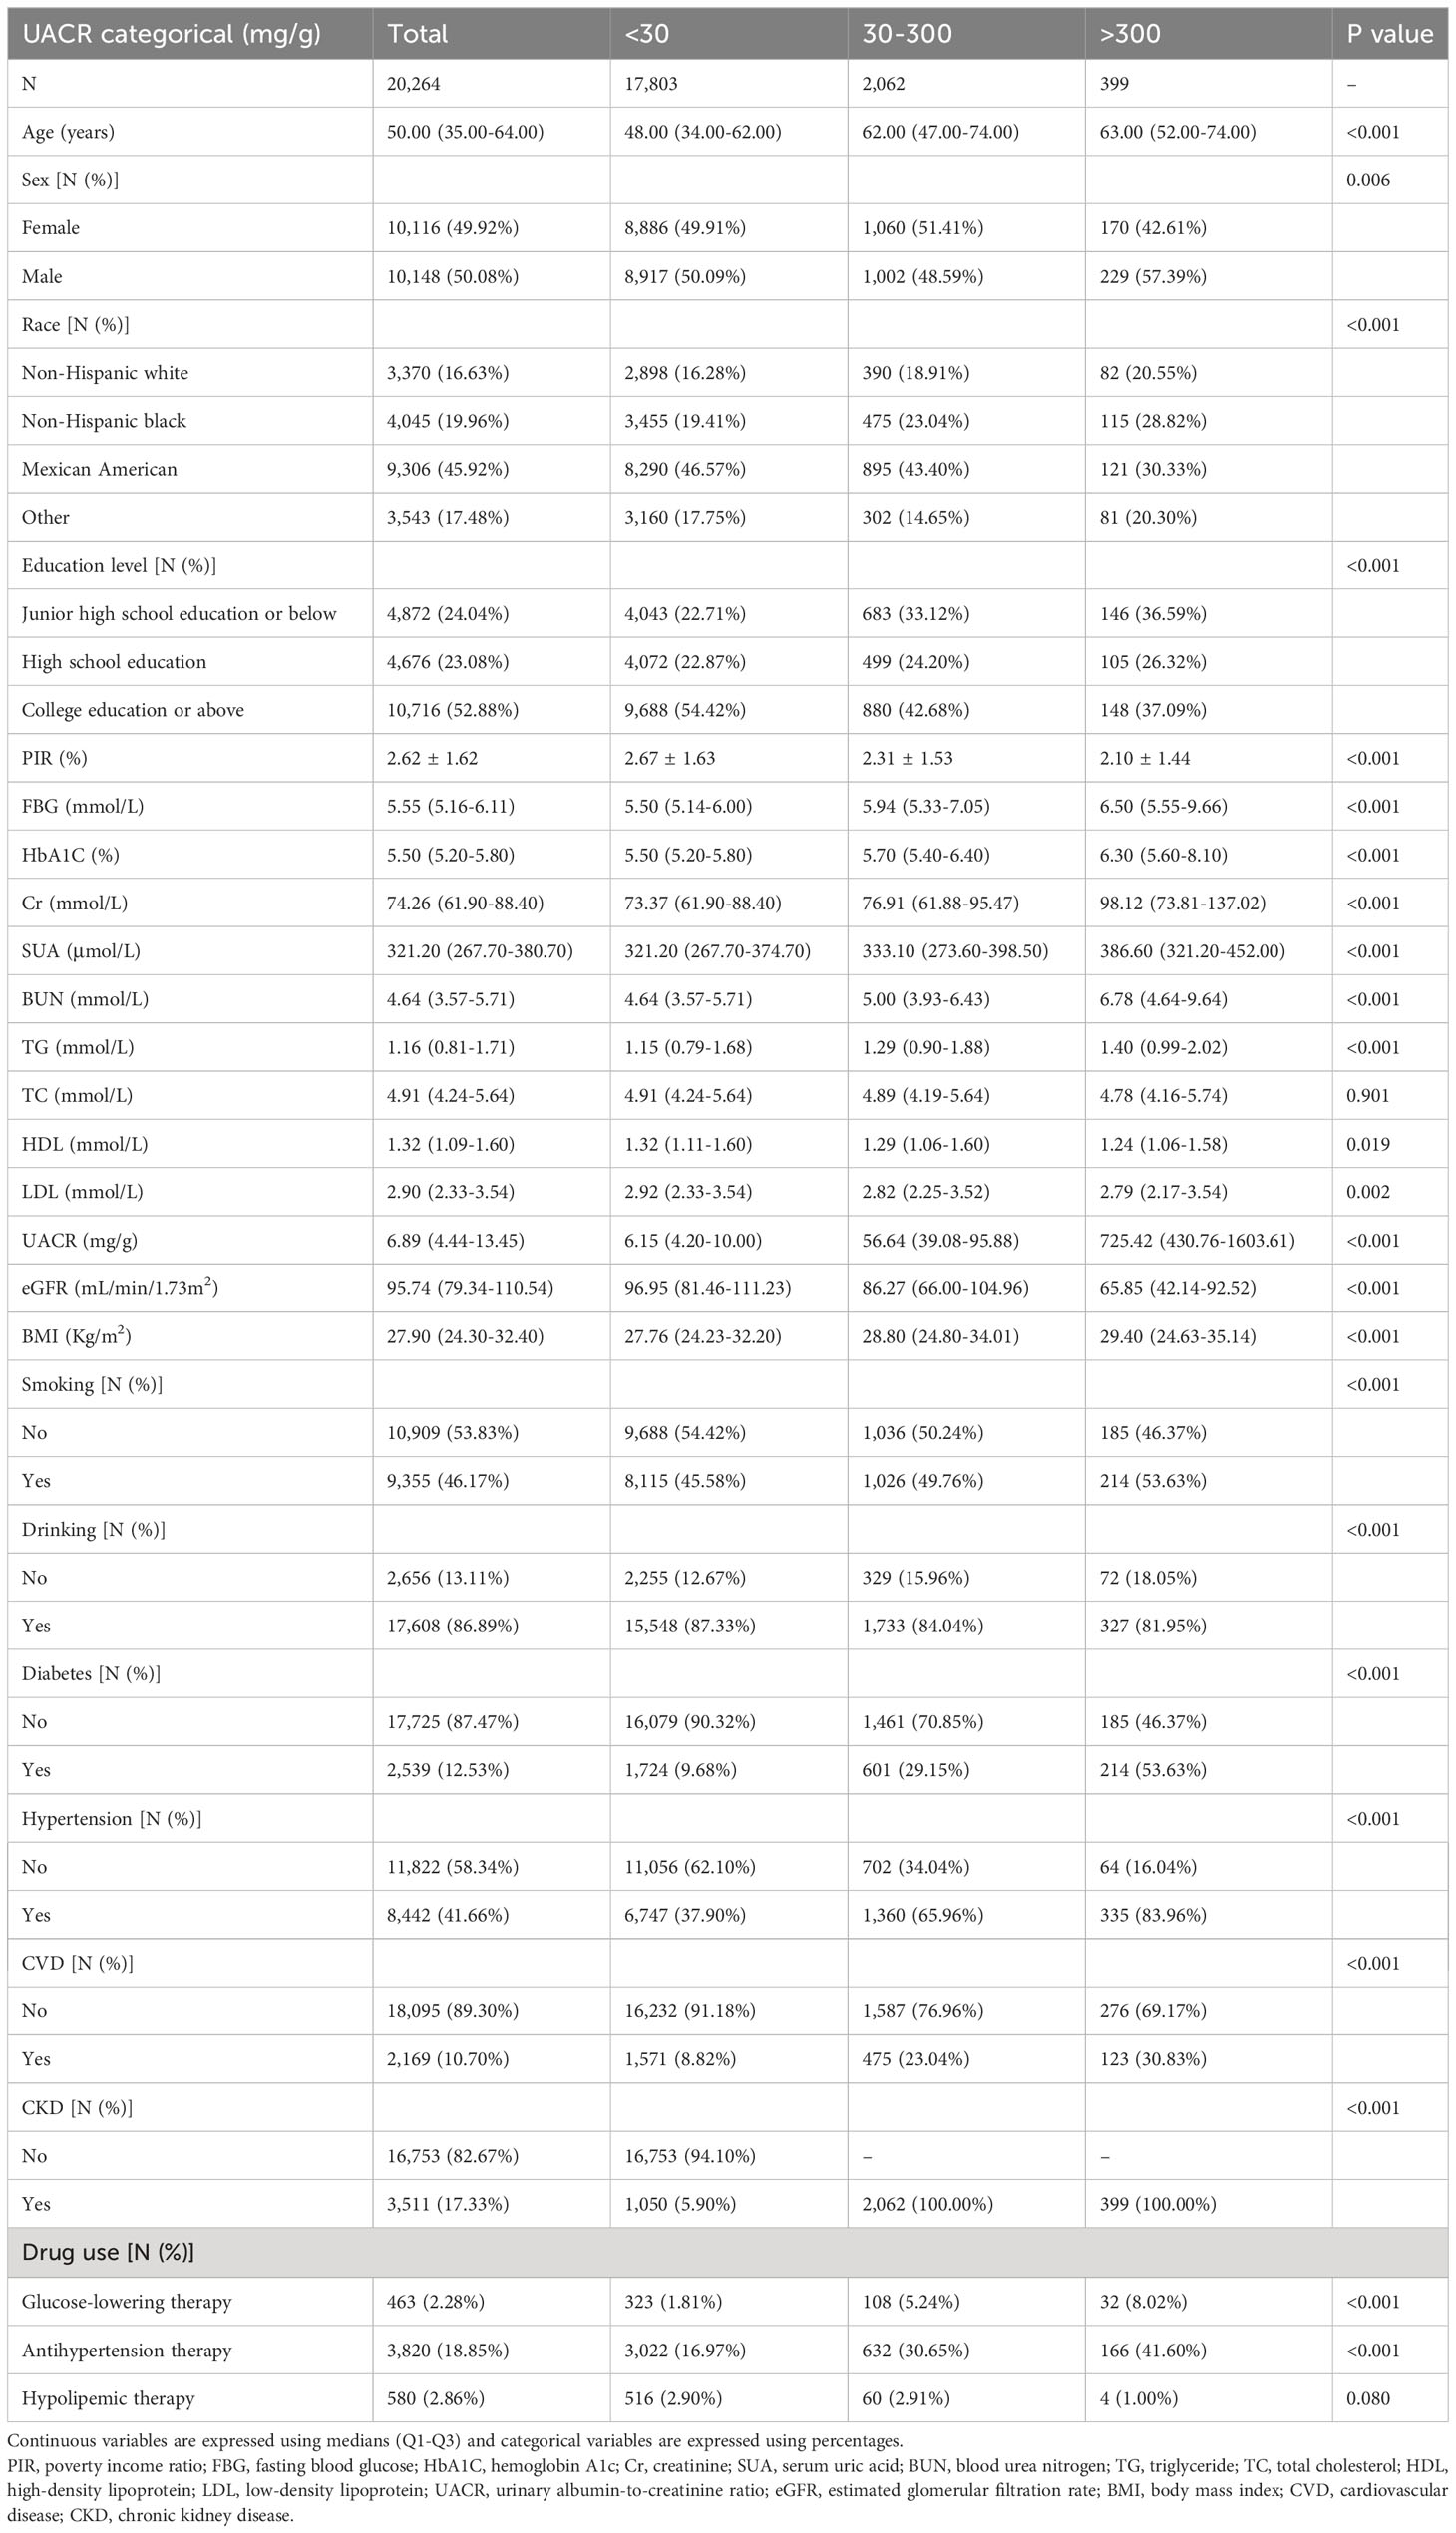
Table 1 Demographic information and baseline information on the study population, NHANES 1999-2020.
Furthermore, Supplementary Table 1 presents the factors that exhibit an association with UACR. These factors include age, FBG, HbA1C, Cr, SUA, BUN, TG, BMI, presence of hypertension, diabetes mellitus, CVD, and CKD, all of which demonstrate a positive correlation with elevated UACR. Conversely, being of Mexican American ethnicity, possessing a high school education or higher, having a favorable economic status, engaging in current alcohol consumption, undergoing lipid-lowering therapy, and having an eGFR exhibit a negative association with elevated UACR.
3.2 Analysis of linear and nonlinear association between FBG and UACR
In order to assess the magnitude of the independent impact of FBG on UACR, we initially conducted a linear regression analysis (Table 2) to examine the linear association between FBG and UACR. Our findings revealed a positive correlation between FBG and UACR. More specifically, after adjusting for various confounding factors, we observed that for each 1 mmol/L rise in FBG, UACR increased by 4.67 mg/g (95% CI: 2.51, 6.83). Furthermore, UACR was classified into three groups utilizing clinical cut-points: <30mg/g, 30-300mg/g, and >300mg/g. Our analysis revealed a consistent association between FBG levels and UACR, indicating that elevated FBG levels led to heightened excretion of UACR.
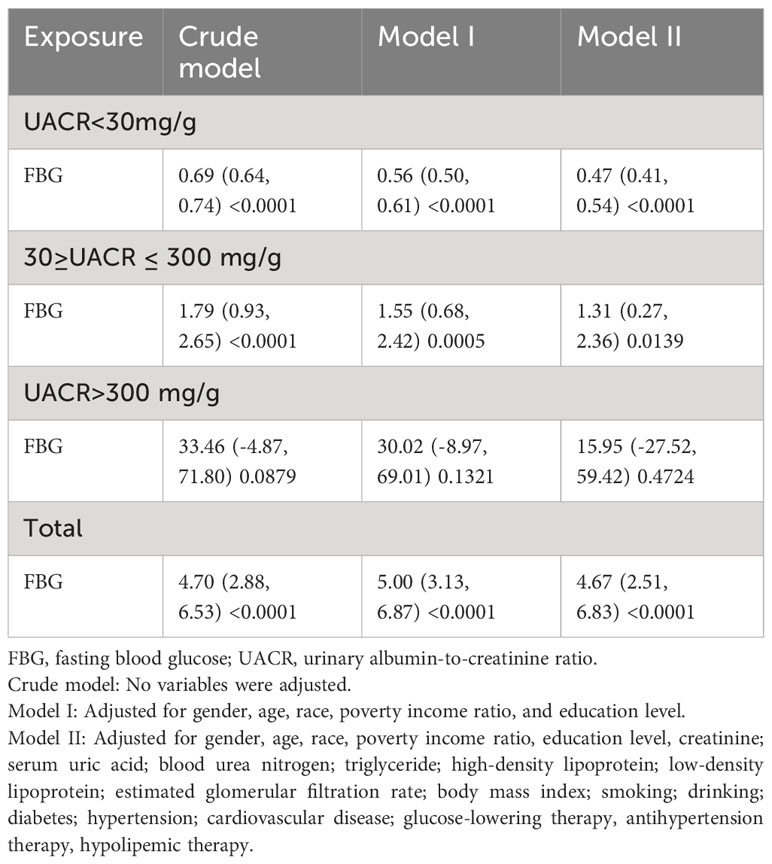
Table 2 Regression analysis of the linear relationship between fasting blood glucose and urinary albumin-to-creatinine ratio.
Furthermore, a comprehensive examination investigated the nonlinear regression between FBG and UACR. The graphical representation in Figure 2 clearly illustrates a U-shaped nonlinear association between FBG and UACR. Subsequently, the determination of the inflection point of FBG was accomplished through threshold effect analysis. The data presented in Table 3 reveals that in the Crude model when FBG is less than 4.69mmol/L, a one mmol/L increase in FBG results in a 210.49 mg/g decrease in UACR. Conversely, when FBG exceeds 4.69 mmol/L, a one mmol/L increase in FBG leads to a 26.15 mg/g increase in UACR. After controlling for gender, age, race, PIR, and education level, the U-shaped association between FBG and UACR remained evident. Specifically, when FBG was less than 4.84 mmol/L, each mmol/L increase in FBG resulted in a 169.66 mg/g decrease in UACR. On the contrary, in cases where FBG exceeded 4.84 mmol/L, a rise of 1 mmol/L in FBG led to a 24.46 mg/g reduction in UACR. Additionally, in the comprehensive adjusted model, it was observed that in cases where FBG levels were below 5.44 mmol/L, a one mmol/L increase in FBG resulted in a 2.17 mg/g decrease in UACR. Conversely, when FBG levels exceeded 5.44 mmol/L, a one mmol/L increase in FBG led to an increase of 2.13 mg/g in UACR.
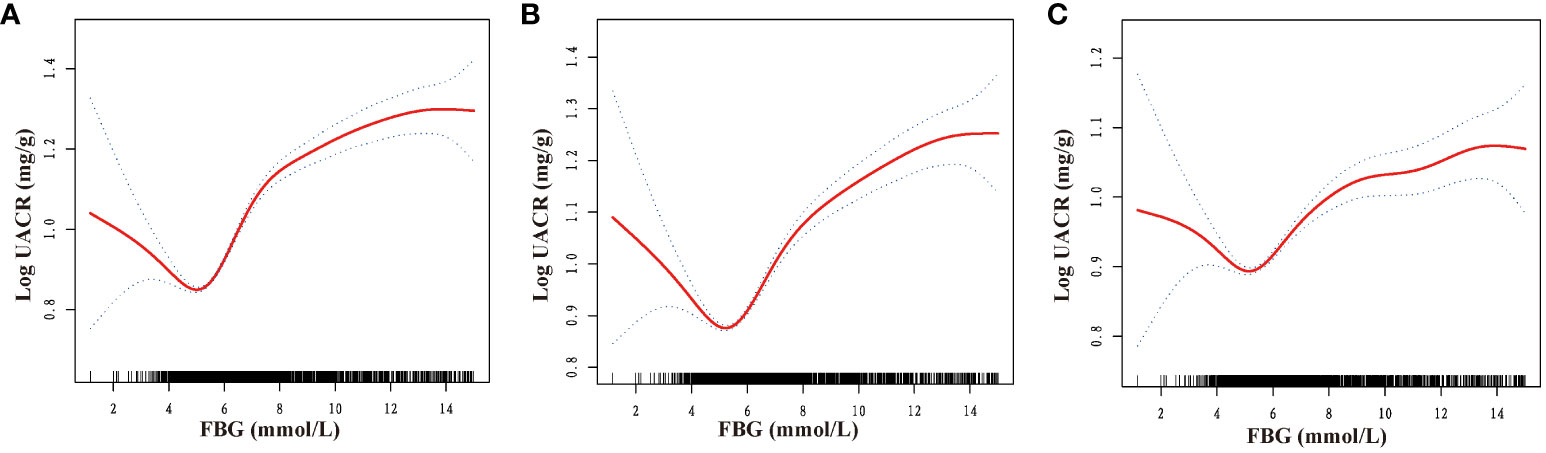
Figure 2 Dose-response relationship between fasting blood glucose and urinary albumin-to-creatinine ratio. FBG, fasting blood glucose; UACR, urinary albumin-to-creatinine ratio. (A) No variables were adjusted; (B) Adjusted for gender, age, race, poverty income ratio, and education level; (C) Adjusted for gender, age, race, poverty income ratio, education level, creatinine; serum uric acid; blood urea nitrogen; triglyceride; high-density lipoprotein; low-density lipoprotein; estimated glomerular filtration rate; body mass index; smoking; drinking; diabetes; hypertension; cardiovascular disease; glucose-lowering therapy, antihypertension therapy, hypolipemic therapy.
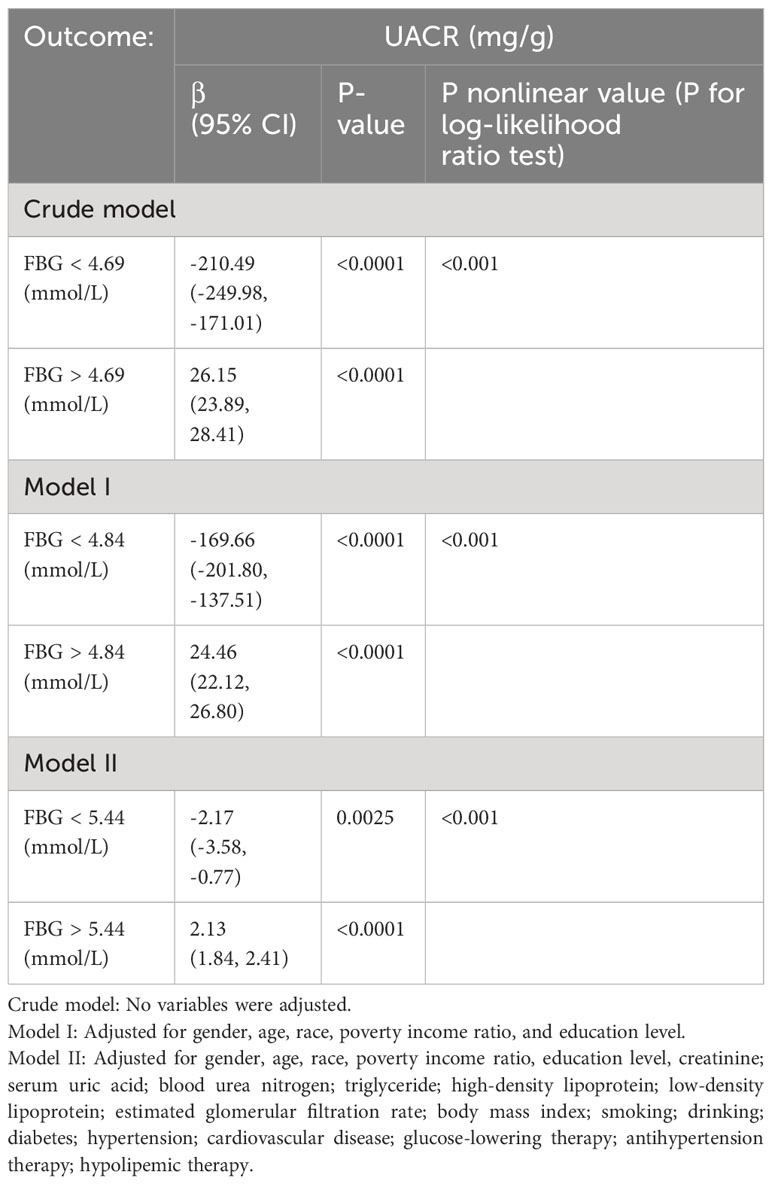
Table 3 Threshold effect of fasting blood glucose on the urinary albumin-to-creatinine ratio analyzed using piece-wise linear regression.
3.3 U-shaped relationship between FBG and UACR in different subgroups
We categorized participants based on their demographic characteristics, baseline levels, past medical history, and drinking history in order to examine the consistency of the association between FBG and UACR across different populations. The results presented in Figures 3, 4 demonstrate a U-shaped relationship between FBG and UACR in various subgroups, including gender (male/female), age (<60/≥60 years), BMI (<25/≥25 Kg/m2), eGFR (<60/≥60 ml/min/1.73m2) and SUA <420 μmol/L, as well as in hypertension/non-hypertension, diabetic/non-diabetic, CVD/non-CVD, smokers/non-smokers, and drinkers. However, a U-shaped correlation between FBG and UACR was not observed in the population with SUA levels ≥420 μmol/L and non-drinkers.
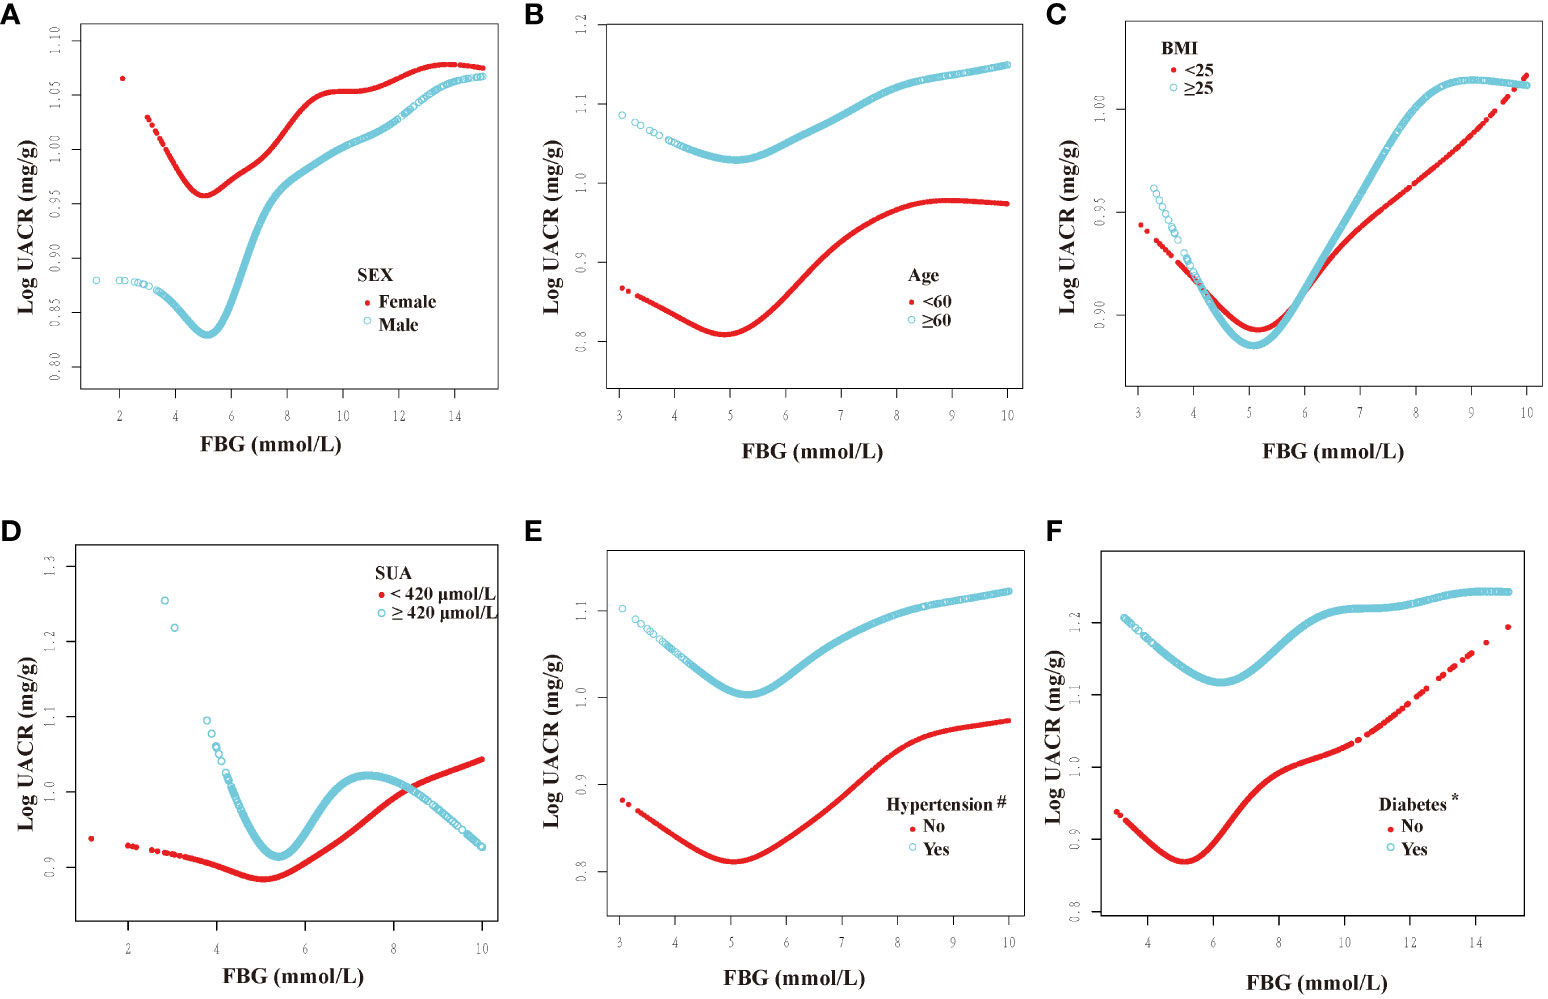
Figure 3 Dose-response relationship between fasting blood glucose and urinary albumin-to-creatinine ratio in different subgroups (I). FBG, fasting blood glucose; UACR, urinary albumin-to-creatinine ratio; SUA, serum uric acid; BMI, body mass index. All subgroups adjusted for gender, age, race, poverty income ratio, education level, creatinine; serum uric acid; blood urea nitrogen; triglyceride; high-density lipoprotein; low-density lipoprotein; estimated glomerular filtration rate; body mass index; smoking; drinking; diabetes; hypertension; cardiovascular disease; glucose-lowering therapy, antihypertension therapy, hypolipemic therapy. The above subgroups were adjusted for the variables, except for themselves. #: This subgroup was adjusted for the variables, except for themselves and antihypertension therapy. *: This subgroup was adjusted for the variables, except for themselves and glucose-lowering therapy. (A): grouped according to sex; (B): grouped according to age; (C): grouped according to BMI; (D): grouped according to the presence of hyperuricemia; (E): grouped according to the presence of hypertension; (F): grouped according to the presence of diabetes.
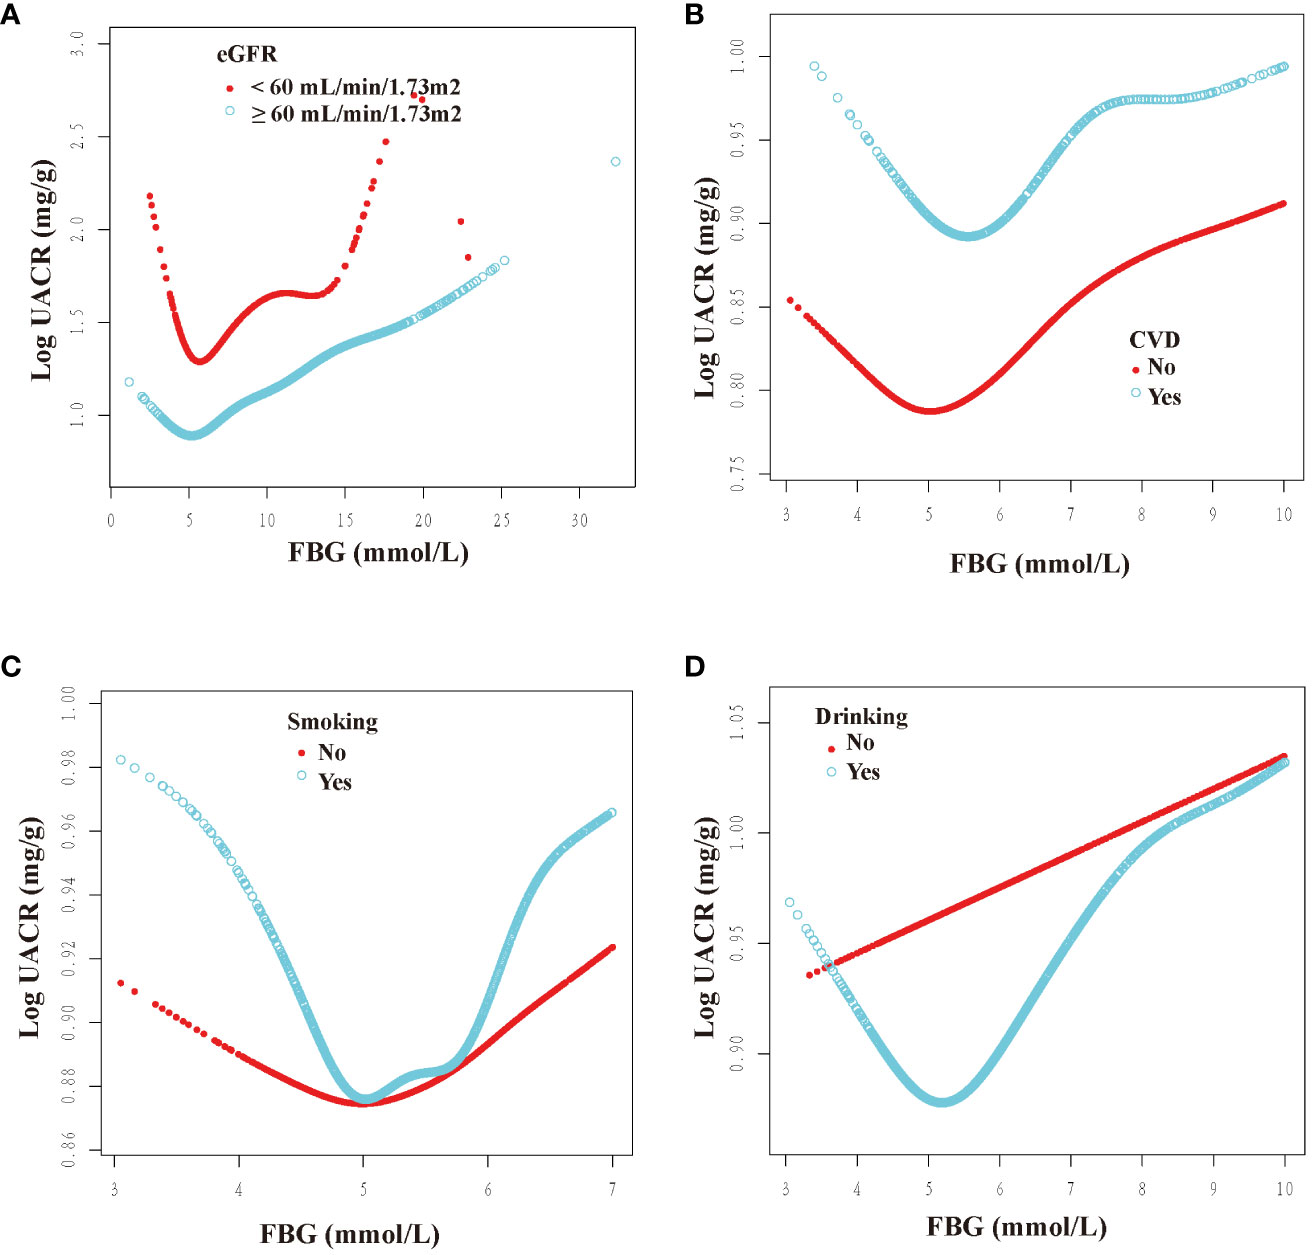
Figure 4 Dose-response relationship between fasting blood glucose and urinary albumin-to-creatinine ratio in different subgroups (II). FBG, fasting blood glucose; UACR, urinary albumin-to-creatinine ratio; CVD, cardiovascular disease; eGFR, estimated glomerular filtration rate. All subgroups adjusted for gender, age, race, poverty income ratio, education level, creatinine; serum uric acid; blood urea nitrogen; triglyceride; high-density lipoprotein; low-density lipoprotein; estimated glomerular filtration rate; body mass index; smoking; drinking; diabetes; hypertension; cardiovascular disease; glucose-lowering therapy, antihypertension therapy, hypolipemic therapy. The above subgroups were adjusted for the variables, except for themselves. (A): grouped according to the presence of renal insufficiency; (B): grouped according to the presence of CVD; (C): grouped according to the presence of smoking; (D): grouped according to the presence of drinking.
Furthermore, inflection points were identified within the subgroups, as presented in Table 4. Remarkably, these inflection points exhibited inconsistency across various factors, including gender, age, BMI, SUA, past medical history, and drinking history. Specifically, the inflection point for women was determined to be 5.22 mmol/L, whereas for men, it was 5.61 mmol/L. Additionally, individuals below 60 exhibited an inflection point of 5.38 mmol/L, while those aged 60 and above had an inflection point of 4.83 mmol/L. Furthermore, individuals with an SUA below 420 μmol/L displayed an inflection point of 5.61 mmol/L. The inflection point for individuals with a BMI less than 25 Kg/m2 was 5.22 mmol/L, whereas for those with a BMI greater than or equal to 25 Kg/m2, the inflection point was 5.61 mmol/L. Furthermore, the inflection point differed between non-hypertension individuals (6.00 mmol/L) and hypertension individuals (5.44 mmol/L), as well as between non-diabetic individuals (5.72 mmol/L) and diabetic individuals (5.11 mmol/L). Additionally, the inflection point for individuals without CVD was 4.96 mmol/L, whereas for those with CVD, it was 5.62 mmol/L. In the population with an eGFR less than 60 ml/min/1.73m2, the inflection point was observed at 5.88 mmol/L, whereas in the population with an eGFR greater than or equal to 60 ml/min/1.73m2, it was noted at 5.46 mmol/L. Additionally, in the population that consumed alcohol, the inflection point was measured at 5.53 mmol/L.
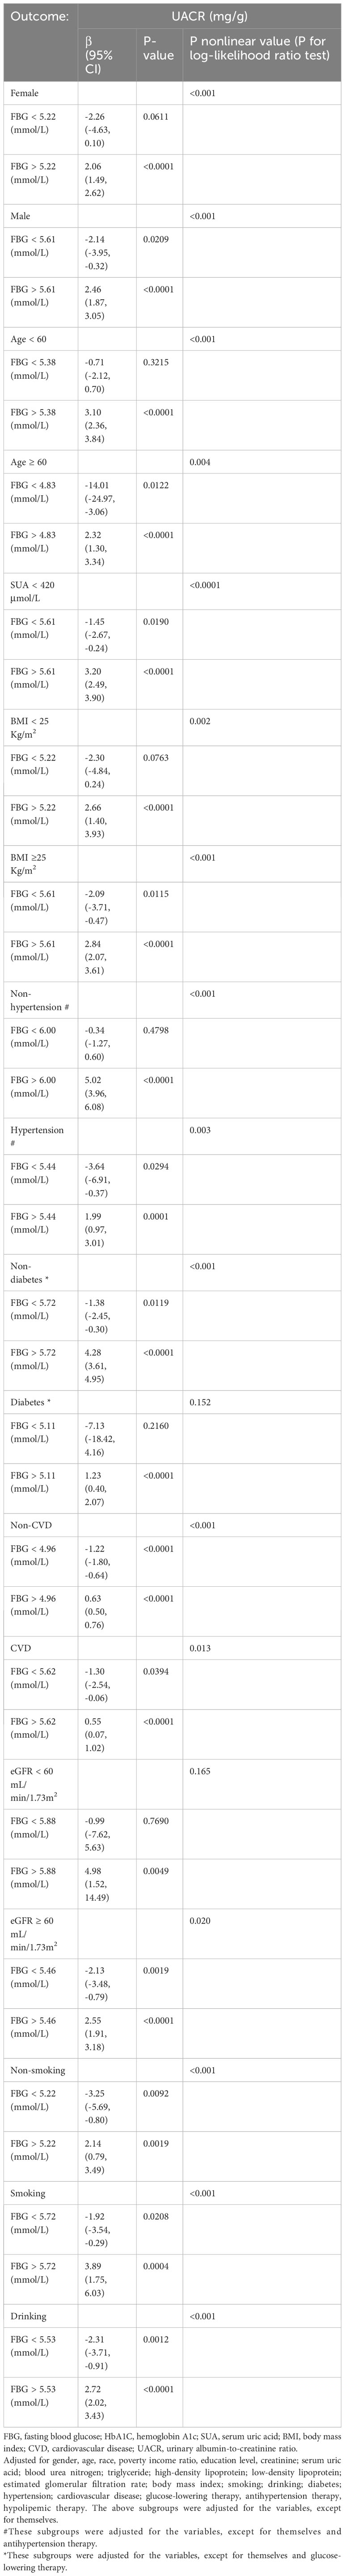
Table 4 Threshold effect of fasting blood glucose on the urinary albumin-to-creatinine ratio analyzed using piece-wise linear regression in different subgroups.
4 Discussion
The present investigation conducted a comprehensive cross-sectional analysis to elucidate the correlation between FBG and UACR. To the best of our knowledge, this is the pioneering study to explore this particular relationship. Our findings indicate a significant association between elevated FBG levels and increased UACR. Furthermore, a U-shaped nonlinear pattern was observed in the relationship between FBG and UACR. Notably, we identified the inflection point of FBG. Specifically, when FBG levels were below 5.44 mmol/L, elevated FBG was linked with decreased UACR. Conversely, when FBG levels exceeded 5.44 mmol/L, a positive correlation between FBG and UACR was observed. These findings hold substantial implications in terms of understanding the relationship between FBG and UACR, particularly in cases of diabetes and its complications.
Diabetes mellitus is a cluster of metabolic disorders characterized by elevated fasting and postprandial blood glucose levels, which may result from insufficient insulin production or insulin resistance. Diabetes has demonstrated a progressive escalation in recent years, and it is projected to affect approximately 592 million people worldwide by 2035 (24). Diabetes-related complications, including diabetic nephropathy, retinopathy, neuropathy, cardiovascular complications, and hepatic fibrosis, can significantly impact the prognosis of individuals with diabetes (25). Maintaining stable blood glucose levels is of utmost importance, as it promotes effective management of blood glucose, which, in turn, aids in weight control and mitigates cardiovascular events (26, 27).
Albuminuria has been found to have detrimental effects, including an increased risk of recurrent venous thromboembolism (5%) (28), higher rates of hospitalization in the elderly (29), and an elevated risk of adverse cardiovascular events and mortality (30, 31). The presence of chronic hyperglycemia further amplifies the likelihood of developing albuminuria (32). Specifically, one mmol rise in mean FBG is associated with a 27% increase in proteinuria (33), ultimately culminating in the development of diabetic nephropathy and end-stage renal disease (34). Furthermore, it has been observed that inadequate regulation of glycemic levels in individuals with Young maturity-onset diabetes of the young type patients results in a significant 2-3-fold rise in the likelihood of developing microalbuminuria and retinopathy (35). This finding underscores the substantial impact of blood glucose on the occurrence of albuminuria.
A study conducted in Shanghai, China (36) revealed that the incidence of albuminuria was 28.9%, 28.1%, and 12.9% among individuals diagnosed with diabetes, individuals with undiagnosed diabetes, and individuals with pre-diabetes, respectively. Additionally, even among participants with normal blood glucose levels, the incidence of albuminuria was found to be 8.7%. Another study reached a similar conclusion, suggesting that poor glycemic control increases the likelihood of albuminuria (37). However, a study conducted in South Asia did not find a statistically significant association between decreased FBG levels and decreased UACR (14). In addition, an increase in albuminuria was observed in aged mice. However, blood glucose was indeed significantly reduced (38). The U-shaped association observed between FBG and UACR in our study provides a potential explanation for the conflicting findings regarding the relationship between FBG and UACR.
Numerous studies have elucidated the underlying mechanism through which increased FBG levels contribute to the occurrence of proteinuria, such as alterations in the glomerular filtration barrier (39, 40) and injury to podocytes (41). Conversely, limited research has been conducted on the mechanisms responsible for proteinuria within the normal range of FBG. However, the subsequent studies discussed herein may provide valuable insights into this matter. A study conducted by Kyung Chul Song (42) yielded a noteworthy finding: prolonged variations in glycemic control play a role in the emergence of microalbuminuria among individuals with type 1 diabetes, and mitigating glycemic fluctuations may potentially ameliorate diabetic microvascular complications (43). We propose that the manifestation of proteinuria in this cohort may be attributed to the presence of glucose fluctuations. Nevertheless, additional research is imperative to validate this hypothesis. In addition, it is plausible that this cohort of individuals exhibited insulin resistance despite having normal blood glucose levels (44). Given that the extent of insulin resistance is closely associated with the likelihood of developing CKD (45), it follows that insulin resistance contributes to elevated urinary albumin excretion (46, 47).
The risk factors for microalbuminuria include aging, female gender, obesity, elevated SUA levels, hypertension, diabetes, smoking, and alcohol consumption (48–51). Consequently, we investigated the association between FBG and UACR in various U.S. populations, considering factors such as gender, age, BMI, SUA, eGFR levels, past medical history, and smoking and alcohol habits. Our study revealed a U-shaped relationship between FBG and UACR in diverse populations, except for those with SUA levels ≥ 420 μmmol/L and individuals who do not consume alcohol, suggesting the relative stability of our findings.
It is crucial to acknowledge the limitations inherent in our study. Firstly, the cross-sectional design restricts our ability to establish a causal relationship between FBG and UACR, thereby underscoring the necessity for future investigations employing randomized controlled trials. Secondly, to ensure data integrity, we have excluded a substantial proportion of participants, potentially compromising the generalizability of our findings to the broader U.S. population. Moreover, the applicability of our study’s results to populations in different countries or regions requires further exploration. Moreover, while UACR may serve as a valuable indicator for evaluating albuminuria (52), it is critical to acknowledge that quantifying urine protein over 24 hours remains the gold standard. Further investigation is required to determine if comparable outcomes can be observed between FBG and 24-hour urine protein measurements. Ultimately, our study found no evidence of a U-shaped relationship between FBG and UACR in populations with SUA levels ≥420 μmol/L and those who do not drink alcohol. Nevertheless, the precise influence of hyperuricemia and non-alcohol consumption on FBG and UACR necessitates further investigation. These findings invite further inquiry into the interactions between these factors and their impact on metabolic health.
5 Conclusion
Our study has revealed a U-shaped non-linear association between FBG and UACR among the general population in the U.S. We found that when FBG levels surpassed a particular threshold, UACR levels increased with FBG levels. These findings may have significant implications for the management of diabetes and associated complications.
Data availability statement
Publicly available datasets were analyzed in this study. This data can be found here: https://www.cdc.gov/nchs/nhanes/index.htm.
Author contributions
JS: Writing – original draft, Software, Investigation, Conceptualization. PW: Writing – review & editing, Supervision, Methodology, Data curation. HL: Writing – review & editing.
Funding
The author(s) declare that no financial support was received for the research, authorship, and/or publication of this article.
Conflict of interest
The authors declare that the research was conducted in the absence of any commercial or financial relationships that could be construed as a potential conflict of interest.
Publisher’s note
All claims expressed in this article are solely those of the authors and do not necessarily represent those of their affiliated organizations, or those of the publisher, the editors and the reviewers. Any product that may be evaluated in this article, or claim that may be made by its manufacturer, is not guaranteed or endorsed by the publisher.
Supplementary material
The Supplementary Material for this article can be found online at: https://www.frontiersin.org/articles/10.3389/fendo.2024.1334949/full#supplementary-material
References
1. Bangstad HJ, Osterby R, Dahl-Jørgensen K, Berg KJ, Hartmann A, Nyberg G, et al. Early glomerulopathy is present in young, type 1 (Insulin-dependent) diabetic patients with microalbuminuria. Diabetologia. (1993) 36(6):523–9. doi: 10.1007/BF02743268
2. Viberti GC, Jarrett RJ, Keen H. Microalbuminuria as prediction of nephropathy in diabetics. Lancet (London England). (1982) 2:611. doi: 10.1016/S0140-6736(82)90688-2
3. Borch-Johnsen K, Kreiner S. Proteinuria: value as predictor of cardiovascular mortality in insulin dependent diabetes mellitus [J]. Br Med J (Clinical Res Ed). (1987) 294:1651–4. doi: 10.1136/bmj.294.6588.1651
4. Krolewski AS, Warram JH, Christlieb AR, Busick EJ, Kahn CR. The changing natural history of nephropathy in type I diabetes. Am J Med. (1985) 78(5):785–94. doi: 10.1016/0002-9343(85)90284-0
5. Adler AI, Stevens RJ, Manley SE, Bilous RW, Cull CA, Holman RR. Development and progression of nephropathy in type 2 diabetes: the United Kingdom prospective diabetes study (Ukpds 64). Kidney Int. (2003) 63(1):225–32. doi: 10.1046/j.1523-1755.2003.00712.x
6. Bojestig M, Arnqvist HJ, Karlberg BE, Ludvigsson J. Glycemic control and prognosis in type I diabetic patients with microalbuminuria. Diabetes Care. (1996) 19(4):313–7. doi: 10.2337/diacare.19.4.313
7. Xie X, Atkins E, Lv J, Bennett A, Neal B, Ninomiya T, et al. Effects of intensive blood pressure lowering on cardiovascular and renal outcomes: updated systematic review and meta-analysis. Lancet (London England). (2016) 387(10017):435–43. doi: 10.1016/S0140-6736(15)00805-3
8. 55(Th) easd annual meeting of the european association for the study of diabetes : Barcelona, Spain, 16 - 20 September 2019. Diabetologia. (2019) 62(Suppl 1):1–600. doi: 10.1007/s00125-019-4946-6
9. Mori H, Okada Y, Arao T, Tanaka Y. Sitagliptin improves albuminuria in patients with type 2 diabetes mellitus. J Diabetes Invest. (2014) 5(3):313–9. doi: 10.1111/jdi.12142
10. Hattori S. Sitagliptin reduces albuminuria in patients with type 2 diabetes. Endocrine J. (2011) 58:69–73. doi: 10.1507/endocrj.K10E-382
11. Amin R, Widmer B, Prevost AT, Schwarze P, Cooper J, Edge J, et al. Risk of microalbuminuria and progression to macroalbuminuria in A cohort with childhood onset type 1 diabetes: prospective observational study. Bmj. (2008) 336(7646):697–701. doi: 10.1136/bmj.39478.378241.BE
12. Song KH, Yoon KH, Kang ML, Cha BY, Lee KW, Son HY, et al. Progression to overt proteinuria in microalbuminuric koreans with non-insulin-dependent diabetes mellitus. Diabetes Res And Clin Pract. (1998) 42(2):117–21. doi: 10.1016/S0168-8227(98)00097-7
13. Yimthiang S, Pouyfung P, Khamphaya T, Kuraeiad S, Wongrith P, Vesey DA, et al. Effects of environmental exposure to cadmium and lead on the risks of diabetes and kidney dysfunction. Int J Environ Res Public Health. (2022) 19(4). doi: 10.3390/ijerph19042259
14. Chandie Shaw PK, Berger SP, Mallat M, Frölich M, Dekker FW, Rabelink TJ. Central obesity is an independent risk factor for albuminuria in nondiabetic South Asian subjects. Diabetes Care. (2007) 30(7):1840–4. doi: 10.2337/dc07-0028
15. Lei B, Nakano D, Fan YY, Kitada K, Hitomi H, Kobori H, et al. Add-on aliskiren elicits stronger renoprotection than high-dose valsartan in type 2 diabetic kkay mice that do not respond to low-dose valsartan. J Pharmacol Sci. (2012) 119(2):131–8. doi: 10.1254/jphs.12031FP
16. Coca SG, Ismail-Beigi F, Haq N, Krumholz HM, Parikh CR. Role of intensive glucose control in development of renal end points in type 2 diabetes mellitus: systematic review and meta-analysis intensive glucose control in type 2 diabetes. Arch Internal Med. (2012) 172(10):761–9. doi: 10.1001/archinternmed.2011.2230
17. Effect of intensive therapy on the development and progression of diabetic nephropathy in the diabetes control and complications trial. The diabetes control and complications (Dcct) research group. Kidney Int. (1995) 47(6):1703–20. doi: 10.1038/ki.1995.236
18. Effect of intensive diabetes treatment on the development and progression of long-term complications in adolescents with insulin-dependent diabetes mellitus: diabetes control and complications trial. Diabetes control and complications trial research group. J Pediatr. (1994) 125(2):177–88. doi: 10.1016/S0022-3476(94)70190-3
19. Kilpatrick ES, Rigby AS, Atkin SL. Insulin resistance, the metabolic syndrome, and complication risk in type 1 diabetes: "Double diabetes" In the diabetes control and complications trial. Diabetes Care. (2007) 30:707–12. doi: 10.2337/dc06-1982
20. Control CFD, Health PJN, Survey NE. Nhanes questionnaires, datasets, and related documentation. (2018).
21. Levey AS, Stevens LA, Schmid CH, Zhang YL, Castro AF 3rd, Feldman HI, et al. A new equation to estimate glomerular filtration rate. Ann Internal Med. (2009) 150(9):604–12. doi: 10.7326/0003-4819-150-9-200905050-00006
22. Levey AS, Eckardt KU, Dorman NM, Christiansen SL, Hoorn EJ, Ingelfinger JR, et al. Nomenclature for kidney function and disease: report of A kidney disease: improving global outcomes (Kdigo) consensus conference. Kidney Int. (2020) 97(6):1117–29. doi: 10.1016/j.kint.2020.02.010
23. Kdigo 2021 clinical practice guideline for the management of blood pressure in chronic kidney disease. Kidney Int. (2021) 99(3s):S1–S87. doi: 10.1016/j.kint.2020.11.003
24. Guariguata L, Whiting DR, Hambleton I, Beagley J, Linnenkamp U, Shaw JE. Global estimates of diabetes prevalence for 2013 and projections for 2035. Diabetes Res Clin Pract. (2014) 103(2):137–49. doi: 10.1016/j.diabres.2013.11.002
25. Demir S, Nawroth PP, Herzig S, Ekim Üstünel B. Emerging targets in type 2 diabetes and diabetic complications. Adv Sci (Weinheim, Baden-Wurttemberg, Germany). (2021) 8(18):e2100275. doi: 10.1002/advs.202100275
26. Drucker DJ. The cardiovascular biology of glucagon-like peptide-1. Cell Metab. (2016) 24:15–30. doi: 10.1016/j.cmet.2016.06.009
27. Cantini G, Mannucci E, Luconi M. Perspectives in glp-1 research: new targets, new receptors. Trends Endocrinol Metabolism: Tem. (2016) 27:427–38. doi: 10.1016/j.tem.2016.03.017
28. Van Schouwenburg IM, Mahmoodi BK, Veeger NJ, Kluin-Nelemans HC, Gansevoort RT, Meijer K. Elevated albuminuria associated with increased risk of recurrent venous thromboembolism: results of A population-based cohort study. Br J Haematol. (2012) 156(5):667–71. doi: 10.1111/j.1365-2141.2011.09018.x
29. Barzilay JI, Buzkova P, Shlipak MG, Bansal N, Garimella P, Mukamal KJ. Hospitalization rates in older adults with albuminuria: the cardiovascular health study. J Gerontol Ser A Biol Sci Med Sci. (2020) 75(12):2426–33. doi: 10.1093/gerona/glaa020
30. Tousoulis D, Kampoli AM, Stefanadi E, Antoniades C, Siasos G, Papavassiliou AG, et al. New biochemical markers in acute coronary syndromes. Curr Med Chem. (2008) 15(13):1288–96. doi: 10.2174/092986708784534965
31. Strippoli GF, Craig M, Deeks JJ, Schena FP, Craig JC. Effects of angiotensin converting enzyme inhibitors and angiotensin ii receptor antagonists on mortality and renal outcomes in diabetic nephropathy: systematic review. BMJ (Clinical Res Ed). (2004) 329(7470):828. doi: 10.1136/bmj.38237.585000.7C
32. Meigs JB, D'agostino RB, Nathan DM Sr, Rifai N, Wilson PW. Longitudinal association of glycemia and microalbuminuria: the framingham offspring study. Diabetes Care. (2002) 25(6):977–83. doi: 10.2337/diacare.25.6.977
33. Zacharias JM, Young TK, Riediger ND, Roulette J, Bruce SG. Prevalence, Risk factors and awareness of albuminuria on A canadian first nation: A community-based screening study. BMC Public Health. (2012) 12:290. doi: 10.1186/1471-2458-12-290
34. Li XC, Zhuo JL. Targeting glucagon receptor signalling in treating metabolic syndrome and renal injury in type 2 diabetes: theory versus promise. Clin Sci (London Engl 1979). (2007) 113:183–93. doi: 10.1042/CS20070040
35. Peng H, Li J, Wang Z. De novo hnf1a mutation of young maturity-onset diabetes 3 of A young girl-case report. BMC Endocrine Disord. (2023) 23:38. doi: 10.1186/s12902-023-01293-7
36. Zhou Y, Echouffo-Tcheugui JB, Gu JJ, Ruan XN, Zhao GM, Xu WH, et al. Prevalence of chronic kidney disease across levels of glycemia among adults in Pudong New Area, Shanghai, China. BMC Nephrol. (2013) 14:253. doi: 10.1186/1471-2369-14-253
37. Collazos-Huamán LDC, Guerreros-Espino C, Herrera-Añazco P, Benites-Zapata VA. Association between glycemic control and albuminuria among Peruvian adults with diabetes mellitus 2: A cross-sectional analytical study. Sao Paulo Med J = Rev Paulista Medicina. (2022) 140(6):767–74. doi: 10.1590/1516-3180.2021.0448.r2.07022022
38. Friedman DJ, Talbert ME, Bowden DW, Freedman BI, Mukanya Y, Enjyoji K, et al. Functional entpd1 polymorphisms in african americans with diabetes and end-stage renal disease. Diabetes. (2009) 58(4):999–1006. doi: 10.2337/db08-1214
39. Myers BD, Winetz JA, Chui F, Michaels AS. Mechanisms of proteinuria in diabetic nephropathy: A study of glomerular barrier function. Kidney Int. (1982) 21(4):633–41. doi: 10.1038/ki.1982.71
40. Zhu WW, Chen HP, Ge YC, Xie HL, Zeng CH, Li LS, et al. Ultrastructural changes in the glomerular filtration barrier and occurrence of proteinuria in chinese patients with type 2 diabetic nephropathy. Diabetes Res Clin Pract. (2009) 86(3):199–207. doi: 10.1016/j.diabres.2009.09.009
41. Teng B, Schroder P, Müller-Deile J, Schenk H, Staggs L, Tossidou I, et al. Cin85 deficiency prevents nephrin endocytosis and proteinuria in diabetes. Diabetes. (2016) 65(12):3667–79. doi: 10.2337/db16-0081
42. Song KC, Kwon AR, Ahn JM, Chae HW, Kim HS, Kim DH. Hba1c variability and the risk of microalbuminuria in patients with type 1 diabetes. Int J Pediatr Endocrinol. (2015) 2015(Suppl 1):P9. doi: 10.1186/1687-9856-2015-S1-P9
43. Pai YW, Lin CH, Lin SY, Lee IT, Chang MH. Reconfirmation of newly discovered risk factors of diabetic peripheral neuropathy in patients with type 2 diabetes: A case-control study. PloS One. (2019) 14(7):e0220175. doi: 10.1371/journal.pone.0220175
44. Declercq J, Kumar A, Van Diepen JA, Vroegrijk IO, Gysemans C, Di Pietro C, et al. Increased beta-cell mass by islet transplantation and plag1 overexpression causes hyperinsulinemic normoglycemia and hepatic insulin resistance in mice. Diabetes. (2010) 59(8):1957–65. doi: 10.2337/db09-1446
45. Kurella M, Lo JC, Chertow GM. Metabolic syndrome and the risk for chronic kidney disease among nondiabetic adults. J Of Am Soc Of Nephrol JASN. (2005) 16:2134–40. doi: 10.1681/ASN.2005010106
46. Nestler JE, Barlascini CO, Tetrault GA, Fratkin MJ, Clore JN, Blackard WG. Increased transcapillary escape rate of albumin in nondiabetic men in response to hyperinsulinemia. Diabetes. (1990) 39(10):1212–7. doi: 10.2337/diab.39.10.1212
47. Nymark M, Pussinen PJ, Tuomainen AM, Forsblom C, Groop PH, Lehto M. Serum lipopolysaccharide activity is associated with the progression of kidney disease in finnish patients with type 1 diabetes. Diabetes Care. (2009) 32(9):1689–93. doi: 10.2337/dc09-0467
48. Wanigasuriya KP, Peiris-John RJ, Wickremasinghe R. Chronic kidney disease of unknown aetiology in Sri Lanka: is cadmium A likely cause? BMC Nephrol. (2011) 12:32. doi: 10.1186/1471-2369-12-32
49. Chen F, Yang W, Weng J, Jia W, Ji L, Xiao J, et al. Albuminuria: prevalence, associated risk factors and relationship with cardiovascular disease. J Diabetes Invest. (2014) 5(4):464–71. doi: 10.1111/jdi.12172
50. Suzuki K, Konta T, Kudo K, Sato H, Ikeda A, Ichikawa K, et al. The association between serum uric acid and renal damage in A community-based population: the takahata study. Clin Exp Nephrol. (2013) 17(4):541–8. doi: 10.1007/s10157-012-0743-y
51. Lai YJ, Chen YY, Lin YK, Chen CC, Yen YF, Deng CY. Alcohol consumption and risk of chronic kidney disease: A nationwide observational cohort study. Nutrients. (2019) 11(9). doi: 10.3390/nu11092121
Keywords: fasting blood glucose, urinary albumin-to-creatinine ratio, albuminuria, NHANES, U-shaped relationship
Citation: Song J, Wang P and Li H (2024) U-shaped relationship between fasting blood glucose and urinary albumin-to-creatinine ratio in the general United States population. Front. Endocrinol. 15:1334949. doi: 10.3389/fendo.2024.1334949
Received: 08 November 2023; Accepted: 27 February 2024;
Published: 15 March 2024.
Edited by:
Åke Sjöholm, Gävle Hospital, SwedenReviewed by:
Naoko Nakanishi, Kyoto Prefectural University of Medicine, JapanLuis Miguel Ruilope, University Hospital, Spain
Copyright © 2024 Song, Wang and Li. This is an open-access article distributed under the terms of the Creative Commons Attribution License (CC BY). The use, distribution or reproduction in other forums is permitted, provided the original author(s) and the copyright owner(s) are credited and that the original publication in this journal is cited, in accordance with accepted academic practice. No use, distribution or reproduction is permitted which does not comply with these terms.
*Correspondence: Hong Li, hongli12252023@163.com