 Assunta Ingannato1
 Silvia Bagnoli1
 Salvatore Mazzeo2,3,4
 Giulia Giacomucci2
 Valentina Bessi2
 Camilla Ferrari1
 Sandro Sorbi1,5
 Benedetta Nacmias1,5*
- 1Department of Neuroscience, Psychology, Drug Research and Child Health, University of Florence, Florence, Italy
- 2Research and Innovation Centre for Dementia-CRIDEM, Azienda Ospedaliero-Universitaria Careggi, Florence, Italy
- 3Vita-Salute San Raffaele University, Milan, Italy
- 4Istituti di Ricovero e Cura a Carattere Scientifico (IRCCS) Policlinico San Donato, San Donato Milanese, Italy
- 5Istituti di Ricovero e Cura a Carattere Scientifico (IRCCS) Fondazione Don Carlo Gnocchi, Florence, Italy
Background: Plasma biomarkers are preferable to invasive and expensive diagnostic tools, such as neuroimaging and lumbar puncture that are gold standard in the clinical management of Alzheimer’s Disease (AD). Here, we investigated plasma Glial Fibrillary Acidic Protein (GFAP), Neurofilament Light Chain (NfL) and Phosphorylated-tau-181 (pTau 181) in AD and in its early stages: Subjective cognitive decline (SCD) and Mild cognitive impairment (MCI).
Material and methods: This study included 152 patients (42 SCD, 74 MCI and 36 AD). All patients underwent comprehensive clinical and neurological assessment. Blood samples were collected for Apolipoprotein E (APOE) genotyping and plasma biomarker (GFAP, NfL, and pTau 181) measurements. Forty-three patients (7 SCD, 27 MCI, and 9 AD) underwent a follow-up (FU) visit after 2 years, and a second plasma sample was collected. Plasma biomarker levels were detected using the Simoa SR-X technology (Quanterix Corp.). Statistical analysis was performed using SPSS software version 28 (IBM SPSS Statistics). Statistical significance was set at p < 0.05.
Results: GFAP, NfL and pTau 181 levels in plasma were lower in SCD and MCI than in AD patients. In particular, plasma GFAP levels were statistically significant different between SCD and AD (p=0.003), and between MCI and AD (p=0.032). Plasma NfL was different in SCD vs MCI (p=0.026), SCD vs AD (p<0.001), SCD vs AD FU (p<0.001), SCD FU vs AD (p=0.033), SCD FU vs AD FU (p=0.011), MCI vs AD (p=0.002), MCI FU vs AD (p=0.003), MCI FU vs AD FU (p=0.003) and MCI vs AD FU (p=0.003). Plasma pTau 181 concentration was significantly different between SCD and AD (p=0.001), MCI and AD (p=0.026), MCI FU and AD (p=0.020). In APOE ϵ4 carriers, a statistically significant increase in plasma NfL (p<0.001) and pTau 181 levels was found (p=0.014). Moreover, an association emerged between age at disease onset and plasma GFAP (p = 0.021) and pTau181 (p < 0.001) levels.
Discussion and conclusions: Plasma GFAP, NfL and pTau 181 are promising biomarkers in the diagnosis of the prodromic stages and prognosis of dementia.
1 Introduction
Alzheimer’s Disease (AD) is a neurodegenerative disorder and the most common form of dementia worldwide (1). The hallmark of AD is the deposition of Amyloid Beta (Aβ) plaques and neurofibrillary tangles (NFT) in neurons due to the hyperphosphorylation of tau protein, that leads to a growing neuronal death with a consequent gradual cognitive decline and impaired activities of daily life (2). A long prodromic phase, before first symptoms of dementia appear, was identified, characterized by two different and progressive stages: Subjective Cognitive Decline (SCD) and Mild Cognitive Impairment (MCI). According to the National Institute of Aging-Alzheimer’s Association (NIA-AA), SCD is the first manifestation of AD, defined as a self-perception of decline in memory and/or other cognitive abilities compared to the subject’s previously normal level of performance without any objective neuropsychological deficits (3, 4). MCI is a predementia stage with a presentation of cognitive impairment on standardized tests (4, 5). The currently recognized disease biomarkers of AD, such as PET neuroimaging or CSF biomarkers, are expensive and invasive techniques and are requested only when pathological changes are considerable. Biomarkers analyzed on blood sample are desirable as easily accessible and non-invasive tools. Plasma biomarkers are promising candidates for the early diagnosis of AD, tied to the biological β Amyloid (A) deposition, pathologic Tau (T), and Neurodegeneration (N) [ATN] framework (4, 6–8). Recently, plasma glial fibrillary acidic protein (GFAP), an intermediate filament protein of astrocytes, has been demonstrated to be associated with brain amyloid status and the development of clinical AD and cognitive decline (9, 10). Plasma neurofilament light chain (NfL), a cytoplasmic protein, is a marker of neurodegeneration associated with cognitive decline, brain atrophy, and hypometabolism (11–13). Plasma phosphorylated-tau (pTau) 181 was found to reflect tau pathological changes and was associated with tau positivity on positron emission tomography (PET) (14, 15). Moreover, clinical studies reported that plasmatic concentrations of GFAP, NfL and pTau 181 were correlated with the concentrations of the same biomarkers in the CSF, being increased in AD patients compared to Healthy Controls (HC) (16). Unfortunately, nowadays, plasma biomarkers, taken individually, are not sufficient to predict and/or make a defined diagnosis of AD. In addition, few studies have investigated the roles of plasma GFAP, NfL, and pTau 181 in the early stages of AD (17, 18).
Here, we evaluated the role of plasma GFAP, NfL, and pTau 181, combined together, as biomarkers for the early diagnosis of AD and for the assessment of progression to dementia.
2 Materials and methods
2.1 Patients
A total of 152 patients were consecutively recruited at the Neurology Unit of Careggi Hospital in Florence from September 2018 to May 2023. At first visit, all patients underwent a comprehensive clinical and neurological assessment. Forty-two patients received a clinical diagnosis of SCD (19), 74 of MCI (20) and 36 of AD (21). A blood sample for plasma and genetic analysis was collected at baseline for all patients, and a second plasma sample was isolated at follow-up visit, after two years, for 43 patients. During the first visit, a lumbar puncture was performed for CSF collection to analyze Aβ42, Aβ42/Aβ40, total‐tau (t‐tau) and p‐tau biomarkers. CSF samples were collected from 32 SCD patients, 66 MCI patients, and 34 AD patients. After collection, the CSF sample was immediately centrifuged and stored at −80 °C until testing. CSF biomarkers were measured using a chemiluminescent enzyme immunoassay (CLEIA) analyzer LUMIPULSE G600 (Fujirebio, Tokyo, Japan). Cut-off values for CSF were determined by following Fujirebio guidelines and normal values were: Aβ42> 670 pg/mL, Aβ42/Aβ40 ratio > 0.062, t‐tau < 400 pg/mL and p‐tau < 60 pg/mL (22).
According to the ATN system (4) and considering only the CSF analysis, we classified patients as: A+ = CSF amyloid biomarkers (Aβ42, Aβ42/Aβ40) lower than the cut-off values; A- = normal values of CSF amyloid biomarkers; T+ = CSF p-tau higher than the cut-off value; T- = CSF p-tau lower than the cut-off value; N+ = CSF t-tau higher than the cut-off value; N- = normal value of CSF t-tau. Therefore, we considered as “CSF +”, all the patients that had the following biomarker profiles: A+/T+/N+, A+/T-/N-, A+/T-/N+ and A-/T+/N+. In the other cases, patients were classified as “CSF –”.
Progression to MCI and AD was established according to the NIA‐AA criteria (20, 21). Age at baseline was the age at the time of plasma collection. A positive family history was defined as one or more first degree relatives with documented cognitive decline. The study protocol was approved by the local ethics committee and conducted in accordance with the provisions of the Helsinki Declaration.
2.2 Plasma analysis
Plasma was isolated from peripheral blood sample within 2 hours from collection. Blood sample was centrifuged at 4° at 1300 rcf for 10 minutes. The supernatant was immediately collected and stored at -80° until tested. Plasma analysis was performed on the automated Single molecule assay (Simoa) SR-X platform (Quanterix corp.). For GFAP and NfL measurement, the Simoa Human Neurology 2-Plex B assay (N2PB) (Item 103520) was used. The assay range of GFAP was 0 - ~40000 pg/mL, instead of NfL was 0 - ~2000 pg/mL. The N2PB kit analytical Lower Limit of Quantification (LLOQ) was for GFAP 4.15 pg/mL (pooled CV 16%, mean recovery 101%; Functional LLOQ = 16.6 pg/mL) and for NfL 0.400 pg/mL (pooled CV 18%, mean recovery 101%; Functional LLOQ = 1.60 pg/mL). The N2PB kit Limit of Detection (LOD) was 0.410 pg/mL (range 0.133-0.740 pg/mL) for GFAP and 0.071 pg/mL (range 0.012-0.149 pg/mL) for NfL measurements. Quality controls (1= low protein level, 2= high protein level) were included in the run (GFAP control 1= 94.8 pg/mL, control 2= 12701 pg/mL; NfL control 1= 4.21 pg/mL, control 2= 556 pg/mL). pTau 181 was detected using the Simoa® pTau-181 Advantage V2.1 Kit (Item 104111). The Analytical LLOQ of the pTau 181 kit was 2.23 pg/mL (pooled CV 19.0%, mean recovery 97.0%; Functional LLOQ =8.92 pg/mL), instead the LOD was 1.04 pg/mL (range 0.146-1.750 pg/mL). pTau 181 quality controls were: control 1= 50.5 pg/mL, control 2= 530 pg/mL. The N2PB and pTau 181 kit analysis in all samples were performed in a single run basis, respectively. All plasma samples were diluted to 1:4. A reference calibration curve was established using serially diluted calibrators, provided by Quanterix. Plasma samples, calibrators, and controls were run in duplicate.
2.3 Apolipoprotein E genotyping
Genomic DNA was isolated from peripheral blood samples with the QIAamp DNA blood mini QIAcube Kit (Qiagen, Germany), using the automatized extractor Qiacube, provided by Qiagen Corp, following the manufacturer protocol. DNA amount and quality was checked with the QIAxpert spectrophotometer (Qiagen, Germany). APOE genotypes were investigated using two sets of PCR primers designed to amplify the regions encompassing rs7412 [NC_000019.9:g.45412079C > T] and rs429358 (NC_000019.9:g.45411941T > C) and PCR products were analyzed by the high-resolution melting analysis (HRMA) (23). Control samples with known APOE genotypes, validated by DNA sequencing, were used as standard references.
2.4 Statistical analysis
Statistical analysis was performed using SPSS software version 28 (IBM SPSS Statistics). Continuous variables were correlated using Pearson’s correlation analysis. Shapiro–Wilk test was used to test the normal distribution of data. To analyze differences between groups, we used independent-samples t-test, Mann-Whitney U test, and Kruskal Wallis test and ANOVA test for differences between more than two groups. Welch t-test was performed when the assumption of homogeneity of variances was violated. To test whether the difference between two proportions is statistically significant we used Fisher's exact test. p < .05 was set as significant. Continuous variables were reported as mean ± standard deviation. Allele frequency of APOE ϵ4 was determined by counting and calculating sample proportions.
3 Results
Clinical and demographic data of 152 patients (42 SCD, 74 MCI and 36 AD) are shown in Table 1. A difference was present between groups in mean age at disease onset (SCD vs MCI, β=-3.396, p<0.001; SCD vs AD, β=-3.486, p<0.001; not between MCI vs AD; p=0.344), with a later onset in AD patients (67.22 ± 6.536; mean ± SD) compared to MCI (65.47 ± 8.124) and SCD (59.38 ± 8.403). A statistically significant difference in APOE ϵ4 allele distribution was found between groups (MCI vs AD β=-2.442 p=0.015; SCD vs AD β=-3.163 p=0.002, not between SCD vs MCI, p=0.214), as AD patients showed a higher ϵ4 allele percentage (33.3%) than MCI (23.6%) and SCD (15.4%).
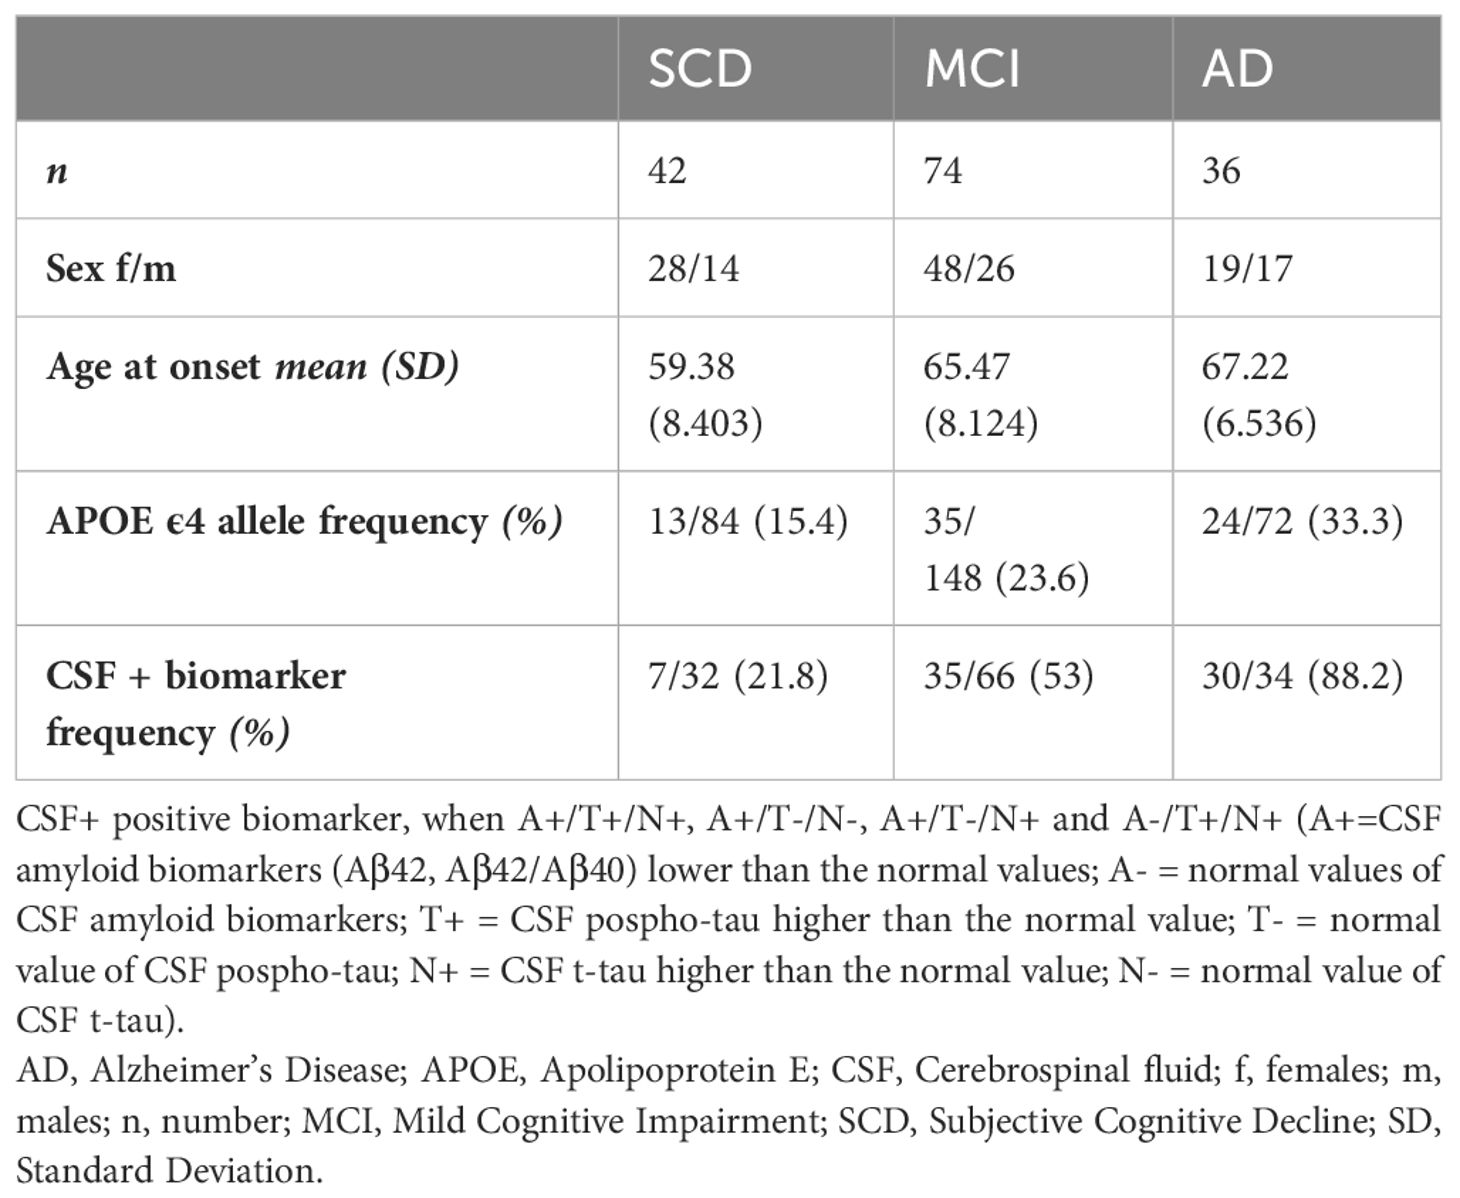
Table 1 Clinical and demographic data of 152 studied patients.
Follow-up (FU) plasma samples were available for 43 patients: 7 SCD, 27 MCI and 9 AD. Plasma NfL measurement was executed both on 152 plasma samples collected during the first visit and on the 43 FU samples. Instead, GFAP and pTau 181 were analyzed, at a later time, on aliquots of plasma samples of the first visit still available: GFAP was measured in 42 plasma samples (5 SCD, 25 MCI, 12 AD); pTau 181 was measured in 81 plasma samples (25 SCD, 39 MCI, 17 AD). Data analysis of plasma measurements of GFAP, NfL and pTau 181 are shown in Figure 1. GFAP levels in plasma samples were significantly different between SCD and AD (β=-3.379, p<0.001) and between MCI and AD (β= -2.314, p=0.021), but not between SCD and MCI (p=0.054). AD patients showed an increased GFAP concentration in plasma (391.10 ± 245.90) with respect to MCI (219.21 ± 103.10) and SCD (128.31 ± 63.67) (Figure 1A). Statistical differences in plasma NfL levels between each group are shown in Table 2. In particular, SCD had lower NfL levels (14.69 ± 6.07) compared to other groups: SCD FU (17.05 ± 9.02), MCI (18.51 ± 9.80), MCI FU (17.06 ± 7.02), AD (27.61 ± 25.09) and AD FU (33.41 ± 16.88) (Figure 1B). A statistically significant linear relationship emerged between diagnosis and mean of NfL concentration (F(1,193)= 21.635, p<0.001, R2 = 0.102). Plasma pTau 181 concentrations were significantly different between SCD and AD (β= -3.320, p<0.001) and between MCI and AD (β=-2.914, p=0.004). In fact, AD had higher pTau 181 levels (3.81 ± 1.44) than MCI (2.69 ± 1.27) and SCD patients (2.17 ± 1.02) (Figure 1C).
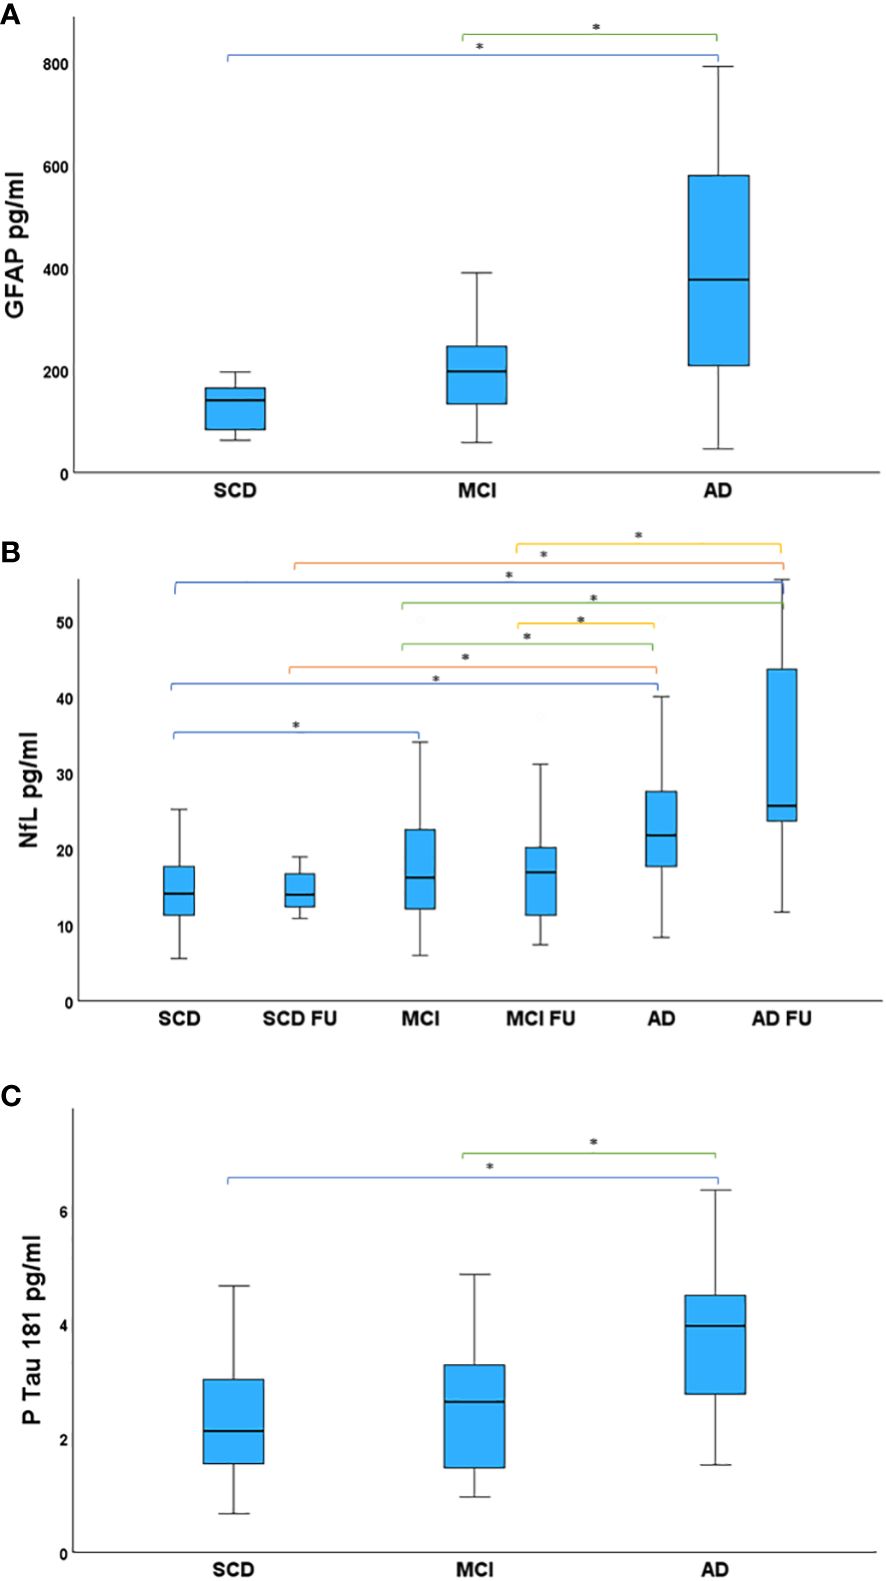
Figure 1 Study patients, divided in groups, compared for mean plasma biomarker levels. (A) Mean GFAP levels in the studied groups. AD showed higher GFAP levels than MCI and SCD. (B) Mean NfL levels in the studied groups. NfL levels were highest in AD FU. AD had higher NfL concentration in plasma than SCD, SCD FU, MCI, MCI FU. NfL in MCI were increased with respect to SCD. (C) Mean pTau 181 levels in the studied groups. Statistical significance accepted at the p < .05, highlighted with asterisk. AD had increased pTau 181 concentration compared to MCI and SCD. AD, Alzheimer’s Disease; FU, Follow-Up; GFAP, Glial Fibrillary Acidic Protein; MCI, Mild Cognitive Impairment; NfL, Neurofilament Light Chain; pTau 181, phosphorylated Tau 181; SCD, Subjective Cognitive Decline.
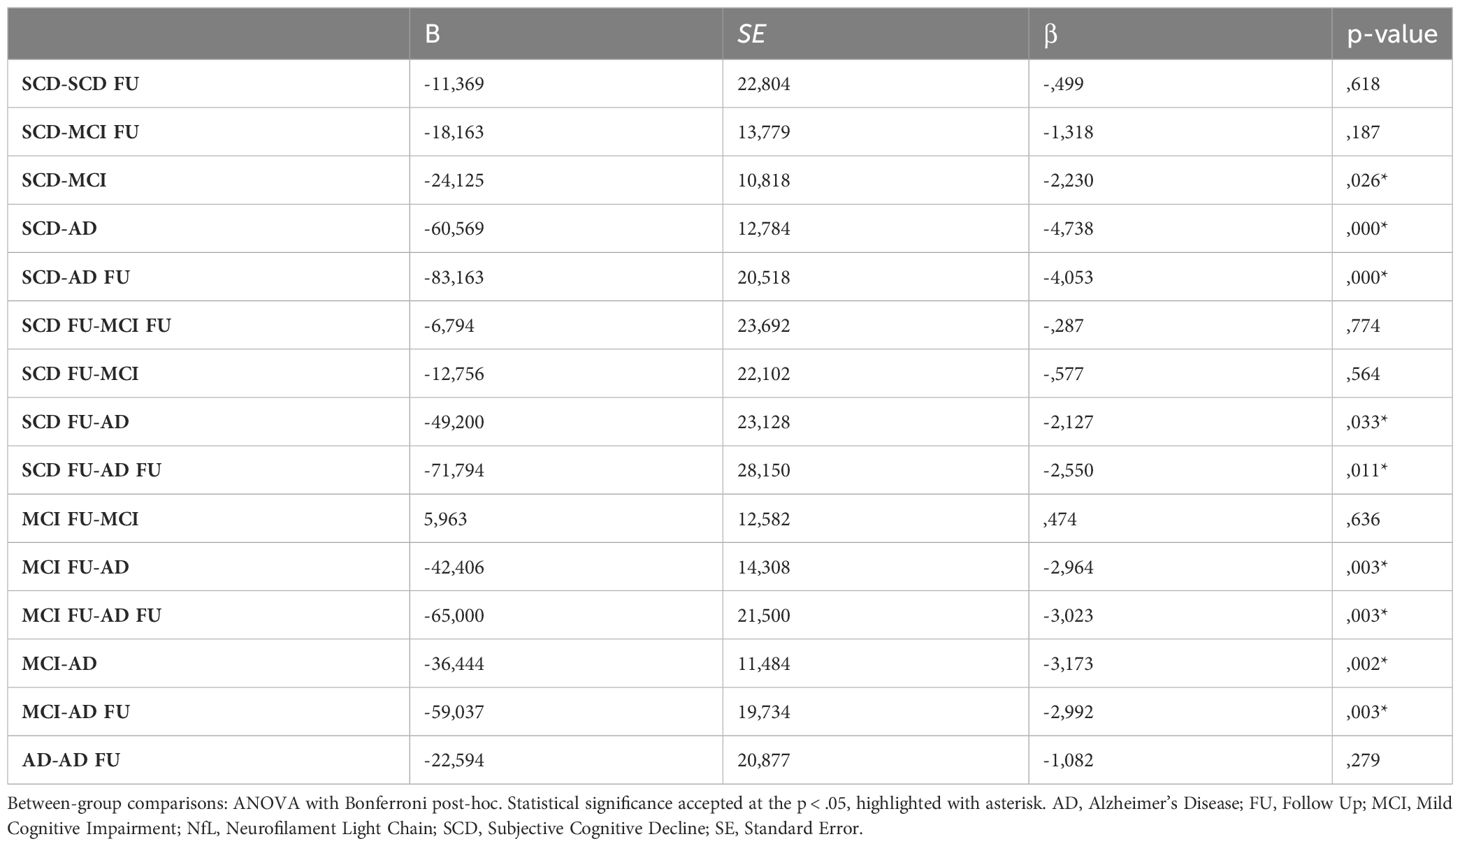
Table 2 Pairwise comparisons of plasma NfL levels between groups.
A statistically significant positive association was found between APOE ϵ4 carriers and NfL levels (β=11.132, p<0.001), and between APOE ϵ4 carriers and pTau 181 levels (β=6.040, p=0.014). APOE ϵ4 carriers had higher NfL (23.11±19.16) and pTau181 levels (3.10 ±1.20) than non-carriers (NfL=16.89±7.62; pTau 181=2.51±1.32). No differences emerged in biomarker levels between APOE ϵ4 homozygous and heterozygous carriers. Moreover, a positive correlation emerged between age at disease onset and plasma GFAP (β = 0.372, p = 0.021) and pTau 181 (β = 0.439, p < 0.001) levels.
Patients with a higher age at disease onset had increased plasma levels of GFAP and pTau 181.
CSF analysis was performed in 132 patients (32 SCD, 66 MCI, and 34 AD), and a statistically significant association between CSF+ biomarkers and diagnosis was found (β=27.762, p<0.001). AD patients had a higher frequency (88.2%) of CSF+ biomarkers than MCI (53%) and SCD (21.8%) patients. A comparison between patients with CSF+ biomarkers and patients with negative CSF biomarkers highlighted a significant difference in mean age at disease onset (67 ± 5.93 vs 60.98 ± 9.33 years, 95%CI 2.977-9.061, p<0.001), in mean GFAP levels (350.08 ± 194.19 vs 158.75±88.43 pg/ml, 95%CI 89.63-293.01, p<0.001), in mean NfL levels (24.86 ± 19.91 vs 14.34 ± 5.26, 95%CI 5.27-15.75, p<0.001), in mean pTau 181 levels (3.66 ±1.25 vs 2.02 ± 0.87, 95%CI 1.11-2.15, p<0.001). No difference in APOE ϵ4 frequency between the two groups was found.
4 Discussion
The aim of our study was to investigate plasma biomarkers in a cohort of patients with different stage of cognitive decline and to evaluate if they could represent a diagnostic tool. In particular, we evaluated GFAP, NfL and pTau 181 in AD and in its preclinical stages (SCD and MCI). Our results showed that these plasma biomarkers were able to distinguish the different phases of the disease. Increasing plasma biomarker levels correlated to the progress and stage of the disease. In fact, AD patients had higher plasma levels of GFAP, NfL and pTau 181 with respect to MCI, and with respect to SCD that had lowest concentrations. Patients with CSF + biomarkers for AD pathology exhibited increased levels of plasma biomarkers. A greater age at disease onset correlated with a higher plasma concentration of GFAP and pTau 181. These results provide evidence that plasma biomarkers can detect advancing AD-associated biologic changes, discriminating all the stages of AD continuum and predicting cognitive decline. For these reasons, GFAP, NfL and pTau 181 can be useful tools to support clinical diagnosis.
Moreover, we tested thepower of plasma NfL in relation to the progression of the disease. A FU plasma sample was available for a subgroup of patients and data highlighted the capability of NfL to assess the longitudinal changes along the AD continuum. There was a linear association between the dementia stage and mean NfL levels. In fact, SCD showed the lowest NfL levels while AD FU showed the highest value of this biomarker. This study extended and confirmed our previous results, where we speculated that plasma NfL can predict the underlying AD pathology (24–26). Our previous data showed that patients who progressed through the dementia stages had higher plasma NfL levels than non-progressive patients. Moreover, we identified plasma NfL cut-off values of 19.45 pg/mL for SCD and 20.45 pg/mL for MCI (25). Our results were in line with literature data (27–29). Simrén and colleagues established the plasma NfL reference limit value at 20 pg/mL for the neurologically healthy individuals (29). Furthermore, studies conducted on AD mutation carriers reported that plasma NfL can predict AD 16 years before symptom manifestation, increasing in the transition from the preclinical to clinical phase (30, 31).
Our findings corroborate data from previous studies that reported elevated plasma GFAP, NfL and pTau181 in preclinical AD, prodromal AD, and AD (7–9, 15, 32–39). Taking into consideration all the plasma biomarkers together, they can provide a plasma profile of dementia to aid clinical assessment and identify different clinical phenotypes. Plasma-based biomarkers are a better choice because of their simple, easily accessible, repeatable, and inexpensive characteristics. More importantly, the possibility of recognizing the preclinical phase is fundamental for clinical decision-making and more efficient management of the patient (40, 41). The goal of early diagnosis is linked to the early therapeutic strategy (42, 43).
In addition, our studied patients carrying the genetic AD risk factor, ϵ4 allele of APOE, had higher NfL and pTau 181 levels than non-carriers. Since 2004 studies have suggested that APOE genotype modulates NFT development and Aβ metabolism (44, 45). APOE ϵ4 allele is thought to be involved in Aβ and neuritic plaque accumulation, affecting Aβ clearance (46–48). In vivo experiments on AD transgenic mouse models showed differences in Aβ deposition in an ApoE isoform-dependent manner: mice ApoE ϵ4-expressing had more than 10-fold fibrillar deposits compared to ApoE ϵ3 and ApoE ϵ2 mice (46, 49). Both in vitro and animal experiments suggest that ApoE ϵ4 promote NFT inclusions, inducing the activation of glycogen synthase kinase (GSK) 3β, an enzyme responsible for the tau hyperphosphorylation (50–52). Thus, plasma NfL and pTau 181, combined with APOE genotype, may help to identify individuals at increased risk of dementia.
This study has several limitations: i) The number of patients was relatively small. ii) A control group was not present to verify that levels of plasma biomarkers in healthy individuals are lower than in preclinical stages, thus all plasma biomarker levels were compared to literature data. iii) The plasma GFAP and pTau 181 data were limited with respect to the total sample size as plasma aliquots were not available for all. iv) A FU plasma sample was available only for a subgroup of patients (43) and a longitudinal study was possible only for NfL, the first peripheral protein evaluated by our team.
On the other hand, all samples were collected prospectively, processed and stored using the same standardized method and measurements of plasma biomarkers were done in a single batch, ensuring good reproducibility. Moreover, few studies have investigated the combination of GFAP, NfL, and pTau 181 in the preclinical stage of dementia (17, 18).
In conclusion, our study provides evidence for the potential use of plasma biomarkers in the diagnosis and prognosis of preclinical stages of dementia. Plasma GFAP, NfL and pTau 181 can distinguish all phases along the AD continuum. Their levels increase mirroring the progression of the neurodegeneration. The measurement of peripheral proteins through a simple and non-invasive blood sample is desirable for clinical routine and for patient management. Moreover, in future we will extend data analysis on GFAP and pTau 181 in all the samples in order to confirm our findings.
Data availability statement
The original contributions presented in the study are included in the article/supplementary materials, further inquiries can be directed to the corresponding author/s.
Ethics statement
The studies involving humans were approved by the local ethics committee and conducted in accordance with the provisions of the Helsinki Declaration. The studies were conducted in accordance with the local legislation and institutional requirements. The participants provided their written informed consent to participate in this study.
Author contributions
AI: Writing – review & editing, Writing – original draft. SB: Writing – review & editing. SM: Writing – review & editing. GG: Writing – review & editing. VB: Writing – review & editing. CF: Writing – review & editing. SS: Writing – review & editing. BN: Writing – review & editing.
Funding
The author(s) declare that financial support was received for the research, authorship, and/or publication of this article. The study was supported by Tuscany Region (GRANT n◦ 20RSVB—PREVIEW: PRedicting the EVolution of SubjectIvE Cognitive Decline to Alzheimer’s Disease With machine learning), by RICATEN23 (BN, Ateneo Università di Firenze, fondi Ateneo 2023) and by the European Union – Next Generation EU, in the context of The National Recovery and Resilience Plan, Investment Partenariato Esteso PE8 – Project Age-It: “Ageing Well in an Ageing Society” CUP B83C22004800006.
Conflict of interest
The authors declare that the research was conducted in the absence of any commercial or financial relationships that could be construed as a potential conflict of interest.
Publisher’s note
All claims expressed in this article are solely those of the authors and do not necessarily represent those of their affiliated organizations, or those of the publisher, the editors and the reviewers. Any product that may be evaluated in this article, or claim that may be made by its manufacturer, is not guaranteed or endorsed by the publisher.
References
1. Scheltens P, Blennow K, Breteler MM, de Strooper B, Frisoni GB, Salloway S, et al. Alzheimer's disease. Lancet. (2016) 388:505–17. doi: 10.1016/S0140-6736(15)01124-1
2. Liu PP, Xie Y, Meng XY, Kang JS. History and progress of hypotheses and clinical trials for Alzheimer's disease. Signal Transduct Target Ther. (2019) 4:29. doi: 10.1038/s41392-019-0063-8
3. Rabin LA, Smart CM, Amariglio RE. Subjective cognitive decline in preclinical Alzheimer's disease. Annu Rev Clin Psychol. (2017) 13:369–96. doi: 10.1146/annurev-clinpsy-032816-045136
4. Jack CR Jr, Bennett DA, Blennow K, Carrillo MC, Dunn B, Haeberlein SB, et al. NIA-AA Research Framework: Toward a biological definition of Alzheimer's disease. Alzheimers Dement. (2018) 14:535–62. doi: 10.1016/j.jalz.2018.02.018
5. Sanford AM. Mild cognitive impairment. Clin Geriatr Med. (2017) 33:325–37. doi: 10.1016/j.cger.2017.02.005
6. Mandal PK, Maroon JC, Garg A, Arora NK, Bansal R, Kaushik A, et al. Blood biomarkers in Alzheimer's disease. ACS Chem Neurosci. (2023) 14(22):3975–8. doi: 10.1021/acschemneuro.3c00641
7. Nallapu BT, Petersen KK, Lipton RB, Davatzikos C, Ezzati A. Alzheimer’s disease neuroimaging initiative. Plasma biomarkers as predictors of progression to dementia in individuals with mild cognitive impairment. . J Alzheimers Dis. (2024) 98:231–46. doi: 10.3233/JAD-230620
8. Twait EL, Gerritsen L, Moonen JEF, Verberk IMW, Teunissen CE, Visser PJ, et al. Plasma markers of Alzheimer's disease pathology, neuronal injury, and astrocytic activation and MRI load of vascular pathology and neurodegeneration: the SMART-MR study. . J Am Heart Assoc. (2024) 13:e032134. doi: 10.1161/JAHA.123.032134
9. Pereira JB, Janelidze S, Smith R, Mattsson-Carlgren N, Palmqvist S, Teunissen CE, et al. Plasma GFAP is an early marker of amyloid-β but not tau pathology in Alzheimer's disease. Brain. (2021) 144:3505–16. doi: 10.1093/brain/awab223
10. Varma VR, An Y, Kac PR, Bilgel M, Moghekar A, Loeffler T, et al. Longitudinal progression of blood biomarkers reveals a key role of astrocyte reactivity in preclinical Alzheimer's disease. medRxiv [Preprint]. (2024) 26:2024. doi: 10.1101/2024.01.25.24301779
11. Mattsson N, Cullen NC, Andreasson U, Zetterberg H, Blennow K. Association between longitudinal plasma neurofilament light and neurodegeneration in patients with Alzheimer disease. JAMA Neurol. (2019) 76:791–9. doi: 10.1001/jamaneurol.2019.0765
12. Salvioli S, Basile MS, Bencivenga L, Carrino S, Conte M, Damanti S, et al. Biomarkers of aging in frailty and age-associated disorders: State of the art and future perspective. Ageing Res Rev. (2023) 91:102044. doi: 10.1016/j.arr.2023.102044
13. Shim YS. Follow-up comparisons of two plasma biomarkers of Alzheimer's disease, neurofilament light chain, and oligomeric Aβ: A pilot study. Curr Alzheimer Res. (2024). doi: 10.2174/0115672050284054240119101834
14. Mielke MM, Hagen CE, Xu J, Chai X, Vemuri P, Lowe VJ, et al. Plasma phospho-tau181 increases with Alzheimer's disease clinical severity and is associated with tau- and amyloid-positron emission tomography. Alzheimers Dement. (2018) 14:989–97. doi: 10.1016/j.jalz.2018.02.013
15. Li Z, Fan Z, Zhang Q. The associations of phosphorylated tau 181 and tau 231 levels in plasma and cerebrospinal fluid with cognitive function in Alzheimer's disease: A systematic review and meta-analysis. J Alzheimers Dis. (2024) 98:13–32. doi: 10.3233/JAD-230799
16. Yang Z, Sreenivasan K, Toledano Strom EN, Osse AML, Pasia LG, Cosme CG, et al. Clinical and biological relevance of glial fibrillary acidic protein in Alzheimer's disease. Alzheimers Res Ther. (2023) 15:190. doi: 10.1186/s13195-023-01340-4
17. Chatterjee P, Pedrini S, Doecke JD, Thota R, Villemagne VL, Doré V, et al. Plasma Aβ42/40 ratio, p-tau181, GFAP, and NfL across the Alzheimer's disease continuum: A cross-sectional and longitudinal study in the AIBL cohort. Alzheimers Dement. (2023) 19:1117–34. doi: 10.1002/alz.12724
18. Dubois B, von Arnim CAF, Burnie N, Bozeat S, Cummings J. Biomarkers in Alzheimer's disease: role in early and differential diagnosis and recognition of atypical variants. Alzheimers Res Ther. (2023) 15:175. doi: 10.1186/s13195-023-01314-6
19. Jessen F, Amariglio RE, van Boxtel M, Breteler M, Ceccaldi M, Chételat G, et al. Subjective Cognitive Decline Initiative (SCD-I) Working Group. A conceptual framework for research on subjective cognitive decline in preclinical Alzheimer's disease. . Alzheimers Dement. (2014) 10:844–52. doi: 10.1016/j.jalz.2014.01.001
20. Albert MS, DeKosky ST, Dickson D, Dubois B, Feldman HH, Fox NC, et al. The diagnosis of mild cognitive impairment due to Alzheimer's disease: recommendations from the National Institute on Aging-Alzheimer's Association workgroups on diagnostic guidelines for Alzheimer's disease. Alzheimers Dement. (2011) 7:270–9. doi: 10.1016/j.jalz.2011.03.008
21. McKhann GM, Knopman DS, Chertkow H, Hyman BT, Jack CR Jr, Kawas CH, et al. The diagnosis of dementia due to Alzheimer's disease: recommendations from the National Institute on Aging-Alzheimer's Association workgroups on diagnostic guidelines for Alzheimer's disease. Alzheimers Dement. (2011) 7:263–9. doi: 10.1016/j.jalz.2011.03.005
22. Alcolea D, Pegueroles J, Muñoz L, Camacho V, López-Mora D, Fernández-León A, et al. Agreement of amyloid PET and CSF biomarkers for Alzheimer's disease on Lumipulse. Ann Clin Transl Neurol. (2019) 6:1815–24. doi: 10.1002/acn3.50873
23. Sorbi S, Nacmias B, Forleo P, Latorraca S, Gobbini I, Bracco L, et al. ApoE allele frequencies in Italian sporadic and familial Alzheimer's disease. Neurosci Lett. (1994) 177:100–2. doi: 10.1016/0304-3940(94)90054-x
24. Giacomucci G, Mazzeo S, Bagnoli S, Ingannato A, Leccese D, Berti V, et al. Plasma neurofilament light chain as a biomarker of Alzheimer's disease in Subjective Cognitive Decline and Mild Cognitive Impairment. J Neurol. (2022) 269:4270–80. doi: 10.1007/s00415-022-11055-5
25. Mazzeo S, Ingannato A, Giacomucci G, Bagnoli S, Cavaliere A, Moschini V, et al. The role of plasma neurofilament light chain and glial fibrillary acidic protein in subjective cognitive decline and mild cognitive impairment. Neurol Sci. (2023) 45(3):1031–9. doi: 10.1007/s10072-023-07065-4
26. Mazzeo S, Ingannato A, Giacomucci G, Manganelli A, Moschini V, Balestrini J, et al. Plasma neurofilament light chain predicts Alzheimer's disease in patients with subjective cognitive decline and mild cognitive impairment: A cross-sectional and longitudinal study. Eur J Neurol. (2024) 31:e16089. doi: 10.1111/ene.16089
27. Preische O, Schultz SA, Apel A, Kuhle J, Kaeser SA, Barro C, et al. Dominantly Inherited Alzheimer Network. Serum neurofilament dynamics predicts neurodegeneration and clinical progression in presymptomatic Alzheimer's disease. Nat Med. (2019) 25:277–83. doi: 10.1038/s41591-018-0304-3
28. de Wolf F, Ghanbari M, Licher S, McRae-McKee K, Gras L, Weverling GJ, et al. Plasma tau, neurofilament light chain and amyloid-β levels and risk of dementia; a population-based cohort study. Brain. (2020) 143:1220–32. doi: 10.1093/brain/awaa054
29. Simrén J, Andreasson U, Gobom J, Suarez Calvet M, Borroni B, Gillberg C, et al. Establishment of reference values for plasma neurofilament light based on healthy individuals aged 5-90 years. Brain Commun. (2022) 4:fcac174. doi: 10.1093/braincomms/fcac174
30. Weston PSJ, Poole T, O'Connor A, Heslegrave A, Ryan NS, Liang Y, et al. Longitudinal measurement of serum neurofilament light in presymptomatic familial Alzheimer's disease. Alzheimers Res Ther. (2019) 11:19. doi: 10.1186/s13195-019-0472-5
31. Gaetani L, Parnetti L, Calabresi P, Di Filippo M. Tracing neurological diseases in the presymptomatic phase: insights from neurofilament light chain. Front Neurosci. (2021) 15:672954. doi: 10.3389/fnins.2021.672954
32. Weston PSJ, Poole T, Ryan NS, Nair A, Liang Y, Macpherson K, et al. Serum neurofilament light in familial Alzheimer disease: A marker of early neurodegeneration. Neurol. (2017) 89:2167–75. doi: 10.1212/WNL.0000000000004667
33. Janelidze S, Mattsson N, Palmqvist S, Smith R, Beach TG, Serrano GE, et al. Plasma P-tau181 in Alzheimer's disease: relationship to other biomarkers, differential diagnosis, neuropathology and longitudinal progression to Alzheimer's dementia. Nat Med. (2020) 26:379–86. doi: 10.1038/s41591-020-0755-1
34. Karikari TK, Pascoal TA, Ashton NJ, Janelidze S, Benedet AL, Rodriguez JL, et al. Blood phosphorylated tau 181 as a biomarker for Alzheimer's disease: a diagnostic performance and prediction modelling study using data from four prospective cohorts. Lancet Neurol. (2020) 19:422–33. doi: 10.1016/S1474-4422(20)30071-5
35. Quiroz YT, Zetterberg H, Reiman EM, Chen Y, Su Y, Fox-Fuller JT, et al. Plasma neurofilament light chain in the presenilin 1 E280A autosomal dominant Alzheimer's disease kindred: a cross-sectional and longitudinal cohort study. Lancet Neurol. (2020) 19:513–21. doi: 10.1016/S1474-4422(20)30137-X
36. Benedet AL, Milà-Alomà M, Vrillon A, Ashton NJ, Pascoal TA, Lussier F, et al. Translational Biomarkers in Aging and Dementia (TRIAD) study, Alzheimer’s and Families (ALFA) study, and BioCogBank Paris Lariboisière cohort. Differences Between Plasma and Cerebrospinal Fluid Glial Fibrillary Acidic Protein Levels Across the Alzheimer Disease Continuum. JAMA Neurol. (2021) 78:1471–83. doi: 10.1001/jamaneurol.2021.3671
37. Chatterjee P, Pedrini S, Stoops E, Goozee K, Villemagne VL, Asih PR, et al. Plasma glial fibrillary acidic protein is elevated in cognitively normal older adults at risk of Alzheimer's disease. Transl Psychiatry. (2021) 11:27. doi: 10.1038/s41398-020-01137-1
38. Xiao Z, Wu X, Wu W, Yi J, Liang X, Ding S, et al. Plasma biomarker profiles and the correlation with cognitive function across the clinical spectrum of Alzheimer's disease. Alzheimers Res Ther. (2021) 13:123. doi: 10.1186/s13195-021-00864-x
39. Chatterjee P, Pedrini S, Ashton NJ, Tegg M, Goozee K, Singh AK, et al. Diagnostic and prognostic plasma biomarkers for preclinical Alzheimer's disease. Alzheimers Dement. (2022) 18:1141–54. doi: 10.1002/alz.12447
40. Panegyres PK, Berry R, Burchell J. Early dementia screening. Diagnostics (Basel). (2016) 6:6. doi: 10.3390/diagnostics6010006
41. Hoffman GJ, Maust DT, Harris M, Ha J, Davis MA. Medicare spending associated with a dementia diagnosis among older adults. J Am Geriatr Soc. (2022) 70:2592–601. doi: 10.1111/jgs.17835
42. Sims JR, Zimmer JA, Evans CD, Lu M, Ardayfio P, Sparks J, et al. TRAILBLAZER-ALZ 2 investigators. Donanemab in early symptomatic Alzheimer disease: the TRAILBLAZER-ALZ 2 randomized clinical trial. . JAMA. (2023) 330:512–27. doi: 10.1001/jama.2023.13239
43. van Dyck CH, Swanson CJ, Aisen P, Bateman RJ, Chen C, Gee M, et al. Lecanemab in early Alzheimer's disease. N Engl J Med. (2023) 388:9–21. doi: 10.1056/NEJMoa2212948
44. Tiraboschi P, Hansen LA, Masliah E, Alford M, Thal LJ, Corey-Bloom J. Impact of APOE genotype on neuropathologic and neurochemical markers of Alzheimer disease. Neurol. (2004) 62:1977–83. doi: 10.1212/01.wnl.0000128091.92139.0f
45. Reiman EM, Chen K, Liu X, Bandy D, Yu M, Lee W, et al. Fibrillar amyloid-beta burden in cognitively normal people at 3 levels of genetic risk for Alzheimer's disease. Proc Natl Acad Sci U S A. (2009) 106:6820–5. doi: 10.1073/pnas.0900345106
46. Holtzman DM, Bales KR, Tenkova T, Fagan AM, Parsadanian M, Sartorius LJ, et al. Apolipoprotein E isoform-dependent amyloid deposition and neuritic degeneration in a mouse model of Alzheimer's disease. Proc Natl Acad Sci U S A. (2000) 97:2892–7. doi: 10.1073/pnas.050004797
47. Fryer JD, Simmons K, Parsadanian M, Bales KR, Paul SM, Sullivan PM, et al. Human apolipoprotein E4 alters the amyloid-beta 40:42 ratio and promotes the formation of cerebral amyloid angiopathy in an amyloid precursor protein transgenic model. J Neurosci. (2005) 25:2803–10. doi: 10.1523/JNEUROSCI.5170-04.2005
48. Castellano JM, Kim J, Stewart FR, Jiang H, DeMattos RB, Patterson BW, et al. Human apoE isoforms differentially regulate brain amyloid-β peptide clearance. Sci Transl Med. (2011) 3:89ra57. doi: 10.1126/scitranslmed.3002156
49. Bales KR, Liu F, Wu S, Lin S, Koger D, DeLong C, et al. Human APOE isoform-dependent effects on brain beta-amyloid levels in PDAPP transgenic mice. J Neurosci. (2009) 29:6771–9. doi: 10.1523/JNEUROSCI.0887-09.2009
50. Huang Y, Liu XQ, Wyss-Coray T, Brecht WJ, Sanan DA, Mahley RW. Apolipoprotein E fragments present in Alzheimer's disease brains induce neurofibrillary tangle-like intracellular inclusions in neurons. Proc Natl Acad Sci U S A. (2001) 98:8838–43. doi: 10.1073/pnas.151254698
51. Cedazo-Mínguez A, Popescu BO, Blanco-Millán JM, Akterin S, Pei JJ, Winblad B, et al. Apolipoprotein E and beta-amyloid (1-42) regulation of glycogen synthase kinase-3beta. J Neurochem. (2003) 87:1152–64. doi: 10.1046/j.1471-4159.2003.02088.x
Keywords: Alzheimer's disease, preclinical stages, plasma biomarkers, glial fibrillary acidic protein, neurofilament light chain, phosphorylated-tau-181
Citation: Ingannato A, Bagnoli S, Mazzeo S, Giacomucci G, Bessi V, Ferrari C, Sorbi S and Nacmias B (2024) Plasma GFAP, NfL and pTau 181 detect preclinical stages of dementia. Front. Endocrinol. 15:1375302. doi: 10.3389/fendo.2024.1375302
Received: 23 January 2024; Accepted: 25 March 2024;
Published: 09 April 2024.
Edited by:
Stefano Salvioli, University of Bologna, ItalyReviewed by:
Davide Chiasserini, University of Perugia, ItalyLicia Iacoviello, Mediterranean Neurological Institute Neuromed (IRCCS), Italy
Copyright © 2024 Ingannato, Bagnoli, Mazzeo, Giacomucci, Bessi, Ferrari, Sorbi and Nacmias. This is an open-access article distributed under the terms of the Creative Commons Attribution License (CC BY). The use, distribution or reproduction in other forums is permitted, provided the original author(s) and the copyright owner(s) are credited and that the original publication in this journal is cited, in accordance with accepted academic practice. No use, distribution or reproduction is permitted which does not comply with these terms.
*Correspondence: Benedetta Nacmias, benedetta.nacmias@unifi.it